 David L. Woods1,2,3,4*
 Timothy J. Herron1
 Anthony D. Cate1
 E. William Yund1
 G. Christopher Stecker1,5
 Teemu Rinne1,6
 X. Kang1,2
- 1 Human Cognitive Neurophysiology Laboratory, VANCHCS, Martinez, CA, USA
- 2 Program in Rehabilitation Neuroscience, Department of Neurology, University of California Davis, Sacramento, CA, USA
- 3 Center for Neurosciences, University of California Davis, Davis, CA, USA
- 4 Center for Mind and Brain, University of California Davis, Davis, CA, USA
- 5 Department of Speech and Hearing Sciences, University of Washington, Seattle, WA, USA
- 6 Institute of Behavioural Science, University of Helsinki, Helsinki, Finland
While auditory cortex in non-human primates has been subdivided into multiple functionally specialized auditory cortical fields (ACFs), the boundaries and functional specialization of human ACFs have not been defined. In the current study, we evaluated whether a widely accepted primate model of auditory cortex could explain regional tuning properties of fMRI activations on the cortical surface to attended and non-attended tones of different frequency, location, and intensity. The limits of auditory cortex were defined by voxels that showed significant activations to non-attended sounds. Three centrally located fields with mirror-symmetric tonotopic organization were identified and assigned to the three core fields of the primate model while surrounding activations were assigned to belt fields following procedures similar to those used in macaque fMRI studies. The functional properties of core, medial belt, and lateral belt field groups were then analyzed. Field groups were distinguished by tonotopic organization, frequency selectivity, intensity sensitivity, contralaterality, binaural enhancement, attentional modulation, and hemispheric asymmetry. In general, core fields showed greater sensitivity to sound properties than did belt fields, while belt fields showed greater attentional modulation than core fields. Significant distinctions in intensity sensitivity and contralaterality were seen between adjacent core fields A1 and R, while multiple differences in tuning properties were evident at boundaries between adjacent core and belt fields. The reliable differences in functional properties between fields and field groups suggest that the basic primate pattern of auditory cortex organization is preserved in humans. A comparison of the sizes of functionally defined ACFs in humans and macaques reveals a significant relative expansion in human lateral belt fields implicated in the processing of speech.
Introduction
In order to understand sound processing in human auditory cortex it is necessary to understand the functional specialization of auditory cortical fields (ACFs), the functional subregions of auditory cortex that analyze different attributes of sounds. Although there is currently no widely accepted model of human ACF organization, there is a widely accepted model of macaque ACF organization (Kaas and Hackett, 2000) that is based on anatomical (Pandya, 1995; Kaas et al., 1999; Kaas and Hackett, 2000) and functional (Rauschecker, 1998; Recanzone and Sutter, 2008; Kusmierek and Rauschecker, 2009) studies. Motivated by well-established homologies in the spatial organization and functional properties of visual cortical fields (VCFs) of humans and macaques (Tootell et al., 1998; Orban et al., 2004), we evaluated whether a model of ACF spatial organization and functional properties developed in macaques could account for the pattern of regional fMRI activations seen in humans.
The influential Kaas and Hackett model of primate auditory cortex proposes three tonotopically organized core fields surrounded by seven (Kaas et al., 1999) or eight (Kaas and Hackett, 2000) belt fields that are specialized to process more complex sound features (Rauschecker and Scott, 2009). fMRI studies of macaques (Petkov et al., 2006, 2009b) and humans (Formisano et al., 2003; Petkov et al., 2004; Talavage et al., 2004; Seifritz et al., 2006; Langers et al., 2007a; Humphries et al., 2010) have revealed a number of similarities in auditory cortex organization: two clearly defined tonotopic regions that are joined at a shared low-frequency responsive region (assigned to core fields A1 and R in the macaque model), as well as a third, less reliable, tonotopic field (assigned to RT in the macaque model) that shares a high-frequency boundary with the adjacent tonotopic field (field R in the macaque).
Petkov et al. (2006) were also able to analyze the response properties of surrounding belt fields in the macaque by extending the boundaries separating core fields to the limits of auditory cortical regions that were activated by sounds. This analysis demonstrated that adjacent core and belt fields shared collinear tonotopic gradients, with belt fields showing relatively greater activation magnitudes to noise bursts than pure tones, as previously reported in neurophysiological studies (Rauschecker and Tian, 2004; Kusmierek and Rauschecker, 2009). In addition, belt fields showed response preferences for more complex and behaviorally relevant sounds such as macaque vocalizations (Petkov et al., 2008) consistent with neurophysiological studies (Rauschecker, 1997; Tian et al., 2001; Bendor and Wang, 2006; Schreiner and Winer, 2007; Recanzone and Sutter, 2008; Rauschecker and Scott, 2009). Human fMRI studies have also shown regional differences in activation patterns associated with the processing of acoustic features such as sound frequency (Bilecen et al., 1998; Schonwiesner et al., 2002; Formisano et al., 2003; Petkov et al., 2004; Talavage et al., 2004; Humphries et al., 2010), intensity (Jancke et al., 1998; Bilecen et al., 2002; Langers et al., 2007b), and location (Jancke et al., 2002; Petkov et al., 2004; Barrett and Hall, 2006; Deouell et al., 2007; Viceic et al., 2009), with have found enhanced responses in lateral auditory cortex to human vocalizations (Belin et al., 2002; Scott, 2008), and behaviorally relevant sounds (Petkov et al., 2004; Barrett and Hall, 2006; Degerman et al., 2006; Viceic et al., 2006; Rinne et al., 2007; Sabri et al., 2008; Woods et al., 2009).
Thus, the spatial organization of tonotopic central fields and the distribution of activations produced by more complex sounds appears to be similar in human and macaque auditory cortex, with both appearing to conform to the Kaas et al. (1999), Kaas and Hackett (2000) model (Woods and Alain, 2009). In the current manuscript, we analyzed how well the macaque model would account for regional fMRI activation patterns observed in fMRI data from a previous study that manipulated sound intensity, sound frequency, sound location and task relevance (Woods et al., 2009). Because macaque studies generally examine the tuning properties of ACFs whereas brain imaging studies generally quantify the magnitude of activations, we first extracted the tuning properties of voxels on the auditory cortical surface of each subject. Population-averaged fMRI tuning maps were then assigned to the ACFs of the macaque model using procedures similar to those used by Petkov et al. (2006) to assign fMRI activations in the macaque to model ACFs. The goal was to evaluate how adequately the primate model accounted for the regional tuning properties of human auditory cortex. Based on the results of primate studies, we made three specific predictions: (1) there would be highly significant differences in the tuning properties of core and both lateral and medial belt (MB) field groups, with smaller differences observed between medial and lateral belt (LB) field groups (Kusmierek and Rauschecker, 2009); (2) core fields would show sharper tuning for the acoustic properties of sounds (frequency, intensity, and spatial location) than belt fields, whereas belt fields would be more strongly modulated by task relevance (Recanzone and Sutter, 2008); (3) there would be fewer significant differences in tuning properties between adjacent fields within the core or belt (e.g., A1 vs. R, or ML vs. AL), than between adjacent core and belt fields (e.g., A1 vs. ML).
Materials and Methods
Subjects
Nine subjects (aged 18–34 years, 8 male, 2 left-handed) each participated in seven separate imaging sessions after providing informed consent in accordance with the Institutional Review Board of the VANCHCS. All subjects had normal or corrected-to-normal vision and normal hearing by self-report.
Stimuli and Tasks
The paradigm is shown in Figure 1. Stimuli were delivered in blocks using a randomized factorial design. Each block was distinguished by (1) Auditory or visual attention; (2) Unimodal (auditory alone) or bimodal (auditory plus visual) stimulation; (3) Tone frequency, with tone patterns centered on 225, 900 or 3600 Hz and varying over a one-half octave range in different blocks; (4) Tone intensity: 70 or 90 dB SPL and (5) Tone location: left ear, binaural, or right ear. In order to enhance the signal/noise of the imaging data, each subject underwent three separate imaging sessions using continuous image acquisition (TR = 2.9 s) and three with sparse image acquisition (TR = 10.6 s). The order of continuous and sparse imaging sessions was counterbalanced across subjects. Functional data sets from sparse and continuous imaging were analyzed separately for each subject with the results pooled in the current analysis.
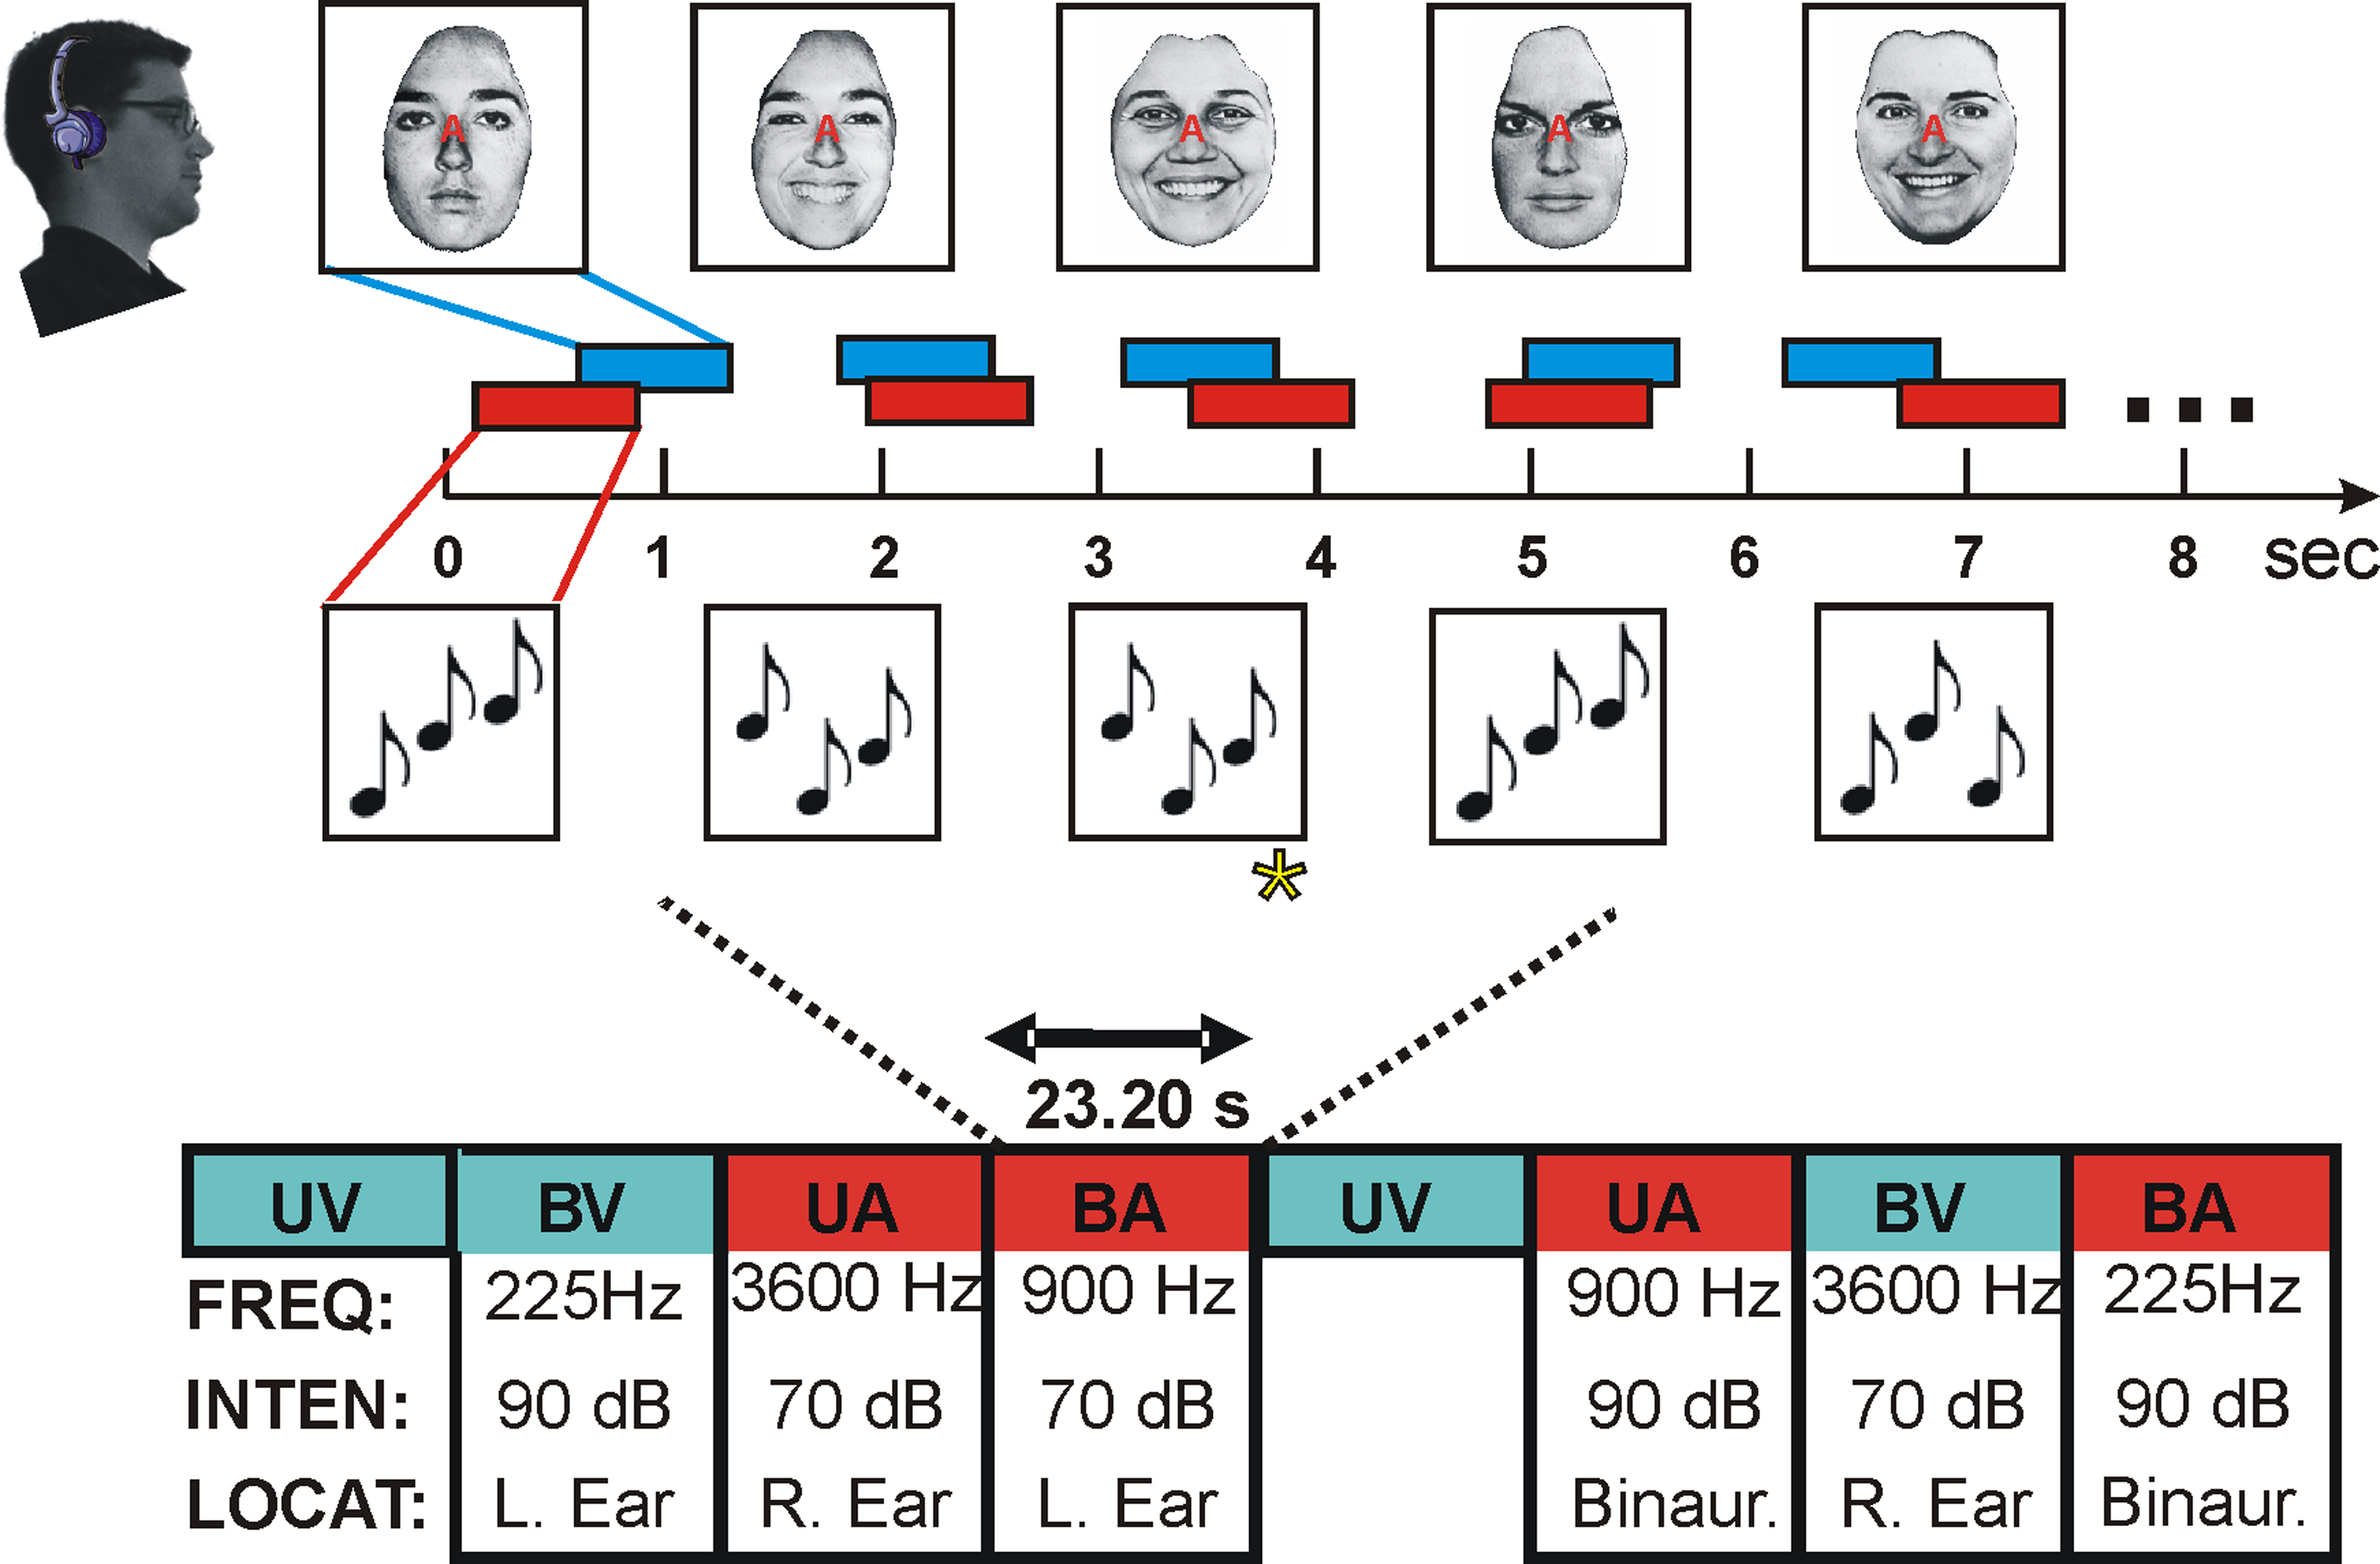
Figure 1. Stimuli were delivered in 23.2 s blocks according to a randomized factorial design with all factors in auditory blocks (bimodal and unimodal blocks, the modality attended, tone frequency, tone intensity, and tone location) varying in random order. UV = unimodal visual, BV = bimodal, visual attention, UA = unimodal auditory, BA = bimodal, auditory attention. Each subject received two counterbalanced sequences of 72 blocks during each of six functional imaging sessions performed on separate days, three with continuous image acquisition (TR = 2.9 s) and three with sparse image acquisition (TR = 10.6 s).
Auditory stimuli were tone patterns of 750 ms duration generated by combining pseudorandomly and exhaustively three different 250 ms tones of different frequency. Individual tone frequencies were separated by 3-semitone steps with the central tone set at 225, 900, or 3600 Hz (low, medium, or high frequencies) in different blocks. Subjects performed a 1-back, pitch-pattern discrimination task, identifying repetitions (probability 10%) of the previous three-tone pattern. In each block, tone intensity was fixed at either 70 or 90 dB SPL A-weighted (“soft” or “loud”) and tones were delivered either to the left ear, right ear, or both ears throughout the block. Factors were counterbalanced following a randomized factorial design. All stimuli were presented over continuous broadband 70 dB SPL (A-weighted) masking noise to reduce the dependence of responses on spectrotemporally complex background sound (e.g., coolant-pump noise).
EPI-related scanner noise was measured with an MRI compatible microphone head and torso system (B and K 2260) and showed an intensity of 105 dB SPL (A-weighted) with a frequency peak at 642 Hz. Scanner noise amplitude was modulated with the acquisition of each axial slice at a frequency of 10 Hz. Pump noise audible during inter-image acquisitions had an intensity of 65 dB SPL (A-weighted) that was dominated by low frequencies. Stimuli were presented through MRI-compatible electrostatic earbuds (Stax MRI-002, Stax Ltd, Saitama prefecture, Japan) that attenuated external noise over the audible frequency range. Further attenuation of ambient sounds was obtained with circumaural ear protectors (Howard Leight LM-77, Howard Leight Industries, San Diego, California, USA) that provided 25 dB of additional attenuation at 4000 Hz, 18 dB at 1000 Hz, 6 dB at 250 Hz. Thus, the overall attenuation of external noise varied from 16 to 35 dB with greater attenuation of external sounds at high frequencies.
Behavioral trials were presented at mean interstimulus intervals of 1.35 and 1.45 s during continuous and sparse imaging, respectively, with 16 trials presented in each block. During bimodal sequences, auditory, and visual stimuli were presented asynchronously with randomized delays between auditory and visual stimuli to minimize crossmodal integration. Visual stimuli were words or faces on separate blocks. In face blocks stimuli were selected from 32 black and white photographs of faces of eight individuals (Ekman, 1992) each with four different emotional expressions. During visual-attention blocks, targets in the face blocks were successive photographs of the same individual with a different emotional expression. In word blocks, stimuli were selected from 40 different words in ten different semantic categories (e.g., cities, plants, animals, etc.). Targets in the word blocks were successive words belonging to the same semantic category. Button-press responses were recorded to measure reaction times and calculate of hit and false alarm rates. Stimulus presentation and response collection were controlled with Presentation software (Version 10.0, NeuroBehavioral Systems, Albany, CA, USA).
Imaging
Each subject underwent 1 h of behavioral training session followed by high-resolution T1 structural brain imaging on a 1.5 T Philips Eclipse scanner (matrix size 256 × 212 × 256, voxel size 0.94 × 1.30 × 0.94 mm, TE 4.47 ms, TR 15 ms, flip angle 35°, field of view 240 × 240 mm). These anatomical images were re-sliced to 1 × 1 × 1 mm3 resolution, and then inflated to the cortical surface using FreeSurfer (Dale et al., 1999; Fischl et al., 1999a). The inflated cortical surfaces of the left and right hemispheres were then co-registered to a common spherical coordinate system (Fischl et al., 1999b) based on a reference template derived from the average pattern of 40 individual subjects. The differences in curvature between the mean spherical maps of the left hemisphere and the reflected right hemisphere were then numerically minimized using surface translation and rotation to create a hemispherically unified anatomically based coordinate system (Woods and Alain, 2009). This resulted in an accurate alignment of the principal gyri, including the superior temporal gyrus (STG) and Heschl’s gyrus (HG), across subjects and hemispheres.
Each subject underwent six 1.2 h sessions of functional imaging using a spin-echo EPI sequence (matrix size 96 × 96 × 29, 29 axial slices 4 mm thick plus 1 mm gap, voxel size 2.5 × 2.5 × 5 mm, TE 39.6 ms, flip angle 90°, FOV 240 × 240 mm in-plane resolution). Head movements were measured using SPM5 (Friston et al., 1996). Small head movements improve the spatial resolution of functional imaging when anatomical space analysis is used (Kang et al., 2007). Anatomical space analysis involves coregistering individual functional images from each subject with their anatomical images and resampling each functional image into high-resolution anatomical space before functional analysis (Kang et al., 2007). Functional image data were high-pass filtered with a cutoff of 0.005 Hz using orthonormal polynomial detrending.
Baseline mean voxel image values for each subject and imaging session were obtained during visual attention conditions blocks without auditory stimuli that were intermixed with other conditions during the experiment. The baseline values were then subtracted from mean voxel image values during auditory stimulation conditions for each subject and imaging session. Average percent signal changes in response to auditory stimuli were calculated relative to the overall mean BOLD response for each voxel. Mean BOLD responses associated with each block were calculated by averaging across both functional images in the sparse sampled blocks and across images 2–8 (i.e., beginning 5.8 s after block initiation) in continuous imaging sessions.
Delimiting Auditory Cortex
As shown in Figure 2, auditory activations on the cortical surface were visualized using an equal-area Mollweide projection of spherical inflation of each hemisphere. The Mollweide projection was centered on HG and oriented so that the superior temporal plane lay on the equator. Population averaged fMRI data was used to define a rectangular region encompassing significant activations to non-attended sounds in regions surrounding HG and including the STG and superior temporal plane (Figure 2, bottom left). The significance of activation extent was evaluated using statistical parametric z-score maps combined across sparse and continuous imaging conditions.
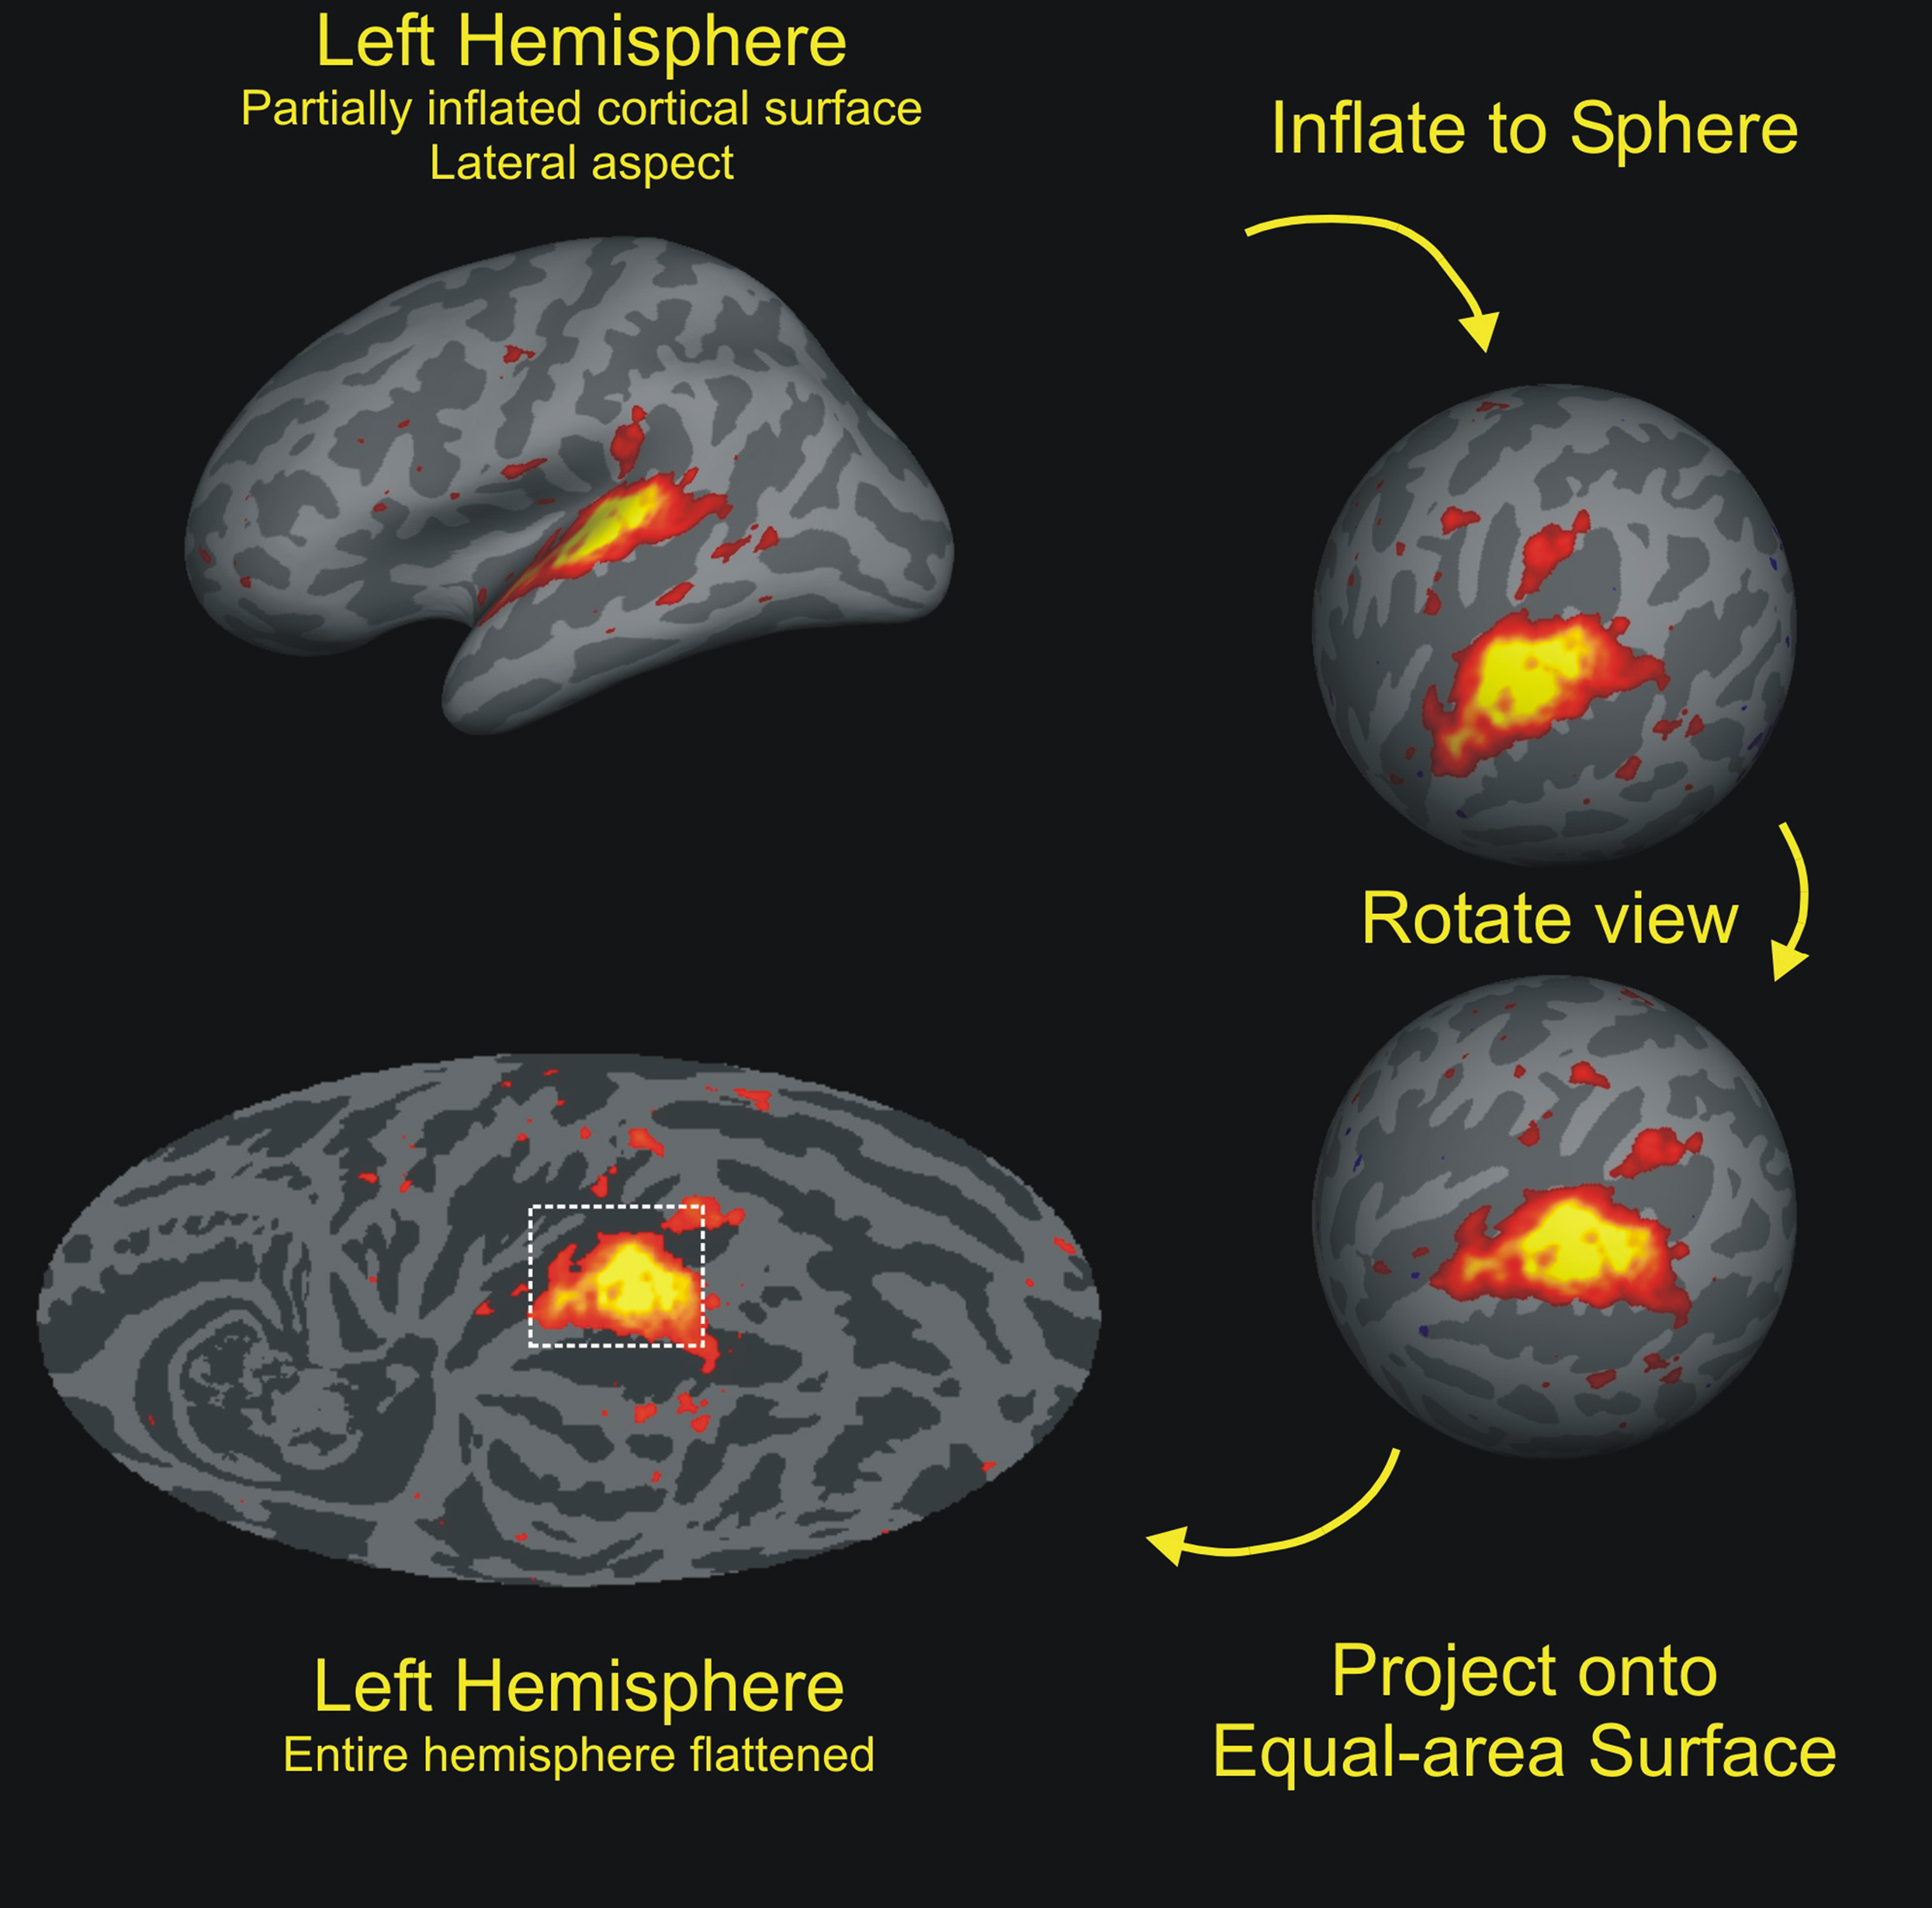
Figure 2. Cortical-surface analysis. The cortex from each hemisphere was segmented with FreeSurfer (Fischl et al., 1999), then inflated to a sphere, and aligned to a hemispherically unified coordinate system. The functional and anatomical data were then mapped onto a Mollweide equal-area projection after rotating the sphere so that the intersection of Heschls’ gyrus (HG) and the superior temporal gyrus (STG) lay at the map center with the STG aligned along the equator. Auditory activations during visual attention conditions are shown on the average cortical anatomy of the left hemispheres (gyri are light, sulci are dark). Activations to non-attended tones were largely restricted to the regions of auditory cortex surrounding HG while activations during auditory attention conditions had increased spatial extent. Activations within the rectangular grid were quantified. Color scale: F(1,8) = 4.5–28.0 (red to yellow).
Activation Alignment with the Primate ACF Model
ACF field assignment was based on the model of primate auditory cortex proposed by Kaas et al. (1999). Auditory cortex was defined as regions surrounding HG on the superior temporal plane that showed significant functional activations to non-attended sounds (Figure 2, bottom left) and all regions were assigned to an ACF. The assignment of activations to ACFs was not unambiguous. Alternative organizations are considered in the Section “Discussion”.
Core fields were identified by their tonotopic organization. Tonotopy was assessed using maps that displayed the difference in activation magnitudes produced by the preferred frequency range at each voxel with respect to the mean activation magnitudes produced by the other two frequency ranges, as shown in Figure 3A. Mirror-symmetric tonotopic activation patterns were used to delimit three core fields: (1) primary auditory cortex (A1) extending anterior-laterally from a high-frequency region in Heschl’s sulcus (HS) to a low-frequency region on mid-lateral HG; (2) the rostral field (R) that shared a mirror-symmetric low-frequency boundary with A1 on HG and that extended anteriorly to a high-frequency region in the circular sulcus (CiS); and (3) the rostrotemporal (RT) field that shared a mirror-symmetric high-frequency boundary with R and that extended to a low-frequency zone along the anterior STG. An additional constraint was that all frequency-specific voxels within tonotopic regions were assigned to core fields. Figure 3B shows the ACF boundaries superimposed on the preferred frequency for all voxels, regardless of tuning bandwidth.
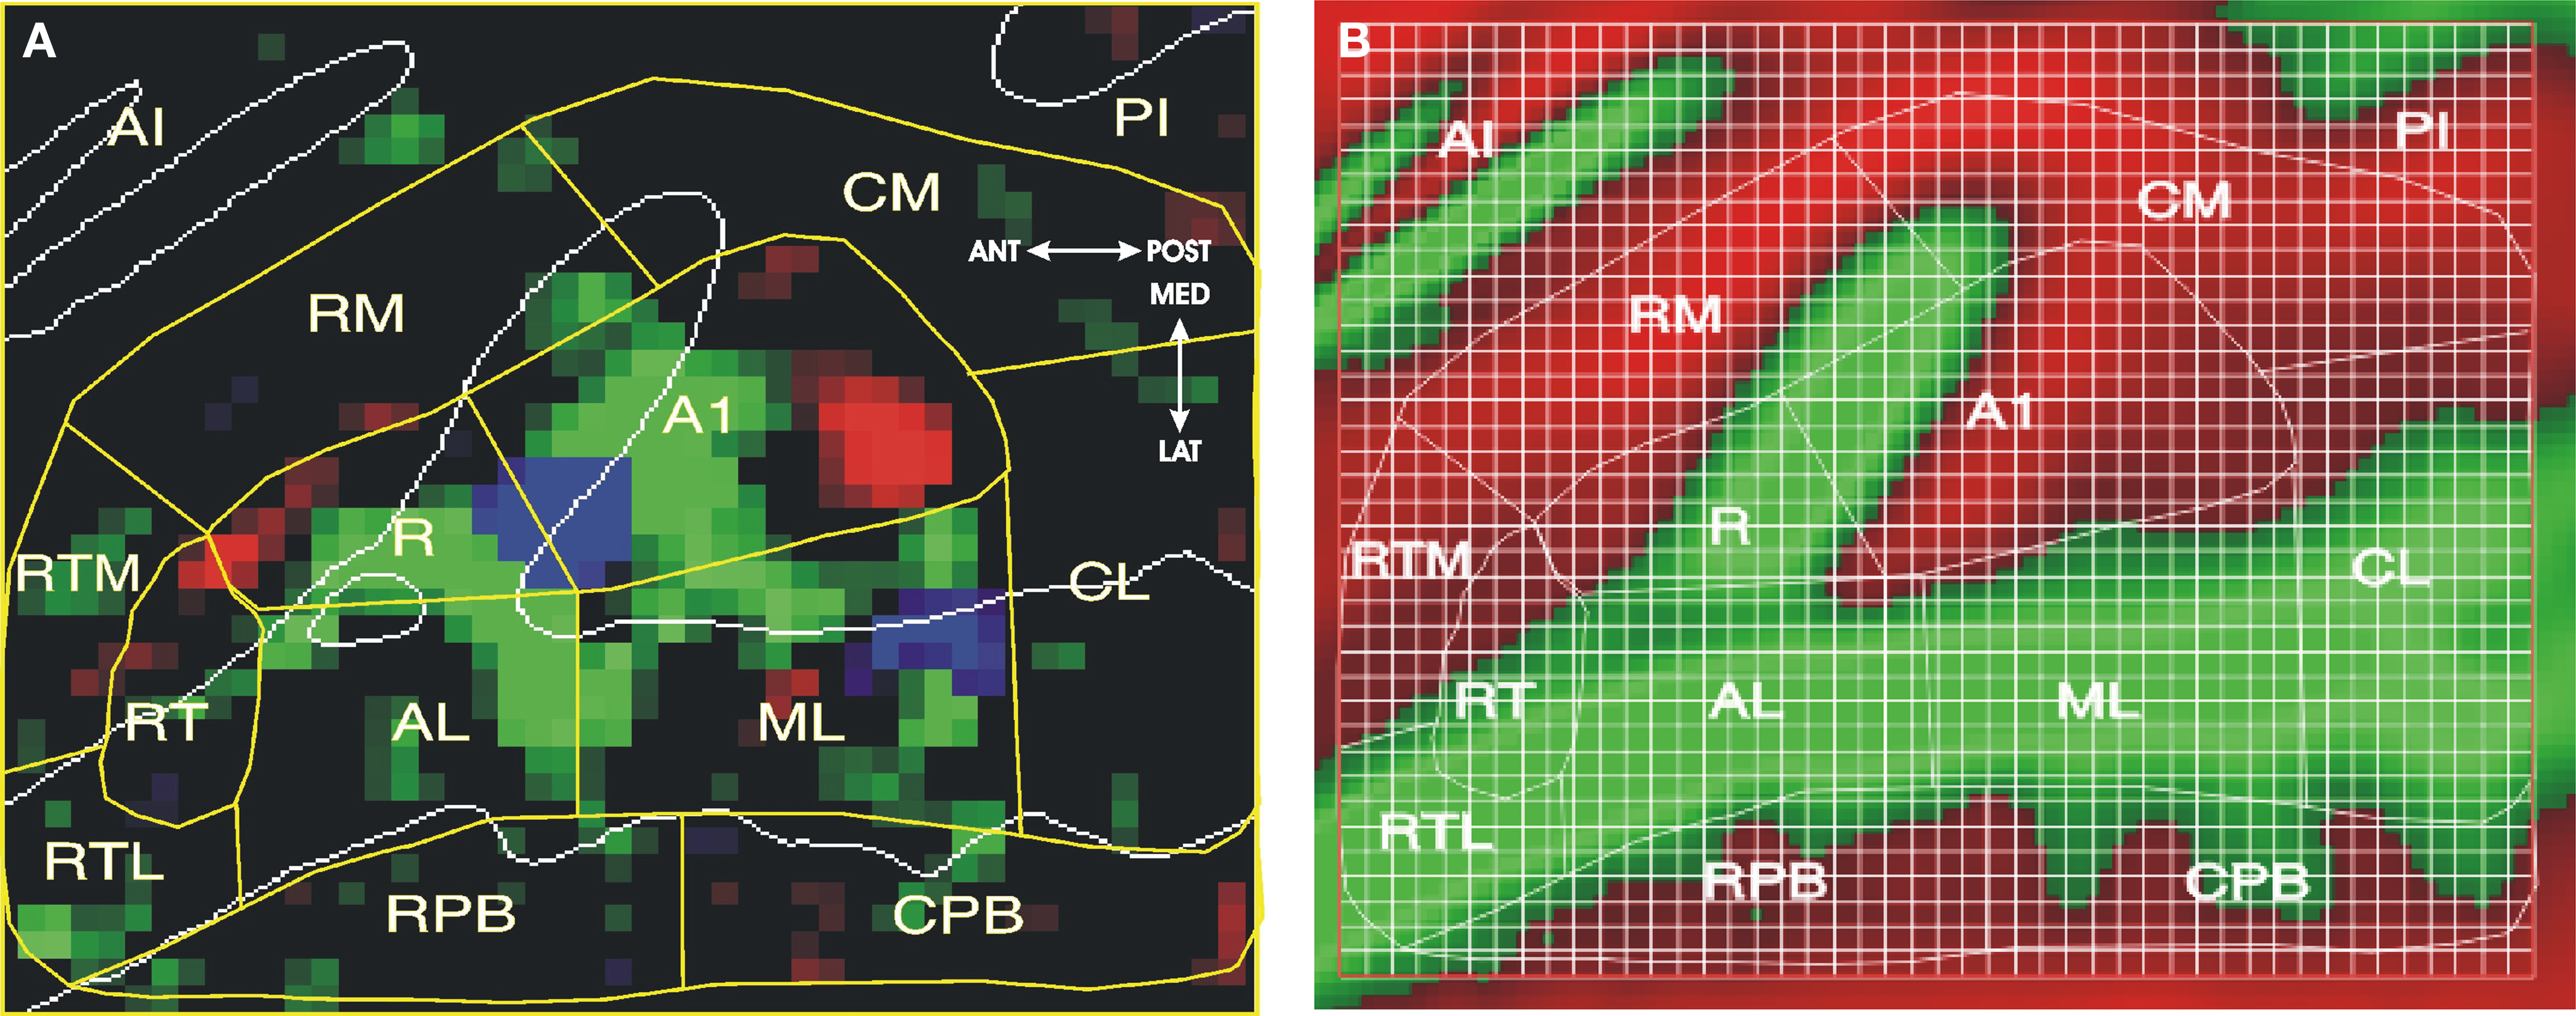
Figure 3. Auditory cortical fields (ACFs). (A) Best-frequency map, showing best frequency at each voxel relative to the two other frequencies. Saturation codes the magnitude of frequency preference (range: 0.07–0.15% difference). Red = 3600 Hz, Green = 900 Hz., Blue = 225 Hz. ACFs (yellow lines) were assigned following the model of Kaas et al. (1999). Auditory core fields were identified by their mirror-symmetric tonotopic organization with surrounding belt fields divided at the boundaries between adjacent core ACFs. White lines indicate gyral boundaries. See text for ACF labels. (B) Model projected on average curvature map of the superior temporal plane (green = gyri, red = sulci), showing anatomical structures and grids used for quantification. CiS: circular sulcus; HG: Heschl’s gyrus; HS: Heschl’s sulcus; PT: planum temporale; STG: superior temporal gyrus; STS: superior temporal sulcus, LGI: long gyri of the insula.
Four LB fields of the Kaas et al. (1999) model, the caudolateral (CL), mediolateral (ML), anteriorlateral (AL), and rostrotemporal-lateral (RTL), were then delimited as in macaque studies by extending the boundaries between adjacent core fields laterally to the border of the superior temporal sulcus (STS). Lateral regions in the STS that lay outside belt fields but that showed significant auditory activations were assigned to rostral and caudal parabelt (RPB, CPB) fields. Finally, three MB fields were delimited between the core fields and the medial extent of significant auditory activations within the insula. The rostrotemporal medial (RTM) field included medial regions anterior to the boundary between R and RT and was similar in size to RTL. The remaining region of auditory responsivity in the insula was subdivided into two fields of approximately equal size, rostromedial (RM) and caudomedial (CM) fields.
The ACFs described above were further grouped into core, LB, and MB field groups following the organizational hierarchy proposed by Kaas et al. (1999): (1) the core field-group including A1, R, and RT, (2) the LB group including RTL, AL, ML, and CL, (3) the MB group including RTM, RM, and CM. Auditory activations were compared between field groups and then between fields within each group. ACFs were defined identically in the left and right cerebral hemispheres, following the co-registration of the left and mirror-reversed right hemisphere. Thus, ACF coordinates in both hemispheres shared identical positions relative to HG and other anatomical landmarks.
Quantifying the Functional Properties of ACFs
Auditory activations were quantified using a rectangular grid that contained 1748 2 × 2 mm grid elements as shown in Figure 3B. The grid spanned 92 mm anterior-posteriorly and 76 mm medial-laterally on the cortical surface.
The tonotopic organization of each ACF was examined using Tone-frequency x Grid-position interactions performed separately for each ACF. In addition, six functional properties were measured at each grid element: (1) Frequency selectivity: activation magnitude to the frequency range producing the largest activation magnitudes with respect to the mean activations produced by the other two frequency ranges. (2) Intensity sensitivity: activations produced by 90 vs. 70 dB tones. (3) Contralaterality: activations in monaural tones in the contralateral ear vs. activations to tones in the ipsilateral ear. (4) Binaural enhancement: activations to binaural sounds vs. the mean activation magnitude to monaural sounds. (5) Attentional selectivity: activations to attended vs. non-attended sounds. (6) Hemispheric asymmetry: activation magnitudes in corresponding (mirror-symmetric) voxels right vs. left hemisphere. Each property was extracted from contrasts across the entire data set during each imaging session divided by the total within-session variance of voxel activation magnitudes during that imaging session. The results were combined across each of the six imaging sessions. Each contrast included all orthogonal stimulus and task conditions For example, intensity sensitivity, reflecting the difference in activation magnitudes to 90 vs. 70 dB tones, was analyzed across auditory blocks containing tones of different frequencies, sound locations, and attention conditions.
Statistical Analyses
ANOVA analyses for multifactorial repeated measures were performed with the open source CLEAVE program (www.ebire.org/hcnlab). CLEAVE was also used to evaluate the significance of each pairwise comparisons. Tonotopic organization was examined with a 3-way repeated measure ANOVA with Subjects, Frequency, and Grid location as factors. The significance of Frequency x Grid-location interactions (indicative of tonotopic organization) was evaluated using the Box-Greenhouse–Geisser correction to control for lack of statistical independence.
Results
Overview
Mean auditory activation magnitudes at each grid element (averaged over conditions with auditory stimuli) are shown in Figure 4. Activations were largest in field ML on the STG posterior and lateral to HG, with peak activations extending into adjacent regions of the Planum Temporale (PT).
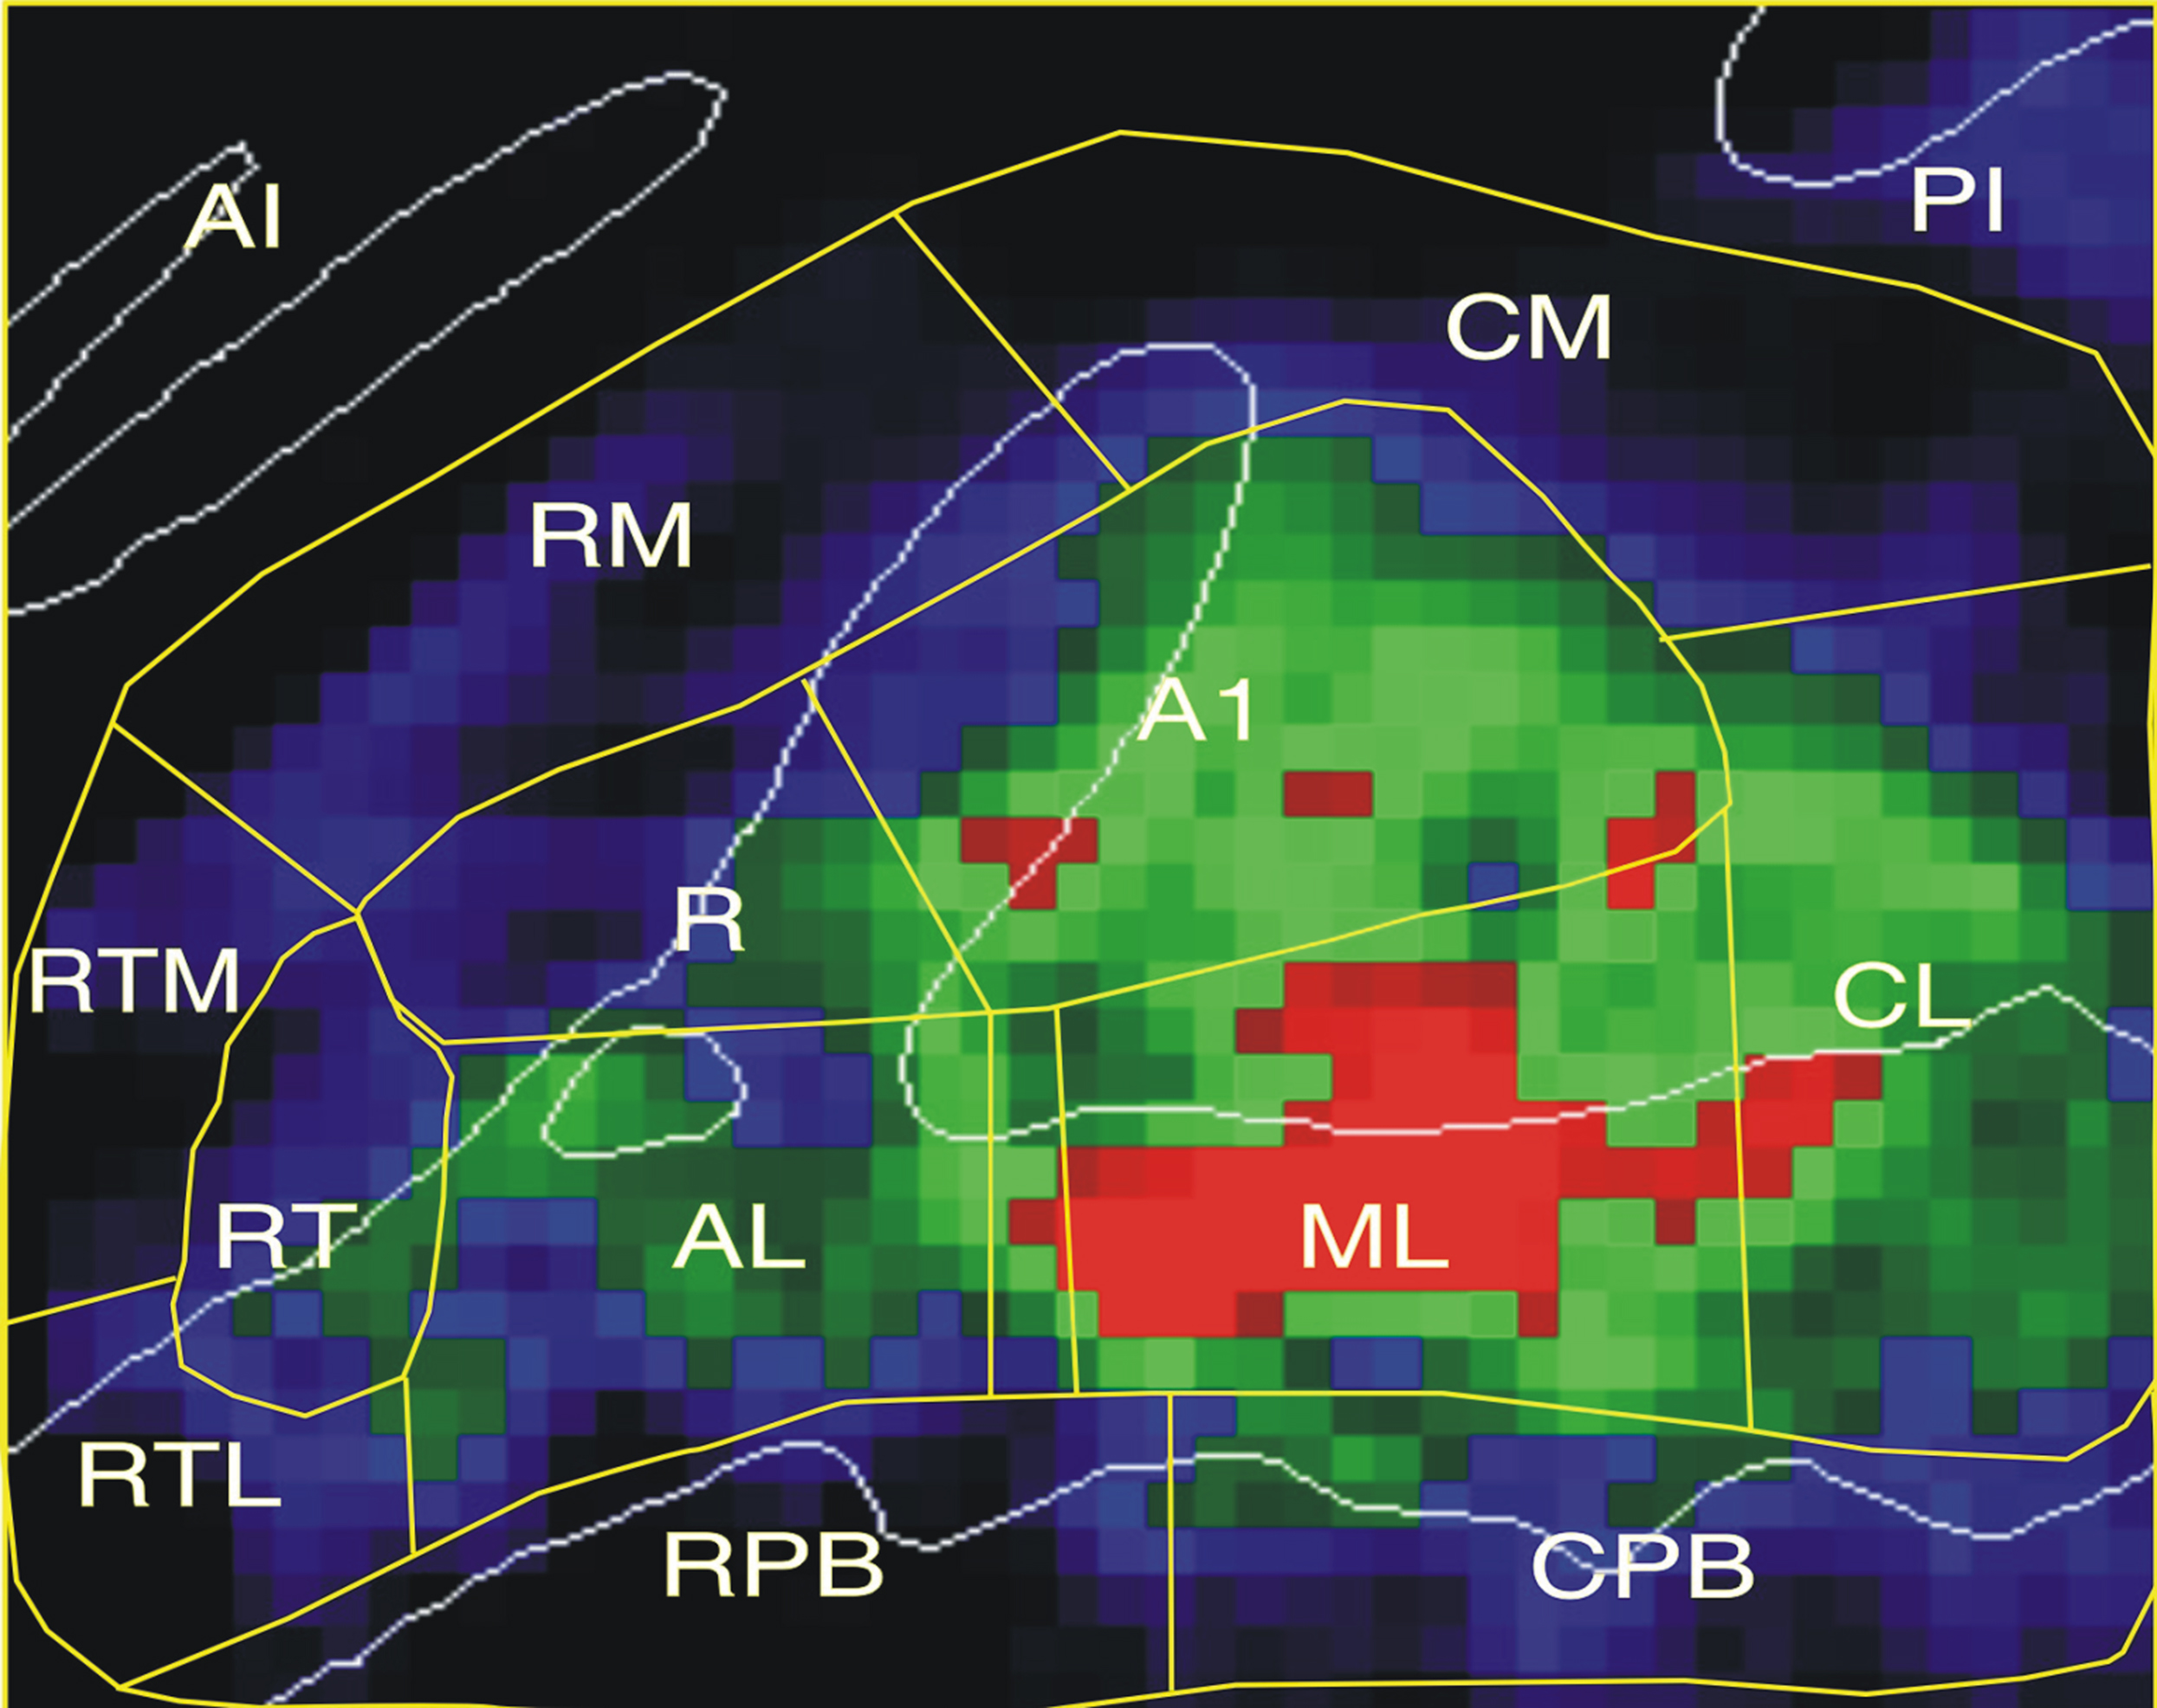
Figure 4. Mean auditory activation magnitudes (averaged over all auditory conditions and both hemispheres) shown for each voxel in the grid. Color codes activation magnitude: Blue = 0.05–0.15%, Green = 0.15–0.40%, Red: 0.40–0.60%.
Tuning Properties of Core, Lateral Belt and Medial Belt Fields
fMRI activation maps of each functional property are shown in Figure 5. There were highly significant differences in the functional properties of the core, LB, and MB field groups are shown in Table 1. Activation magnitudes varied significantly with field group [F(2,16) = 174.4, p < 0.0001], with specific comparisons showing greater activations in the core than in either the LB [F(1,8) = 41.8, p < 0.0001] or the MB [F(1,8) = 136.6, p < 0.0001], and greater activations in the LB in comparison with the MB [F(1,8) = 97.5, p < 0.0001]. Frequency selectivity varied with field group [F(2,16) = 44.2, p < 0.0001], with significantly greater frequency selectivity in the core than in either the LB [F(1,8) = 46.7, p < 0.0001] or the MB [F(1,8) = 51.5, p < 0.0001], and enhanced frequency selectivity in the LB in comparison with the MB [F(1,8) = 5.9, p < 0.05]. Intensity sensitivity also varied with field group [F(2,16) = 20.9, p < 0.001], with greater intensity sensitivity in the core than in either the LB [F(1,8) = 56.1, p < 0.0001] or the MB [F(1,8) = 13.7, p < 0.006]. Activation contralaterality also varied with field group [F(2,16) = 16.1, p < 0.0002], with greater contralaterality in the core than in the LB [F(1,8) = 19.5, p < 0.003] or the MB [F(1,8) = 32.6, p < 0.0005]. Binaural enhancement varied with field group [F(2,16) = 7.7, p < 0.002], with greater binaural enhancement seen in the core than in the LB [F(1,8) = 30.7, p < 0.0005], but insignificant differences between the core and the MB [F(1,8) = 2.5, p < 0.16]. Attentional enhancements also tended to vary with field group [F(2,16) = 4.5, p < 0.053], with significantly greater attentional enhancement in the LB than in the core [F(1,8) = 13.4, p < 0.007], and a trend toward larger enhancements in the LB than in the MB [F(1,8) = 4.2, p < 0.08]. Hemispheric asymmetries also varied with field group [F(2,16) = 25.7, p < 0.0001], reflecting the fact that activations in LB fields were larger over the right hemisphere while activations in core and MB showed a small left-hemisphere preponderance, producing significant differences between the LB and the core [F(1,8) = 27.4, p < 0.0008] and the LB and the MB [F(1,8) = 30.2, p < 0.0006].
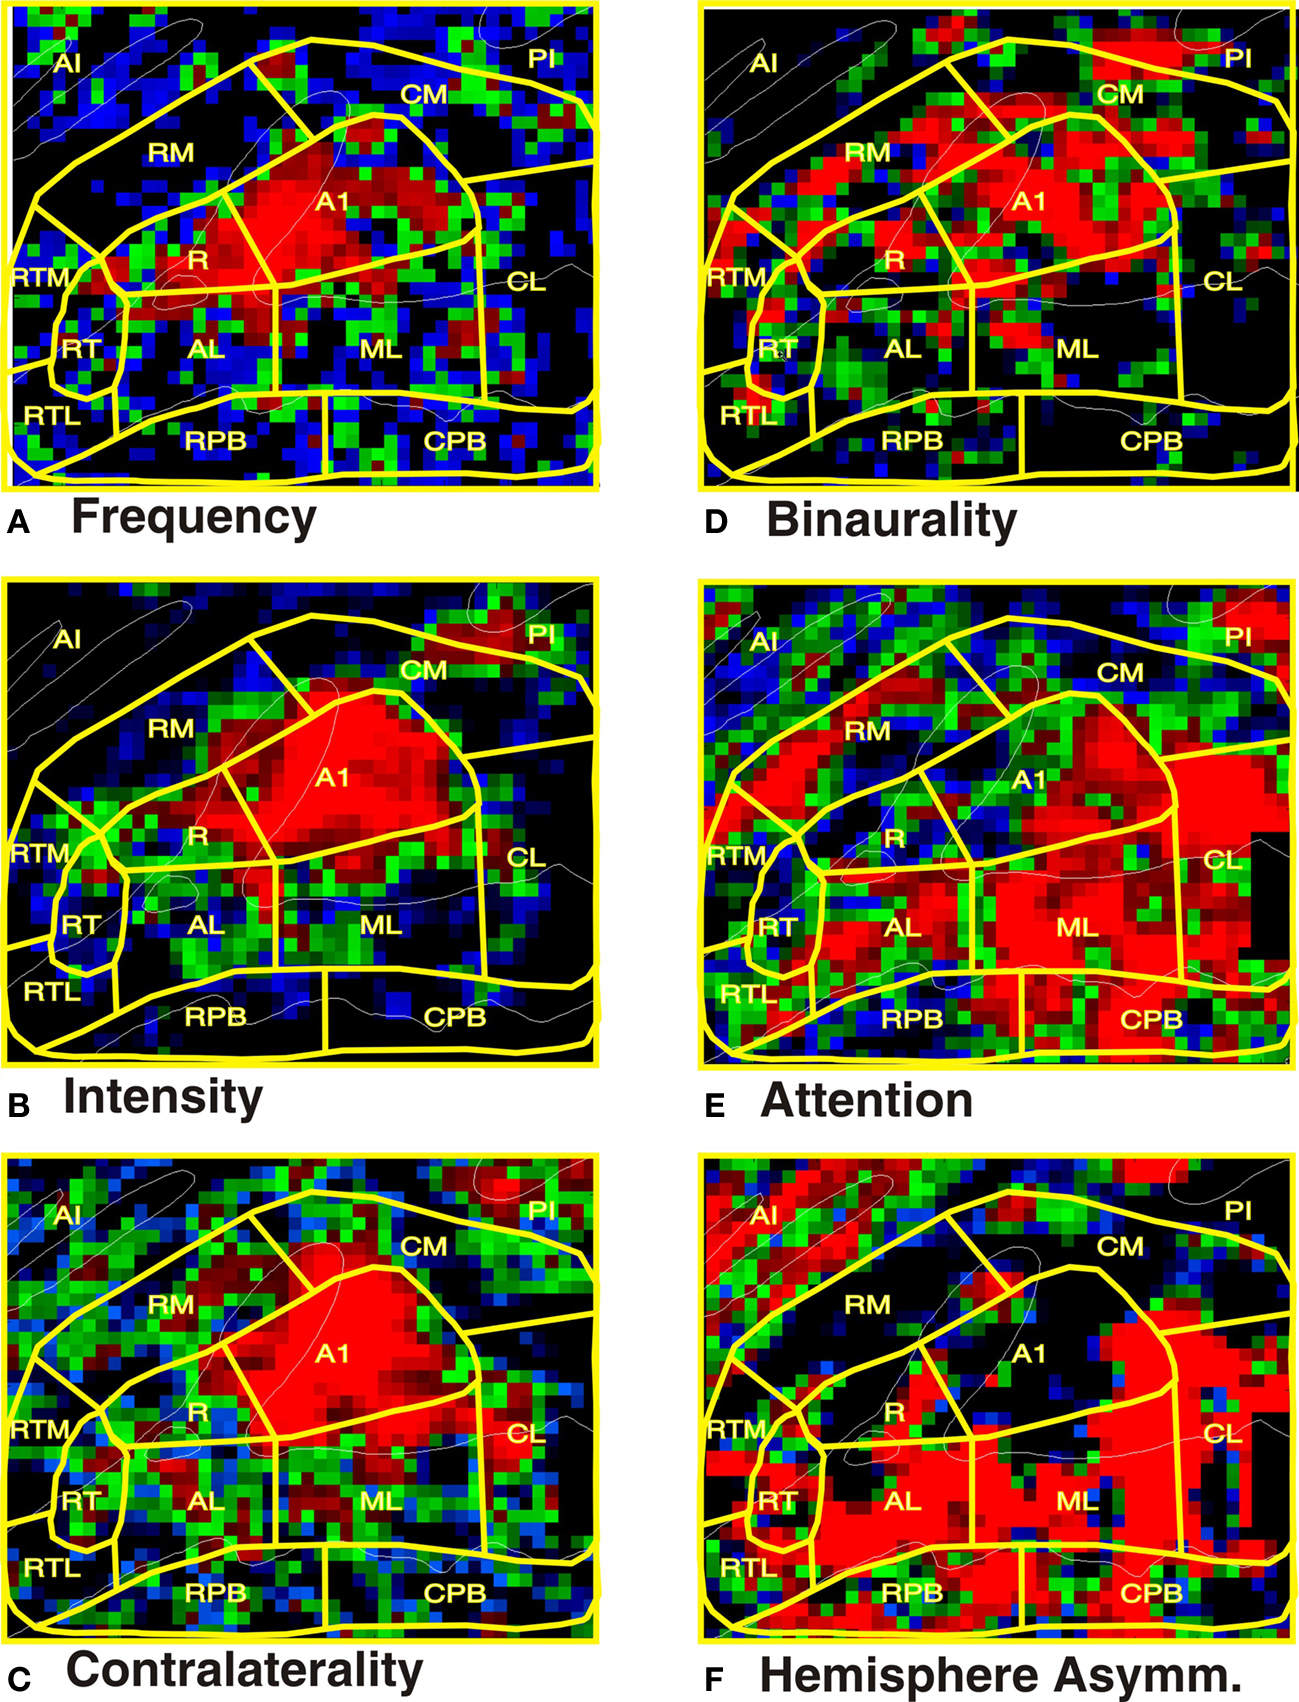
Figure 5. Tuning properties of human ACFs. (A) Frequency selectivity: best frequency vs. average of other two frequencies. Color codes bandwidth. Blue = 0.11–0.13, Green = 0.13–0.15, Red: 0.15–0.22. (B) Intensity sensitivity. Blue = 0.01–0.05, Green = 0.05–0.10, Red: 0.10–0.20. (C) Contralaterality. Blue = 0.01–0.05, Green = 0.05–0.10, Red: 0.10–0.20. (D) Binaurality tuning: Blue = 0.01–0.03, Green = 0.03–0.06, Red: 0.06–0.9. (E) Attention: Blue = 0.01–0.06, Green = 0.06–0.012, Red: 0.12–0.20. (F) Hemispheric asymmetry: Blue = 0.01–0.06, Green = 0.06–0.012, Red: 0.12–0.20. Black regions had values below the minimal threshold for each display. AI = anterior insula, PI = posterior insula.
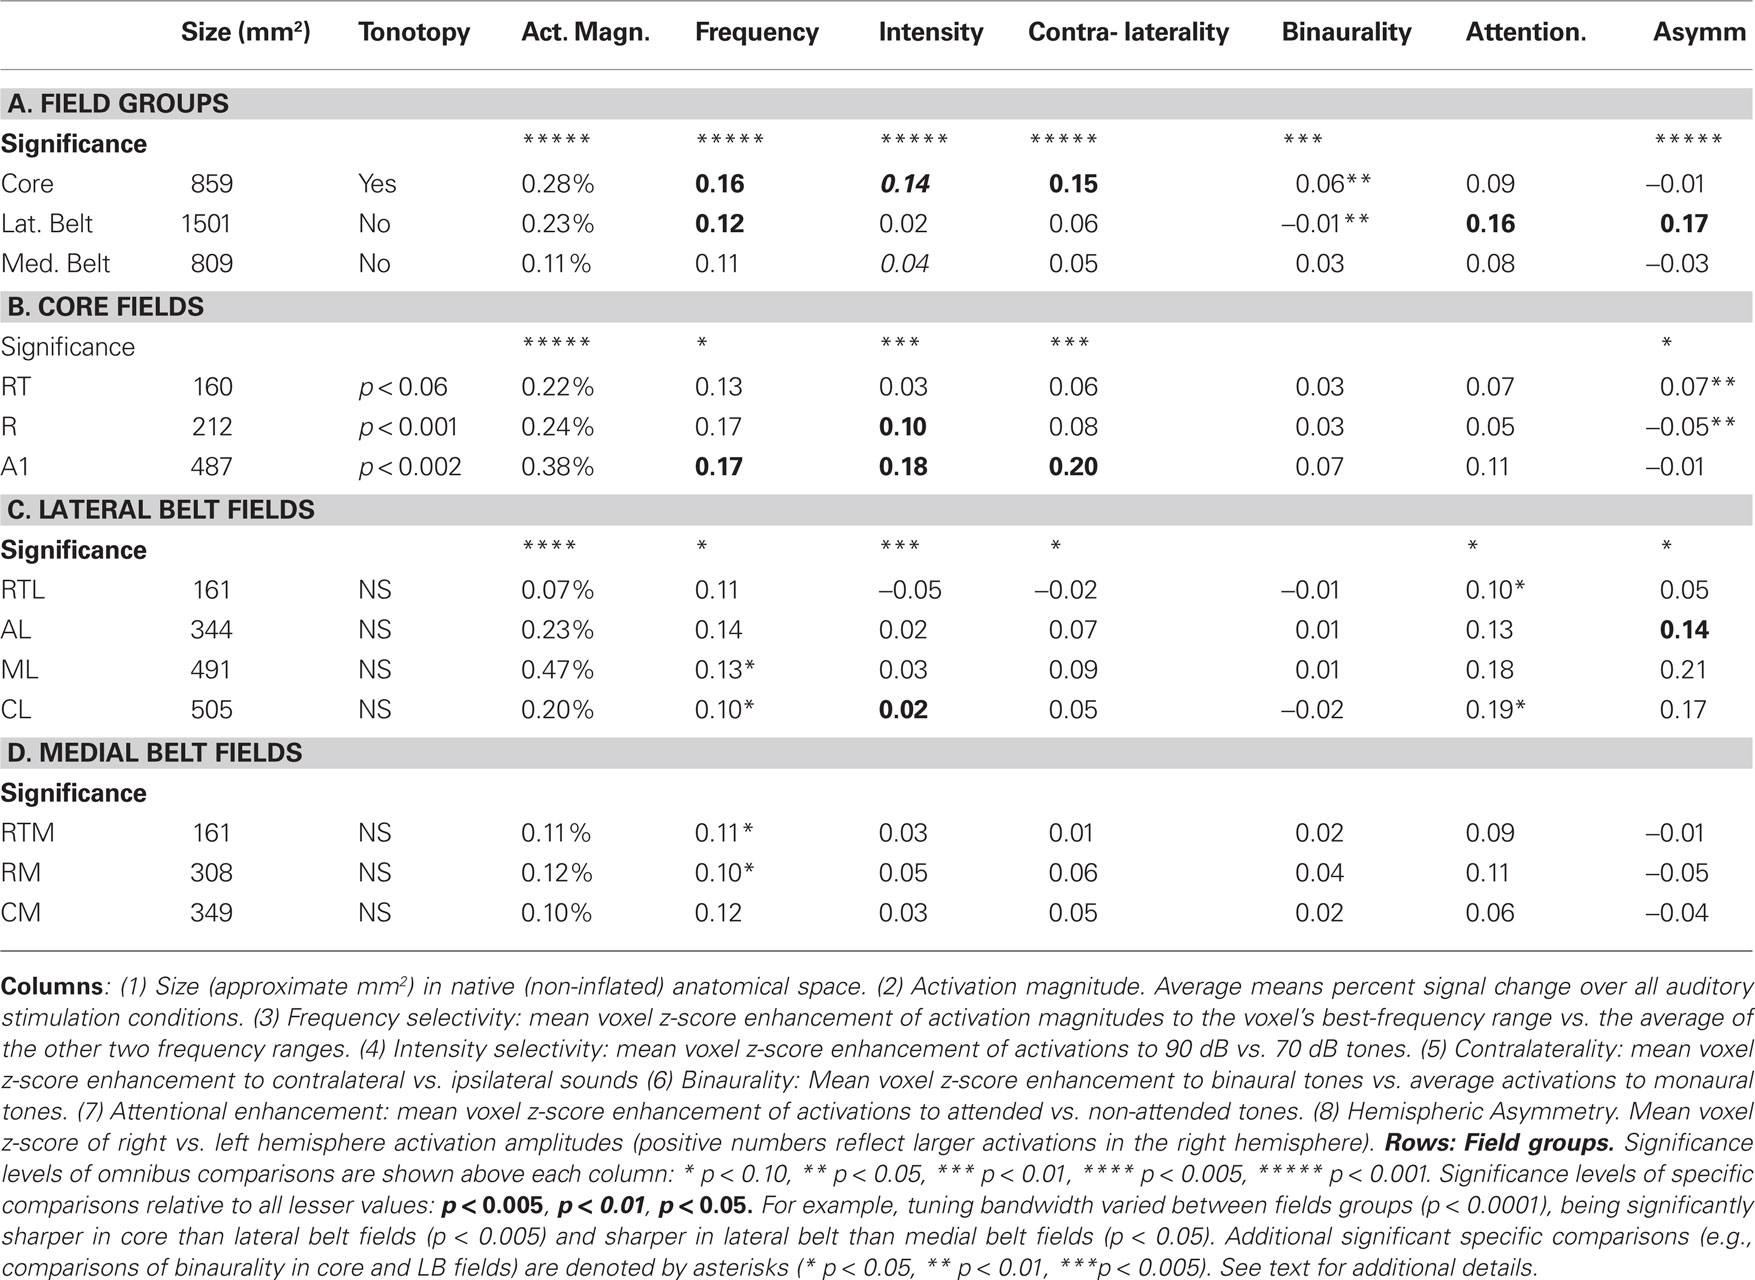
Table 1. Functional properties of human auditory cortical fields.
Core Fields
The tuning properties of core fields are shown in Table 1. Core fields A1 and R showed evidence of tonotopic organization that was reflected in significant Tone-frequency x Grid-location interactions [respectively, F(344,2752) = 4.8, p < 0.002 in A1 and F(134,1072) = 5.2, p < 0.001 in R]. Tone-frequency x Grid-location interactions also trended toward significance in RT [F(92,736) = 2.3, p < 0.06]. Activation magnitudes varied significantly among core ACFs [F(2,16) = 174.4, p < 0.0001], with larger activations in A1 than in either R [F(1,8) = 93.3, p < 0.0001] or RT [F(1,8) = 90.9, p < 0.0001], and larger activations magnitudes in R than RT [F(1,8) = 83.9, p < 0.0001]. Frequency selectivity also varied among core ACFs [F(2,16) = 6.5, p < 0.02], being greater in both A1 and R than in RT [F(1,8) = 10.3, p < 0.02, and F(1,8) = 20.6, p < 0.002, respectively]. Intensity sensitivity also varied with core ACF [F(2,16) = 18.9, p < 0.0002], reflecting greater intensity sensitivity in A1 than in either R [F(1,8) = 19.5, p < 0.003] or RT [F(1,8) = 29.8, p < 0.0006], and greater intensity sensitivity in R than RT [F(1,8) = 6.9, p < 0.05]. Contralaterality also varied with ACF [F(2,16) = 9.8, p < 0.005], being greater in A1 than in R [F(1,8) = 16.6, p < 0.005] or RT [F(1,8) = 10.8, p < 0.02]. Finally, there were significant differences in hemispheric asymmetries [F(2,16) = 6.2, p < 0.03]: namely, activations in RT were larger over the right hemisphere, while activations in the A1 and R showed a left hemisphere preponderance.
Lateral Belt Fields
The functional properties of the LB fields are shown in Table 1. No LB fields showed significant Tone-frequency x Grid-position interactions. Activation magnitudes varied significantly among LB ACFs [F(2,16) = 174.4, p < 0.0001], with specific comparisons showing larger activations in ML than CL [F(1,8) = 47.4, p < 0.0001], AL [F(1,8) = 118.2, p < 0.0001], or RTL [F(1,8) = 117.6, p < 0.0001], larger activations in AL than CL [F(1,8) = 10.9, p < 0.02], and larger activations in both AL and CL than in RTL [F(1,8) = 44.7, p < 0.0002 and F(1,8) = 172.7, p < 0.0001, respectively]. Frequency selectivity also varied among LB fields [F(3,24) = 4.6, p < 0.03], with additional specific comparisons showing greater frequency selectivity in AL and ML than in CL [F(1,8) = 6.5, p < 0.04 and F(1,8) = 8.0, p < 0.03, respectively] and sharper frequency selectivity in AL than RTL [F(1,8) = 5.9, p < 0.05]. Intensity sensitivity also varied among LB ACFs [F(3,24) = 6.5, p < 0.003] due to small increases in activation magnitude with increasing sound intensity in most fields, but larger activations to less intense sounds in RTL. Contralaterality also varied among LB fields [F(3,24) = 4.5, p < 0.03] due to small contralateral sound preferences seen in all fields but RTL. The effects of attention also varied among LB fields [F(3,24) = 4.2 p < 0.03], with specific comparisons showing a greater enhancement in CL than in RTL [F(1,8) = 9.6, p < 0.02]. Finally, hemispheric asymmetries varied across LB fields [F(3,24) = 6.0, p < 0.03], due primarily to a reduced right-hemisphere preponderance in RTL in comparison with other LB ACFs.
Medial Belt Fields
The functional properties of MB fields are shown in Table 1. No MB fields showed significant Tone-frequency x Grid location interactions. Frequency specificity tended to vary with field group [F(2,16) = 3.3, p < 0.07] and was significantly greater in RTM than RM [F(1,8) = 5.48, p < 0.05] but no other distinctions in functional properties of MB fields tended toward significance.
Functional Boundaries of ACFs
Figure 6 shows the significant pairwise differences in functional properties of adjacent ACFs. In general, there were many significant differences across core-belt boundaries and fewer differences between adjacent fields within field groups. For example, activations in the core field A1 differed in all six functional properties from activations in the adjacent LB field ML. In contrast, core fields A1 and R differed in only two functional properties and belt fields ML and AL showed no significant functional differences.
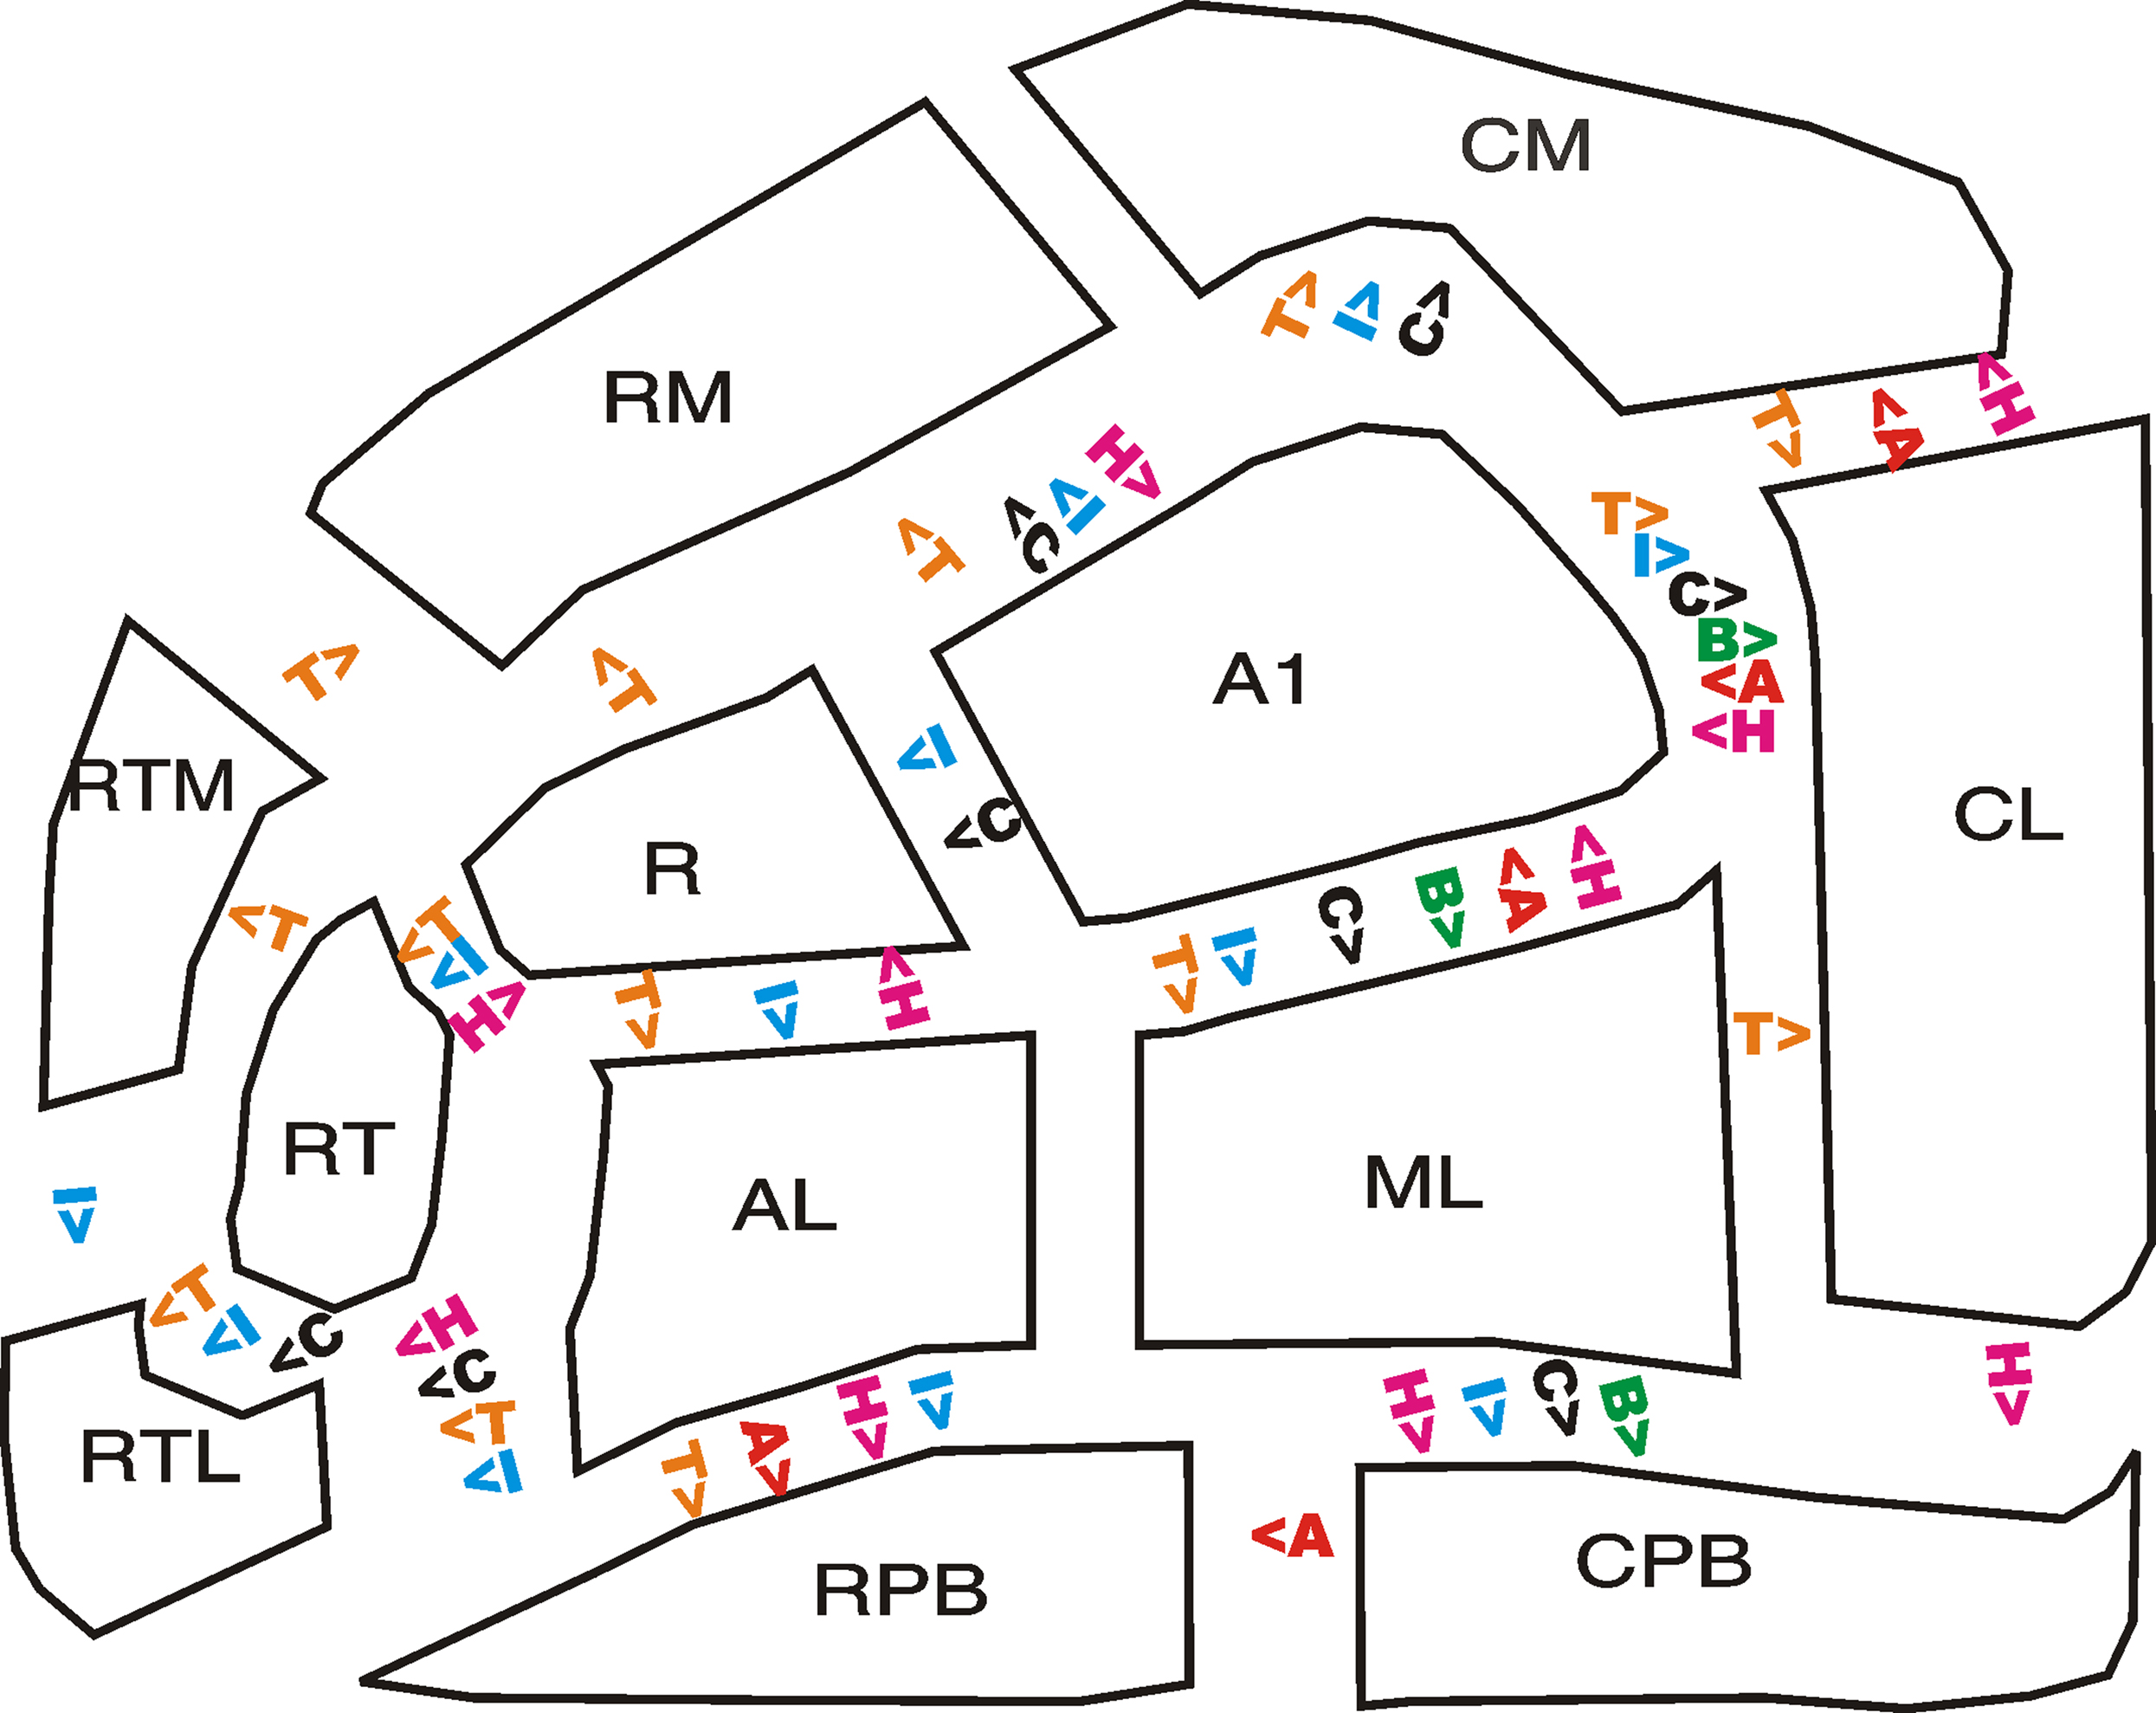
Figure 6. Auditory cortical field functional gradients. Significant differences between adjacent fields are shown for T = tone-frequency selectivity, I = intensity sensitivity, C = contralaterality, B = binaural enhancement, A = attentional modulation, H = right-hemisphere asymmetry.
The observed functional properties did not correlate with activation magnitudes. For example, A1 showed significantly greater sensitivity to all stimulus parameters than ML, despite the fact that ML had significantly larger activations [F(1,8) = 35.5, p < 0.0003]. In contrast, there were no functional distinctions between ML and AL, although activations in ML were more than twice as large as those in AL [F(1,8) = 118.2, p < 0.0001]. In general, core fields were distinguished from adjacent belt fields in their sensitivity to variations in stimulus parameters. For example, A1 was distinguished from all adjacent belt fields in frequency specificity, intensity sensitivity, and contralaterality.
Relative Sizes of Human and Macaque ACFs
Table 2 presents a comparison of the relative sizes of core, LB, and MB fields as functionally defined on the inflated cortical surface in the current study and quantified in native (non-inflated) anatomical space with areal measures of different ACFs provided by Petkov et al. (2006) in their fMRI study of the functional organization of macaque auditory cortex. Overall, functionally defined auditory cortex (excluding the parabelt fields) was 9.6 times larger in humans than in macaques. However, the expansion was not uniform: LB regions showed a greater relative expansion in humans (constituting 47.4% of all of auditory cortex) in comparison with macaques (37.4%), whereas core regions were reduced in relative area (humans = 27.1%, macaques = 37.4%).
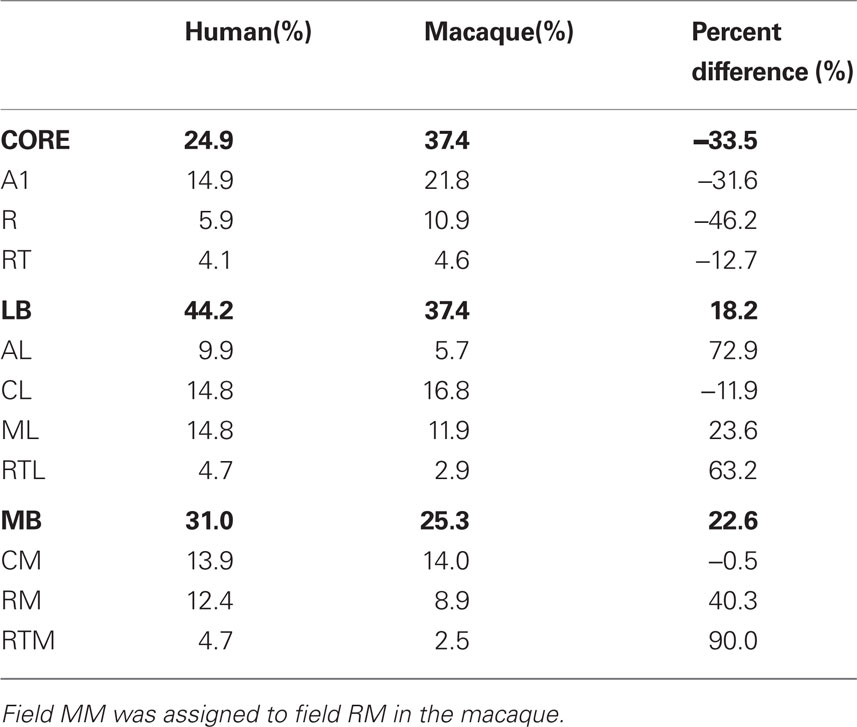
Table 2. Relative sizes of different ACFs in human and macaque auditory cortex (after Petkov et al., 2006) expressed as a percentage of total area. Percent difference shows the changes in relative sizes of different fields between humans and macaques.
Discussion
Does Human Auditory Cortex Conform to the General Primate Model?
The central question posed in the current study was whether the functional organization of human auditory cortex conformed to the functional organization proposed in the general primate model of Kaas and Hackett (Kaas et al., 1999; Kaas and Hackett, 2000) and observed in fMRI studies of macaque cortex (Petkov et al., 2006). When procedures similar to those used in macaque fMRI studies were used to define ACF boundaries in humans, we found three sets of results consistent with those predicted by the model. (1). There were highly significant differences in the tuning properties of core fields and both the medial and the LB fields, with fewer functional distinctions between the medial and LB. (2). Core fields showed sharper tuning for the acoustic properties of sounds (frequency, intensity, and spatial location) than did belt fields, whereas belt fields were more strongly modulated by attention. (3) There were fewer significant differences in tuning properties between adjacent fields within the core or belt (e.g., A1 vs. R or ML vs. AL) than between adjacent core and belt fields (e.g., A1 vs. ML). This pattern of results suggests that the functional organization of human auditory cortex conforms to the pattern seen in macaques. This observation is consistent with extensive similarities in the anatomical structure of auditory cortex between the two species (Galaburda et al., 1978; Rademacher et al., 1992, 1993; Hackett et al., 2001; Sweet et al., 2005) and suggest that the cross-species similarities that have been noted in the functional organization of macaque and human visual cortex (Orban et al., 2004) are likely to extend to auditory cortex as well.
The Functional Specialization of Human Core and Belt ACFs
When the Kaas et al. (1999) model of primate auditory cortex was aligned to human auditory cortex in the present study, core-belt field boundaries were also found to reflect regional differences in other functional properties. Activations in core fields were strongly modulated by stimulus parameters but little influenced by attention. In contrast, activations in LB fields were less influenced by stimulus parameters but more strongly influenced by attention. These contrasts are similar to those in visual cortex where retinotopic regions are strongly influenced by stimulus parameters, while higher-level VCFs are less sensitive to variations in stimulus parameters but increasingly influenced by task relevance and attention (Buffalo et al., 2010).
Core fields were more sensitive than the surrounding belt fields to a variety of acoustic features. For example, core fields showed greater frequency selectivity than belt fields, as in previous fMRI studies of macaque auditory cortex (Kayser et al., 2007). These results are consistent with the narrow frequency-tuning curves obtained in neuronal recordings from core fields in humans (Bitterman et al., 2008) and macaques (Recanzone et al., 2000). Core fields also showed greater intensity sensitivity than surrounding belt fields, consistent with observations that core fields tend to have more monotonic intensity tuning functions than belt fields (Woods et al., 2006).
The observed differences in intensity sensitivity in adjacent core field A1 and belt field ML provide a different perspective on the functional organization of human auditory cortex in comparison with previous analyses that assume that auditory activations arise from functionally undifferentiated cortex. For example, an ampliotopic organization of A1 has been suggested in previous fMRI studies based on a lateral-to-medial shift in the center of mass of auditory activations that occurs with increasing sound intensity (Bilecen et al., 2002; Woods et al., 2009). The current results suggest that this displacement is a consequence of the differential intensity sensitivity of adjacent fields A1 and ML. As sound intensities increase, activation magnitudes increase to a greater extent in A1 than in ML, resulting in a medial shift in the center of mass of overall activations. In the current experiment, we found no evidence of an ampliotopic organization within the tonotopically defined A1 field.
Core ACFs, particularly A1, also showed larger activations to contralateral than ipsilateral sounds, consistent with the results of previous fMRI studies (Woldorff et al., 1999; Jancke et al., 2002; Petkov et al., 2004; Langers et al., 2007a; Lehmann et al., 2007) and neuronal recordings from core and belt fields (Woods et al., 2006). The greater contralaterality of A1 in comparison with belt fields suggest that contralaterality of A1 activations may reflect asymmetries in primary thalamo-cortical projections arising from the ipsilateral and contralateral cochlea (Winer and Lee, 2007).
The LB fields showed the greatest attentional enhancement, consistent with previous fMRI studies showing enhanced attentional lability in lateral regions of auditory cortex (Petkov et al., 2004; Altmann et al., 2008; Rinne et al., 2009). Previous studies have also found that lateral regions of auditory cortex produce larger activations in the right than in the left hemisphere particularly in pitch discrimination tasks of the sort used in the current study (Johnsrude et al., 2000; Petit et al., 2007; Hyde et al., 2008).
Unlike the results of previous fMRI studies of macaques (Petkov et al., 2006) and humans (Humphries et al., 2010) and neuronal recordings (Rauschecker and Scott, 2009; Hackett, 2010) we found no evidence of a tonotopic organization in human belt fields.
This likely reflects the use of pure tone stimuli in the current experiment that have been shown to reduce both activation magnitudes and evidence of tonotopic organization in belt fields (Kusmierek and Rauschecker, 2009). Alternatively, in some belt fields tonotopic organization may be limited to short-latency neuronal responses (Kusmierek and Rauschecker, 2009) and might therefore be obscured in BOLD signals that reflect aggregate synaptic activity over an entire auditory stimulation block.
Functional Distinctions Among Core Fields
We found two functional distinctions between the core fields A1 and R. R showed reduced intensity sensitivity, consistent with a greater incidence of non-monotonic intensity tuning in R than A1 (Recanzone et al., 2000; Bendor and Wang, 2008). R also showed less contralaterality than A1. This is consistent with suggestions that R and A1 may participate respectively in “what” and “where” auditory pathways with different functional properties (Recanzone et al., 2000; Rauschecker and Scott, 2009) and indicates that the properties of R are somewhat intermediate between A1 and LB fields (Hackett, 2010).
The increasingly belt-like character of activations in core fields was further evident in RT. The functional properties of RT differed from those of the adjacent core field, R, in frequency selectivity, intensity sensitivity, and interhemispheric asymmetry. In contrast, no significant differences in functional properties were noted between RT and the adjacent LB field, AL. Moreover, AL was distinguished from the adjacent LB field, RTL by three functional properties while RTL failed to show significant functional differences with the adjacent parabelt field, RPB. This line of reasoning suggests that RT might be more appropriately assigned to the LB than the core while RTL might be more appropriately assigned to the parabelt than the belt.
Functional Distinctions Among Belt Fields
In comparison with MB fields, LB fields showed slightly enhanced frequency selectivity, an increase in relative activation amplitudes in the right hemisphere, and a trend toward greater effects of attention. The paucity of distinctions between MB and LB fields contrasts with the many significant differences observed between core and adjacent MB and LB fields. These results are consistent with suggestions that MB and LB fields share common functional specialization for processing more complex stimulus features that distinguishes belt fields from fields in the core (Kusmierek and Rauschecker, 2009; Rauschecker and Scott, 2009).
Several functional distinctions were seen among LB fields. Frequency selectivity was greater in AL and ML than in CL or RTL. Paradoxical intensity sensitivity was also seen in RTL, where larger activations were produced by less intense tones, distinguishing it from other LB fields. Anterior regions of auditory cortex that are sensitive to low-intensity signals have previously been noted by others (Brechmann et al., 2002; Bendor and Wang, 2008).
In contrast, MB fields showed small activation magnitudes and no significant functional distinctions between fields. This might call into question the procedures for dividing the MB region into distinct ACFs. A more recent model of primate auditory cortex (Kaas and Hackett, 2000) divides the MB fields into four ACFs with the addition of an MM field, mirroring the LB ML field. However, given the small magnitude of MB activations and the relative uniform functional organization maps seen in Figure 5, it is unlikely that the addition of another medial field would have revealed greater MB functional specialization. Medial fields may require more complex sounds or task parameters to reveal their functional specialization (Rauschecker and Tian, 2000; Schonwiesner et al., 2005; Obleser et al., 2007; Petkov et al., 2008; Rinne et al., 2009).
Anatomical Locations of Human ACFs
The locations of activations observed in human fMRI studies bear a consistent relationship to the gyral and sulcal anatomy of the superior temporal plane, making it possible to analyze average activations in subject populations that are aligned based on anatomical structure (Kang et al., 2004; Petkov et al., 2004; Desai et al., 2005; Viceic et al., 2009; Woods and Alain, 2009; Woods et al., 2009). The current results suggest that individual human ACFs have consistent anatomical locations relative to local anatomy in different subjects. Insofar as the 18 hemispheres studied in the current experiment are representative of average auditory cortical organization, the cortical-surface coordinates used to define ACF boundaries in the current study (supplementary material) can be used to estimate ACF activation profiles in other fMRI investigations of auditory cortex including those that do not use cortical-surface mapping techniques (MNI coordinates provided in supplementary materials). However, it is likely that ACFs are more precisely specified in cortical-surface coordinate systems as has previously been demonstrated in studies of the visual system of humans (Hinds et al., 2009) and macaques (Hinds et al., 2008).
Nevertheless, even when aligned using cortical-surface coordinates, the precise anatomical locations of individual ACFs will vary to some extent across subjects. For example, the examination of single-subject tonotopic maps shown in Figure 6 of Woods et al. (2009) and Figure 5 from Humphries et al. (2010) show that that the anatomical locations of the functionally defined low-frequency border between A1 and R varied by 4–7 mm across different subjects in comparison to average border location. As a result, population-averaging will introduce some spatial smearing of functional activations. The consequences of spatial smearing would be greatest for functional properties, such best-frequency tuning, that change rapidly within ACFs and hence have relatively high spatial frequencies on the cortical surface. Given the observed magnitude of spatial smearing across subjects, anatomical regions responding to a particular tone frequency in one subject likely responded to slightly different tone frequencies in other subjects. Insofar as spatial smearing of comparable magnitude occurred throughout the auditory cortex, its impact would be greater on more compact ACFs (e.g., R and RT) than on larger ACFs (e.g., A1 and ML). This implies that the functional properties of smaller ACFs were specified with less precision than those of larger ACFs in our population-average analyses. In addition, across-subject spatial smearing would blur functional boundaries between adjacent ACFs with distinct functional properties. For example, the relatively sharp functional boundaries between adjacent core and belt fields (Figure 5) would likely be even more distinct in individual subjects.
Comparative Functional Anatomy of Human and Macaque Auditory Cortex
Our results suggest that the area of functionally defined human auditory cortex was expanded by 10-fold in comparison with functionally defined auditory cortex in the macaque. The expansion of functionally defined auditory areas exceeds the fourfold increase seen in interspecies comparisons of functionally defined visual regions (Wandell and Winawer, 2010), but is consistent with the magnitude of anatomical expansion seen in superior temporal lobe structures (Hill et al., 2010). Thus, both functional and anatomical studies indicate that auditory cortex has been disproportionately enlarged in humans.
In addition, we found that the functionally defined LB fields occupied a relatively larger percentage of auditory cortex in humans previously reported by Petkov et al. (2006) in macaques. Moreover, Petkov et al. (2006) divided tonotopic regions between core and adjacent belt fields while we assigned tonotopic regions primarily to the core, a methodological difference that would have increased the relative size of LB fields in macaques relative to humans, i.e., an opposite result from that obtained. The disproportionate enlargement of LB fields in humans is also evident in anatomical studies (Hill et al., 2010). In humans, (Belin et al., 2002; Woods and Alain, 2009) and macaques (Petkov et al., 2009a) speech and vocalizations are known to activate LB fields, suggesting that the relative expansion of the LB fields in humans may reflect evolutionary pressures associated with the evolution of speech (Kaas, 2008; Rauschecker and Scott, 2009).
Challenges and Limitations in Functionally Mapping Human ACFs
In comparison with characterizing the functional organization of VCFs, fMRI mapping of the functional organization of ACFs in humans faces three significant challenges. First, ACFs are smaller and more compact that VCFs. This increases the importance of correcting for the spatial imprecision intrinsic to standard functional neuroimaging protocols through the use of anatomical space analysis of fMRI data (Kang et al., 2007). Second, core ACFs show one-dimensional tonotopic organization whereas peri-striate VCFs show a two-dimensional, retinotopic organization (Wandell and Winawer, 2010). Because the frequency specificity of auditory cortical activations declines with increasing tone intensity as a consequence of cochlear mechanics, the relatively loud tones needed need to produce clear fMRI activations are likely to produce a broad band of activation that spans tonotopic ACFs. In contrast, in retinotopic VCFs a stimulus in a particular location produces a spot of activation on the cortical surface with a spatial extent that is relatively insensitive to changes in stimulus contrast or brightness. In addition, in the primate model of auditory cortex organization, core and adjacent belt fields share a collinear tonotopic organization. This makes it difficult to define core/belt boundaries using tonotopic maps alone. In contrast, retinotopic VCFs typically abut on a meridian, make it easy to define boundaries between adjacent retinotopic fields. Finally, while there are quantitative distinctions in the in such response properties as tuning bandwidth among less clearly tonotopic belt fields (Petkov et al., 2006), ACFs so far lack the qualitative functional distinctions, such as the specialization for motion processing in area MT+ (Zeki, 2004),that have been found in non-retinotopic VCFs.
As a result, greater uncertainty remains about ACF than VCF organization in both human and macaques. Nevertheless, the results reported here reveal that functional organization of human auditory cortex appears to conform in three important ways with models derived from macaque auditory cortex (1) core fields show distinctive functional properties from both medial and LB fields, with small distinctions between belt field groups; (2) core fields are more sensitive to the acoustic features of stimuli than belt fields, whereas belt fields are more sensitive to behavioral relevance of stimuli; and (3) sharp functional distinctions are seen between adjacent core and belt fields, with smaller distinctions seen between adjacent fields with the core or belt. This suggests that, as in the visual system, the general organization plan of auditory cortex is similar across primate species.
However, the working model of human ACF organization proposed here will likely undergo significant revisions in the future. First, further studies need to address the degree of tonotopic organization of belt fields using noise burst stimuli (Wessinger et al., 2001). In addition, the functional distinctions between belt fields need to be mapped using both biologically significant stimuli such as speech and vocalizations (Belin et al., 2000; Petkov et al., 2009a) and simpler pitch-producing stimuli that appear to preferentially activate LB regions (Garcia et al., 2010). In addition, high-resolution fMRI studies may help to evaluate regional variations in frequency specificity (Read et al., 2002; Schreiner and Winer, 2007) and binaurality (Middlebrooks and Pettigrew, 1981) in A1 and possible other core ACFs. Also, convergent structural MRI studies of cortical thickness and tissue properties (Sigalovsky et al., 2006) may permit anatomical data to assist in the definition of ACF boundaries. Finally, the disproportionate expansion of LB in humans might be expected to result in a proliferation of belt ACFs in parallel with the expansion of cortical surface area (Krubitzer, 2007; Kaas, 2008). Such potentially novel fields would likely be revealed by the use of speech-like stimuli and tasks that preferentially engage human auditory abilities.
Conclusions
We found that the spatial distribution of tuning properties in human auditory cortex were well accounted for by the Kaas et al. (1999) model of macaque auditory cortex with systematic differences observed in the functional properties of core and belt fields, and abrupt functional distinctions at core/belt field boundaries. Core fields showed greater sensitivity to acoustic stimulus parameters, whereas belt fields were more sensitive to attention. The results confirm that human auditory cortex can be functionally subdivided into auditory fields that are specialized for processing different attributes of auditory signals and that are organized in a manner that is similar to that of other primate species. Areal comparisons of functionally defined auditory cortex in humans and macaques reveal a 10-fold increase in the area of auditory cortex area, with a disproportionate enlargement of LB fields that have been associated with the processing of speech.
Conflict of Interest Statement
David L. Woods is affiliated with NeuroBehavioral Systems, Inc., the developers of Presentation software that was used to create this experiment.
Acknowledgments
Special thanks to Claude Alain who reviewed preliminary versions of this manuscript. This work was supported by grants from the VA Research Service.
References
Altmann, C. F., Henning, M., Doring, M. K., and Kaiser, J. (2008). Effects of feature-selective attention on auditory pattern and location processing. Neuroimage 41, 69–79.
Barrett, D. J., and Hall, D. A. (2006). Response preferences for “what” and “where” in human non-primary auditory cortex. Neuroimage 32, 968–977.
Belin, P., Zatorre, R. J., and Ahad, P. (2002). Human temporal-lobe response to vocal sounds. Brain Res. Cogn. Brain Res. 13, 17–26.
Belin, P., Zatorre, R. J., Lafaille, P., Ahad, P., and Pike, B. (2000). Voice-selective areas in human auditory cortex. Nature 403, 309–312.
Bendor, D., and Wang, X. (2006). Cortical representations of pitch in monkeys and humans. Curr. Opin. Neurobiol. 16, 391–399.
Bendor, D., and Wang, X. (2008). Neural response properties of primary, rostral, and rostrotemporal core fields in the auditory cortex of marmoset monkeys. J. Neurophysiol. 100, 888–906.
Bilecen, D., Scheffler, K., Schmid, N., Tschopp, K., and Seelig, J. (1998). Tonotopic organization of the human auditory cortex as detected by BOLD-FMRI. Hear. Res. 126, 19–27.
Bilecen, D., Seifritz, E., Scheffler, K., Henning, J., and Schulte, A. C. (2002). Amplitopicity of the human auditory cortex: an fMRI study. Neuroimage 17, 710–718.
Bitterman, Y., Mukamel, R., Malach, R., Fried, I., and Nelken, I. (2008). Ultra-fine frequency tuning revealed in single neurons of human auditory cortex. Nature 451, 197–201.
Brechmann, A., Baumgart, F., and Scheich, H. (2002). Sound-level-dependent representation of frequency modulations in human auditory cortex: a low-noise fMRI study. J. Neurophysiol. 87, 423–433.
Buffalo, E. A., Fries, P., Landman, R., Liang, H., and Desimone, R. (2010). A backward progression of attentional effects in the ventral stream. Proc. Natl. Acad. Sci. U.S.A. 107, 361–365.
Dale, A. M., Fischl, B., and Sereno, M. I. (1999). Cortical surface-based analysis. I. Segmentation and surface reconstruction. Neuroimage 9, 179–194.
Degerman, A., Rinne, T., Salmi, J., Salonen, O., and Alho, K. (2006). Selective attention to sound location or pitch studied with fMRI. Brain Res. 1077, 123–134.
Deouell, L. Y., Heller, A. S., Malach, R., D’Esposito, M., and Knight, R. T. (2007). Cerebral responses to change in spatial location of unattended sounds. Neuron 55, 985–996.
Desai, R., Liebenthal, E., Possing, E. T., Waldron, E., and Binder, J. R. (2005). Volumetric vs. surface-based alignment for localization of auditory cortex activation. Neuroimage 26, 1019–1029.
Fischl, B., Sereno, M. I., and Dale, A. M. (1999a). Cortical surface-based analysis. II: inflation, flattening, and a surface-based coordinate system. Neuroimage 9, 195–207.
Fischl, B., Sereno, M. I., Tootell, R. B., and Dale, A. M. (1999b). High-resolution intersubject averaging and a coordinate system for the cortical surface. Hum. Brain Mapp. 8, 272–284.
Formisano, E., Kim, D. S., Di Salle, F., van de Moortele, P. F., Ugurbil, K., and Goebel, R. (2003). Mirror-symmetric tonotopic maps in human primary auditory cortex. Neuron 40, 859–869.
Friston, K. J., Williams, S., Howard, R., Frackowiak, R. S., and Turner, R. (1996). Movement-related effects in fMRI time-series. Magn. Reson. Med. 35, 346–355.
Galaburda, A. M., Sanides, F., and Geschwind, N. (1978). Human brain. Cytoarchitectonic left-right asymmetries in the temporal speech region. Arch Neurol. 35, 812–817.
Garcia, D., Hall, D. A., and Plack, C. J. (2010). The effect of stimulus context on pitch representations in the human auditory cortex. Neuroimage 51, 806–816.
Hackett, T. A., Preuss, T. M., and Kaas, J. H. (2001). Architectonic identification of the core region in auditory cortex of macaques, chimpanzees, and humans. J. Comp. Neurol. 441, 197–222.
Hill, J., Inder, T., Neil, J., Dierker, D., Harwell, J., and Van Essen, D. (2010). Similar patterns of cortical expansion during human development and evolution. Proc. Natl. Acad. Sci. U.S.A. 107, 13135–13140.
Hinds, O., Polimeni, J. R., Rajendran, N., Balasubramanian, M., Amunts, K., Zilles, K., Schwartz, E. L., Fischl, B., and Triantafyllou, C. (2009). Locating the functional and anatomical boundaries of human primary visual cortex. Neuroimage 46, 915–922.
Hinds, O., Polimeni, J. R., Rajendran, N., Balasubramanian, M., Wald, L. L., Augustinack, J. C., Wiggins, G., Rosas, H. D., Fischl, B., and Schwartz, E. L. (2008). The intrinsic shape of human and macaque primary visual cortex. Cereb. Cortex 18, 2586–2595.
Humphries, C., Liebenthal, E., and Binder, J. R. (2010). Tonotopic organization of human auditory cortex. Neuroimage 50, 1202–1211.
Hyde, K. L., Peretz, I., and Zatorre, R. J. (2008). Evidence for the role of the right auditory cortex in fine pitch resolution. Neuropsychologia 46, 632–639.
Jancke, L., Shah, N. J., Posse, S., Grosse-Ryuken, M., and Muller-Gartner, H. W. (1998). Intensity coding of auditory stimuli: an fMRI study. Neuropsychologia 36, 875–883.
Jancke, L., Wustenberg, T., Schulze, K., and Heinze, H. J. (2002). Asymmetric hemodynamic responses of the human auditory cortex to monaural and binaural stimulation. Hear. Res. 170, 166–178.
Johnsrude, I. S., Penhune, V. B., and Zatorre, R. J. (2000). Functional specificity in the right human auditory cortex for perceiving pitch direction. Brain 123, 155–163.
Kaas, J. H. (2008). The evolution of the complex sensory and motor systems of the human brain. Brain Res. Bull. 75, 384–390.
Kaas, J. H., and Hackett, T. A. (2000). Subdivisions of auditory cortex and processing streams in primates. Proc. Natl. Acad. Sci. U.S.A. 97, 11793–11799.
Kaas, J. H., Hackett, T. A., and Tramo, M. J. (1999). Auditory processing in primate cerebral cortex. Curr. Opin. Neurobiol. 9, 164–170.
Kang, X., Yund, E. W., Herron, T. J., and Woods, D. L. (2007). Improving the resolution of functional brain imaging: analyzing functional data in anatomical space. Magn. Reson. Imaging 25, 1070–1078.
Kang, X. J., Bertrand, O., Alho, K., Yund, E. W., Herron, T. J., and Woods, D. L. (2004). Local landmark-based mapping of human auditory cortex. Neuroimage 22, 1657–1670.
Kayser, C., Petkov, C. I., Augath, M., and Logothetis, N. K. (2007). Functional imaging reveals visual modulation of specific fields in auditory cortex. J. Neurosci. 27, 1824–1835.
Krubitzer, L. (2007). The magnificent compromise: cortical field evolution in mammals. Neuron 56, 201–208.
Kusmierek, P., and Rauschecker, J. P. (2009). Functional specialization of medial auditory belt cortex in the alert rhesus monkey. J. Neurophysiol. 102, 1606–1622.
Langers, D. R., Backes, W. H., and van Dijk, P. (2007a). Representation of lateralization and tonotopy in primary versus secondary human auditory cortex. Neuroimage 34, 264–273.
Langers, D. R., van Dijk, P., Schoenmaker, E. S., and Backes, W. H. (2007b). fMRI activation in relation to sound intensity and loudness. Neuroimage 35, 709–718.
Lehmann, C., Herdener, M., Schneider, P., Federspiel, A., Bach, D. R., Esposito, F., di Salle, F., Scheffler, K., Kretz, R., Dierks, T., and Seifritz, E. (2007). Dissociated lateralization of transient and sustained blood oxygen level-dependent signal components in human primary auditory cortex. Neuroimage 34, 1637–1642.
Middlebrooks, J. C., and Pettigrew, J. D. (1981). Functional classes of neurons in primary auditory cortex of the cat distinguished by sensitivity to sound localization. J. Neurosci. 1, 107–120.
Obleser, J., Zimmermann, J., Van Meter, J., and Rauschecker, J. P. (2007). Multiple stages of auditory speech perception reflected in event-related FMRI. Cereb. Cortex 17, 2251–2257.
Orban, G. A., Van Essen, D., and Vanduffel, W. (2004). Comparative mapping of higher visual areas in monkeys and humans. Trends Cogn. Sci. 8, 315–324.
Petit, L., Simon, G., Joliot, M., Andersson, F., Bertin, T., Zago, L., Mellet, E., and Tzourio-Mazoyer, N. (2007). Right hemisphere dominance for auditory attention and its modulation by eye position: an event related fMRI study. Restor. Neurol. Neurosci. 25, 211–225.
Petkov, C. I., Kang, X., Alho, K., Bertrand, O., Yund, E. W., and Woods, D. L. (2004). Attentional modulation of human auditory cortex. Nat. Neurosci. 7, 658–663.
Petkov, C. I., Kayser, C., Augath, M., and Logothetis, N. K. (2006). Functional imaging reveals numerous fields in the monkey auditory cortex. PLoS Biol. 4, e215. doi: 10.1371/journal.pbio.0040215.
Petkov, C. I., Logothetis, N. K., and Obleser, J. (2009a). Where are the human speech and voice regions, and do other animals have anything like them? Neuroscientist 15, 419–429.
Petkov, C. I., Kayser, C., Augath, M., and Logothetis, N. K. (2009b). Optimizing the imaging of the monkey auditory cortex: sparse vs. continuous fMRI. Magn. Reson. Imaging 27, 1065–1073.
Petkov, C. I., Kayser, C., Steudel, T., Whittingstall, K., Augath, M., and Logothetis, N. K. (2008). A voice region in the monkey brain. Nat. Neurosci. 11, 367–374.
Rademacher, J., Caviness, V. S. Jr., Steinmetz, H., and Galaburda, A. M. (1993). Topographical variation of the human primary cortices: implications for neuroimaging, brain mapping, and neurobiology. Cereb. Cortex 3, 313–329.
Rademacher, J., Galaburda, A. M., Kennedy, D. N., Filipek, P. A., and V. S. Caviness, J. (1992). Human cerebral cortex: Localization, parcellation, and morphometry with magnetic resonance imaging. J. Cogn. Neurosci. 4, 350–374.
Rauschecker, J. P. (1997). Processing of complex sounds in the auditory cortex of cat, monkey, and man. Acta Oto-Laryngol. Suppl. 532, 34–38.
Rauschecker, J. P. (1998). Cortical processing of complex sounds. Curr. Opin. Neurobiol. 8, 516–521.
Rauschecker, J. P., and Tian, B. (2000). Mechanisms and streams for processing of “what” and “where” in auditory cortex. Proc. Natl. Acad. Sci. U.S.A. 97, 11800–11806.
Rauschecker, J. P., and Tian, B. (2004). Processing of band-passed noise in the lateral auditory belt cortex of the rhesus monkey. J. Neurophysiol. 91, 2578–2589.
Rauschecker, J. P., and Scott, S. K. (2009). Maps and streams in the auditory cortex: nonhuman primates illuminate human speech processing. Nat. Neurosci. 12, 718–724.
Read, H. L., Winer, J. A., and Schreiner, C. E. (2002). Functional architecture of auditory cortex. Curr. Opin. Neurobiol. 12, 433–440.
Recanzone, G. H., Guard, D. C., and Phan, M. L. (2000). Frequency and intensity response properties of single neurons in the auditory cortex of the behaving macaque monkey. J. Neurophysiol. 83, 2315–2331.
Recanzone, G. H., and Sutter, M. L. (2008). The biological basis of audition. Annu. Rev. Psychol. 59, 119–142.
Rinne, T., Kirjavainen, S., Salonen, O., Degerman, A., Kang, X., Woods, D. L., and Alho, K. (2007). Distributed cortical networks for focused auditory attention and distraction. Neurosci. Lett. 416, 247–251.
Rinne, T., Koistinen, S., Salonen, O., and Alho, K. (2009). Task-dependent activations of human auditory cortex during pitch discrimination and pitch memory tasks. J. Neurosci. 29, 13338–13343.
Sabri, M., Binder, J. R., Desai, R., Medler, D. A., Leitl, M. D., and Liebenthal, E. (2008). Attentional and linguistic interactions in speech perception. Neuroimage 39, 1444–1456.
Schonwiesner, M., Rubsamen, R., and von Cramon, D. Y. (2005). Hemispheric asymmetry for spectral and temporal processing in the human antero-lateral auditory belt cortex. Eur. J. Neurosci. 22, 1521–1528.
Schonwiesner, M., von Cramon, D. Y., and Rubsamen, R. (2002). Is it tonotopy after all? Neuroimage 17, 1144–1161.
Schreiner, C. E., and Winer, J. A. (2007). Auditory cortex mapmaking: principles, projections, and plasticity. Neuron 56, 356–365.
Seifritz, E., Di Salle, F., Esposito, F., Herdener, M., Neuhoff, J. G., and Scheffler, K. (2006). Enhancing BOLD response in the auditory system by neurophysiologically tuned fMRI sequence. Neuroimage 29, 1013–1022.
Sigalovsky, I. S., Fischl, B., and Melcher, J. R. (2006). Mapping an intrinsic MR property of gray matter in auditory cortex of living humans: a possible marker for primary cortex and hemispheric differences. Neuroimage 32, 1524–1537.
Sweet, R. A., Dorph-Petersen, K. A., and Lewis, D. A. (2005). Mapping auditory core, lateral belt, and parabelt cortices in the human superior temporal gyrus. J. Comp. Neurol. 491, 270–289.
Talavage, T. M., Sereno, M. I., Melcher, J. R., Ledden, P. J., Rosen, B. R., and Dale, A. M. (2004). Tonotopic organization in human auditory cortex revealed by progressions of frequency sensitivity. J. Neurophysiol. 91, 1282–1296.
Tian, B., Reser, D., Durham, A., Kustov, A., and Rauschecker, J. P. (2001). Functional specialization in rhesus monkey auditory cortex. Science 292, 290–293.
Tootell, R. B., Hadjikhani, N. K., Vanduffel, W., Liu, A. K., Mendola, J. D., Sereno, M. I., and Dale, A. M. (1998). Functional analysis of primary visual cortex (V1) in humans. Proc. Natl. Acad. Sci. U.S.A. 95, 811–817.
Viceic, D., Campos, R., Fornari, E., Spierer, L., Meuli, R., Clarke, S., and Thiran, J. P. (2009). Local landmark-based registration for fMRI group studies of nonprimary auditory cortex. Neuroimage 44, 145–153.
Viceic, D., Fornari, E., Thiran, J. P., Maeder, P. P., Meuli, R., Adriani, M., and Clarke, S. (2006). Human auditory belt areas specialized in sound recognition: a functional magnetic resonance imaging study. Neuroreport 17, 1659–1662.
Wandell, B. A., and Winawer, J. (2010). Imaging retinotopic maps in the human brain. Vision Res. (in press).
Wessinger, C. M., VanMeter, J., Tian, B., Van Lare, J., Pekar, J., and Rauschecker, J. P. (2001). Hierarchical organization of the human auditory cortex revealed by functional magnetic resonance imaging. J. Cogn. Neurosci. 13, 1–7.
Woldorff, M. G., Tempelmann, C., Fell, J., Tegeler, C., Gaschler-markefski, B., Hinrichs, H., Heinz, H. J., and Scheich, H. (1999). Lateralized auditory spatial perception and the contralaterality of cortical processing as studied with functional magnetic resonance imaging and magnetoencephalography. Hum. Brain Mapp. 7, 49–66.
Woods, D. L., and Alain, C. (2009). Functional imaging of human auditory cortex. Curr. Opin. Otolaryngol. Head Neck Surg. 17, 407–411.
Woods, D. L., Stecker, G. C., Rinne, T., Herron, T. J., Cate, A. D., Yund, E. W., Liao, I., and Kang, X. (2009). Functional maps of human auditory cortex: effects of acoustic features and attention. PLoS ONE 4, e5183. doi: 10.1371/journal.pone.0005183.
Woods, T. M., Lopez, S. E., Long, J. H., Rahman, J. E., and Recanzone, G. H. (2006). Effects of stimulus azimuth and intensity on the single-neuron activity in the auditory cortex of the alert macaque monkey. J. Neurophysiol. 96, 3323–3337.
Keywords: tones, tonotopy, cortical mapping, primate, attention, sound intensity, sound location, fMRI
Citation: Woods DL, Herron TJ, Cate AD, Yund EW, Stecker GC, Rinne T and Kang X (2010) Functional properties of human auditory cortical fields. Front. Syst. Neurosci. 4:155. doi: 10.3389/fnsys.2010.00155
Received: 14 May 2010;
Accepted: 05 November 2010;
Published online: 03 December 2010.
Edited by:
Jonathan B. Fritz, University of Maryland, USAReviewed by:
Micah M. Murray, Université de Lausanne, SwitzerlandPascal Belin, University of Glasgow, UK
Josef P. Rauschecker, Georgetown University School of Medicine, USA
Tim Griffiths, Newcastle University, UK
Copyright: © 2010 Woods, Herron, Cate, Yund, Stecker, Rinne and Kang. This is an open-access article subject to an exclusive license agreement between the authors and the Frontiers Research Foundation, which permits unrestricted use, distribution, and reproduction in any medium, provided the original authors and source are credited.
*Correspondence: David L. Woods, Neurology Service (127E), VANCHCS, 150 Muir Rd., Martinez, CA 95553, USA. e-mail:ZGx3b29kc0B1Y2RhdmlzLmVkdQ==