 Billy T. Chen1

- 1 Department of Physiology and Neuroscience, New York University School of Medicine, New York, NY, USA
- 2 Department of Neurosurgery, New York University School of Medicine, New York, NY, USA
Midbrain dopamine (DA) neurons in the substantia nigra pars compacta (SNc) and ventral tegmental area (VTA) exhibit somatodendritic release of DA. Previous studies indicate a difference between the Ca2+ dependence of somatodendritic DA release in the SNc and that of axonal DA release in dorsal striatum. Here, we evaluated the Ca2+ dependence of DA release in the VTA and nucleus accumbens (NAc) shell for comparison with that in the SNc and dorsal striatum. Release of DA was elicited by single-pulse stimulation in guinea-pig brain slices and monitored with subsecond resolution using carbon-fiber microelectrodes and fast-scan cyclic voltammetry. In dorsal striatum and NAc, DA release was not detectable at extracellular Ca2+ concentrations ([Ca2+]o) below 1 mM; however, a progressive increase in evoked extracellular DA concentration ([DA]o) was seen with [Ca2+]o ≥ 1.5 mM. By contrast, in SNc and VTA, robust increases in [DA]o could be elicited in 0.25 mM [Ca2+]o that were ∼60% of those seen in 1.5 mM [Ca2+]o. In SNc, a plateau in single-pulse evoked [DA]o was seen at [Ca2+]o ≥ 1.5 mM, mirroring the release plateau reported previously for pulse-train stimulation in SNc. In VTA, however, evoked [DA]o increased progressively throughout the range of [Ca2+]o tested (up to 3.0 mM). These functional data are consistent with the microanatomy of the VTA, which includes DA axon collaterals as well as DA somata and dendrites. Differences between axonal and somatodendritic release data were quantified using Hill analysis, which showed that the Ca2+ dependence of axonal DA release is low affinity with high Ca2+ cooperativity, whereas somatodendritic release is high affinity with low cooperativity. Moreover, this analysis revealed the dual nature of DA release in the VTA, with both somatodendritic and axonal contributions.
Introduction
Brain dopamine (DA) arises primarily from two midbrain cell groups, the substantia nigra pars compacta (SNc; A9) and the ventral tegmental area (VTA; A10; Dahlström and Fuxe, 1964), both of which project ipsilaterally via the median forebrain bundle to forebrain regions (Ungerstedt, 1971; Fallon and Moore, 1978). Dopaminergic neurons of the SNc project to dorsal striatum and facilitate movement mediated by the basal ganglia, whereas dopaminergic neurons of the VTA project to the nucleus accumbens (NAc), prefrontal cortex, and other mesolimbic structures that underlie emotion, reward, and cognition.
Release of DA occurs in both SNc and VTA (Björkland and Lindvall, 1975; Geffen et al., 1976; Nieoullon et al., 1977; Rice et al., 1994, 1997; Iravani et al., 1996; Jaffe et al., 1998; Chen and Rice, 2001, 2002; Patel et al., 2009). However, in SNc, DA release sites are exclusively somatodendritic (Juraska et al., 1977; Wassef et al., 1981), whereas the VTA receives synaptic DA input from its own axon collaterals and those from the SNc (Deutch et al., 1988; Bayer and Pickel, 1990). In the SNc, the release mechanism appears to be exocytotic (Jaffe et al., 1998; Fortin et al., 2006), requiring depolarization and Ca2+ entry (Geffen et al., 1976; Chéramy et al., 1981; Rice et al., 1994, 1997; Chen and Rice, 2001; Patel et al., 2009), albeit with a minimal dependence on extracellular Ca2+ concentration ([Ca2+] o), which distinguishes it from axonal DA release (Rice et al., 1997; Hoffman and Gerhardt, 1999; Chen and Rice, 2001; Chen et al., 2006; Fortin et al., 2006).
Previous comparison of somatodendritic DA release in the SNc vs. axonal DA release in dorsal striatum revealed a strikingly lower Ca2+ dependence of somatodendritic DA release (Chen and Rice, 2001). That study had two limitations, however: first, the low Ca2+ levels tested were undefined; second, DA release was evoked by pulse-train stimulation, which elicits the concurrent release of glutamate and GABA that can modulate DA release in both the dorsal striatum and SNc (Chen and Rice, 2002; Avshalumov et al., 2003; Patel et al., 2009). Moreover, the Ca2+ dependence of DA release in NAc or VTA was not examined in that study.
In the present work, we used single stimulation pulses, which mimic single action potentials, to evoke DA release that is free from modulation by concurrently released glutamate and GABA (Chen et al., 2006). Release was examined in SNc, VTA, dorsal striatum, and NAc shell in a series of defined [Ca2+]o. With this refined paradigm, we demonstrate the validity of previous work suggesting limited Ca2+ dependence of somatodendritic vs. axonal DA release. Strikingly, the data from VTA showed a unique Ca2+ dependence, with readily detectable evoked extracellular DA concentration ([DA]o) in low [Ca2+]o, as seen in SNc, but an exponential Ca2+ dependence with increasing [Ca2+]o (>1 mM), as seen in NAc and dorsal striatum.
Materials and Methods
Slice Preparation and Solutions
Male Hartley guinea pigs (150–250 g) were deeply anesthetized with 50 mg/kg pentobarbital (intraperitoneally) and decapitated. All animal handling procedures were in accordance with NIH guidelines and were approved by the New York University School of Medicine Animal Care and Use Committee. Methods for brain slice preparation were as described previously (Chen and Rice, 2001; Chen et al., 2006). Briefly, coronal striatal and midbrain slices (400 μm) were prepared using a Vibratome (Ted Pella, Inc., St. Louis, MO). Slices were cut in ice-cold HEPES-buffered artificial cerebrospinal fluid (aCSF), containing (in mM): NaCl (120); KCl (5); NaHCO3 (20); HEPES acid (6.7); HEPES salt (3.3); CaCl2 (2); MgSO4 (2); and glucose (10) saturated with 95% O2/5% CO2, then allowed to recover in HEPES-buffered aCSF for at least 1 h at room temperature before transfer to a submersion recording chamber (Warner Instrument Corp., Hamden, CT). Once in the recording chamber, slices were equilibrated for an additional 30 min in aCSF, which contained (in mM): NaCl (124); KCl (3.7); NaHCO3 (26); CaCl2 (0.0–3.0); MgSO4 (1.3); KH2PO4 (1.3); and glucose (10) saturated with 95% O2/5% CO2 and maintained at 32°C with a flow rate of 1.2 mL/min.
To assess the Ca2+ dependence of DA release as a function of defined [Ca2+]o, Ca2+ added to normal aCSF was titrated with the Ca2+ chelator EGTA, according to Bers (1982), with all media containing 1 mM EGTA. In all experiments, D2 autoreceptors were blocked by sulpiride (1 μM) and the DA transporter (DAT) inhibited by GBR-12909 (2 μM) to eliminate the influence of autoreceptor-mediated inhibition and DA uptake (Chen and Rice, 2001), both of which are more pronounced in striatum than SNc (Cragg and Greenfield, 1997; Cragg et al., 1997a).
Fast-Scan Cyclic Voltammetry and Experimental Design
Evoked DA release was monitored in real time using fast-scan cyclic voltammetry (FCV) with carbon-fiber electrodes made from 7 μm carbon fibers (type HM, unsized, Courtaulds), which were spark-etched to a tip diameter of 2–4 μm (MPB Electrodes; St. Bartholomew’s and the Royal London School of Medicine and Dentistry, University of London, UK). Instrumentation for FCV was a Millar Voltammeter (available from J. Millar, St. Bartholomew’s and the Royal London School of Medicine and Dentistry), with data acquisition controlled by Clampex 7.0 software (Molecular Devices, Foster City, CA), which imported voltammograms to a PC via a DigiData 1200B A/D board (Molecular Devices). Scan rate for FCV was 800 V/s, with a sampling interval of 100 ms; scan range was −0.7 to +1.3 V (vs. Ag/AgCl). Because the sensitivity of carbon-fiber microelectrodes can change with changes in divalent cation concentration (Kume-Kick and Rice, 1998; Chen et al., 1999), electrodes were calibrated in the recording chamber at 32°C after each experiment with DA in aCSF with each Ca2+ concentration tested. The DA calibration factor for each Ca2+ concentration was used to calculate evoked [DA] o in that medium.
Single-pulse stimulation was used to evoke DA release. Although the stimulus pulse would be expected to elicit release of other transmitters, initial DA release is unaffected by subsequent receptor activation by these transmitters. Previous studies have confirmed the independence of single-pulse evoked [DA]o from regulation by glutamate and GABA by the lack of effect on signal amplitude and time course in striatum and SNc by a cocktail of receptor antagonists: AP5 (NMDA), GYKI-52466 (AMPA), picrotoxin (GABAA), and saclofen (GABAB) (Chen et al., 2006). Indeed, evaluation of the effect of a concurrently released transmitter on evoked DA release requires multiple-pulse stimulation (e.g., Chen and Rice, 2002; Avshalumov et al., 2003). The lack of effect of receptor antagonists on single-pulse evoked [DA]o also implies the absence of tonic glutamatergic or GABAergic regulation of DA in our slice preparations. Consequently, these antagonists were not added to the aCSF in the present studies. Stimulus pulse duration was 1 ms with amplitudes of 0.7–1.0 mA. In dorsal striatum and NAc, consistent evoked [DA] o can be elicited with repetitive local stimulation (Bull et al., 1990; Patel et al., 1995; Chen and Rice, 2001). Here, axonal DA release in dorsal striatum and NAc shell was evoked at 10-min intervals; the third of three consistent evoked increases in [DA]o was included in the data average for each [Ca2+]o. In SNc and VTA, maximal release is often seen with the first stimulus, then decreases with repetition (Rice et al., 1997). Thus, DA release obtained from two sites in medial SNc and in VTA were averaged for inclusion in the data set for a given [Ca2+]o, then the procedure repeated with a different [Ca2+]o on the contralateral side.
Drugs and Chemicals
Sulpiride, DA, EGTA, and components of aCSF and HEPES-aCSF were obtained from Sigma-Aldrich Chemical Co. (St. Louis, MO); GBR-12909 was from Tocris Bioscience (Ellisville, MO). All solutions were made immediately before use.
Statistical Analysis
Data are given as normalized means ± SEM, where n = number of slices. Maximum evoked [DA]o in 1.5 mM [Ca2+]o for each region was considered to be 100%. Differences in evoked [DA]o in varying [Ca2+]o vs. control were assessed using one-way ANOVA followed by Kruskal–Wallis post-hoc analysis. Normalized peak [DA]o data in each [Ca2+]o were also analyzed using the Hill equation to determine Ca2+ cooperativity for each region (Schneggenburger and Neher, 2000).
Results
Ca2+ Dependence of Single-Pulse Evoked DA Release in Dorsal Striatum and SNc
In dorsal striatum, axonal DA release elicited by a single-pulse showed a marked dependence on [Ca2+]o (Figures 1A,B). Evoked [DA]o was below the detection limit at 0 and 0.5 mM [Ca2+]o, was detectable at 1 mM [Ca2+]o, then increased progressively with further increases in [Ca2+]o. Peak evoked [DA]o was 1.32 ± 0.18 μM (n = 6) in 1.5 mM [Ca2+]o. This [Ca2+]o (1.5 mM) is roughly physiological and therefore was used as the reference (control) level, and considered to be 100%. Demonstrating the marked Ca2+-dependence of axonal DA release, peak evoked [DA]o in 1.0 mM Ca2+ was 30 ± 7% of control (Figures 1A,B). Increasing [Ca2+]o to 2.0, 2.4, and 3.0 mM increased evoked [DA]o to 154 ± 12%, 261 ± 42%, and 315 ± 37% of control, respectively. Each increase in evoked [DA]o differed significantly from control in 1.5 mM Ca2+ (n = 5–6; p < 0.01–0.001 vs. control). The Ca2+-dependence of single-pulse evoked DA release in dorsal striatum was roughly sigmoidal (Figure 1B).
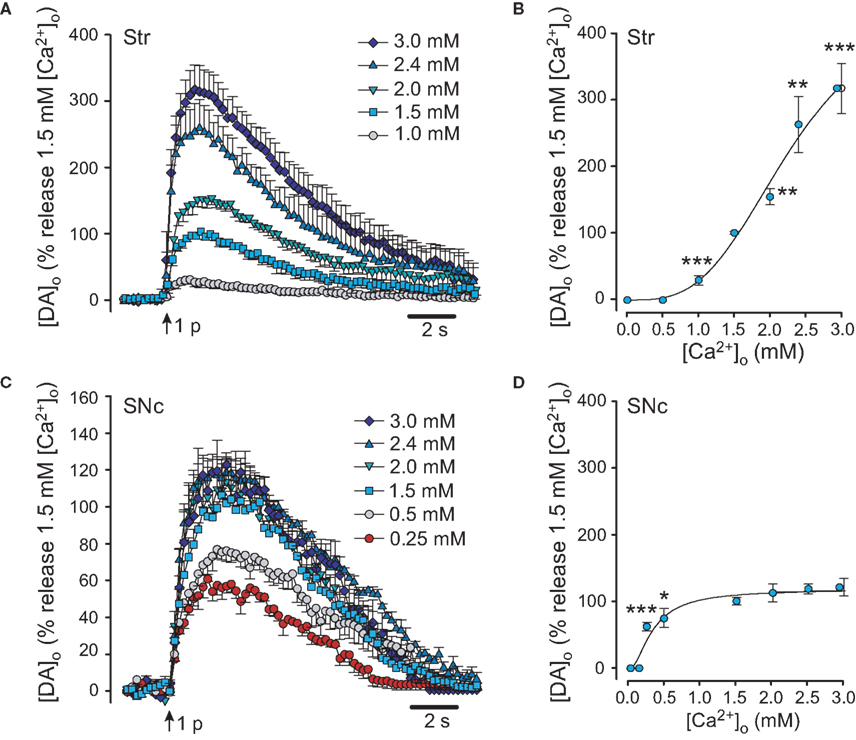
Figure 1. Ca2+ dependence of evoked synaptic DA release in dorsal striatum and SNc. (A) Average single-pulse evoked [DA]o in dorsal striatum in varying [Ca2+]o. Maximum [DA]o in 1.5 mM [Ca 2+]o in dorsal striatum was taken as 100%. Release could not be evoked in [Ca 2+]o ≤ 0.5 mM, but increased progressively as [Ca 2+]o was increased from 1.0 to 3.0 mM. (B) Ca2+-dependence of DA release in dorsal striatum. Significance of difference from peak [DA]o in 1.5 mM [Ca2+]o is indicated by **p < 0.01 or ***p < 0.001 (n = 5–6). (C) Average single-pulse evoked [DA]o in SNc in varying [Ca2+]o. Maximum [DA]o in 1.5 mM [Ca2+]o in SNc was taken as 100%. Somatodendritic release of DA could be seen at [Ca2+]o ≥ 0.25 mM. Release was maximal in 1.5 mM [Ca2+]o. (D) Ca2+ dependence of evoked DA release in SNc. In contrast to the Ca2+-dependence of axonal DA release in dorsal striatum, somatodendritic release was already more than half-maximal in 0.25 mM [Ca2+]o, but then reached a plateau at [Ca2+]o ≥ 1.5 mM. Significance of difference from peak [DA]o in 1.5 mM [Ca2+]o is indicated by *p < 0.01 or ***p < 0.001 (n = 6–12).
In the SNc, evoked [DA]o was not detected in 0 mM [Ca2+]o (0 added Ca2+ plus 1 mM EGTA) affirming that somatodendritic DA release requires Ca2+ influx (Patel et al., 2009). The lowest [Ca2+]o at which there was detectable evoked [DA]o in the SNc was 0.25 mM (Figures 1C,D). Peak evoked [DA]o in SNc in 1.5 mM [Ca2+]o was again considered to be 100%. Evoked [DA]o was 0.70 ± 0.04 μM in 1.5 mM Ca2+ (n = 12). In 0.25 mM [Ca2+]o, evoked DA release was 62 ± 5% of that in 1.5 mM [Ca2+]o (n = 6; p < 0.001; Figures 1C,D). This level of stimulated [DA]o was further elevated in 0.5 mM [Ca2+] o, to 74 ± 13%, however it remained significantly lower than control (n = 6; p < 0.05). Similar to pulse-train evoked [DA]o (Chen and Rice, 2001), single-pulse evoked [DA]o reached a plateau at higher levels of [Ca2+]o, with no significant difference seen between release in 1.5 mM [Ca2+]o and that in 2.0 mM (112 ± 13%; n = 7), 2.4 mM (118 ± 7%; n = 10), or 3.0 mM [Ca2+]o (121 ± 13%; n = 6; p > 0.05 for each vs. control; Figure 1D).
Ca2+ Dependence of Single-Pulse Evoked DA Release in NAc and VTA
Single-pulse evoked DA release in the NAc shell showed a strong Ca2+ dependence (Figures 2A,B), which was similar to that seen in dorsal striatum (Figures 1A,B). In the NAc, evoked [DA]o was also undetectable in 0 and 0.5 mM [Ca2+]o, then increased progressively with increasing [Ca2+]o. Peak evoked [DA]o was 0.46 ± 0.10 μM (n = 7) in 1.5 mM [Ca2+]o and was taken as the control level. Peak evoked [DA]o in 1.0 mM [Ca2+]o was 31 ± 16% of control (Figures 2A,B). Increasing [Ca2+]o to 2.0, 2.4, and 3.0 mM increased evoked [DA]o to 193 ± 42%, 271 ± 42%, and 313 ± 57% of control, respectively. Each increase in [DA]o differed significantly from control evoked [DA]o in 1.5 mM [Ca2+]o (n = 7; p < 0.001 for each vs. control).
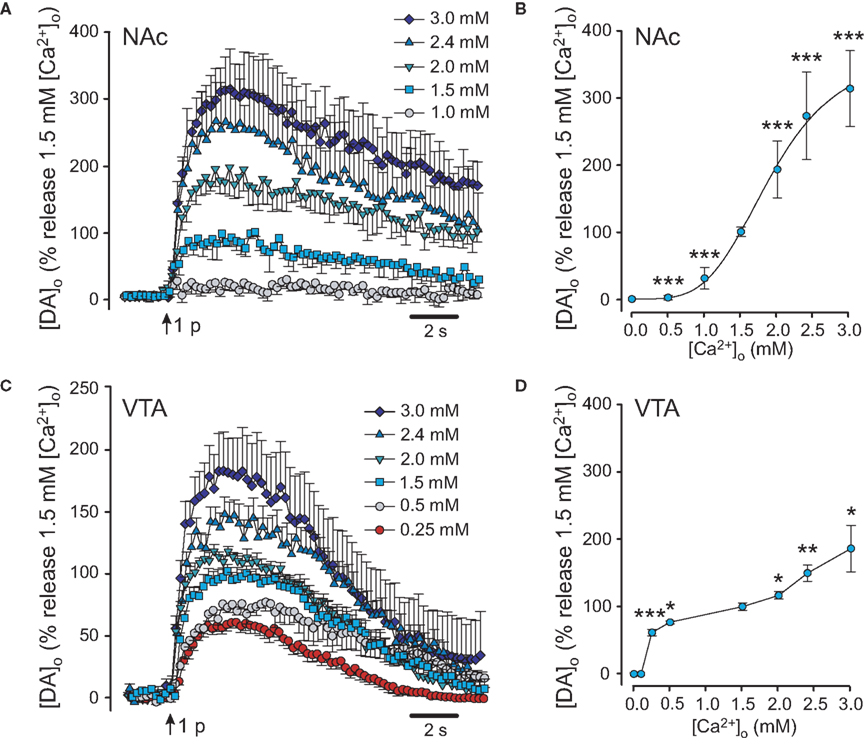
Figure 2. The Ca2+ dependence of DA release in NAc and VTA. (A) Average evoked [DA]o in the presence of varying [Ca2+]o in NAc shell. Maximum [DA]o in 1.5 mM [Ca2+]o in NAc was taken as 100%. As in dorsal striatum, synaptic DA release in NAc could not be evoked in [Ca2+o ≤ 0.5 mM, but increased progressively as [Ca2+]o was increased from 1.0 to 3.0 mM. (B) Ca2+ dependence of evoked DA release in NAc. Significance of difference from peak [DA]o in 1.5 mM [Ca2+]o is indicated by ***p < 0.001 (n = 7). (C) Average evoked [DA]o in the VTA the presence of varying [Ca2+]o. Maximum [DA]o in 1.5 mM [Ca2+]o in VTA was taken as 100%. Somatodendritic release characteristics were evident in the robust DA release seen in 0.25 mM [Ca2+]o. Unlike pure somatodendritic release in the SNc, however, evoked [DA]o in the VTA continued to increase as [Ca2+]o was increased beyond 1.5 mM. (D) Ca2+ dependence of evoked DA release in the VTA. In low [Ca2+]o (<1 mM), the pattern of evoked release in the VTA resembled that seen in SNc. However, release in the VTA did not plateau at [Ca2+o ≥ 1.5 mM, as it did in SNc (Figure 1D). Significance of difference from peak [DA]o in 1.5 mM [Ca2+]o is indicated by *p < 0.05, **p < 0.01, or ***p < 0.001 (n = 6–16).
In the VTA, the lowest [Ca2+]o at which a response was seen was again 0.25 mM (Figures 2C,D), with undetectably low release in 0 mM [Ca2+]o. Peak evoked [DA]o in 1.5 mM [Ca2+]o was 0.68 ± 0.06 μM (n = 9) and was considered to be control release for the VTA. Peak evoked [DA]o in 0.25 mM [Ca2+]o was 62 ± 5% of that in 1.5 mM [Ca2+]o (n = 9; p < 0.001 vs. control). Stimulated [DA]o was further elevated in 0.5 mM [Ca2+]o, to 77 ± 2% (n = 3; p < 0.05 vs. control). Unlike evoked [DA]o in SNc, however, single-pulse evoked [DA]o in the VTA did not plateau at [Ca2+]o ≥ 1.5 mM, but continued to increase with increasing [Ca2+]o. Evoked [DA]o in 2.0 mM [Ca2+]o was 117 ± 5% of control (n = 9; p < 0.05 vs. control), 150 ± 12% in 2.4 mM (n = 16; p < 0.01 vs. control), and 186 ± 34% in 3.0 mM [Ca2+]o (n = 8; p < 0.05 vs. control; Figures 2C,D). Thus, DA release in the VTA shows characteristics of axonal, as well as somatodendritic release.
Hill Analysis of the Ca2+ Dependence of Single-Pulse Evoked DA Release
The Ca2+-dependence data from each region was evaluated further using a three-parameter Hill analysis, in which the slope determined indicates the power of the Ca2+ dependence (Figure 3). Fitting the normalized points for dorsal striatum to Hill’s function (Schneggenburger and Neher, 2000) gave a slope of 3.2, which indicates an approximately third-power dependence on [Ca2+]o (Figure 3A). By contrast, Hill analysis of the Ca2+ dependence of DA release in the SNc gave a slope of only 1.6 (Figure 3A), confirming a more shallow dependence on [Ca2+]o for somatodendritic DA release in the SNc than for axonal DA release in dorsal striatum. The slope for the NAc shell was 4.0 (Figure 3B), which did not differ significantly from that determined for dorsal striatum (p > 0.05). Differing from all these regions, however, two distinct Hill fits were required for the VTA: the slope for evoked [DA]o in [Ca2+]o ≤ 1.5 mM was 1.0, whereas that for [Ca2+]o ≥ 1.0 mM was 3.5 (Figure 3B). These data are consistent with dual characteristics of somatodendritic and axonal DA release in the VTA.
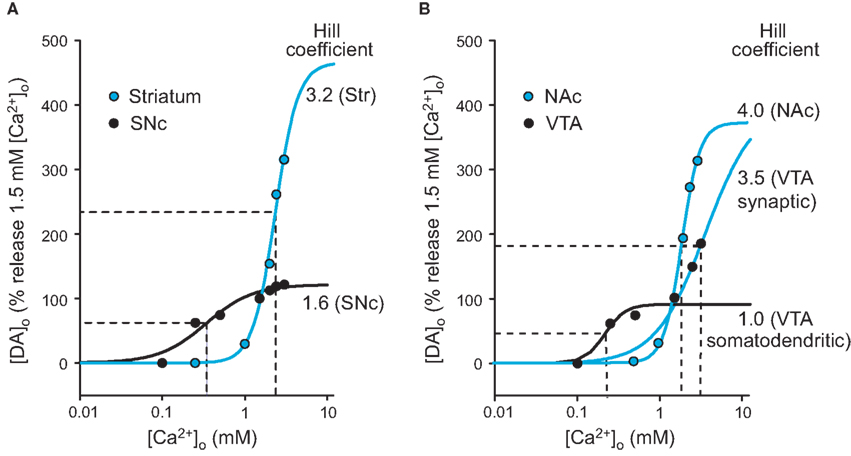
Figure 3. Hill analysis of the Ca2+-dependence of nigrostriatal and mesolimbic DA release. Single-pulse evoked [DA]o data normalized to peak evoked [DA]o in 1.5 mM [Ca2+]o as 100% for each region for (A) dorsal striatum and SNc and (B) NAc and VTA. Blue lines indicate Hill fit for axonal release, black lines for somatodendritic release. The Hill coefficient for each fit indicates the exponential dependence of DA release on [Ca2+]o. Both axonal and somatodendritic were needed to fit data from the VTA ([Ca2+]o < 1.5 mM vs. [Ca2+o > 1.0 mM) (B). The x-axis for each Hill plot was extended to 10 mM [Ca2+]o to permit extrapolation of the Ca2+ dependence to a roughly maximal level for each region. These expanded plots permitted calculation of an EC50 (the [Ca2+] o at which DA release is half-maximal) for each region (dashed lines). The EC50 for dorsal striatum was 2.3 mM [Ca2+]o and that for SNc was 0.3 mM. In NAc, EC50 was 1.9 mM, with 0.3 mM for somatodendritic release in VTA. Data points (taken from Figures 1B,D and 2B,D) are given as means without error bars for clarity.
The [Ca2+]o at which evoked [DA]o was half-maximal, the EC50, was also determined from the Hill plots to indicate the relative Ca2+ sensitivity for DA release in each region. The EC50 for dorsal striatum was 2.3 mM [Ca2+]o, but only 0.3 mM [Ca2+]o in SNc. Similarly, the EC50 for NAc was 1.9 mM [Ca2+]o, but only 0.3 mM [Ca2+]o for somatodendritic DA release in the VTA (Figure 3).
Discussion
We determined the Ca2+ dependence of single-pulse axonal and somatodendritic DA release in the nigrostriatal and mesolimbic pathways using a defined series of [Ca2+]o in brain slices. We show that DA release in the SNc and VTA has a lower [Ca2+]o threshold and exhibits lower Ca2+ cooperativity than seen with axonal DA release in the dorsal striatum and NAc shell. Moreover, somatodendritic DA release in the SNc is maximal at near physiological [Ca2+]o, whereas axonal release shows an exponential increase with increasing [Ca2+]o. In contrast to the SNc, however, DA release in the VTA exhibits a low affinity, high cooperativity axonal component, as well as a high affinity, low cooperativity somatodendritic component. These data are the first to reveal functional somatodendritic and axonal DA release in VTA, consistent with predictions from VTA microanatomy.
Comparison with Pulse-Train Evoked DA Release
Patterns of DA release evoked by single-pulse stimulation in dorsal striatum and SNc in defined [Ca2+]o (Figure 1) paralleled those seen with pulse-train stimulation reported previously (Chen and Rice, 2001). Given the absence of regulation of single-pulse evoked release by concurrently released glutamate and GABA acting at ionotropic receptors (Chen et al., 2006), this indicates that the basic patterns are not influenced significantly by the Ca2+-dependence of other transmitters. This is important because somatodendritic DA release in the SNc can be strongly inhibited by GABAergic input (Chen and Rice, 2002), which would be expected to increase progressively with increasing [Ca2+]o. Consequently, increasing suppression of DA release from Ca2+-dependent GABA release with increasing [Ca2+]o might have contributed to the plateau in [DA]o evoked by multiple-pulse stimulation reported previously (Chen and Rice, 2001). However, the new single-pulse DA release data in the present report demonstrate that the predominant contributing factor to the plateau is the Ca2+ dependence of the DA release process itself.
What might contribute to the plateau in evoked [DA]o in SNc? Possible factors include saturation of Ca2+ influx and depletion of the readily releasable pool (RRP) of DA (e.g., Südhof, 2000). Given that the relationship between [Ca2+]o and [Ca2+]i is usually assumed to be linear (Dodge and Rahamimoff, 1967; Reid et al., 1998), with saturation of Ca2+ influx only at [Ca2+]o ≫ 10 mM (see Church and Stanley, 1996), this leaves depletion of the RRP as the more likely explanation, as seen at the calyx of Held synapse (Schneggenburger et al., 1999). The observation that evoked [DA] o in the SNc plateaued at a ∼10-fold lower [Ca2+]o than that predicted for dorsal striatum or NAc (Figures 3A,C) is consistent with the limited number of vesicles and presence of alternative DA storage sites in SNc DA somata and dendrites (Wilson et al., 1977; Wassef et al., 1981; Groves and Linder, 1983; Nirenberg et al., 1996), as well as the ∼10-fold lower DA content of SNc and VTA compared to striatum (Rice et al., 1997).
Differences in the Ca2+-Dependence of DA Release between Striatum and Midbrain
In dorsal striatum and NAc shell, evoked [DA]o was detectable from 1.0 mM [Ca2+]o and increased exponentially as [Ca2+]o was increased to 3.0 mM. The similarity of [Ca2+]o threshold and the exponential dependence of DA release in these regions suggest that basic Ca2+-dependent release mechanisms are homogenous throughout the striatal complex. In SNc and VTA, however, evoked [DA]o was detectable in 0.25 mM [Ca2+]o, at which evoked [DA]o was already at 60% of control levels in both midbrain regions. In contrast to the plateau seen in SNc, however, single-pulse evoked DA release in the VTA continued to rise with increasing [Ca2+]o.
Hill analysis of the Ca2+-dependence data for striatum and SNc, as well as for NAc and the somatodendritic component of DA release in the VTA, revealed an approximately two-fold greater dependence on [Ca2+]o for axonal vs. somatodendritic release (Figure 3). Axonal DA release in dorsal striatum was dependent on the third-power of [Ca2+]o, indicating that DA release in this region requires the cooperative action of three Ca2+ ions. These data are strikingly consistent with the third-power dependence for DA release from striatal synaptosomes reported by Nachshen and Sanchez-Armass (1987), who used completely different methods of DA detection and data analysis than those used here. Similarly, axonal DA release in the NAc shell showed a fourth-power dependence in the present studies. The Ca2+ dependence of axonal DA release in both regions was within range of other well-examined synaptic systems that use glutamate as their transmitter, with a second-power dependence on [Ca2+]o at the squid giant synapse (Katz and Miledi, 1970), the cerebellar parallel fiber-Purkinje cell synapse (Mintz et al., 1995), and the hippocampal Schaeffer collateral synapses (Qian et al., 1997), but a fourth-power at the neuromuscular junction (Dodge and Ramahmimoff, 1967) and a fifth-power dependence at the calyx of Held synapse (Bollmann et al., 2000; Schneggenburger and Neher, 2000; Sun et al., 2007). By contrast, the dependence of somatodendritic release was less than to the second-power, and thus lower than the dependence for these established synaptic systems.
These differences between axonal and somatodendritic DA release, although consistent with previous studies in guinea-pig brain slices (Chen and Rice, 2001), contrast with recent findings from mouse brain slices, in which no difference in the Ca2+ dependence of DA release between dorsal striatum and either SNc or VTA was observed (Ford et al., 2010). Given that both sets of studies used similar methods, the simplest explanation for the discrepancy in SNc responsiveness may be a species difference. Mouse (and rat) SNc show a marked contribution from axonal serotonin (5-HT) input to the voltammetric signal (Cragg et al., 1997b; John et al., 2006; Ford et al., 2010). However, in the guinea-pig SNc, pure DA release is observed (Cragg et al., 1997b; Rice et al., 1997). Thus, the axonal-like Ca2+ dependence of the release signal in mouse SNc (Ford et al., 2010) is likely to include a significant component of axonal 5-HT release, which could mask the [DA]o plateau reported here. Contributions from 5-HT would be amplified by the higher sensitivity of carbon-fiber electrodes for 5-HT vs. DA (O’Connor and Kruk, 1991; Patel et al., 1992). Interestingly, the Ca2+ dependence reported for mouse VTA over a range of 0.5–2.5 mM [Ca2+] o (Ford et al., 2010) is similar to that reported here for guinea-pig VTA (Figure 2D). Given that the somatodendritic characteristics of DA release in the VTA are discerned only at [Ca2+]o ≤ 0.5 mM, the evoked [DA]o response at [Ca2+]o ≥ 0.5 mM would reflect primarily axonal contributions, as reported here for the first time, and therefore would not be expected to differ from that in striatum.
Differential Ca2+ Sensitivity of Somatodendritic Versus Axonal DA Release
Comparison of EC50 values for the Ca2+ dependence of DA release in each region revealed that the Ca2+ sensitivity for somatodendritic DA release is six- to seven-fold higher than for axonal release, supporting our earlier hypothesis that a minimal level of Ca2+ entry is enough to trigger pure somatodendritic DA release (Chen and Rice, 2001; Chen et al., 2006; Patel et al., 2009). The reasons for the greater sensitivity of somatodendritic DA release to [Ca2+]o are not yet clear, but could reflect a combination of several contributing factors. One known factor is the involvement of intracellular Ca2+ store activation in amplifying somatodendritic DA release in the SNc (Patel et al., 2009). This amplification can involve store activation by either ryanodine receptors, which are localized near the plasma membrane in SNc DA neurons, or IP3 (inositol-1,4,5-triphosphate) receptors. Notably, facilitation of DA release in the SNc by activation of ryanodine receptors is enhanced in low vs. high [Ca2+]o (Patel et al., 2009), which may contribute to the pattern of Ca2+ sensitivity of DA release reported here.
In addition, although the difference in the Ca2+ sensitivity of somatodendritic and axonal DA release might suggest a difference in release mechanism, the goodness-of-fit of the Hill plots for midbrain and striatum (Figure 3) suggests a common Ca2+-dependent exocytotic process in both. Indeed, there is an absolute requirement for Ca2+-influx to trigger somatodendritic release, as release is abolished in Ca2+-free aCSF (Figures 1D and 2D) and in the presence of the Ca2+ channel blocker Cd2+ (Patel et al., 2009). Moreover, DA release from primary cultures is suppressed by disruption of SNARE proteins (Fortin et al., 2006), consistent with an exocytotic mechanism underlying somatodendritic DA release.
On the other hand, the higher Ca2+ sensitivity and lower Ca2+ cooperativity of somatodendritic vs. axonal DA release support the idea that exocytotic machinery may differ between these release sites (Bergquist et al., 2002; Fortin et al., 2006; Witkovsky et al., 2009). For example, the Ca2+-sensing protein primarily responsible for triggering exocytotic transmitter release is synaptotagmin (Südhof and Rizo, 1996; Südhof, 2000, 2002; Chapman, 2002) of which there are at least eight different isoforms with differing Ca2+ affinities in vertebrate brain (Südhof, 2002). For example, synaptotagmin 1 and 2, which are the predominant isoforms found on vesicles involved in fast synaptic transmission (Xu et al., 2007), have a have a 10–20-fold lower Ca2+ affinity than those of synaptotagmin 7 and 3 (Südhof, 2002; Sugita et al., 2002a,b). Notably, DA neurons in the SNc lack synaptotagmin 1 and 2 (Witkovsky et al., 2009), but express synaptotagmin 7 (Mendez et al., 2011), which may contribute to the higher Ca2+ sensitivity of somatodendritic release. Thus, the presence of different synaptotagmin isoforms in different neurons or different compartments of the same neuron could alter the Ca2+ sensitivity and kinetics of transmitter release. The somatodendritic compartment of DA neurons also expresses different complements of SNARE proteins than found at axon terminals (Bergquist et al., 2002; Witkovsky et al., 2009).
Axonal as well as Somatodendritic DA Release Characteristics of the VTA
In the VTA, DA release showed high Ca2+ sensitivity like that in SNc, consistent with somatodendritic release. However, the exponential increase in evoked [DA]o with increasing [Ca2+]o indicated an axonal component, as well. Thus, the Ca2+ dependence of somatodendritic DA release differentiates this process from axonal release. These distinctions reveal that the VTA exhibits both somatodendritic and axonal DA release, consistent with the microanatomy of this region, which includes DA axons, as well as DA somata and dendrites. Indeed, the VTA has DA synapses arising from its own axon collaterals, as well as minor synaptic input from the SNc (Deutch et al., 1988; Bayer and Pickel, 1990). Although sparse, the axonal component of VTA DA release reported here is robust, and is likely to be a contributing factor in the ability of the VTA to sustain DA release with repetitive stimulation (e.g., Iravani et al., 1996). Indeed, because of this potential confounding factor, mechanistic studies of somatodendritic DA release have often focused on the SNc (e.g., Chen and Rice, 2001; Patel et al., 2009; Witkovsky et al., 2009), because the SNc is devoid of dopaminergic collaterals and axonal synapses (Juraska et al., 1977; Wassef et al., 1981). The dual nature of DA release in the VTA also implies that factors in addition to Ca2+ may differentially affect the two components. For example, DA neuron firing rate might be a key regulator of the somatodendritic component, whereas local presynaptic regulation might independently suppress or enhance axonal release consequent to neuronal activity.
Conclusion
The present studies demonstrate two key differences between axonal and somatodendritic DA release: low sensitivity, but high cooperativity of axonal release throughout striatum; and high sensitivity and low cooperativity in the midbrain. Based on these distinct features, we conclude that the VTA exhibits both somatodendritic and axonal DA release, providing new insight into DA signaling in this region. Additionally, these findings suggest that disease states that affect vesicle release or calcium entry could have differential consequences among the brain regions examined here. Conditions in which DA levels were depleted, but not eliminated, would not be expected to alter the Ca2+ dependence patterns reported, assuming the only change was in the size of the releasable pool of DA. However, this might not be the case in disease states that affect transmitter release machinery, for example deletion or mutation of proteins that associate with synaptic vesicles. In support of this hypothesis, altered Ca2+ dependence of axonal DA release in dorsal striatum has been reported following knockout of α-synuclein in a model of Parkinson’s disease (Abeliovich et al., 2000) and with over-expression of mutant torsinA, the product of the DYT1 gene underlying early onset dystonia (Bao et al., 2010).
Conflict of Interest Statement
The authors declare that the research was conducted in the absence of any commercial or financial relationships that could be construed as a potential conflict of interest.
Acknowledgments
Supported by NIH/NINDS Grant NS036362 (MER) and NIH-NIDCD Training Grant 5T32 DC000063 (KAM). We are grateful to Dr Paul Witkovsky for a critical reading of the manuscript.
References
Abeliovich, A., Schmitz, Y., Fariñas, I., Choi-Lundberg, D., Ho, W. H., Castillo, P. E., Shinsky, N., Verdugo, J. M., Armanini, M., Ryan, A., Hynes, M., Phillips, H., Sulzer, D., and Rosenthal, A. (2000). Mice lacking α-synuclein display functional deficits in the nigrostriatal dopamine system. Neuron 25, 239–252.
Avshalumov, M. V., Chen, B. T., Marshall, S. P., Pena, D. M., and Rice, M. E. (2003). Glutamate-dependent inhibition of dopamine release in striatum is mediated by a new diffusible messenger, H2O2. J. Neurosci. 23, 2744–2750.
Bao, L., Patel, J. C., Walker, R. H., Shashidharan, P., and Rice, M. E. (2010). Dysregulation of striatal dopamine release in a mouse model of dystonia. J. Neurochem. 114, 1781–1791.
Bayer, V. E., and Pickel, V. M. (1990). Ultrastructural localization of tyrosine hydroxylase in the rat ventral tegmental area: relationship between immunolabeling density and neuronal associations. J. Neurosci. 10, 2996–3013.
Bergquist, F., Niazi, H. S., and Nissbrant, H. (2002). Evidence for different exocytosis pathways in dendritic and terminal dopamine release in vivo. Brain Res. 950, 245–253.
Bers, D. M. (1982). A simple method for the accurate determination of free [Ca] in Ca-EGTA solutions. Am. J. Physiol. 242, C404–C408.
Björklund, O., and Lindvall, O. (1975). Dopamine in dendrites of substantia nigra neurons: suggestions for a role in dendritic terminals. Brain Res. 83, 531–537.
Bollmann, J. H., Sakmann, B., and Borst, J. G. (2000). Calcium sensitivity of glutamate release in a calyx-type terminal. Science 289, 953–957.
Bull, D. R., Palij, P., Sheehan, M. J., Millar, J., Stamford, J. A., Kruk, Z. L., and Humphrey, P. P. (1990). Application of fast cyclic voltammetry to measurement of electrically evoked dopamine overflow from brain slices in vitro. J. Neurosci. Meth. 32, 37–44.
Chapman, E. R. (2002). Synaptotagmin: Ca2+ sensor that triggers exocytosis? Nat. Rev. Mol. Cell Biol. 3, 498–508.
Chen, B. T., Kume-Kick, J., and Rice, M. E. (1999). Calibration factors for cationic and anionic neurochemicals at carbon-fiber microelectrodes are oppositely affected by the presence of Ca2+ and Mg2+. Electroanalysis 11, 344–348.
Chen, B. T., Moran, K. A., Avshalumov, M. V., and Rice, M. E. (2006). Limited regulation of somatodendritic dopamine release by voltage-sensitive Ca2+ channels contrasted with strong regulation of axonal dopamine release. J. Neurochem. 96, 645–655.
Chen, B. T., and Rice, M. E. (2001). Novel Ca2+ dependence and time course of somatodendritic dopamine release: substantia nigra vs. striatum. J. Neurosci. 21, 7841–7847.
Chen, B. T., and Rice, M. E. (2002). Synaptic regulation of somatodendritic dopamine release by glutamate and GABA differs between substantia nigra and ventral tegmental area. J. Neurochem. 81, 158–169.
Chéramy, A., Leviel, V., and Glowinski, J. (1981). Dendritic release of dopamine in the substantia nigra. Nature 289, 537–542.
Church, P. J., and Stanley, E. F. (1996). Single L-type calcium channel conductance with physiological levels of calcium in chick ciliary ganglion neurons. J. Physiol. 496, 59–68.
Cragg, S. J., and Greenfield, S. A. (1997). Differential autoreceptor control of somatodendritic and axon terminal dopamine release in substantia nigra, ventral tegmental area, and striatum. J. Neurosci. 17, 5738–5746.
Cragg, S. J., Rice, M. E., and Greenfield, S. A. (1997a). Heterogeneity of electrically evoked dopamine release and reuptake in substantia nigra, ventral tegmental area, and striatum. J. Neurophysiol. 77, 863–873.
Cragg, S. J., Hawkey, C. R., and Greenfield, S. A. (1997b). Comparison of serotonin and dopamine release in substantia nigra and ventral tegmental area: region and species differences. J. Neurochem. 69, 2378–2386.
Dahlström, A., and Fuxe, K. (1964). Evidence for the existence of monoamine-containing neurons in the central nervous system. Demonstration of monoamines in the cell bodies of brain stem neurons. Acta Physiol. Scand. 62, 1–55.
Deutch, A. Y., Goldstein, M., Baldino, F. Jr., and Roth, R. H. (1988). Telencephalic projections of the A8 dopamine cell group. Ann. N. Y. Acad. Sci. 537, 27–50.
Dodge, F. A. Jr., and Rahamimoff, R. (1967). Cooperative action of calcium ions in transmitter release at the neuromuscular junction. J. Physiol. (Lond.) 193, 419–432.
Fallon, J. H., and Moore, R. Y. (1978). Catecholamine innervation of the basal forebrain. IV. Topography of the dopamine projection to the basal forebrain and neostriatum. J. Comp. Neurol. 180, 545–580.
Ford, C. P., Gantz, S. C., Phillips, P. E., and Williams, J. T. (2010). Control of extracellular dopamine at dendrite and axon terminals. J. Neurosci. 30, 6975–6983.
Fortin, G. D., Desrosiers, C. C., Yamaguchi, N., and Trudeau, L.-E. (2006). Basal somatodendritic dopamine release requires snare proteins. J. Neurochem. 96, 1740–1749.
Geffen, L. B., Jessell, T. M., Cuello, A. C., and Iversen, L. L. (1976). Release of dopamine from dendrites in rat substantia nigra. Nature 260, 258–260.
Groves, P. M., and Linder, J. C. (1983). Dendro-dendritic synapses in substantia nigra: descriptions based on analysis of serial sections. Exp. Brain Res. 49, 209–217.
Hoffman, A. F., and Gerhardt, G. A. (1999). Differences in pharmacological properties of dopamine release between the substantia nigra and striatum: an in vivo electrochemical study. J. Pharmacol. Exp. Ther. 289, 455–463.
Iravani, M. M., Muscat, R., and Kruk, Z. L. (1996). Comparison of somatodendritic and axon terminal dopamine release in the ventral tegmental area and the nucleus accumbens. Neuroscience 70, 1025–1037.
Jaffe, E. H., Marty, A., Schulte, A., and Chow, R. H. (1998). Extrasynaptic vesicular transmitter release from the somata of substantia nigra neurons in rat midbrain slices. J. Neurosci. 18, 3548–3553.
John, C. E., Budygin, E. A., Mateo, Y., and Jones, S. R. (2006). Neurochemical characterization of the release and uptake of dopamine in ventral tegmental area and serotonin in substantia nigra of the mouse. J. Neurochem. 9, 267–282.
Juraska, J. M., Wilson, C. J., and Groves, P. M. (1977). The substantia nigra of the rat: a Golgi study. J. Comp. Neurol. 172, 585–600.
Katz, B., and Miledi, R. (1970). Further study of the role of calcium in synaptic transmission. J. Physiol. 207, 789–801.
Kume-Kick, J., and Rice, M. E. (1998). Dependence of dopamine calibration factors on media Ca2+ and Mg2+ at carbon-fiber microelectrodes used with fast-scan cyclic voltammetry. J. Neurosci. Meth. 84, 55–62.
Mendez, J. A., Bourque, M. J., Fasano, C., Kortleven, C., and Trudeau, L. E. (2011). Somatodendritic dopamine release requires synaptotagmin 4 and 7 and the participation of voltage-gated calcium channels. J. Biol. Chem. (in press).
Mintz, I. M., Sabatini, B. L., and Regehr, W. G. (1995). Calcium control of transmitter release at a cerebellar synapse. Neuron 15, 675–688.
Nachshen, D. A., and Sanchez-Armass, S. (1987). Co-operative action of calcium ions in dopamine release from rat brain synaptosomes. J. Physiol. (Lond.) 387, 415–423.
Nieoullon, A., Cheramy, A., and Glowinski, J. (1977). Release of DA in vivo from cat substantia nigra. Nature 266, 375–377.
Nirenberg, M. J., Chan, J., Liu, Y., Edwards, R. H., and Pickel, V. M. (1996). Ultrastructural localization of the vesicular monoamine transporter-2 in midbrain dopaminergic neurons: potential sites for somatodendritic storage and release of dopamine. J. Neurosci. 16, 4135–4145.
O’Connor, J. J., and Kruk, Z. L. (1991). Fast cyclic voltammetry can be used to measure stimulated endogenous 5-hydroxytryptamine release in untreated rat brain slices. J. Neurosci. Meth. 38, 25–33.
Patel, J., Trout, S. J., and Kruk, Z. L. (1992). Regional differences in evoked dopamine efflux in brain slices of rat anterior and posterior caudate putamen. Naunyn Schmiedebergs Arch. Pharmacol. 346, 267–276.
Patel, J., Trout, S. J., Palij, P., Whelpton, R., and Kruk, Z. L. (1995). Biphasic inhibition of stimulated endogenous dopamine release by 7-OH-DPAT in slices of rat nucleus accumbens. Br. J. Pharmacol. 115, 421–426.
Patel, J. C., Witkovsky, P., Avshalumov, M. V., and Rice, M. E. (2009). Mobilization of calcium from intracellular stores facilitates somatodendritic dopamine release. J. Neurosci. 20, 6568–6579.
Qian, J., Colmers, W. F., and Saggau, P. (1997). Inhibition of synaptic transmission by neuropeptide Y in rat hippocampal area CA1: modulation of presynaptic Ca2+ entry. J. Neurosci. 17, 8169–8177.
Reid, C. A., Bekkers, J. M., and Clements, J. D. (1998). N- and P/Q-type Ca2+ channels mediate transmitter release with a similar cooperativity at rat hippocampal autapses. J. Neurosci. 18, 2849–2855.
Rice, M. E., Cragg, S. J., and Greenfield, S. A. (1997). Characteristics of electrically evoked somatodendritic dopamine release in substantia nigra and ventral tegmental area in vitro. J. Neurophysiol. 77, 853–862.
Rice, M. E., Richards, C. D., Nedergaard, S., Hounsgaard, J., Nicholson, C., and Greenfield, S. A. (1994). Direct monitoring of dopamine and 5-HT release in substantia nigra and ventral tegmental area in vitro. Exp. Brain Res. 100, 395–406.
Schneggenburger, R., Meyer, A. C., and Neher, E. (1999). Release fraction and total size of a pool of immediately available transmitter quanta at a calyx synapse. Neuron 23, 399–409.
Schneggenburger, R., and Neher, E. (2000). Intracellular calcium dependence of transmitter release rates at a fast central synapse. Nature 406, 889–893.
Südhof, T. C., and Rizo, J. (1996). Synaptotagmins: C2-domain proteins that regulate membrane traffic. Neuron 17, 379–388.
Sugita, S., Shin, O.-H., Han, W., Lao, Y., and Südhof, T. C. (2002a). Synaptotagmins form a hierarchy of exocytotic Ca2+ sensors with distinct Ca2+ affinities. EMBO J. 21, 270–280.
Sugita, S., Han, W., Butz, S., Liu, X., Fernández-Chacón, R., Lao, Y., and Südhof, T. C. (2002b). Synaptotagmin VII as a plasma membrane Ca2+ sensor in exocytosis. Neuron 30, 459–473.
Sun, J., Pang, Z. P., Qin, D., Fahim, A. T., Adachi, R., and Südhof, T. C. (2007). A dual-Ca2+-sensor model for neurotransmitter release in a central synapse. Nature 450, 676–683.
Ungerstedt, U. (1971). Stereotaxic mapping of the monoaminergic pathways in the rat brain. Acta Physiol. Scand. Suppl. 367, 1–48.
Wassef, M., Berod, A., and Sotelo, C. (1981). Dopaminergic dendrites in the pars reticulata of the rat substantia nigra and their striatal input. Combined immunocytochemical localization of tyrosine hydroxylase and anterograde degeneration. Neuroscience 6, 2125–2139.
Wilson, C. J., Groves, P. M., and Fifková, E. (1977). Monoaminergic synapses, including dendro-dendritic synapses in the rat substantia nigra. Exp. Brain Res. 30, 161–174.
Witkovsky, P., Patel, J. C., Lee, C. R., and Rice, M. E. (2009). Immunocytochemical identification of proteins involved in dopamine release from the somatodendritic compartment of nigral dopaminergic neurons. Neuroscience 164, 488–496.
Keywords: Ca2+, dopamine, nucleus accumbens, somatodendritic release, striatum, substantia nigra, synaptic transmission, voltammetry
Citation: Chen BT, Patel JC, Moran KA and Rice ME (2011) Differential calcium dependence of axonal versus somatodendritic dopamine release, with characteristics of both in the ventral tegmental area. Front. Syst. Neurosci. 5:39. doi: 10.3389/fnsys.2011.00039
Received: 15 January 2011; Accepted: 23 May 2011;
Published online: 13 June 2011.
Edited by:
Elizabeth D. Abercrombie, Rutgers-Newark: The State University of New Jersey, USAReviewed by:
Alessandro Stefani, University of Rome, ItalyConstance Hammond, Université de la Méditerrannée, France
R. Mark Wightman, University of North Carolina at Chapel Hill, USA
Copyright: © 2011 Chen, Patel, Moran and Rice. This is an open-access article subject to a non-exclusive license between the authors and Frontiers Media SA, which permits use, distribution and reproduction in other forums, provided the original authors and source are credited and other Frontiers conditions are complied with.
*Correspondence: Margaret E. Rice, Department of Physiology and Neuroscience, New York University School of Medicine, 550 First Avenue, New York, NY 10016, USA. e-mail:bWFyZ2FyZXQucmljZUBueXUuZWR1