


- 1 Department of Computational Biology, Royal Institute of Technology, Stockholm, Sweden
- 2 Stockholm Brain Institute, Stockholm, Sweden
- 3 Stockholm University, Stockholm, Sweden
The organization of representations in the brain has been observed to locally reflect subspaces of inputs that are relevant to behavioral or perceptual feature combinations, such as in areas receptive to lower and higher-order features in the visual system. The early olfactory system developed highly plastic mechanisms and convergent evidence indicates that projections from primary neurons converge onto the glomerular level of the olfactory bulb (OB) to form a code composed of continuous spatial zones that are differentially active for particular physico-chemical feature combinations, some of which are known to trigger behavioral responses. In a model study of the early human olfactory system, we derive a glomerular organization based on a set of real-world, biologically relevant stimuli, a distribution of receptors that respond each to a set of odorants of similar ranges of molecular properties, and a mechanism of axon guidance based on activity. Apart from demonstrating activity-dependent glomeruli formation and reproducing the relationship of glomerular recruitment with concentration, it is shown that glomerular responses reflect similarities of human odor category perceptions and that further, a spatial code provides a better correlation than a distributed population code. These results are consistent with evidence of functional compartmentalization in the OB and could suggest a function for the bulb in encoding of perceptual dimensions.
1 Introduction
Complex repertoires of olfactory receptors (OR) evolved in different numbers over species. In humans, each ORN expresses only one of a possible 384 identified functional types (Aloni et al., 2006), and axons from ORNs that express the same type converge on the surface of the OB at stereotyped positions. The OB is a crucial processing station for olfactory signals (Buschhüter et al., 2008) and glomeruli are thought to be functional units and convergence target for axons from many ORNs of just one type of odorant receptor (OR) (Kauer and Cinelli, 1993; Mori, 1999; Bozza et al., 2002; Mombaerts, 2004), so that each odorant elicits a specific map of glomerular activation (e.g., Ressler et al., 1994). Olfactory bulb output neurons, mitral, and tufted cells (MT cells), project to primary olfactory cortical areas, such as the anterior olfactory nucleus, piriform cortex, olfactory tubercle and lateral entorhinal cortex, and the amygdala (Shipley et al., 2008). A schematic drawing of the organization of the early olfactory system is shown in Figure 1.
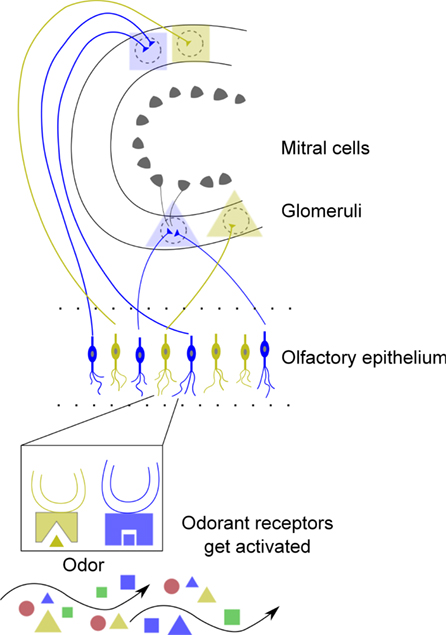
Figure 1. Schematic of the early olfactory system including the olfactory epithelium and bulb. Each ORN expresses one OR which responds to different odorants (see Figure 2). In the first step of the sensory pathway, odorant molecules bind to ORs in the olfactory cilium which activate ORNs in the epithelium which in turn transduce the input signal into action potentials. ORNs expressing the same OR generally project to the same glomerulus (Bozza et al., 2002; Mombaerts, 2004) and connect to the principal neurons of the OB, the mitral, and tufted cells (MT cells). These principal neurons forward their output to higher-order brain regions. Bulbar interneurons, granule cells (not shown) receive lateral inhibition and feedback from piriform cortex (Haberly and Price, 1977). The colors and symbols indicate molecular features of odorants and a chemotopic convergence from ORN axons to glomeruli. According to odotope theory (Shepherd, 1987; Mori, 1995), individual MT cells transmit information about a range of odor molecules with related molecular structures (so called odotopes). Cleland et al. (2007) and Johnson and Leon (2000) argued that qualitative odor perception is determined by glomerular activity patterns. They described also that different glomerular activity patterns, elicited, e.g., by increased concentration can lead to qualitatively different odor percepts.
Sensory axon coalescence onto glomeruli has been found to rely on several mechanisms that contribute differently on a local and global scale, some of which likely related to activity. It is known that ORN type-convergence onto glomeruli is at least partly mediated by experience (Yu et al., 2004; Kerr and Belluscio, 2006; Imai and Sakano, 2007) and that activity plays a role in axon fate (Ming et al., 2002; Mombaerts, 2006; Sakano, 2010; Mori and Sakano, 2011). In axon growth, direction of the axon’s growth cone is regulated by various chemical cues, diffusible chemoattractants, and repellants, in a series of discrete steps (Sanes and Jessell, 2000). Serizawa et al. (2006) found evidence in the mouse that correlation of neural activity mediated axonal attraction and repulsion by up- and down-regulation of a set of olfactory axon guidance cues, which suggested that axon sorting could be based on correlated neural activity.
It has been found at different levels of the brain, especially in the visual and auditory systems, that inputs are spatially embedded, so that the spatial structure of the nervous system reflects sensory stimuli within the environment, as well as the quality of the stimulus itself (cf. Udin and Fawcett, 1988; Singer, 1994; Malach et al., 2002). The spatial structure of representations in the brain has been observed in many parts of the brain to reflect locally subspaces of inputs that are behaviorally or perceptually relevant (e.g., Swindale, 2008; Humphries et al., 2010). In olfaction, discriminatory dimensions are still elusive (Sell, 2006; Haddad et al., 2008a), although several groups have found evidence for continuous spatial zones responsive for certain groups of odorants based on data accumulated using different techniques (e.g., Vassar et al., 1994; Meister and Bonhoeffer, 2001; Lodovichi et al., 2003; Mori et al., 2006, 2009; Johnson and Leon, 2007) and a systematic large-scale study of glomerular representations suggests that encoding is very local (Auffarth et al., 2011b). Evidence is now accumulating of behavioral relevance of molecular feature combinations and glomerular domains (e.g., Dielenberg and McGregor, 2001; Kobayakawa et al., 2007; Raman and Gutierrez-Osuna, 2009; Sakano, 2010). It has also been shown that perceptual differences can be predicted by glomerular spatial activity patterns (Uchida et al., 2000; Linster et al., 2001; Auffarth et al., 2011a).
We present a model of olfactory learning in humans in which competitive axonal wiring adaptations in the early olfactory system are a mechanism by which experiences are translated into memories expressed by structural changes of neurites and synapses. We set OR sensitivities as biologically relevant feature combinations in a set of real-world odorants. We cluster olfactory axons by an activity-dependent mechanism that results in a self-organization of glomeruli by the affinity of their corresponding ORs. After a description of the data used in our study and the model, we show results concerning the formation of glomeruli, the relationship between recruitment of glomeruli and concentration, and the match between glomerular responses and human perceptual ordering. For the last point, we compare codes of glomerular responses at population and spatial levels to human-rated perceptual similarities of odorant categories. The spatial code is a test of the hypothesis that distance between coding regions are relevant for behavior or perception. Finally, we discuss results in the context of olfactory information processing.
2 Materials and Methods
As commented in the introduction, there is no simple scale or known dimensionality to olfactory perception. Therefore one solution to order odorants is to represent them by a large number of molecular descriptors. (Haddad et al., 2008a) presented a set of 32 physico-chemical descriptors, derived from an initial set of 1,664 descriptors, that were shown to reflect variability of the bulb and antennal lobe population responses. In simple terms, this means that odors that cause similar responses are proximal in this space and odors that elicit dissimilar responses are distant. They supplied a dataset of 447 odorants described by these 32 properties as supplementary material with their paper, which we use this study.
We extracted perceptual odorant descriptors from flavor net (Acree and Arn, 1998)1, a public resource on volatile compounds that humans experience in their environment. Examples for these odor descriptors are sweet, camphoraceous, floral, or minty. We assigned these descriptors to categories defined by Zarzo (2008). These categories are florals, cleaner, foul, woody, medicinal, nutty/spicy, balsamic, fruity, alcohol, oily, herbacious, musk, vegetable, and green. From 238 compounds for which we had perceptual information, we could categorize 210 odorants into at least one of these 14 categories.
Our odorant receptors should be distributed to capture variance of the physical space and each be placed to recognize biologically relevant regions (compare Sánchez-Montañés and Pearce, 2002; Schmuker and Schneider, 2007 for similar concepts). We applied the fuzzy c-means algorithm (Bezdek, 1981) to draw cluster centers at locations in the 32-dimensional space. In this way, each OR responds to ligands that occupy a neighborhood in physical space as described by molecular descriptors. The closer the combination of molecular properties of an odorant to the center of the receptive field of the receptor, the higher the response. Each OR can be described by its center in the 32-dimensional space and its affinities to odorants based on the distance relation in the 32-dimensional space. OR–odorant affinity relationships are indicated by the circle radii in Figure 2.
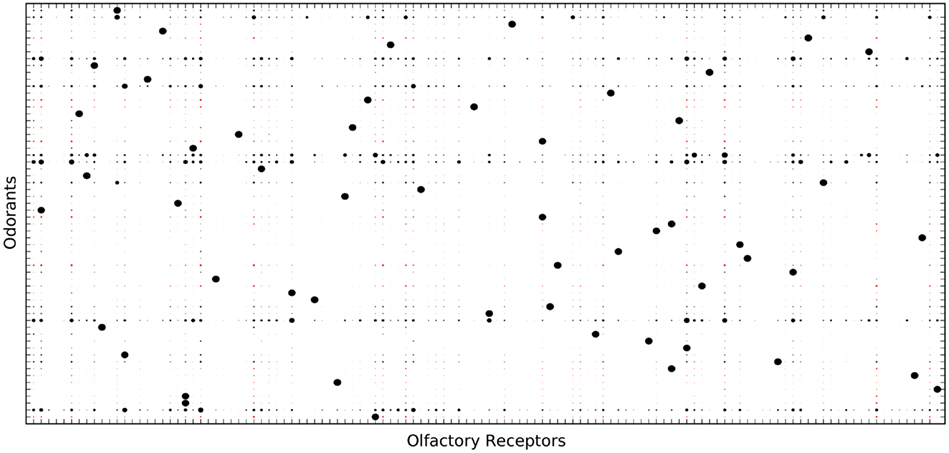
Figure 2. Olfactory receptor-odorant affinity matrix. In total, 384 ORs were generated with graded affinity to each of the 447 odorants. Shown is a subset of 60 ORs and the 30 odorants to which these ORs have the highest affinity. Affinity is indicated by the radii of the circles. Black circles stand for excitatory OR response, red circles stand for inhibitory responses.
We modeled ORN responses to ligands at a given concentration after Sandström et al. (2009a) as a sigmoidal function of the OR–ligand affinities. The response Ri(C) of ORN i to a ligand at concentration C is expressed as the product of a term Ai that represents the amplitude and a term that includes the ligand responses of ORs. ai is the affinity of receptor to the ligand and h is the gain (steepness) of the ORN response curve.

The response of ORN population i is expressed as the product of a term μA and a term that includes the ligand responses of homogeneous ORs. The mean frequency of responses was taken to be as in this formula (adapted from Sandström et al., 2009a):

We set the mean amplitude, μA, of ORNs to 1 and mean gain μh to 1.4. Please see Figure 3 for an illustration of ORN dose-response curves.
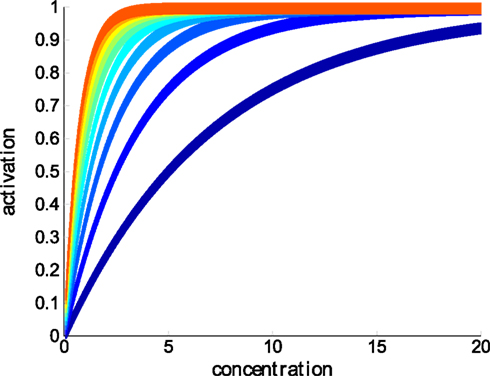
Figure 3. Dose-responses of ORNs of different OR types (affinities) to a single ligand at linearly increasing concentrations. Compare to Eq. 2.
We clustered ORN axon projections by a biomimetic method described in (Lansner et al., 2009). Using multi-dimensional scaling (MDS), axons can be put in a lower-dimensional space where their locations are defined by distance relations based on co-activation. In this way, the distances between glomeruli reflects regularities in the physical odor space. For distance relationships we calculated correlations between vectors of response activities of ORN populations to all odorants. We reduced the resulting matrix by MDS to three dimensions and obtained coordinate points corresponding to each olfactory axon bundle. MDS makes few assumptions about the structure of data and preserves the distance relationships among data samples. In total, this operation is similar in principle to the self-organizing map used as ORN convergence model used earlier (Gutierrez-Osuna, 2002; Schmuker and Schneider, 2007) and is consistent with the chemoaffinity hypothesis (Sperry, 1963).
We first show how glomerular structures could arise from activity-dependent mechanisms. For this purpose, we explicitly modeled ORN populations using Eq. 1. In the following we used the population Eq. 2.
After having obtained the spatial distribution of glomerular responses, we determined the activation loci for odor categories by the following procedure: We tested statistically for each glomerulus whether it showed significant differences with respect to the odor category by comparing responses to odors that belonged to an odor category with responses to odors that did not belong to the odor category. We did the comparison using the Wilcoxon ranked-sum test (also called Mann–Whitney U test). The test was applied within a bootstrap (Efron, 1982) resampling procedure in order to estimate distributions from small sample sizes and to account for unequal number of maps. We thresholded p-values at 5% significance. Thus, we found for each odor category, the glomeruli which are activated differentially. More details about this method are available in (Auffarth et al., 2011b).
We investigate how perceptual categories are represented in the olfactory bulb responses. Spatial coding refers to the situation, where specialized local encoders exist for certain information. This concept is opposed to population coding, where information is distributed in the responses of the population. We analyzed and compared glomerular responses to human perceptual categories.
Zarzo (Zarzo, 2008; Zarzo and Stanton, 2009) published analyses of two studies, perfumers’ odor perception space (BH, Boelens and Haring, 1981) and cross-cultural odor similarity ratings (Chrea, 2004). In order to know how well the coding as identified by the coding centers reflected perceptual orderings as reported in the literature, we mined PCA plots in the two papers by Zarzo, which indicated perceptual distances in the first two principal components between odorant qualities. This provided us with a pair-wise distance matrix between two sets of perceptual odor categories.
We extracted two distance matrices, DChrea and DBHsmall. Chrea corresponded to odor categories floral/cosmetic, cleaner, foul/musty, woody, medicinal, nutty/spicy, balsamic, and fruity. BH small corresponded to categories floral, woody, medicinal, balsamic, fruity. We compared matches to these perceptual spaces from both population activities of the entire glomerular layer and from spatial codes in order to see which reflected better these perceptual orderings.
In order to obtain population responses, we took the mean map over all activity maps corresponding to the same odor quality (cf. Rubin and Katz, 1999; Lin et al., 2006; Cleland et al., 2007). Thus, a population code for a given odor category A can be written as  where A is the set of odorants representing category A and 〈xi〉 stands for the mean response of glomerulus i averaged over all odorants belonging to A. As an ordering between properties we calculated the Euclidean distances between these mean-maps, thus obtaining pair-wise distances between odor qualities based on population code, DP.
As for the ordering between spatial zones, we applied the Hausdorff distance (cf. Alt et al., 2003), which calculates distances between two-dimensional shapes and therefore incorporates coding center distance (similar to Euclidean distances), but additionally information of shape, size, and orientation match. We applied the modified Hausdorff distance function (Dubuisson and Jain, 1994) between vertices of pairs of encoding zones. Vertices consisted of points that were found to be responsive to odor categories.
Informally, the Hausdorff distance is the farthest distance of closest points between two sets. Formally, given X and Y, two non-empty subsets of a metric space (M, d), their Hausdorff distance dH(X, Y) is defined as follows:
with sup and inf representing the supremum and infimum, respectively.
Thus, we obtained a matrix of pair-wise differences between properties based on coding maps, DS.
We normalized each of the three matrices of pair-wise distances DP, DS to unit sum, and calculated the sum of the absolute error between both of them and DChrea and DBHsmall.
We also added spatial and population information linearly with the same weight to see if combined they provided a better fit to the perceptual space. For the baseline, 100,000 sets of points were sampled from random uniform distributions. Then the distances from their pair-wise distances to perceptual space was calculated.
3 Results
We generated populations of ORNs according to Eq. 1to show how sensory axons can cluster together based on activity. This is demonstrated in Figure 4. Figures 4A,B illustrate how through the projection from epithelium to bulb, olfactory neurons can become ordered. Figure 4C shows on a toy example how ORNs of the same type converge onto the bulb. At each iteration odorants were presented to the network and the distance between olfactory axons was adjusted.
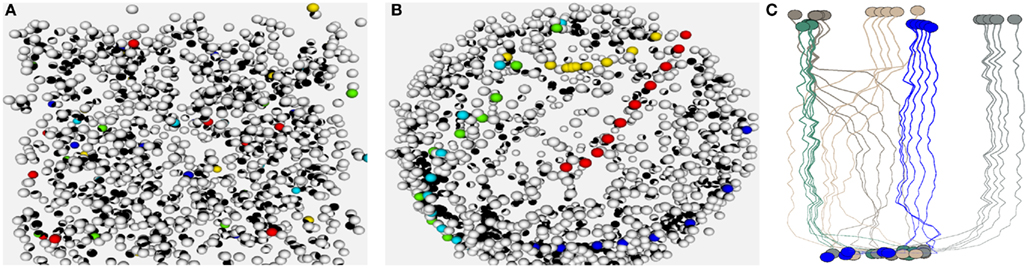
Figure 4. (A,B) Show a 3D visualization of the ORN layer organization before and after calculating the projection. The visualization was done based on the Visualization Toolkit (VTK) C++ libraries (Schroeder et al., 1996). ORNs of five OR families are highlighted by color. In (B) you can see how ORNs of a certain type (indicated by color) cluster together. Subfigure (C) is an illustration of how olfactory axons project from epithelium (bottom) to glomeruli (top) in a small network consisting of five OR types and five ORNs per type. Colors indicate OR identity.
In the following, we applied Eq. 2for concentration–responses of populations. In Figure 5, we show the effect of concentration on recruitment of glomeruli.
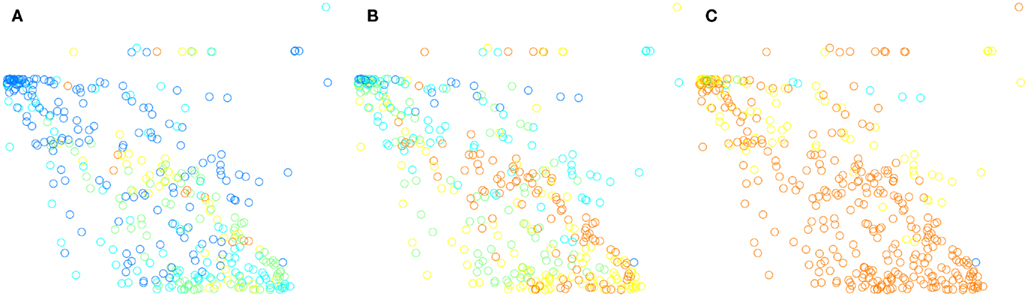
Figure 5. Glomerular activations at three different concentrations. (A) shows glomerular responses at a low concentration, (B) at a medium concentration, and (C) at a high concentration. Plots are shown in two dimensions for clearer illustration (the actual space is in three dimensions). The color map starts from dark blue for small activations and includes shades of blue, cyan, green, yellow, and red, and ends with dark red for high values. At low concentration few glomeruli are activated (indicated by red). As concentration increases more glomeruli are activated, until the glomerular map becomes very unspecific and saturated.
Table 1 gives an indication about how accurately the perceptual space is reflected in the glomerular responses. Distances, DP were generated from the population code, based on the activity of all neurons. Distances between spatial zones, DS, are the Hausdorff distances between coding regions. Both matrices were compared to perceptual orderings of odors. The numbers give the sum of the absolute error of fit. We added the normalized pair-wise distance matrices for population and spatial codes to combine them and also calculated the error of fit. This is annotated as combined. Error of fit from pair-wise distances between points drawn from a uniform random distribution is given as baseline. The numbers for baseline with variance are 0.65 ± 0.09 for Chrea and 0.65 ± 0.15 for BH.
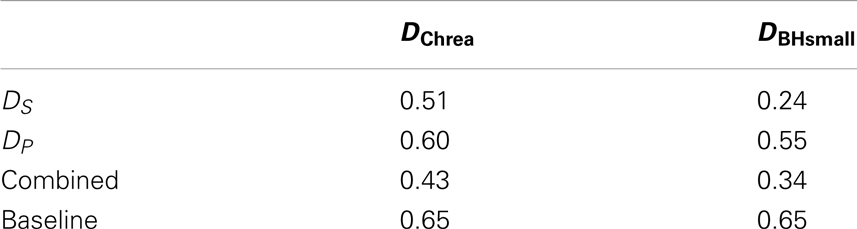
Table 1. Absolute error of fit between coding spaces (DP, DS) and perceptual spaces (DChrea and DBHsmall).
Graphically you can compare in Figure 6 the perceptual spaces and the two datasets to distances resulting from spatial and population code. The plots show the pair-wise distances dimensionality-reduced to two dimensions using the MDS algorithm. This means that distances between odor categories are maintained in the plots.
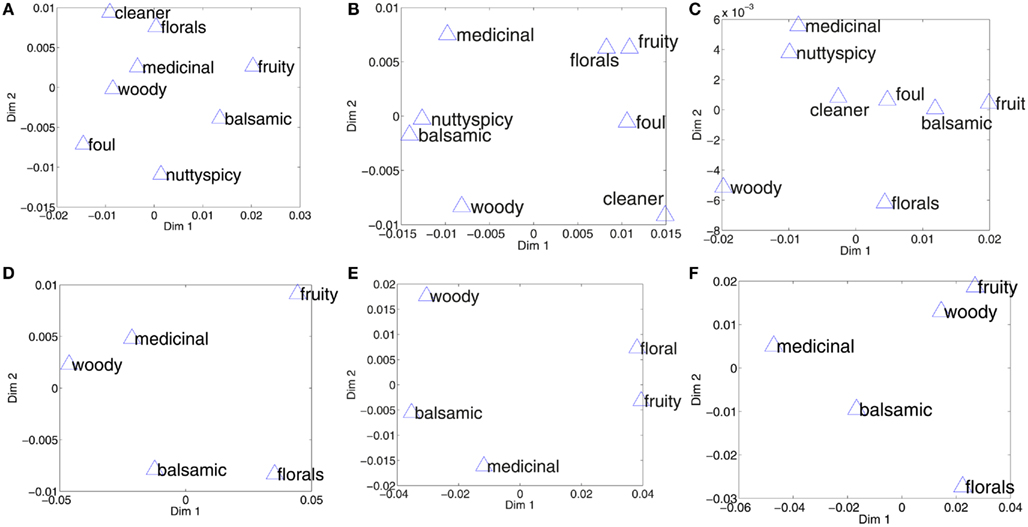
Figure 6. Perceptual spaces constructed from pair-wise distances reduced to two dimensions by multi-dimensional scaling. (A) Shows the perceptual space in Chrea (2004), as per Zarzo (2008). (B) Shows the space as given by the distances from spatial encodings. (C) Shows the space as given by distances between activations of the entire glomerular layer, independent of spatial arrangement of glomeruli. The lower panel compares the perceptual space, (D) for the BH small data set, and the distances between the categories in the spatial encoding, (E), and the population encoding, (F).
We found significant (Spearman rank) correlations (at the 5% significance threshold) between distances only for the BP data and the spatial code (ρ = 0.6848, p = 0.04), while other correlations were insignificant. Correlations between spatial and population codes were low and highly insignificant (Chrea: ρ = 0.07, p = 0.71; BP: ρ = 0.04, p = 0.92).
We looked at general patterns of distances between odor qualities and found that medicinal emerged as an odor quality that was especially well-situated in the codes over Chrea and BP, while fruity was ill-fitting.
4 Discussion
Haddad et al. (2008a) presented a set of 32 physico-chemical descriptors that maximized correlations between variability of OB/antennal lobe activity responses and variability of the odorant descriptors. In our model, we placed OR receptive fields in the space captured by these molecular odorant descriptors and defined positions of ORN axon projections onto the bulb by dimensionality reduction of the OR–odorant affinity correlation matrix. Our model includes a population mean rate in response to a concentration.
We showed how activity-dependent mechanisms could serve to organize olfactory axons into glomerular structures (cf. Figure 4). Axons of receptor neurons of different types are intermixed as they grow toward the brain and they have to undergo a sorting process before arriving at their target glomeruli. In our model, olfactory axons cluster together over several iterations of the MDS algorithm.
We then showed how glomerular responses spatially broadened and saturated with increasing concentrations. It is well-established that increasing concentration leads to an increasing recruitment of glomeruli and thereby to a spatial broadening of local peaks (Johnson and Leon, 2000; Khan et al., 2010). Figure 5 demonstrates how our model can account for this.
We then analyzed variability of glomerular responses over different odor categories. Data of odor categories were obtained by mapping odorant descriptors. We used a statistical method to calculate receptive fields corresponding to odor categories for each glomerulus. Then, we compared how well a spatial code and population code matched human perceptual experiences.
Table 1 gives an indication about how accurately the perceptual space is reflected by the two different coding methods. Distances DP are the distances between population codes, and DS are distances between zones that showed differential activation in response to odor categories. Both were compared to perceptual orderings of odors. The errors between the perceptual space and the spatial encoding space is smaller compared to the population coding space for both data sets. Both population and spatial coding spaces performed better than a baseline generated from random points. For the Chrea data set, some categories have close distances from each in both the perceptual space and the spatial encoding space, such as for example medicinal–floral, balsamic–woody, and nutty/spicy–balsamic, which do not appear in the population coding space. Still, the match between the perceptual space and the spatial encoding space is not exact, as, e.g., the category cleaner show, which is misplaced in both encoding spaces.
For the smaller data set BH small, the absolute error was significantly smaller for the spatial encoding, but still quite high for the population code. This is reflected, e.g., by the concave pentagon structure in the population coding space (see Figure 6F) in comparison to the convex pentagon structure in the perceptual and spatial encoding space (compare Figures 6D,E).
Our results therefore suggest that spatial coding has a stronger relation to perception, but we also find a match better than baseline for population coding of perceptual categories. The combined codes integrating population and spatial codes, matched better in the case of the smaller set of odor descriptors and worse for Chrea. Therefore no clear conclusion can be drawn with regard to whether population and spatial coding complement each other.
4.1 Translating Physical Regularities into Spatial Maps
It is not clear yet how the early olfactory system translates information about molecules into a space relevant for perception and action. As discussed in the next paragraphs, some research groups found regularities in the physical odor space relative to perceptual, especially hedonic values, others found representations in the olfactory bulb (and insect antennal lobe) for representations of perceptual categories.
Khan, Haddad, Sobel, and colleagues suggested (Khan et al., 2007; Haddad et al., 2008b) that olfactory pleasantness corresponds to a natural axis of maximal discriminability among biologically relevant molecules and that the olfactory system has evolved to exploit regularities in the odor space. Where exactly physico-chemical properties are mapped to perceptual qualities is unclear, however a perceptual ordering of representations has been found previously in the piriform cortex (Howard et al., 2009). We found for our model of the OB that main orientations of perceptual and encoding spaces matched, however internal distances over these two spaces were different, which suggests that this mapping could occur earlier.
It is known that some odors are associated with specific molecular properties, e.g., putrid to amines and Doleman (1998) suggested that increased sensitivities to amines could constitute an evolutionary adaptation for detecting decaying food and toxic gases.
We show in this paper that a model of cortical projections (Lansner et al., 2009) can be extended to explain the emergence of topography from statistics of naturally occurring odors. The application of this principle based on coalescence by co-activation gives rise to a topographic map where the distance of the components in the topographic representation is a function of the dependencies of the components.
We hope that our model can provide insights into the formation of the olfactory bulb map and internalizations of environmental regularities, even though the match between glomerular activity and human perceptual space could be improved by tuning parameters of the receptor affinity distribution or by including top-down projections. It could be that odorant receptors and projections to the OB are optimized to make environmental regularities more prominent. For example Geisler and Diehl (2002) proposed that the design of perceptual systems is optimized according to statistics of natural stimuli and evolutionary fitness. More particular for olfaction, Nei et al. (2008) discussed that part of molecular changes in chemoreceptor repertoires constitutes an adaptation of organisms to different environments. However, it was suggested (Abbott and Luo, 2007) that olfactory receptors are not optimal either and Sánchez-Montañés and Pearce (2002) demonstrated that optimal stimulus estimation arises from a local randomized mechanism for receptor specificity generation.
4.2 Spatial Coding in the Olfactory Bulb
There are arguments for spatial, temporal, and spatio-temporal coding in the OB (cf. Leon and Johnson, 2009). For example, Wilson and Stevenson (2006) argued for the plausibility of population coding in the olfactory bulb. Rubin and Katz (1999) showed that maps of similar molecules were more correlated than maps of different molecules. (Haddad et al., 2010) analyzed population activity of glomeruli and MT cells from different studies and found that the first principal component was correlated to approach or withdrawal in animals and to odorant pleasantness in humans. They also argued that for reasons of robustness, speed, and in the light of experimental evidence, it is plausible that global and local coding schemes could work together.
A relationship between olfactory bulb activations and perceptual representations was also found on a spatial level. In fact, many studies suggest a spatial encoding (e.g., Vassar et al., 1994; Meister and Bonhoeffer, 2001; Mori et al., 2006; Johnson and Leon, 2007). There is evidence that distance between spatial zones could have a relationship to behavior. Laska and Teubner (1999) found in a forced-choice test that discrimination ability of subjects between homologous odors was correlated to differences in carbon chain length and Auffarth et al. (2011b) confirmed that different glomerular areas in the olfactory bulb are activated depending on carbon chain length and found contiguous olfactory bulb coding sites for several properties. In the same study, it was found that classification of molecular properties using a support-vector machine on activation data, for most compared properties, the spatial zones for coding were small and compact.
Leon and Johnson (2009) examining arguments for temporal and spatial coding, concluded that much of the available data is actually inconsistent with hypotheses related to temporal coding and rather support a spatial coding scheme. They argued that in rodents spatial patterns of glomerular activities and perceptual similarities are related. They suggested that perceptually driven behavior could serve as a starting point to evaluate the two coding schemes. We think that our study is a first step in that direction.
Studies in rats and mice have shown that different types of behavior, e.g., defensive behavior toward predators, aversion, or attraction toward food, can be related to the chemical categories of odorants emitted by the odor source (Dielenberg and McGregor, 2001) and that glomeruli coding for these categories are organized in domains or clusters in the OB. A study by Kobayakawa et al. (2007) suggested that the OB of mice consists of at least two different functional modules, one for innate odor responses and one for (associatively) learned odor responses. Similar spatial behavioral organization is also known to occur in insects (e.g., Semmelhack and Wang, 2009).
Function of Topography
Studies of odorant coding in the OB show that odor codes are represented on the levels of glomeruli and M/T cells by spatio-temporal codes (cf. Laurent, 1997; Leon and Johnson, 2009). Our model of activity-dependent self-organization of the glomerular layer suggests that there could be information about perceptual categories on spatial and population levels. It is not clear if topography on the olfactory bulb is key to a function (Zou et al., 2009). However, it was known that changing locations of glomeruli can result in behavioral impairments in mice, in spite of persistent physiological activations (Adam and Mizrahi, 2010). This could imply the existence of readout mechanisms that rely on spatial codes.
It could be speculated that local patterns of odor categories constitute an instance of the minimization of wiring length in cortical networks (cf. Chen et al., 2006) with functional implications (cf. Thivierge and Marcus, 2007). Practically topography could constitute an anatomical basis to sharpen MT responses over periglomerular pathways. Yaksi and Wilson (2010) provide evidence that local circuity between glomeruli in the antennal lobe, the insect analog of the OB, could serve for gain control by both contrast enhancement and increase of sensitivity. In favor of this functionality speaks also the length of periglomerular axons, which reach only a few glomeruli far (Shepherd et al., 2004).
One hypothesis for the generation of receptive fields on the MT layer is that competitive inhibitory mechanisms between MT cells could facilitate a mechanism for odorant concentration (see Sandström et al., 2009b) based on the highly variable response properties of ORNs expressing the same OR (Grosmaitre et al., 2006). In fact, a viral tracer study (Willhite et al., 2006) suggests a columnar organization by receptor type reaching from glomerular to deep granular layers (Willhite et al., 2006). This could indicate a local proximity which would be expected to underly circuits optimized for wiring length.
Evidence is accumulating that ORs and glomeruli are internalizations of environmental regularities (e.g., Dielenberg and McGregor, 2001; Hommel et al., 2002; Khan et al., 2007; Kobayakawa et al., 2007; Semmelhack and Wang, 2009; Sakano, 2010). In this model of axonal convergence we could account for at least part of the organization of representations. Together with earlier evidence for spatial continuous maps for perceptual categories (Auffarth et al., 2011a), results are consistent with other studies to show a functional compartmentalization and a spatial organization in the OB. This could indicate organizing principles that could serve to efficiently convey behaviorally relevant information to higher stages, e.g., the amygdala or piriform cortex. Thus, higher brain regions seem to sample from glomeruli in spatial domains of the OB to receive behaviorally relevant information which triggers innate behavior, e.g., aversion due to fox urine or aggression due to male mouse odors.
The establishment of a functional architecture relies on process outgrowth and synapse formation. Connectivity is defined by molecular cues and neural activity (Katz and Crowley, 2002). While neural activity could be generated spontaneously in early phases of development, in later phases it is then crucially dependent on sensory experience, so that connectivity is defined by different forms of input, such as intrinsic, sensory, and other, such as coming from cognitive or motor areas. It is known that top-down projections from higher stages influence the dynamics in the OB (Fuentes et al., 2008) and therefore they could shape the glomerular map in a way to simplify the readout of behaviorally relevant information. The formation of topographic organization in our model relies exclusively on the input side, however other factors could be integrated as adaptations to the distance matrix, which is fed into the MDS algorithm.
Conclusion
We presented a model of olfactory perceptual coding at the glomerular level. Although the machinery responsible for axon guidance is much more complex than that presented here, we hope that progress of functional understanding may be facilitated by keeping our model as simple as reasonably possible. We used realistic, ecologically relevant odorant data and showed how from simple principles glomeruli form and spatial maps emerge with receptive fields specialized on a combination of physico-chemical features and odor categories. We showed in our model how OR affinities govern the formation of a topographic map in the OB and how the emergent coding domains for receptive molecular ranges reflect a perceptually relevant categorization.
We found that glomerular regions responsive to odor categories have relative spatial distributions over the bulb that represent a qualitatively good match between the odor ratings by humans. Therefore, our findings confirm previous studies which suggest a spatial coding at the olfactory bulb. This could suggest that the OB encodes perceptual categories.
Conflict of Interest Statement
The authors declare that the research was conducted in the absence of any commercial or financial relationships that could be construed as a potential conflict of interest.
Acknowledgments
The authors thank Simon Benjaminsson for implementing a C++ library for simulation of neural networks. This work was supported by the EU Seventh Framework Programme (FP7/2007-2013), project NEUROCHEM under grant agreement no. 216916. We want to thank both reviewers for their insightful comments.
Footnote
- ^Available at http://www.flavornet.org/
References
Abbott, L. F., and Luo, S. X. (2007). A step toward optimal coding in olfaction. Nat. Neurosci. 10, 1342–1343.
Acree, T., and Arn, H. (1998). “Flavornet: a database of aroma compounds based on odor potency in natural products,” in Food Flavors: Formation, Analysis and Packaging Influences, Proceedings of the 9th International Flavor Conference The George Charalambous Memorial Symposium, Vol. 40, eds E. Contis, C.-T. Ho, C. Mussinan, T. Parliment, F. Shahidi, and A. Spanie (Amsterdam: Elsevier Science), :27.
Adam, Y., and Mizrahi, A. (2010). Circuit formation and maintenance – perspectives from the mammalian olfactory bulb. Curr. Opin. Neurobiol. 20, 134–140.
Aloni, R., Olender, T., and Lancet, D. (2006). Ancient genomic architecture for mammalian olfactory receptor clusters. Genome Biol. 7, R88.
Alt, H., Knauer, C., and Wenk, C. (2003). Comparison of distance measures for planar curves. Algorithmica 38, 45–58.
Auffarth, B., Gutierrez-Galvez, A., and Marco, S. (2011a). Continuous spatial representations in the olfactory bulb may reflect perceptual categories. Front. Syst. Neurosci. 5, doi: 10.3389/fnsys.2011.00082
Auffarth, B., Gutierrez-Galvez, A., and Marco, S. (2011b). Statistical analysis of coding for molecular properties in the olfactory bulb. Front. Syst. Neurosci. 5:62. doi: 10.3389/fnsys.2011.00062
Boelens, H., and Haring, H. (1981). Molecular Structure and Olfactive Quality. Technical Report. Bussum: Naarden International.
Bozza, T., Feinstein, P., Zheng, C., and Mombaerts, P. (2002). Odorant receptor expression defines functional units in the mouse olfactory system. J. Neurosci. 22, 3033–3043.
Buschhüter, D., Smitka, M., Puschmann, S., Gerber, J. C., Witt, M., Abolmaali, N. D., and Hummel, T. (2008). Correlation between olfactory bulb volume and olfactory function. Neuroimage 42, 498–502.
Chen, B. L., Hall, D. H., and Chklovskii, D. B. (2006). Wiring optimization can relate neuronal structure and function. Proc. Natl. Acad. Sci. U.S.A. 103, 4723–4728.
Chrea, C. (2004). Culture and odor categorization: agreement between cultures depends upon the odors. Food Qual. Prefer. 15, 669–679.
Cleland, T. A., Johnson, B. A., Leon, M., and Linster, C. (2007). Relational representation in the olfactory system. Proc. Natl. Acad. Sci. U.S.A. 104, 1953–1958.
Dielenberg, R. A., and McGregor, I. S. (2001). Defensive behavior in rats towards predatory odors: a review. Neurosci. Biobehav. Rev. 25, 597–609.
Doleman, B. J. (1998). Trends in odor intensity for human and electronic noses: relative roles of odorant vapor pressure vs. molecularly specific odorant binding. Proc. Natl. Acad. Sci. U.S.A. 95, 5442–5447.
Dubuisson, M.-P., and Jain, A. (1994). “A modified Hausdorff distance for object matching,” in Pattern Recognition, 1994. Vol. 1-Conference A: Computer Vision and Image Processing, Proceedings of the 12th IAPR International Conference on (Jerusalem: IEEE), 566–568.
Efron, B. (1982). “The jackknife, the bootstrap and other resampling plans,” in CMBS Regional Conference Series in Applied Mathematics (Philadelphia: Society for Industrial and Applied Mathematics), 92.
Fuentes, R. A., Aguilar, M. I., Aylwin, M. L., and Maldonado, P. E. (2008). Neuronal activity of mitral-tufted cells in awake rats during passive and active odorant stimulation. J. Neurophysiol. 100, 422–430.
Geisler, W. S., and Diehl, R. L. (2002). Bayesian natural selection and the evolution of perceptual systems. Philos. Trans. R. Soc. Lond. B Biol. Sci. 357, 419–448.
Grosmaitre, X., Vassalli, A., Mombaerts, P., Shepherd, G. M., and Ma, M. (2006). Odorant responses of olfactory sensory neurons expressing the odorant receptor MOR23: a patch clamp analysis in gene-targeted mice. Proc. Natl. Acad. Sci. U.S.A. 103, 1970–1975.
Gutierrez-Osuna, R. (2002). “A self-organizing model of chemotopic convergence for olfactory coding,” in Proceedings of the Second Joint 24th Annual Conference and the Annual Fall Meeting of the Biomedical Engineering Society (Houston, TX: Engineering in Medicine and Biology), 236–237.
Haberly, L. B., and Price, J. L. (1977). The axonal projection patterns of the mitral and tufted cells of the olfactory bulb in the rat. Brain Res. 129, 152–157.
Haddad, R., Khan, R., Takahashi, Y. K., Mori, K., Harel, D., and Sobel, N. (2008a). A metric for odorant comparison. Nat. Methods 5, 425–429.
Haddad, R., Lapid, H., Harel, D., and Sobel, N. (2008b). Measuring smells. Curr. Opin. Neurobiol. 18, 438–444.
Haddad, R., Weiss, T., Khan, R., Nadler, B., Mandairon, N., Bensafi, M., Schneidman, E., and Sobel, N. (2010). Global features of neural activity in the olfactory system form a parallel code that predicts olfactory behavior and perception. J. Neurosci. 30, 9017–9026.
Hommel, B., Müsseler, J., Aschersleben, G., and Prinz, W. (2002). The theory of event coding (TEC): a framework for perception and action planning. Behav. Brain Sci. 24, 849–878.
Howard, J. D., Plailly, J., Grueschow, M., Haynes, J.-D., and Gottfried, J. A. (2009). Odor quality coding and categorization in human posterior piriform cortex. Nat. Neurosci. 12, 932–938.
Humphries, C., Liebenthal, E., and Binder, J. R. (2010). Tonotopic organization of human auditory cortex. Neuroimage 50, 1202–1211.
Imai, T., and Sakano, H. (2007). Roles of odorant receptors in projecting axons in the mouse olfactory system. Curr. Opin. Neurobiol. 17, 507–515.
Johnson, B. A., and Leon, M. (2000). Modular representations of odorants in the glomerular layer of the rat olfactory bulb and the effects of stimulus concentration. J. Comp. Neurol. 422, 496–509.
Johnson, B. A., and Leon, M. (2007). Chemotopic odorant coding in a mammalian olfactory system. J. Comp. Neurol. 503, 1–34.
Katz, L. C., and Crowley, J. C. (2002). Development of cortical circuits: lessons from ocular dominance columns. Nat. Rev. Neurosci. 3, 34–42.
Kauer, J. S., and Cinelli, A. R. (1993). Are there structural and functional modules in the vertebrate olfactory bulb? Microsc. Res. Tech. 24, 157–167.
Kerr, M. A., and Belluscio, L. (2006). Olfactory experience accelerates glomerular refinement in the mammalian olfactory bulb. Nat. Neurosci. 9, 484–486.
Khan, A. G., Parthasarathy, K., and Bhalla, U. S. (2010). Odor representations in the mammalian olfactory bulb. Wiley interdisciplinary reviews. Syst. Biol. Med. 2, 603–611.
Khan, R. M., Luk, C.-H., Flinker, A., Aggarwal, A., Lapid, H., Haddad, R., and Sobel, N. (2007). Predicting odor pleasantness from odorant structure: pleasantness as a reflection of the physical world. J. Neurosci. 27, 10015–10023.
Kobayakawa, K., Kobayakawa, R., Matsumoto, H., Oka, Y., Imai, T., Ikawa, M., Okabe, M., Ikeda, T., Itohara, S., Kikusui, T., Mori, K., and Sakano, H. (2007). Innate versus learned odour processing in the mouse olfactory bulb. Nature 450, 503–508.
Lansner, A., Benjaminsson, S., and Johansson, C. (2009). “From ANN to biomimetic information processing,” in Biologically Inspired Signal Processing for Chemical Sensing, Vol. 188, eds G. Agustín and M. Santiago (Heidelberg: Springer), 33–43.
Laska, M., and Teubner, P. (1999). Olfactory discrimination ability for homologous series of aliphatic alcohols and aldehydes. Chem. Senses 24, 263–270.
Leon, M., and Johnson, B. A. (2009). Is there a space-time continuum in olfaction? Cell. Mol. Life Sci. 66, 2135–2150.
Lin, D. Y., Shea, S. D., and Katz, L. C. (2006). Representation of natural stimuli in the rodent main olfactory bulb. Neuron 50, 937–949.
Linster, C., Johnson, B. A., Yue, E., Morse, A., Xu, Z., Hingco, E. E., Choi, Y., Choi, M., Messiha, A., and Leon, M. (2001). Perceptual correlates of neural representations evoked by odorant enantiomers. J. Neurosci. 21, 9837–9843.
Lodovichi, C., Belluscio, L., and Katz, L. C. (2003). Functional topography of connections linking mirror-symmetric maps in the mouse olfactory bulb. Neuron 38, 265–276.
Malach, R., Levy, I., and Hasson, U. (2002). The topography of high-order human object areas. Trends Cogn. Sci. (Regul. Ed.) 6, 176–184.
Meister, M., and Bonhoeffer, T. (2001). Tuning and topography in an odor map on the rat olfactory bulb. J. Neurosci. 21, 1351–1360.
Ming, G.-L., Wong, S. T., Henley, J., Yuan, X.-B., Song, H.-J., Spitzer, N. C., and Poo, M.-M. (2002). Adaptation in the chemotactic guidance of nerve growth cones. Nature 417, 411–418.
Mombaerts, P. (2004). Odorant receptor gene choice in olfactory sensory neurons: the one receptor-one neuron hypothesis revisited. Curr. Opin. Neurobiol. 14, 31–36.
Mombaerts, P. (2006). Axonal wiring in the mouse olfactory system. Annu. Rev. Cell Dev. Biol. 22, 713–737.
Mori, K. (1995). Relation of chemical structure to specificity of response in olfactory glomeruli. Curr. Opin. Neurobiol. 5, 467–474.
Mori, K. (1999). The olfactory bulb: coding and processing of odor molecule information. Science 286, 711–715.
Mori, K., Matsumoto, H., Tsuno, Y., and Igarashi, K. M. (2009). Dendrodendritic synapses and functional compartmentalization in the olfactory bulb. Ann. N. Y. Acad. Sci. 1170, 255–258.
Mori, K., and Sakano, H. (2011). How is the olfactory map formed and interpreted in the mammalian brain? Annu. Rev. Neurosci. 34, 467–499.
Mori, K., Takahashi, Y. K., Igarashi, K. M., and Yamaguchi, M. (2006). Maps of odorant molecular features in the mammalian olfactory bulb. Physiol. Rev. 86, 409–433.
Nei, M., Niimura, Y., and Nozawa, M. (2008). The evolution of animal chemosensory receptor gene repertoires: roles of chance and necessity. Nat. Rev. Genet. 9, 951–963.
Raman, B., and Gutierrez-Osuna, R. (2009). “Relating sensor responses of odorants to their organoleptic properties by means of a biologically-inspired model of receptor neuron convergence onto olfactory bulb,” in Biologically Inspired Signal Processing for Chemical Sensing, eds G. Agustín and M. Santiago (Heidelberg: Springer), 93–108.
Ressler, K. J., Sullivan, S. L., and Buck, L. B. (1994). Information coding in the olfactory system: evidence for a stereotyped and highly organized epitope map in the olfactory bulb. Cell 79, 1245–1255.
Rubin, B., and Katz, L. (1999). Optical imaging of odorant representations in the mammalian olfactory bulb. Neuron 23, 499–511.
Sánchez-Montañés, M. A., and Pearce, T. C. (2002). Why do olfactory neurons have unspecific receptive fields? Biosystems 67, 229–238.
Sandström, M., Lansner, A., Hellgren-Kotaleski, J., and Rospars, J.-P. (2009a). Modeling the response of a population of olfactory receptor neurons to an odorant. J. Comput. Neurosci. 27, 337–355.
Sandström, M., Proschinger, T., Lansner, A., Pardo, M., and Sberveglieri, G. (2009b). “A bulb model implementing fuzzy coding of odor concentration,” in AIP Conference Proceedings, Brescia, 159–162.
Sanes, J. R., and Jessell, T. (2000). “The guidance of axons to their targets,” in Principles of Neural Science, eds E. R. Kandel, J. H. Schwartz, and T. Jessell (New York, NY: McGraw-Hill), 1063–1086.
Schmuker, M., and Schneider, G. (2007). Processing and classification of chemical data inspired by insect olfaction. Proc. Natl. Acad. Sci. U.S.A. 104, 20285–20289.
Schroeder, W., Martin, K., and Lorensen, W. (1996). “The design and implementation of an object-oriented toolkit for 3D graphics and visualization,” in Proceedings of Seventh Annual IEEE Visualization ’96, Vol. 96 (San Francisco, CA: ACM), 93–100.
Semmelhack, J. L., and Wang, J. W. (2009). Select Drosophila glomeruli mediate innate olfactory attraction and aversion. Nature 459, 218–223.
Serizawa, S., Miyamichi, K., Takeuchi, H., Yamagishi, Y., Suzuki, M., and Sakano, H. (2006). A neuronal identity code for the odorant receptor-specific and activity-dependent axon sorting. Cell 127, 1057–1069.
Shepherd, G. M. G., Chen, W., and Greer, C. A. (2004). “The olfactory bulb,” in The Synaptic Organization of the Brain (Oxford/ New York: Oxford University Press), 165–217.
Shipley, M. T., Ennis, M., and Puche, A. C. (2008). “The olfactory system,” in The Rat Nervous System, 3rd Edn. ed. G. Paxinos (San Diego, CA: Elsevier Inc.), 611–622.
Singer, W. (1994). “The organization of sensory motor representations in the neocortex: a hypothesis based on temporal coding,” in Attention and Performance Xv: Conscious and Nonconscious Information Processing (Cambridge, MA: MIT Press), 77–107.
Sperry, R. W. (1963). Chemoaffinity in the orderly growth of nerve fiber patterns and connections. Proc. Natl. Acad. Sci. U.S.A. 50, 703–710.
Thivierge, J.-P., and Marcus, G. F. (2007). The topographic brain: from neural connectivity to cognition. Trends Neurosci. 30, 251–259.
Uchida, N., Takahashi, Y. K., Tanifuji, M., and Mori, K. (2000). Odor maps in the mammalian olfactory bulb: domain organization and odorant structural features. Nat. Neurosci. 3, 1035–1043.
Udin, S. B., and Fawcett, J. W. (1988). Formation of topographic maps. Annu. Rev. Neurosci. 11, 289–327.
Vassar, R., Chao, S. K., Sitcheran, R., Nuñez, J. M., Vosshall, L. B., and Axel, R. (1994). Topographic organization of sensory projections to the olfactory bulb. Cell 79, 981–991.
Willhite, D. C., Nguyen, K. T., Masurkar, A. V., Greer, C. A., Shepherd, G. M., and Chen, W. R. (2006). Viral tracing identifies distributed columnar organization in the olfactory bulb. Proc. Natl. Acad. Sci. U.S.A. 103, 12592–12597.
Wilson, D., and Stevenson, R. (2006). Learning to Smell: Olfactory Perception From Neurobiology to Behavior. Baltimore, MD: Johns Hopkins University Press.
Yaksi, E., and Wilson, R. I. (2010). Electrical coupling between olfactory glomeruli. Neuron 67, 1034–1047.
Yu, C. R., Power, J., Barnea, G., O’Donnell, S., Brown, H. E. V., Osborne, J., Axel, R., and Gogos, J. A. (2004). Spontaneous neural activity is required for the establishment and maintenance of the olfactory sensory map. Neuron 42, 553–566.
Zarzo, M. (2008). Psychologic dimensions in the perception of everyday odors: pleasantness and edibility. J. Sens. Stud. 23, 354–376.
Zarzo, M., and Stanton, D. T. (2009). Understanding the underlying dimensions in perfumers’ odor perception space as a basis for developing meaningful odor maps. Atten. Percept. Psychophys. 71, 225–247.
Keywords: olfaction, plasticity, axonal guidance, olfactory coding, olfactory bulb, glomeruli, odor category, perception
Citation: Auffarth B, Kaplan B and Lansner A (2011) Map formation in the olfactory bulb by axon guidance of olfactory neurons. Front. Syst. Neurosci. 5:84. doi: 10.3389/fnsys.2011.00084
Received: 22 August 2011;
Accepted: 22 September 2011;
Published online: 11 October 2011.
Edited by:
Milagros Gallo, University of Granada, SpainCopyright: © 2011 Auffarth, Kaplan and Lansner. This is an open-access article subject to a non-exclusive license between the authors and Frontiers Media SA, which permits use, distribution and reproduction in other forums, provided the original authors and source are credited and other Frontiers conditions are complied with.
*Correspondence: Benjamin Auffarth, Department of Computational Biology, School of Computer Science and Communication, Royal Institute of Technology, Albanova Universitetscentrum, Roslagstullsbacken 35, S-11421 Stockholm, Sweden. e-mail:YXVmZmFydGhAY3NjLmt0aC5zZQ==