 Ronald H. Stevens1,2*
 Trysha L. Galloway2
- 1University of California Los Angeles (UCLA) School of Medicine, Brain Research Institute, Culver City, CA, United States
- 2The Learning Chameleon, Inc., Culver City, CA, United States
Neurodynamic organizations are information-based abstractions, expressed in bits, of the structure of long duration EEG amplitude levels. Neurodynamic information (NI, the variable of neurodynamic organization) is thought to continually accumulate as EEG amplitudes cycle through periods of persistent activation and deactivation in response to the activities and uncertainties of teamwork. Here we show that (1) Neurodynamic information levels were a better predictor of uncertainty and novice and expert behaviors than were the EEG power levels from which NI was derived. (2) Spatial and temporal parsing of team NI from experienced submarine navigation and healthcare teams showed that it was composed of discrete peaks with durations up to 20–60 s, and identified the involvement of activated delta waves when precise motor control was needed. (3) The relationship between NI and EEG power was complex varying by brain regions, EEG frequencies, and global vs. local brain interactions. The presence of an organizational system of information that parallels the amplitude of EEG rhythms is important as it provides a greatly reduced data dimension while retaining the essential system features, i.e., linkages to higher scale behaviors that span temporal and spatial scales of teamwork. In this way the combinatorial explosion of EEG rhythmic variables at micro levels become compressed into an intermediate system of information and organization which links to macro-scale team and team member behaviors. These studies provide an avenue for understanding how complex organizations arise from the dynamics of underlying micro-scale variables. The study also has practical implications for how micro-scale variables might be better represented, both conceptually and in terms of parsimony, for training machines to recognize human behaviors that span scales of teams.
Introduction
It has been proposed that biological systems, like teams, are hierarchies of information that are functionally organized across spatial and time scales (Flack, 2017a). Uncertainty is the messenger on this hierarchy guiding information back and forth between the environment and the team (Flack et al., 2012), with ripples and islands in these information streams representing periods of changing organization [see Stevens et al. (2013) for team examples]. This changing information helps the brain identify regularities in the environment and use them to shape adaptations along the macroscopic and microscopic continuum of experience and learning (Daniels et al., 2017).
In this process, uncertainty plays a unifying role in how the task and environment are perceived by a team (Stroulia and Goel, 1994; Hong, 2010), and how adaptive inference guides attention, motor control, decision making and ultimately learning (Friston et al., 2006; Friston, 2010; Sengupta et al., 2013; Dragomir et al., 2020).
As the brain learns to track patterns during training, discrete segments of cognitive stability develop that are energetically the “best fits” for predictively navigating through the tasks while avoiding surprise (Knill and Pouget, 2004). With practice, the responses and cognition required to execute them become more automatic, and require less energy to perform (Dunst et al., 2014; Sun et al., 2020). As a result we think and act in terms of schemata (Rumelhart, 1980), scripts (Schank and Abelson, 1977), chunks (Schneider and Logan, 2015), policies (Pezzulo et al., 2018) and episodes (Farooqui and Manly, 2018, 2019), which help streamline the moment to moment activities by structuring them into routines around frequently experienced events (Cooper and Shallice, 2000); in other words, exploiting what has already been experienced and learned (Daw et al., 2006). To the extent that the planning and execution of these routines meets the task requirements, the evolving situation will be predictable and teams will avoid surprise.
Occasionally, escalating unfamiliar environments and variable task outcomes generate unexpected sensory signals increasing uncertainty about what action to take next. This requires a switch from exploiting what has been learned to exploring and learning alternative approaches. The open-ended nature of exploration makes it difficult to predict how long the uncertainty will last (O'Rielly, 2013; Soltani and Izquierdo, 2019; Domenech et al., 2020), as the micro-states of uncertainty begin to scale into macro-states of pauses and hesitation (Kaufman et al., 2015). An open question, with implications for training to perform in complex environments, is how uncertainty at the neural level scales into observable hesitation.
Bottom up approaches to this question are complicated in that most low-level neural processes are not in themselves directly causal to team performance but involve everyday cognitive activities that support seeing, listening, decision making, etc. It is when these activities are transiently amplified or modified by the context, that they assume greater importance for teams. Studies performed at the scale of a half to one second have used EEG, fMRI, fNIRS or MRI and have measured the interpersonal dynamics of seen or heard motor actions (Caetano et al., 2007); speaker-listener coupling (Stephens et al., 2010; Perez et al., 2019); duets playing guitar (Sänger et al., 2012); and synchronic vs. diachronic movements (Tognoli and Kelso, 2015). These and other events are increasingly being probed by new sensor technologies and methods (Likens and Wiltshir, 2020).
The meaning of EEG power is also important. Alpha band oscillations (8–12 Hz) emphasize different functional properties depending on whether their states are synchronized (a.k.a. activated or high power) or desynchronized (a.k.a. deactivated or low power). Low power (i.e., often called suppressed) states are seen during attentive reading (Lachaux et al., 2008) and tend to favor new memory encodings. Higher alpha power states may transiently suppress gamma rhythms and help protect the contents of working memory from being disturbed thereby enhancing retention (Klimesch et al., 2006; Ossandon et al., 2011; Klimesch, 2012; Bonnefond and Jensen, 2015; Wianda and Ross, 2019). Similar considerations might apply to gamma waves (Sedley and Cunningham, 2013) and delta waves (1–4 Hz), which show an increase in power during the onset of fatigue, which decrease following challenge interruptions (Bodala et al., 2018).
There is a need however for higher level representations where modifications to and amplifications of the micro-scale dynamics are allowed to change freely, while still providing “best fit” (i.e., more stable) functional approximations for higher level activities (Nikolaus et al., 2008). In other words, abstractions that have a basis in mechanism but where many of the micro details don't need specifying (Flack, 2017b).
We have proposed that the informational properties of EEG rhythms might be candidates for such a representation as their basis in organization, not power or phase, may be more likely to align with processes responsible for observable macro-scale team organizations and behaviors. Such neurodynamic organizations contribute properties to the system not always possessed by the amplitude or phase of brainwaves. For instance, neurodynamic information (the variable of neurodynamic organization) has been shown to link with the organization of team activities (Stevens and Galloway, 2017) or speech (Gorman et al., 2015), or of team uncertainty (Stevens et al., 2016; Stevens and Galloway, 2019).
In this paper we parse the neurodynamics of teams into spatial and temporal subsets and merge them with lower level properties of EEG amplitude. The goal is to develop a framework for describing periods of neurodynamic uncertainty that could guide real-time feedback during training as well as support machines in their understanding of human uncertainty (Stevens and Galloway, 2019).
We consider three questions within this context.
1. Performing attention-demanding cognitive tasks requires not only regional activations but also deactivations that reflect decreased neural activity in regions supporting processes unrelated or irrelevant to the task at hand (i.e., Gusnard and Raichle, 2001; McKiernan et al., 2003; Fox et al., 2005; Lachaut et al., 2012). The first question asks whether there are periods of uncertainty, as identified by elevated neurodynamic organization, preferentially associated with periods of activated or deactivated EEG power? Are there channel or frequency dependencies for those periods where increased NI represents high EEG power vs. when they are represented by low EEG power?
2. Sensory likelihood functions, currently felt to be the lowest level where uncertainty is represented in cortical neurons are often unimodal (Beck et al., 2008; Walker et al., 2020) while multi-channel, multi-frequency-based team neurodynamic data streams appear multifractal (Likens et al., 2014). The second question asks whether the neurodynamic organizations associated with uncertainty are discrete at the sensor and frequency level or distributed across scalp regions and EEG frequencies?
3. Scalp-averaged NI levels vary based on their frequency, magnitudes and durations of neurodynamic organization. From a training and feedback perspective important questions are: How frequently does uncertainty occur? What is the level of uncertainty? How long is the uncertainty likely to last? The third question asks whether it is possible to develop quantitative neurodynamic models of the frequency, magnitude and duration of periods of uncertainty?
To expand the generality of the findings, examples include required US Navy submarine simulation training by experienced navy team members, required simulation training for experienced emergency air medical healthcare teams and advanced placement problem solving teams.
Methods
Teams and Tasks
The data sets for these studies were sampled from teams performing complex and relevant tasks including (a) submarine navigation teams performing required simulations, (b) experienced and novice healthcare teams practicing patient ventilation, and c) advanced placement teams engaged in dyadic problem solving. The subjects, and task details for the Map Navigation Task (Stevens and Galloway, 2014, 2015), healthcare (Stevens et al., 2016, 2018; Stevens and Galloway, 2017) and Submarine Piloting Navigation (Stevens and Galloway, 2016, 2017; Stevens et al., 2017) have been previously described (Stevens and Galloway, 2017, 2019; Stevens et al., 2019). The physical settings and a brief summary of each task are shown in Figure 1.
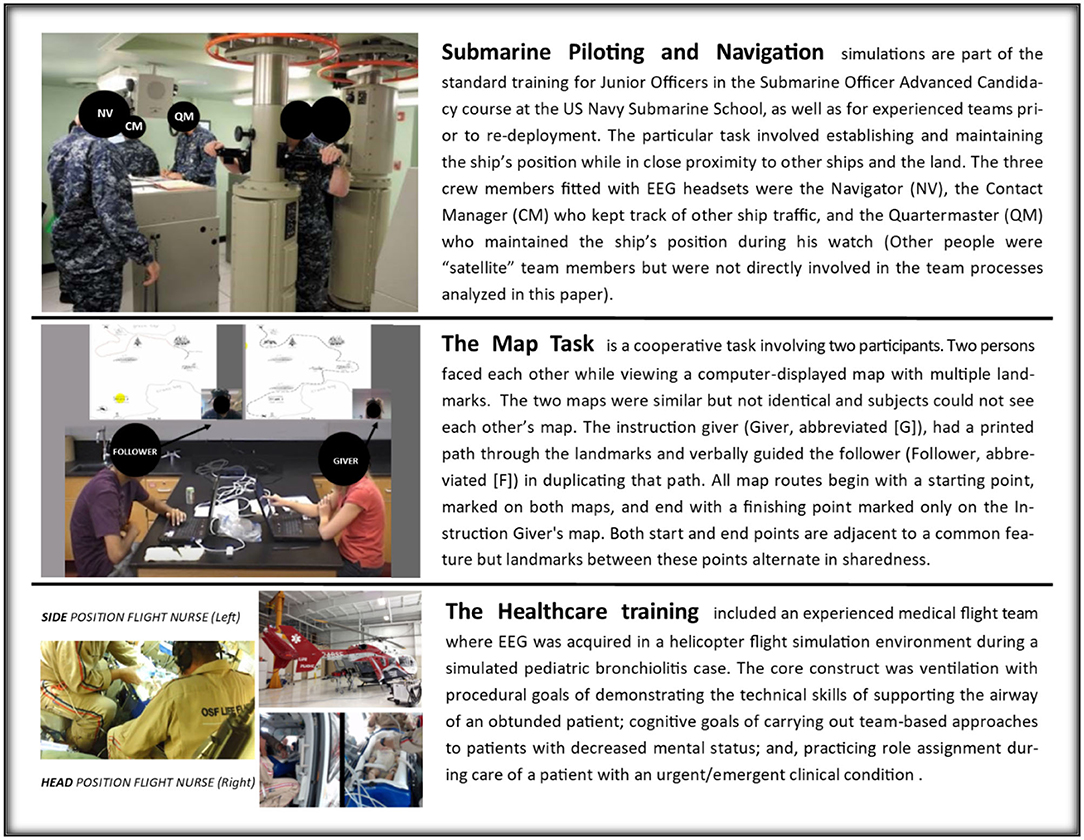
Figure 1. Summaries of the tasks and brief displays of their physical settings.
Ethics Statement
Informed consent protocols were approved by the Biomedical IRB, San Diego, CA (Protocol EEG01), the Order of Saint Francis Healthcare Institutional Review Board, and the Naval Submarine Medical Research Laboratory Institutional Review Board. All participating subjects consented (including images and speech for additional analysis) per approved applicable protocols. To maintain confidentially, each subject was assigned a unique number known only to the investigators of the study, and subject identities were not shared. This design complies with DHHS: protected human subject 45 CFR 46; FDA: informed consent 21 CFR 50.
Modeling Neurodynamic Organizations and Information
The EEG sensors were adjusted for good contact (<10 Ω) and the EEG data streams (software timing with hardware timing) were synchronized with electronic time markers (e.g., trigger) as well as with (e.g., lab streaming layer, a.k.a. LSL) the events observed in audio/videos with <50 ms of accuracy (Kothe, 2014). Commonly found artifacts occur from speech, eye blinks, heartbeats, breathing rhythms and other electromyography sources. The pre-processing protocol for the EEG data streams were optimized for removing these artifacts. This included: (1) the rejection of bad channels, (2) using separate high and low pass frequency filters for detrending the data to properly calibrate the thresholds prior to detecting and adaptively removing sinusoidal noise (Mullen, 2012), enhanced source separation techniques (Delorme et al., 2007) for detecting artifacts and interpolating artifact “bursts” (Mullen et al., 2015) and (3) robust average referencing (Bigdely-Shamlo et al., 2015). Software tools included: customized MATLAB® scripts as well as the MATLAB®-based FieldTrip® toolbox (Oostenveld et al., 2011), the open source EEGLAB signal processing environment (Delorme and Makeig, 2004), Lab (ABM, Carlsbad) and/or, NeuroPype® Suite (Intheon Labs, San Diego) as previously reported (Stevens and Galloway, 2015, 2017, 2019; Stevens et al., 2016). As neurodynamic organizations regularly occur during silence, speech is an unlikely source for most organizations (Stevens and Galloway, 2014, 2015). Power spectral density (PSD) was estimated with the Welch method (Welch, 1967). Commercial EEG headsets with both dry and wet electrodes have been used from multiple vendors with the number of sensors ranging from five to nineteen. A greater number of electrodes allow more detailed analysis of the spatial locations of the sources of uncertainty in the brain.
Team and Individual Neurodynamic Modeling
The modeling goal was to develop a multi-modal, multi-level system that would provide neurodynamic measures from each team member at a 1 Hz resolution that could be quantitatively compared across sensor sites (i.e., the occipital lobe vs. the motor cortex) and the 1–40 Hz frequency spectra from each person.
Each second the EEG power spectral density (PSD) levels were separated into the performance averaged high, medium, and low power levels and assigned the symbols 3, 1, and −1. The entire performance of any team member could then be described by several hundred parallel data streams of −1, 1, or 3's (Figure 2). The data from each team member (shown for a dyad in Figure 2A) was then combined to create a composite neurodynamic symbol (NS) that represented the team state. With two persons and three states, the team symbolic history consisted of data streams of the symbols 1 to 9 and a maximum entropy of 3.17 bits (Figure 2B).
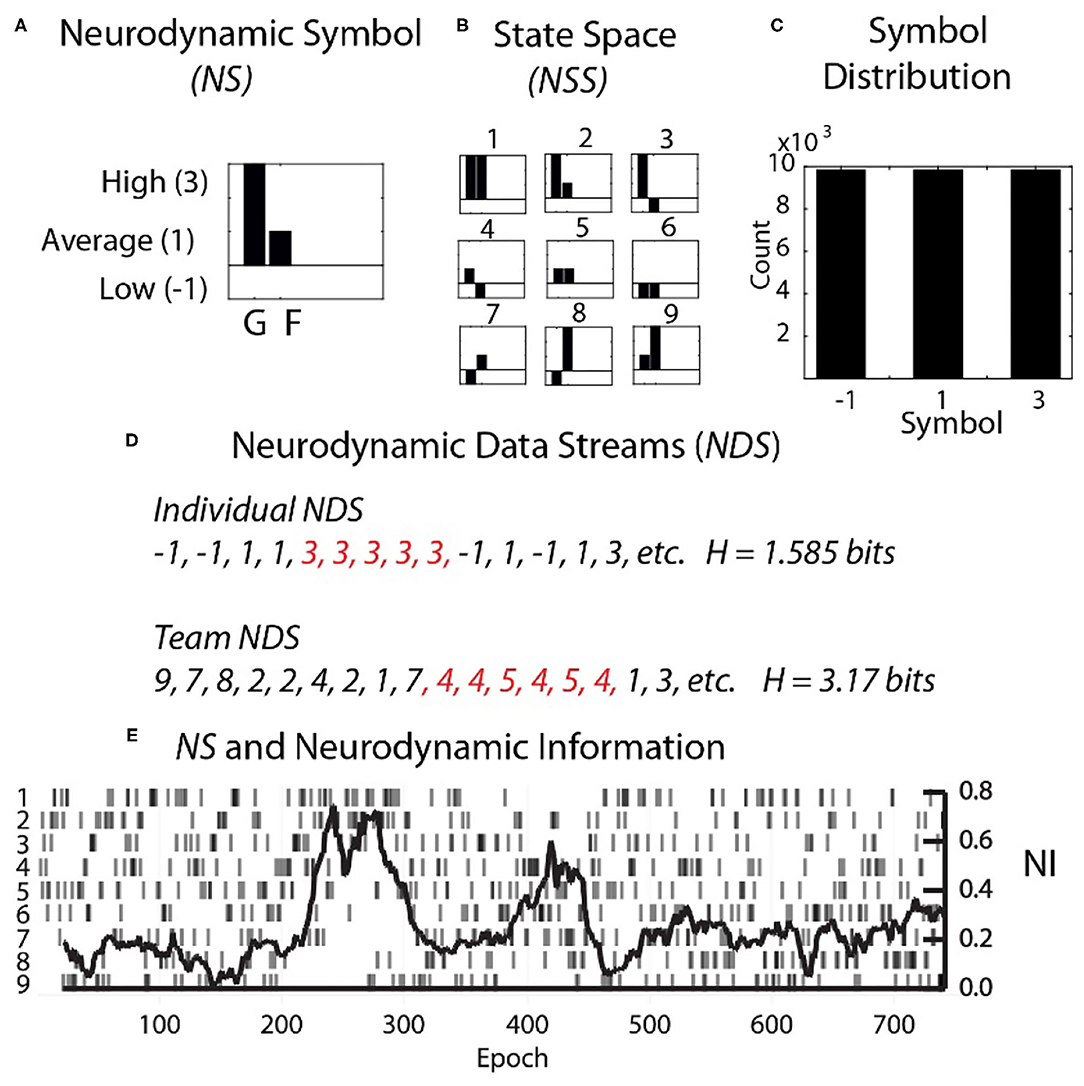
Figure 2. Team and individual neurodynamic modeling of a dyad. (A) A sample Neurodynamic Symbol (NS) showing a 1 s period where the EEG power was high for team member 1 (G), and average for team member 2 (F). (B) The nine-symbol Neurodynamic State Space (NSS) for two persons with three EEG power levels. (C) The distributions of the −1, 1, and 3 symbols need to be equal for accurate quantitative entropy comparisons. (D) Neurodynamic Data Streams (NDS) are symbol sequences that span the performance. For a dyad they are the team symbols in Figure 2B, while for individual team members they would be the−1, 1 and 3 values used symbolically. Note in Figure 2D that the symbol expression for both team and individual NDS were not random but punctuated by periods of symbol repeats which elevated the NI. Periods of symbol repeats were quantitated using entropy calculations over a 60 s window that was updated each second. (E) The NDS and the neurodynamic information tracing is shown for the dyad at the C3 sensor for the 18 Hz frequency.
A single neurodynamic symbol contains no information; it has an entropy of 0. The detection and quantitation of uncertainty and hesitation used information modeling over the Neurodynamic Data Streams (NDS), followed by the calculation of the entropy (Shannon, 1948, 1951) of the symbol distributions that were modeled over 60 s that were updated each second.
The neurodynamic history of the team's performance described in Figure 2 was only a partial history based on a single 1 Hz frequency bin from a single EEG sensor. For a 19 sensor EEG montage, with each sensor containing forty 1 Hz bins, this process would be repeated 760 times.
The bits of information calculated from the entropy measures were subtracted from the maximum entropy for the number of unique symbols to provide Neurodynamic Information (NI), a positive value of information. This relationship is shown in Figure 3 which compares the distributions of entropy and NI for the Medical Flight (Life Flight) trauma team performance described below. This figure also shows the changes in the distributions when the NS data streams were randomized six times before modeling.
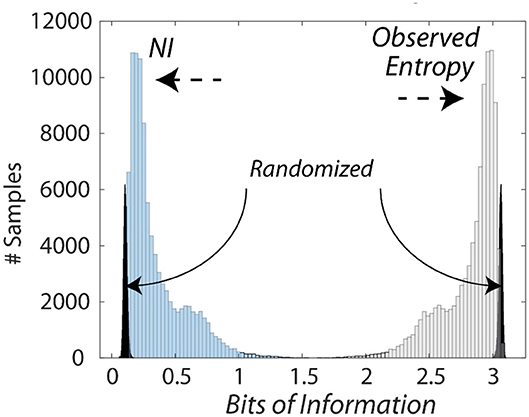
Figure 3. Histogram of the information levels in a medical flight team. This figure shows the relationship between the entropy and the NI measures of the medical flight team detailed in Figure 8. The average NI was 0.27 bits while the NI where the NDS were randomized prior to modeling was 0.09 bits which was significantly lower than the non-randomized data (Z = −5.5 P < 0.001), and removed the long-tailed distribution.
Bounding the Limits of Information
The entropy of the neurodynamic symbol streams can never be greater than the maximum of the number of symbols; for three PSD levels these would be 4.75 bits for a 27 symbol three person team, 3.17 bits for a nine symbol dyad, or 1.59 bits for an individual. The entropy can also never be lower than 0, which is the entropy of a single symbol. These mathematical limits mean that the entropy of any team of three persons where the EEG is separated into three levels will have entropy levels between 0 and 4.75 bits.
Calculating the EEG Power Values
To preserve the activation-deactivation meanings of EEG the NDS were modeled numerically as well as symbolically using the −1, 1, and 3 values, which enabled dynamic comparisons between neurodynamic organizations expressed as NI bits and the underlying EEG power values (EEG-PV). A numeric moving average of 60 s was performed over EEG-PV data streams to align with the NI.
Results
Parsing the Neurodynamic Information of a Map Task Performance
The dyad performed the Map Navigation Task (Doherty-Sneddon et al., 1997) with the Giver (G) verbally directing a second person, the Follower (F), in drawing a line through landmarks on (F's) computer screen (Stevens and Galloway, 2014, 2015, 2017). During the task, the team was exchanging information and (F) was drawing paths with the computer mouse around the task landmarks. Around 350 s (F) had difficulties controlling the cursor with the computer mouse and while attempting to gain control, began rapidly clicking it to send commands (Figure 4B). As the Follower became frustrated [indicated by (F) speech], the NI first increased in the parietal region (P0z, P3) and subsequently to the pre-motor/motor region (C3 and C4 sensors).
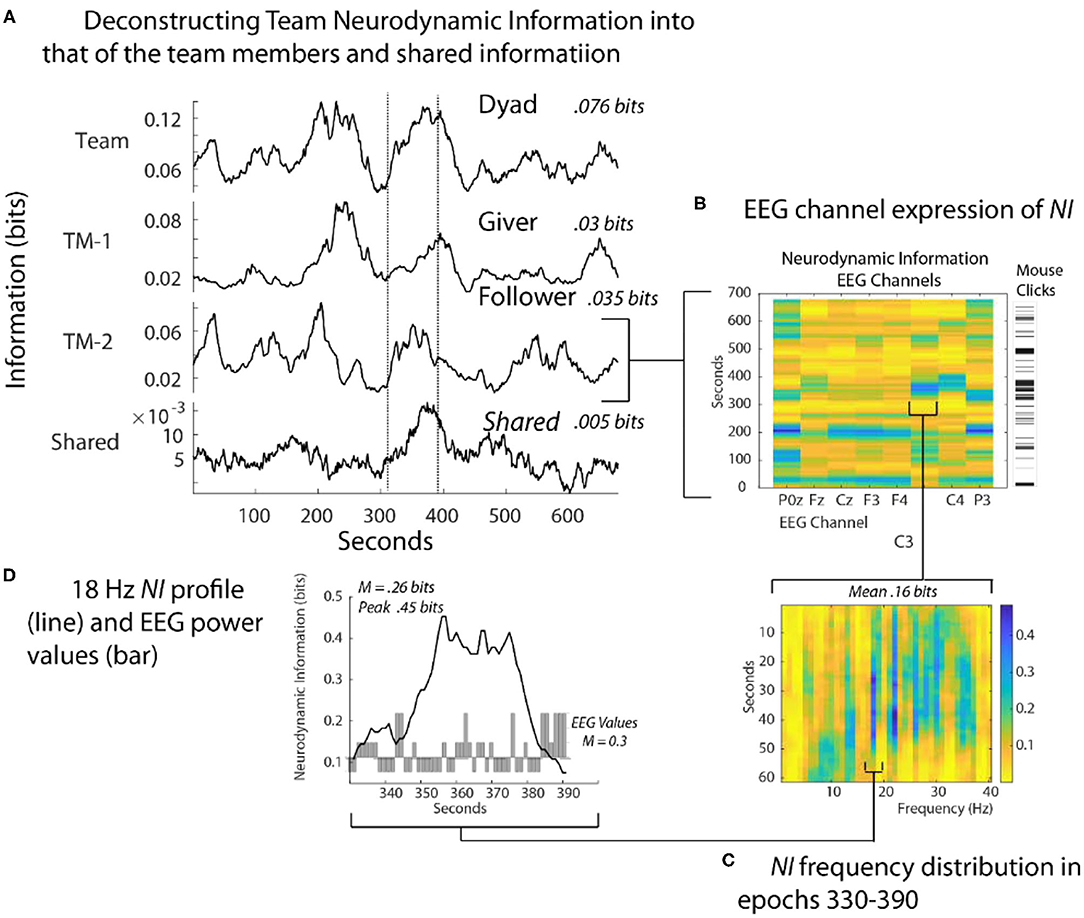
Figure 4. Quantitative comparisons of NI across spatial scales. (A) The bits of information of the team, team members, and their shared information is shown for a Map Task performance; the two lines are there for aligning the panels. (B) The NI dynamics at each sensor of the Follower. The bar to the right shows the density of his mouse clicks which increased around 330 s when he verbalized uncertainty. (C) The elevated NI at the C3 sensor is expanded for one segment (epoch 330-390 s) and displayed across the 1–40 Hz EEG frequency spectrum. (D) A profile plot of NI in the 18 Hz frequency band is overlaid with a bar plot of the −1, 1, and 3 EEG-PV. All NI values are shown after the subtraction of NI from parallel randomized NDS.
At a quantitative level, restricting the analysis to the EEG sensor level raised the average NI of the Follower from 0.035 bits to 0.16 bits. Restricting further to the 18-Hz frequency during the 60 s of peak activity of the C3 sensor further increased the average NI to 0.26 bits, reaching a peak fifteen times greater than the Follower's average NI in Figure 4A. This peak of 0.46 bits of NI was ~30% of that possible for three symbols (1.57 bits).
Lastly, a 60 s moving average of the EEG power values (EEG-PV) was calculated for the 18 Hz segment using the −1, 1, and 3 values numerically. The bar graph in the lower part of Figure 4D showed a mean power value of 0.26, which was significantly lower than the performance average (i.e., the mean performance level of equal numbers of −1, 1 and 3 values) of 1.0 (Z= –2.97, p < 0.05). These results suggest that the organization that produced the elevated NI resulted from persistent deactivation of mu rhythms, which occurred when (F) visualized and performed drawing movements (Caetano et al., 2007; Tognoli and Kelso, 2015).
Transforming EEG μ-Volts Into Information Bits Creates New Behavior-Related Properties
The across-scale parsing of neurodynamic information from the team to the micro level dynamics becomes interrupted at the level of EEG power where symbols representing either activated or de-activated EEG power resulted in elevated neurodynamic organization (Figure 4D). We therefore asked which was the better predictor of team and team member behavior: a measure of organization, (NI, bits of information), or a measure of EEG power levels (EEG-PV). This was tested in two contexts: (1) Distinguishing experienced physician and operating room nurses performances from those of medical students during simulation training; and, (2) distinguishing performance segments associated with verbal uncertainty from those without (Figure 5).
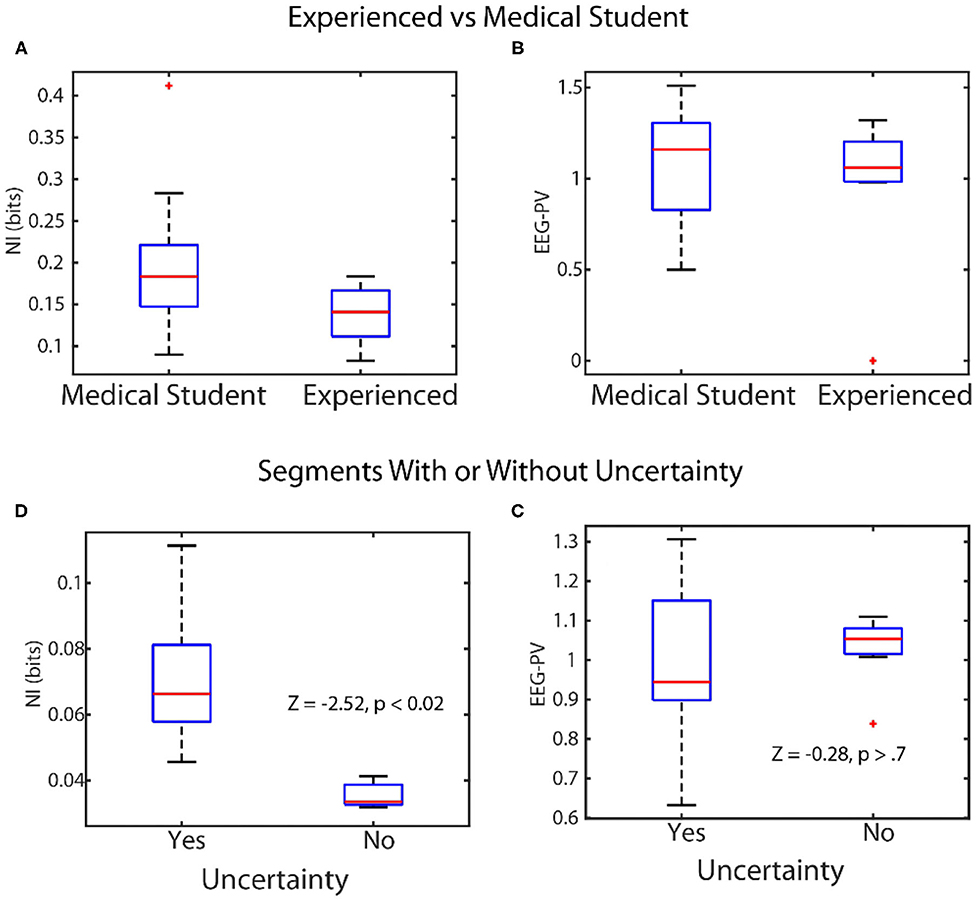
Figure 5. Linking levels of NI and EEG-PV with observable behaviors. Top: The scalp-averaged levels of NI (A), and EEG-PV (B) were compared between fourth-year medical students (n = 15) and experienced operating room physicians and nurses (n = 12) while they performed simulations of patient ventilation. Bottom: The NI (C) and EEG-PV (D) were compared for segments from MT performances where uncertainty was (n = 29) or was not (n = 10) being expressed.
In the first experiment four experienced and five medical student teams performed patient ventilation simulations and the scalp averaged NI and EEG-PV were modeled. The NI levels of medical students (Figure 5A) were significantly higher (median = 0.19 bits), than those of experienced practitioner (Figure 5B) (median = 0.12, Z = −2.0, p = 0.04, Wilcoxon). A similar comparison using EEG-PV from which the NI were derived showed no across-group differences; medical student (median = 1.16), experienced practitioners (median = 1.11, Z = −0.16, p = 0.87).
In the second experiment we asked whether the NI and EEG-PV could equally distinguish MT performance segments where uncertainty was present or absent. The uncertainty was determined by verbalizations of (G) or (F). Twenty-nine segments from six MT performances were isolated where either (G) or (F) verbally indicated uncertainty (71 to 125 s in length (mean/SD = 96.1 ± 17.2 s). These utterances indicated not knowing what to do in the task, confusion about navigation instructions due to mirror map images of (G) and (F), discussions regarding the need to start over, or expressed difficulty during periods where the drawing tool was unresponsive. The NI (Figure 5C) and EEG-PV (Figure 5D) in these segments were compared with ten similarly sized segments where speech indicated no uncertainty or stress. The data for this experiment were acquired as part of a study where unsupervised artificial neural networks were used to categorize the neurodynamic uncertainty of Map Task dyad teams (Stevens and Galloway, 2019).
A Wilcoxon comparison of the NI bits was significantly different between segments with (median = 0.072), and without uncertainty (median = 0.033, Z = 2.52, p < 0.02), while a similar comparison using the EEG-PV was not different between the segments with (median = 0.96) or without expressed uncertainty (median = 1.05, Z = −0.28, p = 0.77).
This comparison confirmed for healthcare teams that the level of neurodynamic organization of experts was lower than that of novices. The data also indicated that the neurodynamic organizational properties of NI were more reflective of macro-scale behaviors than the underlying EEG power values from which the NI was derived. In other words, the data streams consisting of high, average and low EEG-PV lacked the information held by NI that enables linkages to be made with higher level behavioral measures of teamwork.
Neurodynamics of Submarine Piloting and Navigation
The dynamical relationships between NI and EEG-PV were next studied with an expert submarine navigation team who were in port training for a new deployment. The goals were to determine: (1) whether discrete NI dynamics would be seen during a high stakes, high fidelity training exercise when the analysis was restricted to that of an individual sensor and EEG frequency; and, (2) whether the increased NI resulted from persistently activated or deactivated EEG power.
This analysis focused on a periodic training activity called “Rounds” where the position of the submarine is estimated every 3 min using visual and electronic aids. Preliminary studies identified the FzP0 dipole as having the greatest NI in the 10–11 Hz region during periods of Rounds and this is shown in Figure 6C for the Contact Manager (CM).
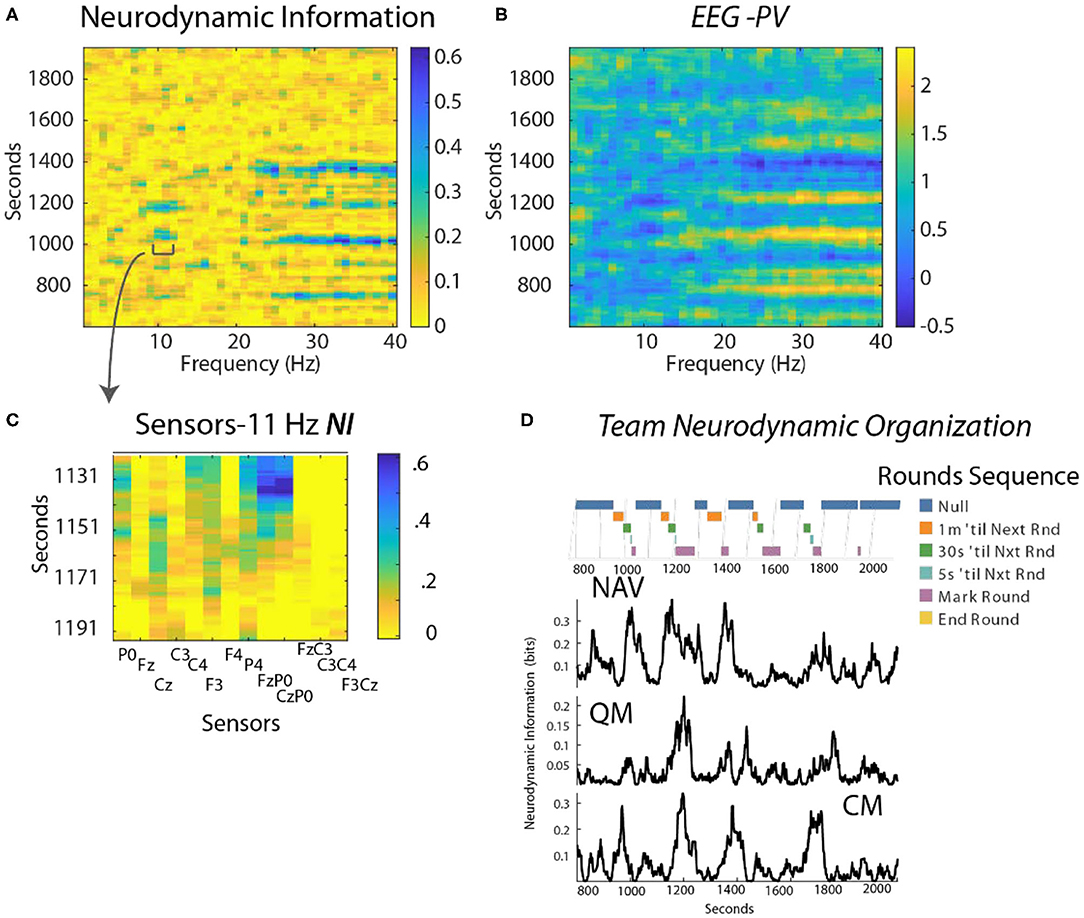
Figure 6. (A) Time x Frequency x NI plot. The color bar indicates the bits of NI. (B) Time x Frequency x EEG-PV plot. The color bar shows the level of EEG-PV calculated from the −1, 1, and 3 values; the average value for each frequency band was 1.0. (C) The data were modeled from the FzP0 dipole of the CM which had the highest NI levels of the channels. (D) The countdowns for the last minute of the five Rounds sequences are plotted vs. time. These figures plot the NI for the Navigator (NV mean NI = 0.23 bits, randomized = 0.01) Quartermaster (QM mean NI = 0.14 bits, randomized = 0.017) and the Contact Manager (CM, mean NI = 0.12 bits, randomized = 0.03).
Time-frequency plots showed NI elevations in the 10–11 Hz, and the 23–40 Hz regions that were spaced at ~3 min. intervals (Figure 6A shown for the CM). The EEG-PV profiles (Figure 6B) showed segments, particularly in the 23–40 Hz bands, with either activated (light bands) or deactivated EEG power (dark bands) that visually aligned near the periods of increased NI.
The NI were analyzed for the NV, QM and CM who were the primary control room navigation team (Figure 6D). The 11 Hz activity is highlighted as it was a frequency distant from the broader 23–40 Hz activity. It was also more discrete, thus allowing a better estimation of the duration of each peak. The individual dynamics are aligned with a timeline marking the 1 min countdown events of the Rounds sequence. The NI peaks for the three team members were weakly correlated (NV-QM, r = 0.36; NV-CM, r = 0.3; QM-CM, r = 0.34; p < 0.01 for all), but not synchronous.
As shown in Figure 7, when measured continuously the correlation between levels of NI and EEG-PV was moderately negative (r = −0.41).
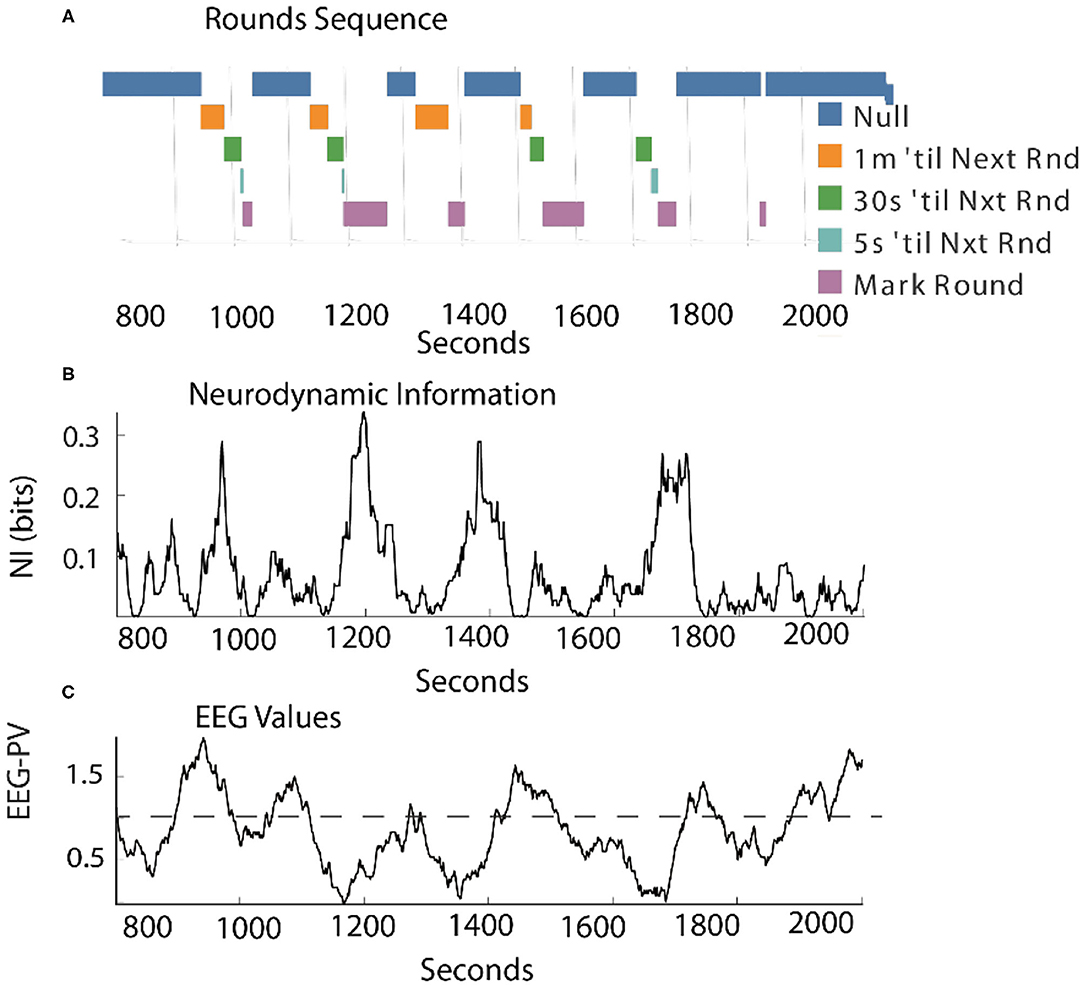
Figure 7. Comparison of the NI and EEG-PV dynamics of the Contact Manager. (A) The countdowns for the last minute of the five Rounds sequences are plotted vs. time. These figures plot the NI (B) and the EEG-PV (C) for the CM. The dotted line in (C) shows the 11 Hz frequency of 1.0 that demarcates positive and negative values. All values are from the FzP0 dipole of each person. The average value of the randomized NI was 0.01 bits. The correlation between (B) and (C) was r = –0.41.
Parsing the Neurodynamic Information of a Medical Flight Team
To gauge the generality of the framework in Figure 3, a similar analysis was performed with an experienced two-person medical flight team where EEG was acquired within a stationary helicopter environment. The task was simulated pediatric bronchiolitis. The Flight Nurse at the head of the child (FN-H) began by unpacking the supplies needed for establishing an airway for the infant (Figure 8A). (FN-H) then calculated and diluted a dosage of ketamine hydrochloride (because of its bronchodilatory properties) for sedation in order to perform the ventilation procedure (i.e., intubation). Two intubation attempts were performed followed by a period of infant monitoring; the elevated NI occurred during the intubation procedures.
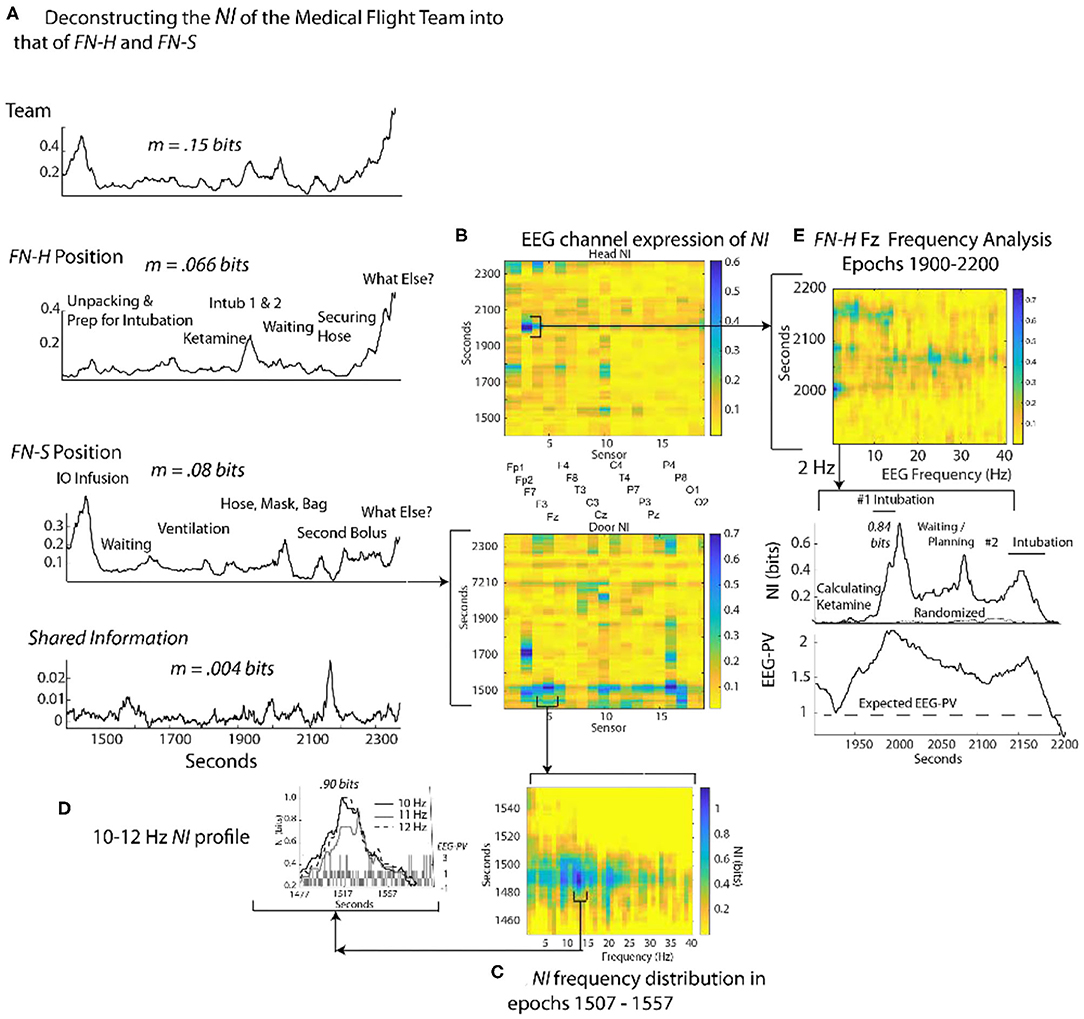
Figure 8. Quantitative comparison of NI levels for a medical flight team. (A) The bits of information of the team, team members and the member's shared information. (B) The NI dynamics at each sensor at for the head (FN-H) and side (FN-S) positions. (C) The elevated NI at the Fz sensor is expanded for one segment (epoch 1507–1557 s) of the FN-S and displayed across the 1–40 Hz EEG frequency spectrum. (D) A profile plot of NI in the 10–12 Hz frequency bands is shown with a bar chart of EEG-PV underneath. (E) A drill-down sequence for FN-H at the sensor level, followed by isolation of the 2 Hz NI and EEG-PV for a segment (1,900–2,200 s) of the P7 channel. The correlation between NI and EEG-PV was r = 0.84.
The Flight Nurse at the side position (FN-S) began with an intraosseous infusion (IO) that required drilling into the child's tibia. Next FN-S rapidly provided rescue ventilation with bag-valve-mask ventilation prior to and after the intubations. For FN-S, the periods of elevated NI occurred during the IO infusion.
The average NI of the two team members (FN-H = 0.066 bits; FN-S = 0.08 bits) and the shared information equaled the information of the team (0.15 bits), a relationship similar to that seen in Figure 4.
At the sensor level the periods of elevated NI involved a subset of EEG channels, which for FN-H were those in the frontal region, while for FN-S they were mostly of the central and parietal regions (Figure 8B). The peaks in the most active EEG channels were often discrete and the NI was enriched over five times the session average (Figure 8C).
Similar to Figure 4, sample NI peaks were further analyzed for the events when FN-S was inserting a needle into the tibia for fluid infusions (Figures 8A,C,D). The NI peak highlighted in Figure 8C (the Fz channel) of FN-S was localized to the 10-12 Hz frequency range and was symmetrical with a half prominence of 36 s (Figure 8D). This peak had NI level (0.9 bits) which was greater than half of the theoretical maximum of 1.59 bits. The bar chart in the lower level of Figure 8D showed a mean power level of 0.2 which was lower than the session average of 1.0 indicating EEG deactivation during this period.
The NI peak of FN-H highlighted in Figure 8B (the F7 channel) was predominantly in the 2–4 Hz frequencies (i.e., delta wave) and was highest (0.84 bits) during the failed intubation attempt (Figure 8E). During the gap between the two intubations there were additional NI elevations in the beta and low gamma range.
Estimating the Magnitude and Duration of NI Peaks
Scalp-averaged NI levels vary based on their frequency, magnitudes and durations of neurodynamic organization. From a training and feedback perspective important questions are: How frequently does uncertainty occur? What is the level of uncertainty? How long is the uncertainty likely to last? The frequency and magnitude of NI peaks can be estimated by peak-finding routines that identify peaks based on the magnitude and the relationships with their neighbors.
Using these routines, the incidence of NI peaks was estimated for the team members of three Life Flight teams each second. For maximum resolution, this was calculated each second for each of the 1–40 Hz bins for each of the 19 sensors (Table 1). Across the six team members the peaks of elevated NI represented 7–8 percent of the total performance times.
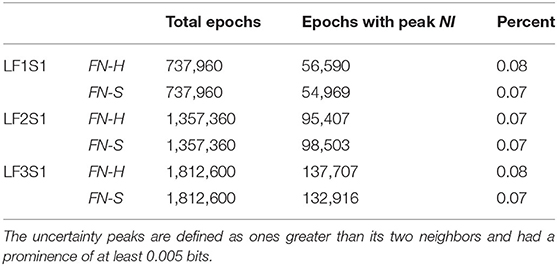
Table 1. Incidence of periods of uncertainty at the EEG frequency level.
The NI profiles in sections Parsing the Neurodynamic Information of a Map Task Performance, Neurodynamics of Submarine Piloting and Navigation, and Parsing the Neurodynamic Information of a Medical Flight Team showed that as the analyses proceeded from the team toward the EEG frequency level the NI peaks became more discrete (Figure 9A) increasing the reliability of the magnitude and duration estimates.
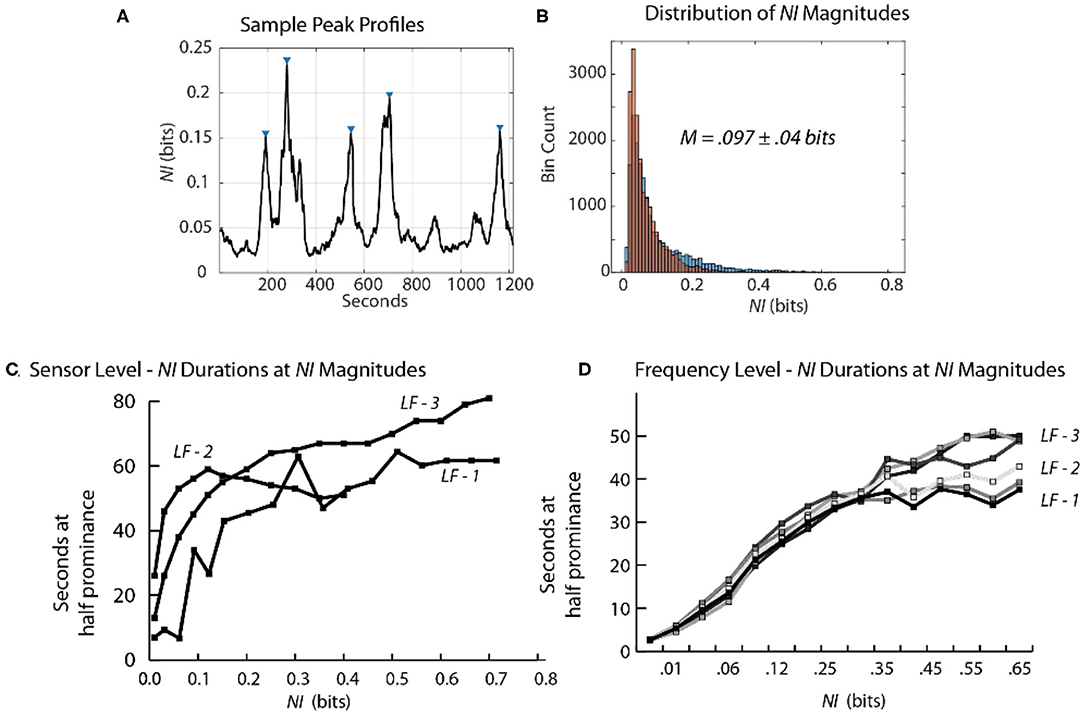
Figure 9. Relationship between the magnitude and duration of NI peaks. (A) A segment of a Life Flight team NDS showing peak identifications, using the findpeaks.m MATLAB® function. The peak magnitudes resulting from this function are based on having a minimum level of magnitude, which was 0.1 bits for this plot. (B) The second-by-second NI distributions from the 19 sensors of the FN-H and FN-S of LF2. (C) This plot shows the duration of peaks (y-axis) within different magnitude intervals (x-axis). (D) The duration of peaks is shown for the six team members when the data streams included the 1–40 Hz frequency bands of each sensor.
At the sensor level, when estimated with a minimum peak prominence of 0.1 bits the mean peak duration was 41 ± 18 s while the mean NI magnitude was 0.097 ± 0.04 bits (Figure 9B). When the NI peak duration was estimated at different prominence levels, it rapidly increased for the first 0.1–0.15 bits and then began to plateau with a duration ~55–60 s.
When similar estimates were performed at the frequency level a similar plateau was observed beginning around 0.2 bits. The plateau was lower (30–50 s) suggesting further peak resolution when parsing to this level (Figures 9C,D).
Performance-Wide NI and EEG-PV Interactions Are Complex
The parsing of NI across different spatial and temporal scales in Figures 4, 7, and 8 provided evidence for both positive and negative correlations between NI and EEG-PV when examined at the level of individual sensors and frequencies.
For FN-H the scalp-averaged correlations (Figure 10A) fluctuated between r > 0.9 to r < −0.65 over the performance. The greatest positive correlation (between 450 and 750 s) coincided with the two endotracheal intubation attempts where there was both high NI and high EEG-PV. The periods of negative correlation were those where FN-H was preparing supplies or monitoring vital signs before and after the change of intubation techniques.
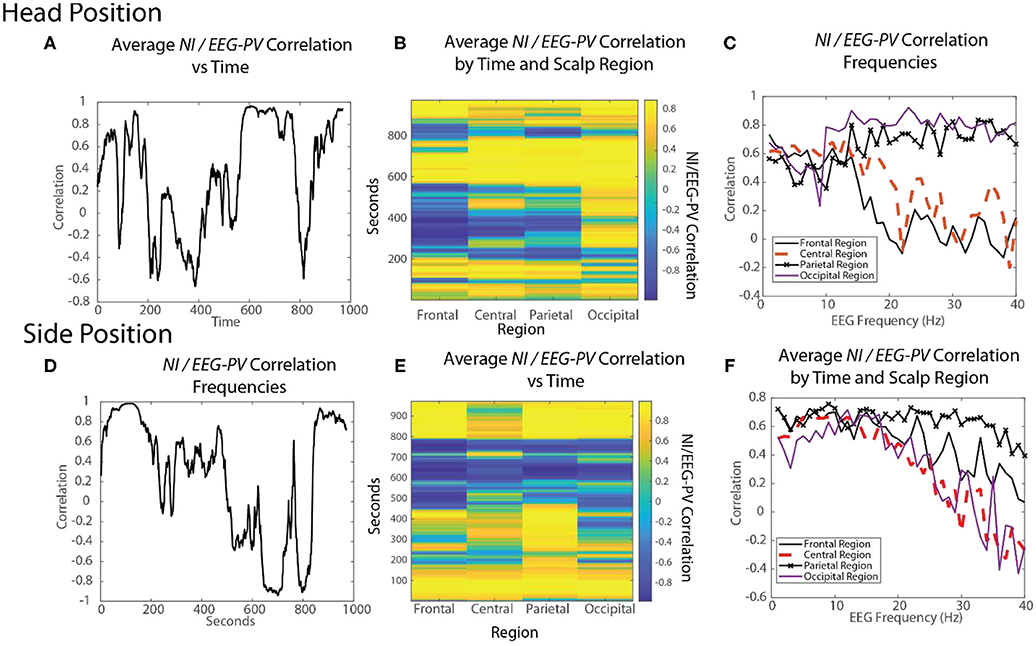
Figure 10. The changing relationships of NI and EEG-PV during an ecologically valid task. The correlation between parallel NI and EEG-PV data streams were measured for FN-H (top) and FN-S during a Life flight performance (LF1). The correlation data was aggregated across the scalp (A,D), regions of the scalp (B,E) or at the EEG frequency level for regions of the scalp (C,F).
For FN-S the scalp-averaged correlations for FN-S (Figure 10D) fluctuated between r > 0.9 to r < −0.9 with the greatest correlation at the beginning of the task while preparing the IO fluid port and the lowest while FN-S was watching FN-H attempt the two intubations.
The scalp-wide analysis was then segmented into the sensors in the frontal (Fp1, Fp2, F7, F3, Fz, F4 F8), central (T3, C3, Cz, C4, T4), parietal (P7, P3, Pz, P4, P8) and occipital (O1, O2) scalp regions. The correlations were then repeated FN-H (Figure 10B) and FN-S (Figure 10E) over a window of 60 s that was updated each second using data from these regions.
For FN-H the strongly positive NI/EEG-PV correlations were scalp-wide indicating a global involvement of all brain regions. The periods of negative correlations appeared more regionally local with the greatest concentration in the frontal region, and the least in the occipital region.
For FN-S the positive correlations at the beginning of the simulation were also scalp-wide, while the negative correlations were both locally and globally distributed (Figure 10E).
The final perspective of the NI / EEG-PV correlations was across the EEG frequency spectrum for the different scalp regions (Figures 10C,F). For the NDS, from both FN-H and FN-S, the positive correlations were present over the 1–15 Hz frequencies. For FN-H, the correlations for the frontal and central regions became negative in the beta and gamma regions approaching r = −2, while those for the parietal and occipital regions remained high. This divergence in NI/EEG-PV correlations between low and high frequencies also occurred with the data from FN-S, but only the correlation in the parietal region remained high in the beta and gamma frequencies.
The high vs. low EEG power and NI relationships are therefore complex. There are suggestions of global brain involvement with higher EEG power which preferentially occurs in the 1–15 Hz EEG bands. As the NI became more regionally local, the correlation with EEG-PV became more neutral to negative implying increased neurodynamic organization as a result of temporally persistent low EEG-PV.
Discussion
Investigators are increasingly turning to sensor technologies, including EEG, to better understand and optimize team training and support, but with little theory to guide them in how to best represent data across the heterogeneous neuronal timescales at micro levels (Murray et al., 2014) and the heterogeneous timescales of teamwork at the macro levels. One challenge is finding representations that bridge the gap between implicit neural and physiologic variables that are inaccessible to visual inspection and understanding (micro scale), with those that are. A second challenge is moving the technologies toward real-time continuous data collection and analysis, which for neural data will almost certainly require abstractions of the lowest levels of neural activity.
The first was that the EEG data streams that were modeled at a 1 Hz resolution contained periods of neurodynamic organization lasting seconds to minutes that under closer inspection linked with observable behaviors like the feeling of uncertainty, or as yet unknown qualities that distinguish experienced operating room staff from medical students. A second theme was that team neurodynamic data when parsed to the level of individual channels and frequencies showed discrete NI peaks of varying frequency, magnitude, and duration. A third theme was that both activated and suppressed EEG amplitudes contributed to elevated NI.
The results in section Transforming EEG μ-volts into information bits creates new behavior-related properties parallel what we previously saw when comparing NI levels and instructor ratings of submarine navigation team performance where there was an inverse correlation between levels of NI and team ratings (Stevens et al., 2017). Combined, the two datasets indicate that higher performing teams are generally less neurodynamically organized than lower performing teams.
The inverse correlation between levels of NI and the experience also has parallels with the idea of neural efficiency in that they are both indicators of more efficient energy states. Neural efficiency refers to the patterns of reduced brain activity with equal or superior performance and was originally described as it related to intelligence (Neubauer and Fink, 2009). The idea of neural efficiency has recently been expanded to include differences between skilled basketball and volleyball players. Studies by Zhang et al. (2019) showed that when imagining performing skills in the domain of their expertise the players showed greater neural efficiency (as measured by fMRI) than when imagining performing in the other sport.
The higher NI levels in less experienced/proficient individuals may be partially explained by the finding that periods of NI increases often occur when there is uncertainty. Uncertainty arises when results do not match expectations, and from the ideas of neural efficiency these might be periods where the complexities of the task outweighed the developed expertise, Less experienced individuals are more likely to experience increases in the frequency, magnitude and/or duration of uncertainty, and the ability to quantitatively measure these dimensions of uncertainty would be useful for probing the details of the novice-expert continuum.
The frequency of encountering uncertain events is a factor of experience (Kennedy et al., 2005; Stevens et al., 2017, 2018). The better prepared an individual/team member is, through training and practice, the less likely s/he is to encounter a surprising event. In part this will be due to the possession of a larger repertoire of complied episodes. One of the consequences of extensive training is that many of the possible perturbations to the team will have been experienced (i.e., this uncertainty would be expected as opposed to unexpected) and the (low) likelihood of their occurrence will have been factored in Soltani and Izquierdo (2019).
The magnitude of uncertainty reflects the costs of searching across levels of cognition to resolve it (Zénon et al., 2018). Events like the loss of mouse cursor control in Figure 4, cause the team to abandon a search of the library of episodes hoping for a relevant match, and instead adopt an exploratory strategy. Such exploration would no longer be spatially and temporally local within the brain and could involve prolonged and distributed iterations of the predictive coding – action cycles of the information hierarchy while evidence is triangulated (Clark, 2016; Shipp, 2016; Yon et al., 2020). During predictive coding, each level of the hierarchy predicts representations in the level below, via backward connections. Predictions are fed backward in the hierarchy and reciprocated by prediction error in the forward direction, acting to modify the representation of the outside world at increasing levels of abstraction, and optimize the nature of perception over a series of iterations. An example would be again from the Map Task in Figure 4 where the highlighted segment is one of a sequence involving elevated NI being detected first in the parietal region (P3) and then moving to the motor regions (C3 and C4 sensors) while options for controlling the mouse are explored.
The factors affecting the third dynamical component, duration, are less understood. Determining how long hesitation will last may be the most difficult to predict, yet probably the most valuable for training. To estimate the duration of uncertainty in these expert teams we parsed the NI data streams into smaller spatial and temporal scales. The data shown in sections Parsing the Neurodynamic Information of a Map Task Performance, Neurodynamics of Submarine Piloting and Navigation, and Parsing the Neurodynamic Information of a Medical Flight Team illustrate how the structural dynamics of NI became more discrete as the neurodynamic analysis of the team was extended to the individual, sensor and then the EEG frequency level. These discrete peaks were also enriched in the levels of NI with extended peaks (40–60 s) approaching the upper theoretical limits of the entropy of the system.
The regional and frequency localization of these peaks, and their association with periods of stress or uncertainty suggests that the responses of experts to these (most likely expected) events are regionally local in the brain. Examples included in this paper are the deactivation of mu rhythms in Figure 4, the activation of delta rhythms in Figure 8 and the (mostly) deactivated alpha rhythms in Figure 7.
The elevated neurodynamic organization of delta waves (2–4 Hz) during periods of task difficulty and of greatest NI levels was unexpected. In the Life Flight performance illustrated in Figure 8 the two team members showed elevated NI in the 1–4 Hz region during two delicate motor activities both of which require focused attention and precise movements. The elevated NI was greatest in the frontal scalp sensors but was detectable scalp-wide. This global scalp distribution is consistent with the general idea in neuroscience that low frequencies tend to be global expressed, while the higher frequencies tend to be more local (Buzaki, 2006).
Delta waves are widely used as proxy for a sleep homeostatic process and have primarily been reported in the context of sleep-wake driven changes (Hubbard et al., 2020), but more recently they have gained attention as a modulator of executive action of motor function (Harmony, 2013).
Recent studies of delta wave suppression have taken advantage of the physiological mirror response where motor activity involuntarily occurs in the opposite side of the body when deliberate motor activity like hand gesturing are planned (Maudrich et al., 2020). When participants were made aware of this activity and asked to inhibit any involuntary co-activation their directed attention exerted an inhibitory drive on the involuntary motor output, and this suppression was accompanied by increased delta power in frontal areas. An important aspect of these studies was that the participants were able to suppress this motor response without any special training or online feedback, just by becoming aware that the mirroring response was occurring. This represents one of the simplest forms of neurofeedback.
The finding of elevated delta NI and EEG-PV is unusual, but not unique to Life Flight simulations. Recently we studied the neurodynamics of a neurosurgery team operating to decompress the peroneal nerve of a live patient (Stevens et al., 2019). For the final clipping of the offending tendon the primary neurosurgeon relieved the resident-neurosurgeon. During the remaining seven minutes elevated NI in the delta region was the dominant neurodynamic feature. The finding of elevated delta NI in the neurosurgeon and expert Life Flight team members may indicate that one of the characteristics of expertise is the finer control of muscle movements during task-critical areas where they have had extensive training.
The analyzing at the EEG channel and frequency levels also enabled estimates to be made of the duration of elevated NI. At the sensor level, the duration of NI peaks began to plateau around 55–65 s when a NI magnitude of ~0.2 bits was reached. When the analysis was repeated using data sampled at the frequency level a plateau was reached around 0.25 bits with a duration of 35–45 s. These results indicate that deriving quantitative estimates of the frequency, magnitude and duration of uncertainty can be realistically accomplished.
The final theme was the relationship between NI levels and levels of activated vs. inactivated EEG amplitude which was clearly complex. The results establish that elevated NI levels can result from both periods of EEG activation as well as deactivation. The associations with macro-scale behaviors however were greater for NI than for EEG-PV implying that the EEG power/organization junction is important for passing messages from micro-scale to macro-scales of teamwork.
The presence of an organizational system of information that parallels the amplitude of EEG rhythms is important as it provides a greatly reduced data dimension while retaining the essential system features, i.e., linkages to higher scale behaviors. In this way the combinatorial explosion of EEG rhythmic variables at micro levels become compressed into an intermediate system of information and organization which links to macro-scale team and team member behaviors.
Data Availability Statement
The raw data supporting the conclusions of this article will be made available by the authors, without undue reservation.
Ethics Statement
The studies involving human participants were reviewed and approved by Biomed IRB, San Diego CA, Naval Submarine Medical Research Board Order of Saint Francis Hospital Institutional Review Board. The patients/participants provided their written informed consent to participate in this study.
Author Contributions
RS and TG co-designed the study and wrote the article. Both authors contributed to the article and approved the submitted version.
Conflict of Interest
RS received his PhD in Molecular Genetics from Harvard University and is Professor (Emeritus), UCLA School of Medicine and a member of the UCLA Brain Research Institute. RS was also employed by The Learning Chameleon, Inc., a for profit educational technology corporation. His recent research had focused on using EEG-derived measures to investigate team neurodynamics in complex, real-world training settings. These studies were leading to quantitative teamwork models showing how teams dynamically reorganize in response to changing environments. TG was employed by, and was the director of cognitive electrophysiology research for The Learning Chameleon laboratory. She received her CPFDA, EFDA and CDA from Oregon Health and Sciences University in 1995 later specializing in several areas of process analysis. Her research interest blend the population based advantages of probabilistic performance modeling with the detection of neurophysiologic signals to help personalize and accelerate the individual and team learning processes.
References
Beck, J. M., Ma, W. J., Kiani, R., Hanks, T., Churchland, A. K., Roitman, J., et al. (2008). Probabilistic population codes for Bayesian decision making. Neuron 60, 1142–1152. doi: 10.1016/j.neuron.2008.09.021
Bigdely-Shamlo, N., Mullen, T., Kothe, C., Su, K. M., and Robbins, K. A. (2015). The PREP pipeline: standardized preprocessing for large-scale EEG analysis. Front. Neuroinform. 9:B153. doi: 10.3389/fninf.2015.00016
Bodala, I. P., Li, J., Thaor, M. V., and Al-Nashas, H. (2018). EEG and eye tracking demonstrate vigilance enhancement with challenge integration. Front. Hum. Neurosci. 10:273. doi: 10.3389/fnhum.2016.00273
Bonnefond, M., and Jensen, O. (2015). Gamma activity coupled to alpha phase as a mechanism for top-down controlled gating. PLoS ONE 10:e012866. doi: 10.1371/journal.pone.0128667
Caetano, G., Jousmaki, V., and Hari, R. (2007). Actor's and observers' primary motor cortices stabilize similarly after seen or heard motor actions. Proc. Natl. Acad. Sci. U.S.A. 104, 9058–9062. doi: 10.1073/pnas.0702453104
Clark, A. (2016). Surfing Uncertainty: Prediction, Action and the Embodied Mind. New York, NY: Oxford University Press. doi: 10.1093/acprof:oso/9780190217013.001.0001
Cooper, R., and Shallice, T. (2000). Contention scheduling and the control of routine activities. Cogn. Neuropsychol. 17, 297–338. doi: 10.1080/026432900380427
Daniels, B., Flack, J., and Krakauer, D. (2017). Dual coding theory explains biphasic collective computation in neural decision-making. Front. Neurosci. 11:313. doi: 10.3389/fnins.2017.00313
Daw, N. D., O'Doherty, J. P., Dayan, P., Seymour, B., and Dolan, R. J. (2006). Cortical substrates for exploratory decisions in humans. Nature 441, 876–879. doi: 10.1038/nature04766
Delorme, A., and Makeig, S. (2004). EEGLAB: an open source toolbox for analysis of single-trial EEG dynamics including independent component analysis. J. Neurosci. Methods 134, 9–21. doi: 10.1016/j.jneumeth.2003.10.009
Delorme, A., Sejnowski, T., and Makeig, S. (2007). Enhanced detection of artifacts in EEG data using higher-order statistics and independent component analysis. Neuroimage 34, 1443–1449. doi: 10.1016/j.neuroimage.2006.11.004
Doherty-Sneddon, G., Anderson, A., O'Malley, C., Langton, S., Garrod, S., and Bruce, V. (1997). Face-to-face and video-mediated communication: a comparison of dialogue structure and task performance. J. Exp. Psychol. Appl. 3, 105–125. doi: 10.1037/1076-898X.3.2.105
Domenech, P., Rheims, S., and Koechlin, E. (2020). Neural mechanisms resolving exploitation-exploration dilemmas in the medial prefrontal cortex. Science 369:1076. doi: 10.1126/science.abb0184
Dragomir, E., Stih, V., and Portugues, R. (2020). Evidence accumulation during a sensorimotor decision task revealed by whole-brain imaging. Nat. Neurosci. 23, 85–93. doi: 10.1038/s41593-019-0535-8
Dunst, B., Benedek, M., Jauk, E., Bergner, S., Koschutnig, K., Sommer, M., et al. (2014). Neural efficiency as a function of task demands. Intelligence 42, 22–30. doi: 10.1016/j.intell.2013.09.005
Farooqui, A., and Manly, T. (2018). Hierarchical cognition causes task related deactivations but not just in the default mode regions. eNeuro 5:ENEURO.0008-18.2018. doi: 10.1101/297259
Farooqui, A., and Manly, T. (2019). We do as we construe: extended behavior construed as one task is executed as one cognitive activity. Psychol. Res. 83, 84–103. doi: 10.1007/s00426-018-1051-2
Flack, J. (2017a). Life's Information Hierarchy. From Matter to Life: Information and Causality. New York, NY: Cambridge University Press.
Flack, J. (2017b). Coarse-graining as a downward causation mechanism. Phil. Trans. R. Soc. A. 375:20160338. doi: 10.1098/rsta.2016.0338
Flack, J., Erwin, D., Elliot, T., and Krakauer, D. (2012). “Timescales, symmetry, and uncertainty reduction in the origins of hierarchy in biological systems,” in Cooperation and its Evolution, eds K. Sterelny, R. Joyce, B. Calcott, and B. Fraser, (Cambridge, MA: MIT press), 45–74.
Fox, M. D., Snyder, A. Z., Vincent, J. L., Corbetta, M., Van Essen, D. C., and Raichle, M. E. (2005). The human brain is intrinsically organized into dynamic, anticorrelated functional networks. Proc. Natl. Acad. Sci. U.S.A. 102, 9673–9678. doi: 10.1073/pnas.0504136102
Friston, K. (2010). The free-energy principle: a unified brain theory? Nat. Rev. Neurosci. 11, 127–138. doi: 10.1038/nrn2787
Friston, K., Kilner, J., and Harrison, L. (2006). A free energy principle for the brain. J. Physiol. 100, 70–87.
Gorman, J., Martin, M., Dunbar, T., Stevens, R., Galloway, T., and Amazeen Linkens, A. (2015). Cross-level effects between neurophysiology and communication during team training. Hum. Factors 58, 181–199. doi: 10.1177/0018720815602575
Gusnard, D., and Raichle, M. (2001). Searching for a baseline: functional imaging and the resting human brain. Nat. Rev. Neurosci. 2, 685–694. doi: 10.1038/35094500
Harmony, T. (2013). The functional significance of delta oscillations in cognitive processing. Front. Integr. Neurosci. 7:83. doi: 10.3389/fnint.2013.00083
Hong, S. L. (2010). The entropy conservation principle: application in ergonomics and human factors. Nonlinear Dynamics Psychol. Life Sci. 14, 291–313.
Hubbard, J., Gent, T. C., Hoekstra, M. M. B., et al. (2020). Rapid fast-delta decay following prolonged wakefulness marks a phase of wake-inertia in NREM sleep. Nat. Commun. 11:3130. doi: 10.1038/s41467-020-16915-0
Kaufman, M. T., Churchland, M., Ryu, S. I., and Shenoy, K. V. (2015). Vacillation, indecision and hesitation in moment-by-moment decoding of monkey motor cortex. eLife 4:e04677doi: 10.7554/eLife.04677
Kennedy, T., Regehr, G., Baker, G. R., and Lingard, L. A. (2005). Progressive independence in clinical training: a tradition worth defending? Acad. Med. J. Assoc. Am. Med. Coll. 80, S106–11. doi: 10.1097/00001888-200510001-00028
Klimesch, W. (2012). Alpha-band oscillations, attention and controlled access to stored information. Trends Cogn. Sci. 16, 606–617. doi: 10.1016/j.tics.2012.10.007
Klimesch, W., Sauseng, P., and Hanslmayr, S. (2006). EEG alpha oscillations: the inhibition-timing hypothesis. Brain Res. Rev. 53, 63–88. doi: 10.1016/j.brainresrev.2006.06.003
Knill, D. C., and Pouget, A. (2004). The bayesian brain: the role of uncertainty in neural coding and computation. Trends Neurosci. 27, 712–719. doi: 10.1016/j.tins.2004.10.007
Kothe, C. (2014). Lab Streaming Layer (LSL). Available online at: https://github.com/sccn/labstreaminglayer (accessed January 14, 2021).
Lachaut, J. P., Axmacher, N., Mormann, F., Halgren, E., and Crone, N. E. (2012). High-frequency neural activity and human cognition: past, present and possible future of intracranial EEG research. Prog. Neurobiol. 98, 279–301. doi: 10.1016/j.pneurobio.2012.06.008
Lachaux, J. P., Jung, J., Dreher, J. C., Bertrand, O., Minotti, L, Hoffman, D., et al. (2008). Silence is golden: transient neural deactivation in the prefrontal cortex during attentive reading. Cerebral Cortex 18, 443–450. doi: 10.1093/cercor/bhm085
Likens, A. D., Amazeen, P., Stevens, R., Gorman, J., and Galloway, T. (2014). Neural signatures of team coordination are revealed by multifractal analysis. Soc. Neurosci. 9, 219–234. doi: 10.1080/17470919.2014.882861
Likens, A. D., and Wiltshire, T. J. (2020). Windowed multi-scale synchrony: Modeling time-varying and scale-localized interpersonal coordination. Soc. Cogn. Affect. Neurosci. 30:nsaa130. doi: 10.1093/scan/nsaa130
Maudrich, T., Kenville, R., Maudrich, D., Villringer, A., Ragert, P., and Nikulin, V. V. (2020). Voluntary inhibition of physiological mirror activity: an EEG-EMG study. eNeuro 7:ENEURO.0326-20.2020. doi: 10.1523/ENEURO.0326-20.2020
McKiernan, K. A., Kaufman, J. N., Kucera-Thompson, J., and Binder, J. R. (2003). A parametric manipulation of factors affecting task-induced deactivation in functional neuroimaging. J. Cogn. Neurosci. 15, 394–408. doi: 10.1162/089892903321593117
Mullen, T. (2012). NITRC: CleanLine: Tool/Resource Info. Available online at: http://www.nitrc.org/projects/cleanline (accessed January 14, 2021).
Mullen, T. R., Kothe, C. A., Chi, Y. M., Ojeda, A., Kerth, T., Makeig, S., et al. (2015). Real-time neuroimaging and cognitive monitoring using wearable dry EEG. IEEE Trans. Biomed. Eng. 62, 2553–2567. doi: 10.1109/TBME.2015.2481482
Murray, J., Bernacchia, A., Freedman, D., Romo, R., Wallis, J. D., Cai, X., et al. (2014). A hierarchy of intrinsic timescales across primate cortex. Nat. Neurosci. 17, 1661–1663. doi: 10.1038/nn.3862
Neubauer, A. C., and Fink, A. (2009). Intelligence and neural efficiency. Neurosci. Biobehav. Rev. 33, 1004–1023. doi: 10.1016/j.neubiorev.2009.04.001
Nikolaus, K., Marieke, M., and Peter, B. (2008). Representational similarity analysis - connecting the branches of systems neuroscience. Front. Syst. Neurosci. 2:4. doi: 10.3389/neuro.06.004.2008
Oostenveld, R., Fries, P., Maris, E., and Schoffelen, M. (2011). FieldTrip: open source software for advanced analysis of MEG, EEG, and invasive electrophysiological data. Comput. Intell. Neurosci. 2011:156869. doi: 10.1155/2011/156869
O'Rielly, T. X. (2013). Making predictions in a changing world: inference, uncertainty and learning. Front. Neurosci. 7:105. doi: 10.3389/fnins.2013.00105
Ossandon, T., Jerbi, K., Vidal, J. R., Bayle, D. J., Henaff, M. A., Jung, J., et al. (2011). Transient suppression of broadband gamma power in the default mode network is correlated with task complexity and subject performance. J. Neurosci. 31, 14521–14530. doi: 10.1523/JNEUROSCI.2483-11.2011
Perez, A., Dumas, G., Karadag, M., and Dunabeitia, J. A. (2019). Differential brain-to-brain entrainment while speaking and listening in native and foreign languages. Cortex 111, 303–315. doi: 10.1016/j.cortex.2018.11.026
Pezzulo, G., Rigoli, F., and Friston, J. J. (2018). Hierarchical active inference: A theory of motivated control. Trends Cogn. Sci. 22:4. doi: 10.1016/j.tics.2018.01.009
Rumelhart, D. E. (1980). “Schemata: the building blocks of cognition,” in Theoretical Issues in Reading Comprehension (Perspectives from Cognitive Psychology, Linguistics, Artificial Intelligence and Education), eds R. J Spiro, B. C. Bruce, and W. F. Brewer (Mahwah, NJ: Erlbaum), 33–58. doi: 10.4324/9781315107493-4
Sänger, J., Müller, V., and Lindenberger, U. (2012). Intra- and interbrain synchronization and network properties when playing guitar in duets. Front. Hum. Neurosci. 6:312. doi: 10.3389/fnhum.2012.00312
Schank, R. C., and Abelson, R. P. (1977). Scripts, Plans, Goals and Understanding: An Inquiry into Human Knowledge Structures. Mahwah, NJ: Lawrence Erlbaum Associates.
Schneider, D. W., and Logan, D. (2015). Chunking away task-switch costs: a test of the chunk-point hypothesis. Psychol. Bull. Rev. 22:884–889. doi: 10.3758/s13423-014-0721-3
Sedley, W., and Cunningham, M. O. (2013). Do cortical gamma oscillations promote or suppress perception? An under-asked question with an over-assumed answer. Front. Hum. Neurosci. 7:595. doi: 10.3389/fnhum.2013.00595
Sengupta, B., Stemmler, M. B., and Friston, K. J. (2013). Information and efficiency in the nervous system—a synthesis. PLoS Comput. Biol. 9:e1003157. doi: 10.1371/journal.pcbi.1003157
Shannon, C. (1948). The mathematical theory of communication. Bell Syst. Tech. J. 27, 379–423. doi: 10.1002/j.1538-7305.1948.tb01338.x
Shannon, C. E. (1951). Prediction and entropy of printed English. Bell Syst. Tech. J. 30, 50–64. doi: 10.1002/j.1538-7305.1951.tb01366.x
Shipp, S. (2016). Neural elements for predictive coding Front. Psychol. 7:1792. doi: 10.3389/fpsyg.2016.01792
Soltani, A., and Izquierdo, A. (2019). Adaptive learning under expected and unexpected uncertainty. Nat. Rev. Neurosci. 20, 435–544. doi: 10.1038/s41583-019-0180-y
Stephens, G., Silbert, L., and Hasson, U. (2010). Speaker-listener neural coupling underlies successful communication. Proc. Natl. Acad. Sci. U.S.A. 107, 14425–14430. doi: 10.1073/pnas.1008662107
Stevens, R., and Galloway, T. (2014). Toward a quantitative description of the neurodynamic organizations of teams. Soc. Neurosci. 9, 160–173. doi: 10.1080/17470919.2014.883324
Stevens, R., and Galloway, T. (2015). Modeling the neurodynamic organizations and interactions of teams. Soc. Neurosci. 11, 123–139. doi: 10.1080/17470919.2015.1056883
Stevens, R., and Galloway, T. (2016). Tracing neurodynamic information flows during teamwork. Nonlinear Dynamics Psychol. Life Sci. 20, 271–292.
Stevens, R., and Galloway, T. (2017). Are neurodynamic organizations a fundamental property of teamwork? Front. Psychol. 8:644. doi: 10.3389/fpsyg.2017.00644
Stevens, R., and Galloway, T. (2019). Teaching machines to recognize neurodynamic correlates of team and team member uncertainty. J. Cogn. Eng. Decis. Making 13, 310–327. doi: 10.1177/1555343419874569
Stevens, R., Galloway, T., Halpin, D., and Willemsen-Dunlap, A. (2016). Healthcare teams neurodynamically reorganize when resolving uncertainty. Entropy 18:427, doi: 10.3390/e18120427
Stevens, R., Galloway, T., Lamb, J., Steed, R., and Lamb, C. (2017). “Linking team neurodynamic organizations with observational ratings of team performance,” in Innovative Assessment of Collaboration, eds A. A. Von Davier, P. C. Kyllonen, and M. Zhu (Cham: Springer International Publishing), doi: 10.1007/978-3-319-33261-1_20
Stevens, R., Galloway, T., and Willemsen-Dunlap. (2018). Quantitative modeling of individual, shared and team neurodynamic information. Hum. Factors 60, 1022–1034. doi: 10.1177/0018720818781623
Stevens, R., Galloway, T. L., and Willemsen-Dunlap, A. (2019). Advancing our understandings of healthcare team dynamics from the simulation room to the operating room: a neurodynamic perspective. Front. Psychol. 10:1660. doi: 10.3389/fpsyg.2019.01660
Stevens, R., Gorman, J. C., Amazeen, P., Likens, A., and Galloway, T. (2013). The organizational neurodynamics of teams. Nonlinear Dynamics Psychol. Life Sci. 17, 67–86.
Stroulia, E., and Goel, A. K. (1994). Task structures: what to learn? AAAI Tech. Rep. SS94–02, DD94–DD02.
Sun, C., Yang, W., Martin, J., and Tonegawa, S. (2020). Hippocampal neurons represents events as transferable units of experience. Nat. Neuro. 23, 651–663. doi: 10.1038/s41593-020-0614-x
Tognoli, E., and Kelso, J. A. (2015). The coordination dynamics of social neuromarkers. Front. Hum. Neurosci. 9:563. doi: 10.3389/fnhum.2015.00563
Walker, E. Y., Cotton, R. J., Ma, J. W., and Tolias, A. S. (2020). A neural basis of probabilistic computation in visual cortex. Nat. Neurosci. 23, 122–129. doi: 10.1038/s41593-019-0554-5
Welch, P. (1967). The use of fast fourier transform for the estimation of power spectra: a method based on time averaging over short, modified periodograms. IEEE Trans. Audio Electroacoustics 15, 70–73. doi: 10.1109/TAU.1967.1161901
Wianda, E., and Ross, B. (2019). The roles of alpha oscillations in working memory retention. Brain Behav. 9:e01263. doi: 10.1002/brb3.1263
Yon, D., Zainzinger, V., de Lange, F. P., Eimer, M., and Press, C. (2020). Action biases perceptual decisions toward expected outcomes. J. Exp. Psychol. Gen. doi: 10.1037/xge0000826
Zénon, A., Solopchuk, O., and Pezzulo, G. (2018). An information-theoretic perspective on the costs of cognition. Neuropsychologia 123, 5–18. doi: 10.1016/j.neuropsychologia.2018.09.013
Keywords: teamwork, EEG, uncertainty, information, team neurodynamics, social coordination dynamics
Citation: Stevens RH and Galloway TL (2021) Parsing Neurodynamic Information Streams to Estimate the Frequency, Magnitude and Duration of Team Uncertainty. Front. Syst. Neurosci. 15:606823. doi: 10.3389/fnsys.2021.606823
Received: 15 September 2020; Accepted: 04 January 2021;
Published: 01 February 2021.
Edited by:
Alessandro E. P. Villa, Neuro-Heuristic Research Group (NHRG), SwitzerlandReviewed by:
Viktor Varga, Institute of Experimental Medicine (MTA), HungaryDiego Minciacchi, University of Florence, Italy
Copyright © 2021 Stevens and Galloway. This is an open-access article distributed under the terms of the Creative Commons Attribution License (CC BY). The use, distribution or reproduction in other forums is permitted, provided the original author(s) and the copyright owner(s) are credited and that the original publication in this journal is cited, in accordance with accepted academic practice. No use, distribution or reproduction is permitted which does not comply with these terms.
*Correspondence: Ronald H. Stevens, aW1tZXhyQGdtYWlsLmNvbQ==