 Chau Vu1,2
 Botian Xu1,2
 Clio González-Zacarías2,3,4
 Jian Shen1,2
 Koen P. A. Baas5
 Soyoung Choi2,3,4
 Aart J. Nederveen5
 John C. Wood1,2*
- 1Department of Biomedical Engineering, University of Southern California, Los Angeles, CA, United States
- 2Division of Cardiology, Children’s Hospital Los Angeles, University of Southern California, Los Angeles, CA, United States
- 3Neuroscience Graduate Program, University of Southern California, Los Angeles, CA, United States
- 4Signal and Image Processing Institute, University of Southern California, Los Angeles, CA, United States
- 5Department of Radiology and Nuclear Medicine, Amsterdam UMC, Location AMC, Amsterdam, Netherlands
Introduction: Deoxygenation-based dynamic susceptibility contrast (dDSC) has previously leveraged respiratory challenges to modulate blood oxygen content as an endogenous source of contrast alternative to gadolinium injection in perfusion-weighted MRI. This work proposed the use of sinusoidal modulation of end-tidal CO2 pressures (SineCO2), which has previously been used to measure cerebrovascular reactivity, to induce susceptibility-weighted gradient-echo signal loss to measure brain perfusion.
Methods: SineCO2 was performed in 10 healthy volunteers (age 37 ± 11, 60% female), and tracer kinetics model was applied in the frequency domain to calculate cerebral blood flow, cerebral blood volume, mean transit time, and temporal delay. These perfusion estimates were compared against reference techniques, including gadolinium-based DSC, arterial spin labeling, and phase contrast.
Results: Our results showed regional agreement between SineCO2 and the clinical comparators. SineCO2 was able to generate robust CVR maps in conjunction to baseline perfusion estimates.
Discussion: Overall, this work demonstrated feasibility of using sinusoidal CO2 respiratory paradigm to simultaneously acquire both cerebral perfusion and cerebrovascular reactivity maps in one imaging sequence.
1 Introduction
Perfusion magnetic resonance imaging (MRI) is a popular imaging technique for assessing hemodynamic impairments in a variety of central nervous system abnormalities such as intracranial tumors and acute strokes (Jahng et al., 2014). There are multiple different MRI techniques to measure cerebral perfusion, including phase contrast (PC), arterial spin labeling (ASL), and dynamic susceptibility contrast (DSC).
Particularly, DSC MRI is a perfusion technique that is frequently performed in clinical routines, requiring intravenous injection of a contrast agent (gadolinium chelate) and dynamic imaging to capture the passage of the contrast bolus through the vasculature (Østergaard, 2005). Based on the susceptibility-induced signal loss caused by the paramagnetic contrast, tracer kinetics models are applied to calculate multiple perfusion parameters. Despite its popular usage and clinical utility, DSC suffers from its reliance on exogenous gadolinium contrasts, which pose increased risks of anaphylaxis, nephrogenic systemic fibrosis, (Schlaudecker and Bernheisel, 2009) and gadolinium deposition in different tissues (Strickler and Clark, 2021).
To address this drawback, recent works have proposed contrast-free deoxygenation-based DSC (dDSC) which take advantage of endogenous paramagnetic deoxyhemoglobin to induce susceptibility-weighted MRI signal losses, similar to the effects of gadolinium (MacDonald et al., 2018; Poublanc et al., 2021; Vu et al., 2021). This dDSC technique delivers boluses of deoxygenated hemoglobin through transient exposure to low-oxygen (hypoxia) or high-oxygen (hyperoxia) gas inhalation (Meier and Zierler, 1954; Østergaard et al., 1996; Østergaard, 2005) and has demonstrated feasibility in healthy volunteers as well as chronic anemia subjects who had elevated blood flow and shortened transit time (Vu et al., 2021).
One of the obstacles to perfusion quantification in both gadolinium-based and deoxygenation-based DSC is the determination of cerebral blood flow (CBF), which requires a deconvolution between the signals in the blood and in the tissue. Traditionally, this deconvolution is performed using a singular value decomposition (SVD) approach in the time domain (Østergaard et al., 1996). In this work, we propose to replace the transient contrast bolus with a sinusoidal gas challenge and compute perfusion at the fundamental sinusoidal frequency in the Fourier domain, thereby simplifying the SVD deconvolution process. We also propose to raise and lower the concentration of deoxygenated hemoglobin through modulations of end-tidal CO2 level (Figure 1A), rather than manipulating the inspired oxygen concentration. The sinusoidal end-tidal CO2 fluctuations (SineCO2), and corresponding changes in oxygen delivery, trigger reciprocal changes in the gradient-echo MRI signals that can be converted into CBF estimates. In order to assess the feasibility of this new perfusion technique, we evaluated SineCO2 on 10 healthy volunteers in comparison with perfusion measurements from standard gadolinium-based DSC, ASL, and PC MRI.
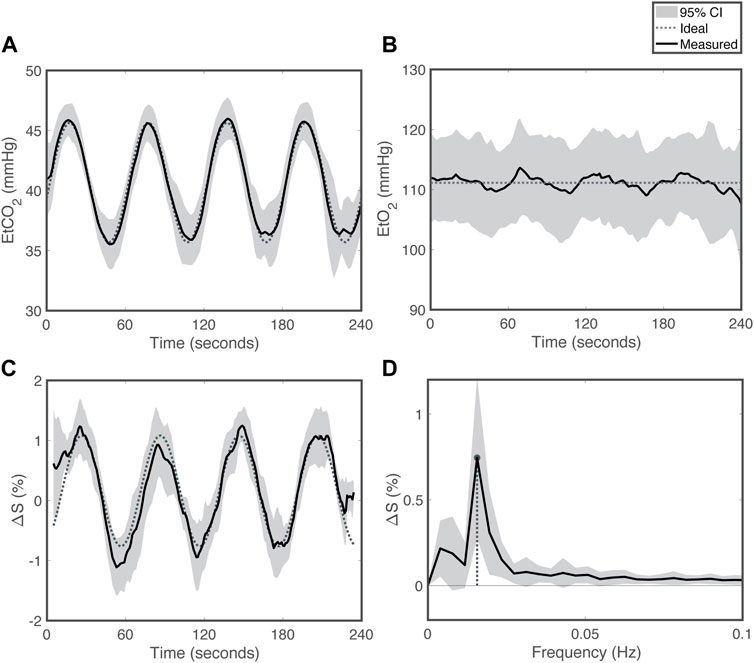
FIGURE 1. Respiratory challenge patterns for SineCO2 (A) End-tidal carbon dioxide (EtCO2), (B) end-tidal oxygen (EtO2), (C) percent signal change in the time domain and (D) in the frequency domain. Grey shading reflects 95% confidence interval. Dotted line represents the targeted sequence, and solid line is the average time series measured in the cohort.
2 Materials and methods
2.1 Study protocol
The Committee on Clinical Investigation at Children’s Hospital Los Angeles approved the protocol; written informed consent was obtained from all subjects (CCI#20-00050). This study was performed in accordance with the Declaration of Helsinki.
A total of 10 healthy volunteers participated in this study during the months of April and May of 2021. Exclusion criteria included pregnancy, hypertension, diabetes, stroke or other known neurologic insult, seizures, known developmental delay or learning disability, at least one ‘yes’ answer to the 6-question Choyke survey (Choyke et al., 1998), and measured glomerular filtration rate (GFR) lower than 60 mL/min/1.73 mm2 (Østergaard, 2005). Imaging, vital signs (heart rate, blood pressure, temperature, and oxygen saturation), and blood samples (for complete blood count) were collected for each subject on the same study visit date.
2.2 Respiratory challenges
Respiratory challenges were performed by prospectively targeting end-tidal O2 (EtO2) and end-tidal CO2 (EtCO2) partial pressures using a specialized computer-controlled gas blender (RespirAct, Thornhill Research, Toronto, Canada) (Slessarev et al., 2007). This device measures the subject’s baseline EtO2 and EtCO2 during the initial preparation phase and delivers specific concentrations of oxygen and carbon-dioxide during the challenge phase to accurately target EtO2 and EtCO2 values. Fingertip pulse oximetry SpO2 (Nonin, Plymouth, MN) was recorded continuously during gas challenges. SineCO2 challenge was performed, in which EtO2 was clamped at subject-specific baseline and EtCO2 was modulated in a sine wave between 35 and 45 mmHg with a period of 60 s (Blockley et al., 2011). This period was fourfold longer than the brain’s characteristic rise-time in response to CO2 (Duffin et al., 2015) and has previously been used in published CVR protocols (Blockley et al., 2011).
2.3 MRI experiment
2.3.1 Structural MRI
All MRI was acquired on a 3T Philips Achieva (Philips Medical Systems, Best, Netherlands) with a 32-channel head-coil. Pre-contrast anatomical 3D T1 was acquired with the following parameters: TR = 8 ms, TE = 3.7 ms, flip angle = 8°, and resolution = 1 mm isotropic. Total scan time was 5:18 for T1 sequence.
Pre-processing steps on structural T1-weighted images consist of brain extraction, tissue classification into grey matter (GM), white matter (WM) and segmentation using the BrainSuite Anatomical Pipeline (brainsuite.org, v.21a). Tissue segmentation into 312 regions-of-interest (ROI) was performed using the USCBrain anatomical atlas (Joshi et al., 2022), whose labels were modified to include subdelineations of deep WM tissue (manually drawn WM structures) and the cerebellum [transferred from the probabilistic atlas of the human cerebellum (Diedrichsen et al., 2009)]. All cortical ROIs were separately labeled into GM and gyral WM regions. Subsequently, these labels were transferred to each subject’s structural imaging space.
2.3.2 Arterial spin labeling (ASL)
Time-encoded pseudo-continuous ASL was acquired with the following parameters: TE = 16 ms, TR = 5,040 ms, Hadamard-8 matrix with seven blocks of 2,000, 800, 500, 300, 250, 200, and 150 ms, post-label delay (PLD) = 100 ms, SENSE = 2.5, resolution = 3 mm × 3 mm × 6 mm, FOV = 240 mm × 240 mm × 114 mm, two FOCI background suppression pulses, 2D single-shot EPI readout, and 12 signal averages. M0 images were acquired by switching off labeling and background suppression and keeping the same imaging parameters, except for TR = 2,500 ms. Scan time was 8:44 for ASL sequence and 18 s for M0 sequence.
Perfusion quantification was performed using FSL BASIL toolbox (FSL, Oxford, United Kingdom). Additional details on acquisition and processing of the time-encoded ASL sequence have been previously published (Afzali-Hashemi et al., 2021). Briefly, all perfusion weighted images were motion-corrected to the first dynamic using SPM12 (Wellcome Trust Center for Neuroimaging, London, United Kingdom). The individual acquisitions were subsequently subtracted according to a Hadamard-8 matrix to obtain perfusion weight images having PLD values of 100, 250, 450, 700, 1,000, 1,500, and 2,300 ms. The individual PLD images experienced different numbers of background suppression pulses and were divided by a correction factor of (0.95)N, where N was the number of pulses. The signal variation across PLD was denoised using a spatiotemporal generalized variation model as described by (Spann et al., 2017). The denoised perfusion weighted images were processed using the BASIL toolbox which uses Bayesian inference to fit arterial transit time, arterial blood volume and CBF voxelwise using an extended kinetic model (Chappell et al., 2010). Blood T1 was derived from the subject’s measured hematocrit (Lu et al., 2004). Subject-specific labeling efficiency was derived from the flow-weighted velocity measured from the phase contrast images (Aslan et al., 2010). The final maps were smoothed using a Gaussian lowpass filter with full-width half maximum value of 3.5 mm.
Subsequently, perfusion maps were registered to dDSC native space for comparison.
2.3.3 Phase contrast (PC)
Single-slice PC images were acquired above the carotid bifurcation: TR = 17 ms, TE = 10 ms, flip angle = 10°, resolution = 0.6 mm × 0.6 mm, FOV = 220 mm × 220 mm, slice thickness = 5 mm, and velocity encoding gradient of 80 cm/s. The scan was ungated and used 10 averages to compensate for pulsatility. Scan time was 1:06 for the phase contrast acquisition. Details on calculation of total CBF from four feeding arteries were published in previous works. (Coloigner et al., 2020; Wymer et al., 2020). Briefly, vessel edges were derived from the complex-difference images using Canny edge detection from MATLAB (MathWorks, Natick, MA). Subsequent vessel areas were mapped to the phase-difference (velocity) images and total brain blood flow was calculated as follows:
where V is the velocity map (after appropriate scaling for geometry and velocity encoding), the inner summation is across the N voxels in the vessel and the outer summation is across the four feeding vessels. The total CBF was then normalized to brain weight by calculating the total brain volume from the 3D T1w image (BrainSuite, brainsuite.org, v.21a) and assuming a brain density of 1.05 g/mL.
2.3.4 Gadolinium-based DSC
Traditional gadolinium DSC was acquired using a dual-echo gradient-echo blood-oxygen level dependent (BOLD) MRI sequence with the following parameters: TR = 1.5 s, TE = 8/35 ms, flip angle = 30°, FOV = 190 mm × 190 mm × 100 mm, resolution = 2.5 mm× 2.5 mm × 5 mm, 160 dynamics, SENSE = 2, and no multi-band acceleration. The FOV was aligned with the previous dDSC acquisition at the time of scanning. Scan time was 4:05.
Gadovist at 0.1 mmol/kg was injected at a rate of 4 cc per second using a 20 or 22 gauge IV. Due to the lack of a power injector at our research facility, gadolinium contrast was injected manually by a physician. Contrast bolus was followed by 20 mL of saline flush via a three-way stopcock.
Gadolinium-based DSC BOLD images were preprocessed using the spatial functional processing pipeline similar to dDSC preprocessing, as detailed below. Perfusion values for CBF, cerebral blood volume (CBV), and mean transit time (MTT) were calculated based on published pipelines for gadolinium DSC (Stokes et al., 2021). Final rigid registration of perfusion images to deoxygenation DSC native space was performed for regional comparison.
2.3.5 Deoxygenation-based DSC MRI
Dynamic gradient-echo BOLD MRI was acquired for the SineCO2 challenge with the following parameters: TR = 1.5 s, TE = 35/90 ms, flip angle = 52°, FOV = 190 mm × 190 mm × 100 mm, resolution = 2.5 mm isotropic, SENSE = 1, multi-band SENSE = 4, phase-encoding direction = AP, fat-shift direction = P, and 220 dynamics. One dynamic of reverse-gradient BOLD was acquired with the opposite fat-shift direction = A along the phase encoding direction. Scan time was 5:05 for the BOLD sequence and 9 s for the reverse-gradient BOLD.
To correct for EPI-induced distortion, BOLD images were pre-processed with field map calculated from opposite phase encoding directions. Motion correction with Analysis of Functional NeuroImages (AFNI, USA) and slice timing correction with FMRIB Software Library (FSL, Oxford, United Kingdom) were performed in that order. Registration of BOLD to T1 space was performed in BrainSuite. Finally, BOLD images were smoothed using a 4 mm × 4 mm × 4 mm Gaussian kernel.
All subsequent dDSC processing was performed in MATLAB (MathWorks, Natick, MA). Signal contribution from pial veins was suppressed by eliminating voxels with higher signal amplitude than the 98th percentile (Bhogal et al., 2022). Whole brain (WB), GM, and WM perfusion values was computed by averaging voxels within brain and tissue-specific masks in each subject’s functional native space.
2.4 Data analysis for deoxygenation-based DSC
2.4.1 Gradient-echo
Perfusion measures were calculated for both the single-echo data at 35 ms and dual-echo data at TEs of 35 and 90 ms. Single echo
where
Dual echo
2.4.2 Venous output function (VOF)
Venules have the largest BOLD fluctuation in response to CO2 stimuli because the blood volume is close to 100%, instead of <10% for brain tissue. The great cerebral veins not only have the largest signal intensity changes, but they have the longest delay relative to the global BOLD signal. Individual VOFs were obtained automatically by choosing 20 voxels with the highest integrated, rectified signal intensity (Carroll et al., 2003) and delay greater than the 98th percentile (Bhogal et al., 2022). To convert
2.4.3 Time delay (TD)
Since the signal at each voxel was a sinusoid, whose phase could be estimated, TD was computed as the phase delay of tissue:
where
2.4.4 Cerebral blood flow (CBF)
For traditional DSC, CBF is usually calculated by deconvolution with singular value decomposition (SVD) between the tissue signal and the blood VOF signal: (Østergaard et al., 1996):
For SineCO2, CBF was calculated in the frequency domain based on the magnitude spectra of Fourier-transformed tracer kinetics model (Eq. 4):
The residue function
2.4.5 Cerebral blood volume (CBV)
CBV was calculated as
2.4.6 Mean transit time (MTT)
MTT was computed using central volume theorem as the ratio between CBV and CBF (Stewart, 1893):
2.4.7 Cerebrovascular reactivity (CVR)
To generate the CVR maps, temporal alignment and least squares fitting were applied between the single-echo BOLD at TE of 35 ms and EtCO2 signals on a voxel-by-voxel basis, with the slope term as CVR calculation (Liu et al., 2019a). Maps of voxel-wise ratio between CBF and CVR for individual subjects were generated for regional comparison between the two parameters.
2.5 Statistical analysis
Statistical analysis was performed in R statistical package (R Core Team, Vienna, Austria). Amplitude, phase, and period of sinusoidal signals were computed by fitting the BOLD signals (either single-echo at TE of 35 ms or dual-echo at TEs of 35 and 90 ms) to sine waves while minimizing least-squares errors. Temporal SNR of the sinusoidal BOLD signal was calculated as the ratio between the peak-to-peak amplitude and the standard deviation of the BOLD fluctuations after removing the fundamental sine wave.
Perfusion measurements were checked for normality with Shapiro-Wilk test. To compare global perfusions between SineCO2 and DSC, ASL, or PC reference, paired t-test was performed. Reproducibility was assessed from two iterations of two-cycle sinusoid for SineCO2. Test-retest and intersubject coefficient-of-variation were reported.
Within each subject, agreement between pairs of methods was assessed using correlation and limits of agreement analyses. Pearson correlation coefficient
3 Results
3.1 Respiratory challenges
All 10 subjects successfully completed the SineCO2 respiratory challenge, but one subject was excluded from the group analysis because of gas leakage from the mask caused by facial hair, and one subject was excluded since the timing of the gas challenge and the BOLD imaging was incorrectly aligned at the time of the experiment.
None of the subjects reported discomfort during SineCO2 respiratory challenge. Baseline tidal volumes and respiration rates were 772 ± 292 mL and 17.2 ± 3.3 breaths/min and did not change significantly during CO2 modulations (p = 0.27 and p = 0.82, respectively). Initial EtCO2 and EtO2 recordings were 41.0 ± 3.5 mmHg and 110.4 ± 7.0 mmHg in the cohort. During SineCO2, continuous measurements of EtCO2 demonstrated sinusoidal amplitudes of 4.6 ± 0.8 mmHg (Figure 1A), whereas EtO2 was kept level at baseline (Figure 1B). SpO2 remained level at 98.4% ± 0.9% during the challenge.
Under CO2-induced vasodilation and vasoconstriction, single-echo gradient-echo MRI signal at TE of 35 ms varied in a sinusoidal pattern with peak-to-peak amplitude of 1.20% ± 0.44% (ΔR2* = 0.34 ± 0.13 s−1) relative to baseline (Figure 1C), higher in the GM (1.52% ± 0.57%, ΔR2* = 0.43 ± 0.16 s−1) compared to WM (0.58% ± 0.26%, ΔR2* = 0.17 ± 0.07 s−1, p<0.01). Temporal SNR was 1.36 ± 0.52 in the whole brain, 1.72 ± 0.66 in GM, and 0.92 ± 0.38 in WM. In the Fourier domain, global signals demonstrated a peak at 0.17 Hz, corresponding to a sine wave period of 60 s (Figure 1D).
3.2 Perfusion measurements
3.2.1 Single-echo SineCO2
Perfusion parameters for the whole brain, GM, and WM are displayed in Table 1; individual CBF, CBV, TD, and MTT maps by single-echo SineCO2 at TE of 35 ms are shown in Figure 2. Similar spatial distribution is observed in CBF and CBV maps (Figure 2), with GM-WM ratio of 2.1 ± 0.1 for CBV and 1.9 ± 0.1 for CBF. Both TD and MTT maps showed shorter venous delay in deep WM compared to GM (p = 0.02 and p<0.01, respectively), but distribution is heterogeneous between subjects (Figure 2).
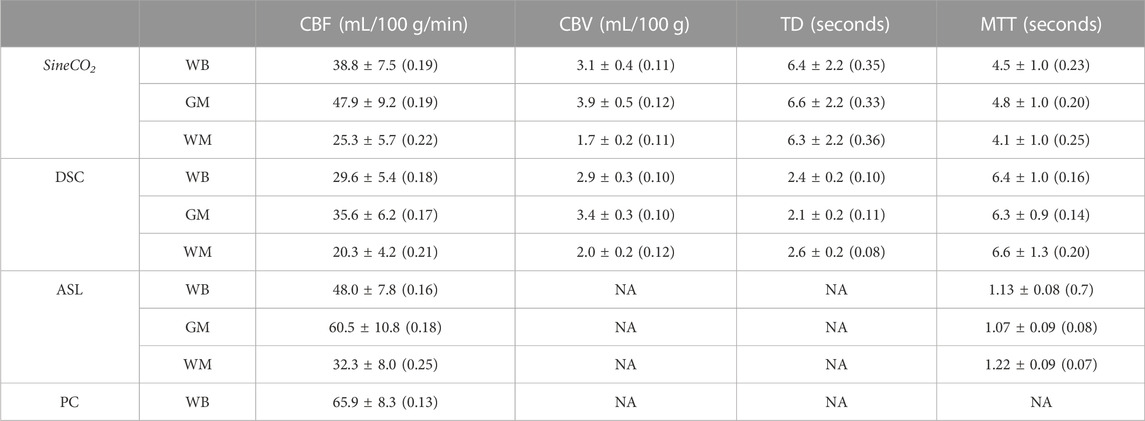
TABLE 1. Regional perfusion estimates by SineCO2 and three reference standards ASL, DSC, and PC in the whole brain (WB), grey matter (GM), and white matter (WM).
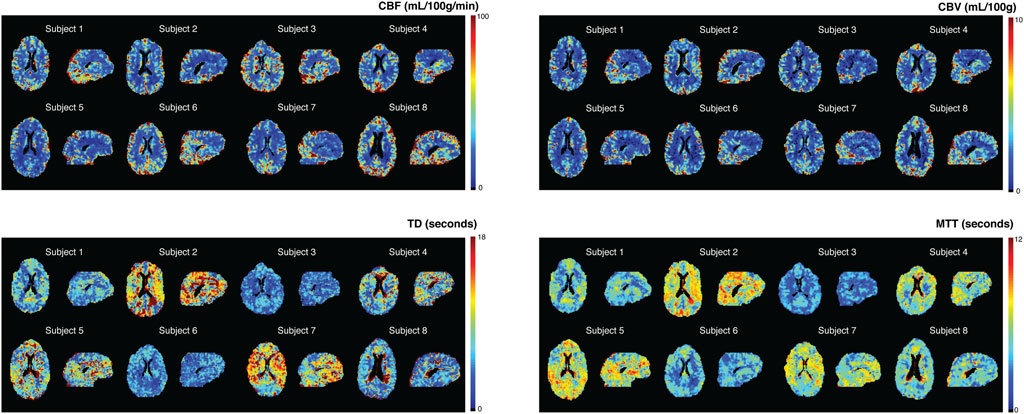
FIGURE 2. SineCO2 CBF, CBV, TD, and MTT maps for individual subjects.
3.2.1.1 CBF
To evaluate quantitative perfusion by SineCO2, mean CBF values are shown in Table 1 in comparison with gadolinium-based DSC, ASL, and PC. In the whole brain, SineCO2 CBF trended lower compared to ASL (p = 0.08) but was significantly lower than PC (p = 0.01) and higher than DSC (p = 0.04). In terms of reproducibility, there was no significant difference between two repetitions (p = 0.47) with a test-retest coefficient of variation of 21%. The intersubject coefficient of variation was 19%, slightly higher compared to DSC (18%), ASL (16%), and PC (13%).
Within-subject correlations and Bland-Altman analyses are shown for a representative subject in Figure 3, and individual analyses are in Supplementary Figures S1, S2, demonstrating similar correlation and width of the limits of agreement between SineCO2 and reference techniques compared to agreement amongst DSC and ASL references.
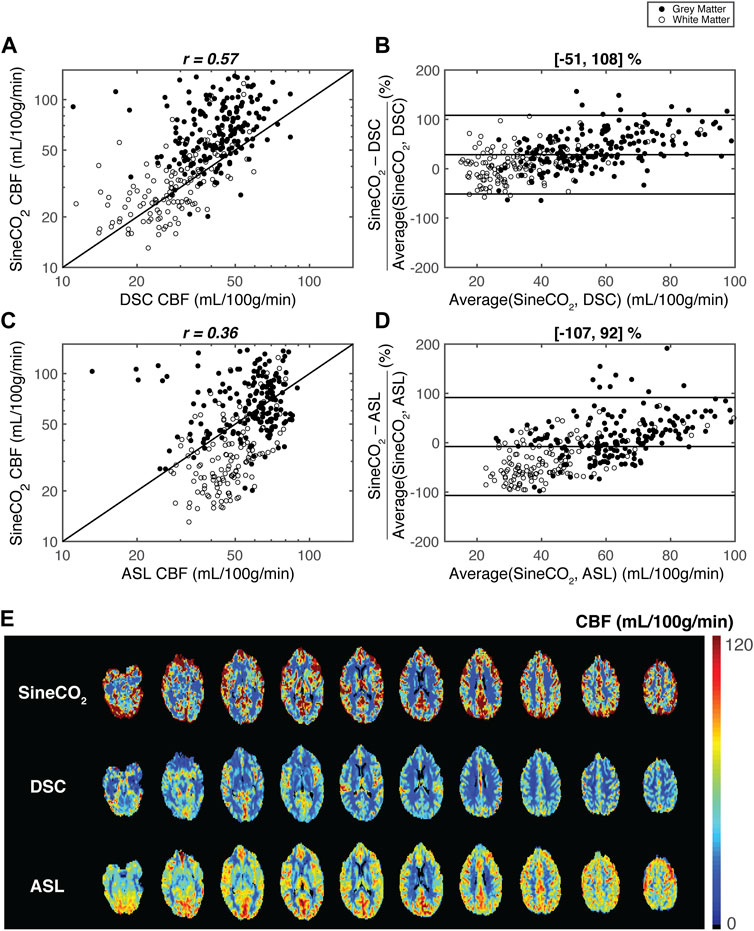
FIGURE 3. Regional agreement between respiratory challenge SineCO2 and reference standards DSC and ASL in a representation subject. Correlation and Bland-Altman limits of agreement analyses using 312 regions-of-interest between (A–B) SineCO2 and DSC and (C–D) SineCO2, and ASL (E) CBF maps in representative subject by three techniques.
3.2.1.2 CBV
SineCO2 was not different from CBV by DSC (p = 0.36), and regional correlation was high across ROIs and similar to agreement observed in CBF (Supplementary Figure S3). Intersubject coefficient of variation was 11%, and test-retest coefficient of variation was 20%, demonstrating no significant difference between the two repetitions (p = 0.18).
3.2.1.3 TD
TD values by SineCO2 were significantly longer compared to DSC (p < 0.01). Opposite trends were observed between the two techniques, with prolonged TD in WM in DSC but shortened WM delay relative to venous signal in SineCO2 challenge. Compared to CBF and CBV measurements, TD maps were noisier (Figure 2C), with a test-retest coefficient of variation of 25% and intersubject coefficient of variation of 35%.
3.2.1.4 MTT
Shorter MTT values were observed in SineCO2 compared to DSC (p = 0.01), and grey matter showed longer transit time than white matter (p < 0.01). No correlation was observed with DSC MTT (not shown). Test-retest and intersubject coefficients of variation were 17% and 23%, respectively.
3.2.2 Dual-echo SineCO2
Compared to the global ΔR2* 0.34 ± 0.13 s−1 obtained at the first TE = 35 ms, dual-echo ΔR2* at TEs of 35 and 90 ms was 0.22 ± 0.08 s−1 (p < 0.01). Temporal SNR was lower in the dual-echo signal (tSNR = 0.82 ± 0.32, p = 0.03). Individual CBF, CBV, TD, and MTT maps using the dual-echo approach (Supplementary Figure S4) show a similar spatial distribution compared to single-echo perfusion maps (Figure 2). However, dual-echo maps are noisier and yield a higher bias in CBF compared to DSC and ASL (data not shown).
3.3 Cerebrovascular reactivity
Individual CVR maps are shown in Figure 4. Mean CVR was 0.24% ± 0.06%/mmHg in the cohort, significantly higher in the GM (0.28% ± 0.07%/mmHg) compared to the WM (0.13% ± 0.03%/mmHg, p<0.01). Spatial patterns of CVR maps are similar to CBF and CBV maps generated from the SineCO2 technique. Ratio maps between CBF and CVR (Supplementary Figure S5) demonstrated areas of negative CVR in the deep white matter areas as well as disproportionally higher ratio in the white matter compared to GM.
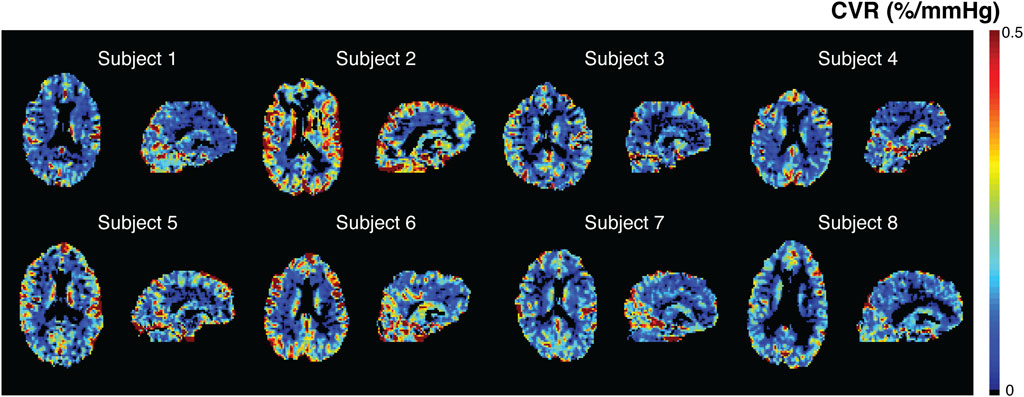
FIGURE 4. SineCO2 CVR maps in individual subjects.
4 Discussion
In this work, we employed a technique previously used to measure CVR with a CO2 respiratory challenge to modulate cerebral saturation and BOLD signal in a sinusoidal pattern (Blockley et al., 2011), after which tracer kinetics equations were applied in the frequency domain to compute perfusion parameters. SineCO2 CBF, and CBV values were within acceptable range of literature (Grandin et al., 2005), but MTT was larger than expected (Ibaraki et al., 2007). Single-echo acquisition yielded better temporal SNR and better image quality compared to dual-echo approach. CBF estimates were compared with three reference techniques, gadolinium-based DSC, ASL, and PC, and demonstrated no bias with ASL and PC but overestimation compared to DSC. The limits of agreement were large between SineCO2 with ASL, and DSC but were comparable to agreement amongst the reference techniques and previously reported agreement between DSC and PET (Grandin et al., 2005). Despite the systematic biases, perfusion maps showed regional agreement between the techniques, indicating that SineCO2 has the potential to differentiate diseased and normal-appearing tissue in cerebral pathologies such as ischemic strokes or brain tumors.
The use of CO2 vasoactive stimulus represents a divergence from previous deoxygenation-based DSC studies, which utilize hypoxia or hyperoxia respiratory challenges to directly deliver boluses of deoxygenated hemoglobin (MacDonald et al., 2018; Poublanc et al., 2021; Vu et al., 2021). Capnic challenges raise and lower cerebral saturation through vasodilation and vasoconstriction within the capillary beds, so the sinusoidal modulations are not present on the arterial side but instead only in vessels undergoing oxygen exchange and large veins. Therefore, this source of contrast results in an anti-causal system where the VOF is used in lieu of an AIF. Conceptually, this is analogous to playing a cine-angiogram in reverse. Even though the anti-causality is not compatible with traditional tracer kinetics model (Meier and Zierler, 1954; Østergaard, 2005), computation of CBF in the frequency domain ignores the phase in favor of the magnitude, which is independent of the relative delay between tissue and VOF signals. CBV estimates in typical DSC experiments are corrected with the area-under-curve of a VOF signal, which is usually less vulnerable to partial volume effects compared to AIF (Knutsson et al., 2010); therefore, CBV measures are also independent of the use of VOF. On the other hand, TD is calculated as the delay between the phase of the tissue signal and venous phase for SineCO2 instead of arterial phase in DSC; therefore, TD maps demonstrated opposite trends between the two techniques.
The SineCO2 approach has some interesting properties. Overall, since the endogenous contrast is generated by oxygen exchange, it cannot detect actual or effective shunt flow, potentially underestimating true perfusion. The contrast change results from a cascaded transport system, in which the CO2 stimulus passes through an initial cerebrovascular response transfer function followed by a secondary residue function that governs the propagation of deoxyhemoglobin. The complexity of this higher-order system is simplified by the capability to extract a VOF signal, which relates to the signal only through the residue transfer function. The indirect mode of contrast generation also requires some cerebrovascular reactivity to generate a signal suitable for CBF estimation, hence it is not surprising that CVR, CBF, and CBV maps resemble one another. In brain regions where resting flow is preserved but CVR is abnormal, signal-to-noise of the CBF and CBV estimates will be poor.
CO2 modulations also have complex cerebrovascular and peripheral hemodynamic effects, including changes in respiratory rates, tidal volumes, heart rates, blood pressures, and perfusion values, proportionally to the extent and duration of CO2 inhalation. The upward swing of the CO2 sinusoid is a hypercapnic stimulus which results in increase in CBF (Kety and Schmidt, 1948), whereas the trough of the sinusoid represents a hypocapnic stimulus with a decrease in flow. Assuming ±5 mmHg fluctuations in EtCO2 remain within the autoregulatory range (Battisti-Charbonney et al., 2011), 1 mmHg change in EtCO2 typically induces 1–2 mL/100 g/min change in CBF (Kety and Schmidt, 1948; Brian, 1998). Therefore, CBF in the tracer kinetic model can be written as a function of time
Additionally, the vasoactive effects of CO2 challenge can potentially explain the divergence in regional agreement between SineCO2 and ASL. During sustained hyperemia, cortical GM regions are prioritized compared to deep WM (Chai et al., 2019). This steal phenomenon occurs in which blood flow preferentially increases in GM at the expense of WM (Poublanc et al., 2013), causing higher sinusoid amplitudes in GM and thus overestimation of CBF in cortical regions. On the other hand, since flow changes are lower within WM, CBF measurements are not as high in WM in SineCO2 compared to baseline measurements by ASL.
Other limitations include the study design of administering the sinusoidal stimulus about a fixed EtCO2 value of 40 mmHg regardless of the subject’s initial EtCO2 levels; in subjects of high baseline CO2 partial pressure, this paradigm induced hypocapnia and hyperventilation response that lengthened transit time (Ito et al., 2003) and potentially explained the heterogeneous distribution in several TD maps (Angleys et al., 2015). Clamping the average end-tidal CO2 to 40 mmHg may also introduce a small “step” response in the BOLD signal for individuals whose resting end-tidal CO2 is far from 40 mmHg. However, limiting our analysis to a single frequency minimized error contributions from this effect. Despite targeting a single fundamental frequency fc, in practice only a perfect sinusoid can be accomplished on positive cycles. The shape of the negative cycle depends on the subject’s hyperpneic response from the previous positive cycle, thus introducing a small non-linearity and frequencies outside the target range. Lastly, since the signal is venous-weighted, SpO2 values could not be used to convert
Despite the shortcomings, the most significant advantage to SineCO2 perfusion imaging is that sinusoidal CO2 respiratory challenge is a robust mechanism to measure CVR (Blockley et al., 2011). Previous works have demonstrated that 32% of the variation in GM CVR is explained by variation in baseline CBF (Afzali-Hashemi et al., 2021), so these two parameters are tightly coupled together and are known to vary with changes in EtCO2 (Hou et al., 2020). However, measurement of CVR can still yield additional information, as illustrated by the existence of negative CVR values in deep WM unseen on CBF maps. Divergence in CBF and CVR as shown in the ratio maps typically happens in areas of low flow and long delay, in which CBF can increase in response to CO2 but requires sufficient time to reach the hypercapnic ceiling and can potentially be classified as negative CVR (Poublanc et al., 2015). In this current technique, SineCO2 CBF measurements are calculated purely from the magnitude spectrum and are independent of phase delay, but CVR estimates computed from traditional general linear model approach are influenced by vascular delay (Poublanc et al., 2015; Liu et al., 2019b). Therefore, SineCO2 capability to acquire both perfusion and reactivity simultaneously in one imaging sequence is of high interest in cerebrovascular diseases and gives it an edge over other conventional perfusion MRI techniques.
Most of SineCO2 potential diagnostic power lies in perfusion imaging of strokes or gliomas, especially in more vulnerable populations in whom gadolinium injection is undesirable, such as renal-impaired or pediatric patients. However, the fundamental difference between gadolinium contrast and deoxyhemoglobin contrast may allow them to play complementary roles in perfusion imaging for these pathologies. For ischemic strokes in which the penumbra is under low oxygen delivery, CO2-induced modulations in CBF can lead to reperfusion of the damaged regions (Brambrink and Orfanakis, 2010), which can yield a completely different perfusion distribution compared to gadolinium DSC. In brain tumors, gadolinium-based contrast extravasation through the disrupted blood-brain barrier can result in altered CBV measurements (Ho et al., 2016); on the other hand, deoxygenation-based contrast remains purely intravascular. Therefore, CBV measured using gadolinium-based DSC within gliomas might differ compared to SineCO2 CBV. These potential divergences in the two techniques require additional work to evaluate the diagnostic role of SineCO2 in different cerebrovascular pathologies.
In conclusion, this validation study established feasibility of using SineCO2 to measure perfusion and demonstrated agreement between SineCO2 against three reference perfusion techniques, DSC, ASL, and PC. Despite the systematic bias, in clinical routines, neuroradiologists typically rely on relative perfusion differences between diseased and normal-appearing tissue rather than absolute perfusion, so SineCO2 relative perfusion maps may still be useful clinically independent of VOF selection. Additionally, SineCO2 also represents an easy approach to generate CBF maps independent of confounding parameters in SVD deconvolution and minimize MRI time by simultaneous acquisition of perfusion and reactivity in one imaging sequence.
Data availability statement
De-identified imaging data and processing code will be made available to qualified researchers on a case-by-case basis after obtaining approval from the Children’s Hospital Los Angeles regulatory authorities.
Ethics statement
The studies involving human participants were reviewed and approved by The Committee on Clinical Investigation at Children’s Hospital Los Angeles approved the protocol (CCI#20-00050). The patients/participants provided their written informed consent to participate in this study.
Author contributions
CV and JW designed the research study and wrote the manuscript. CV, BX, CG-Z, JS, KB, and SC collected the data. CV, BX, CG-Z, JS, and SC analyzed the data. AN and JW assisted with the interpretation of the data. All authors edited and approved this manuscript.
Funding
This work was supported by National Heart, Lung, and Blood Institute (grant 1U01-HL-117718-01, 1R01-HL136484-01A1), the National Center for Research (5UL1-TR000130-05) through the Clinical Translational Science Institute at Children’s Hospital Los Angeles, the National Institutes of Health (grant R01-NS074980), and the National Institute of Neurological Disorders and Stroke (grant 1F31NS106828-01A1). CV was supported by the Core Pilot Program and a Research Career Development Fellowship from the Saban Research Institute at Children’s Hospital Los Angeles. Philips Healthcare provided support for protocol development and applications engineering on a support-in-kind basis.
Acknowledgments
The authors would like to thank Dr. Ashley Stokes and colleagues for the generous release of the DSC imaging sequence and processing script. We would like to thank Dr. Jon Detterich and Dr. Andrew Cheng for their help with the experiments. We would like to thank Obdulio Carreras and Silvie Suriany for subject recruitment and coordinating efforts. We would like to thank Noel Arugay, Julia Castro, Mercedes Landaverde, and Lisa Villanueva for their help with MRI scheduling and scanning. We would also like to thank Dr. Joseph Fisher, Dr. David Mikulis, Dr. Julien Poublanc, Dr. James Duffin, Dr. Olivia Sobczyk, Ece Su Sayin, and Harrison Levine for their valuable discussions and critiques.
Conflict of interest
JW: Research funding NHLBI and NIDDK of the National Institutes of Health, Research Support-in-Kind from Philips Healthcare, Consultant for BluebirdBio, Celgene, Apopharma, WorldcareClinical, and BiomeInformatics.
The remaining authors declare that the research was conducted in the absence of any commercial or financial relationships that could be construed as a potential conflict of interest.
Publisher’s note
All claims expressed in this article are solely those of the authors and do not necessarily represent those of their affiliated organizations, or those of the publisher, the editors and the reviewers. Any product that may be evaluated in this article, or claim that may be made by its manufacturer, is not guaranteed or endorsed by the publisher.
Supplementary material
The Supplementary Material for this article can be found online at: https://www.frontiersin.org/articles/10.3389/fphys.2023.1102983/full#supplementary-material
References
Afzali-Hashemi L., Baas K. P. A., Schrantee A., Coolen B. F., van Osch M. J. P., Spann S. M., et al. (2021). Impairment of cerebrovascular hemodynamics in patients with severe and milder forms of sickle cell disease. Front. Physiol. 12, 645205. doi:10.3389/FPHYS.2021.645205
Angleys H., Østergaard L., Jespersen S. N. (2015). The effects of capillary transit time heterogeneity (CTH) on brain oxygenation. J. Cereb. Blood Flow. Metab. 35 (5), 806–817. doi:10.1038/JCBFM.2014.254
Aslan S., Xu F., Wang P. L., Uh J., Yezhuvath U. S., van Osch M., et al. (2010). Estimation of labeling efficiency in pseudocontinuous arterial spin labeling. Magn. Reson Med. 63 (3), 765–771. doi:10.1002/mrm.22245
Battisti-Charbonney A., Fisher J., Duffin J. (2011). The cerebrovascular response to carbon dioxide in humans. J. Physiol. 589 (12), 3039–3048. doi:10.1113/jphysiol.2011.206052
Bhogal A. A., Sayin E. S., Poublanc J., Duffin J., Fisher J. A., Sobcyzk O., et al. (2022). Quantifying cerebral blood arrival times using hypoxia-mediated arterial BOLD contrast. Neuroimage 261, 119523. doi:10.1016/j.neuroimage.2022.119523
Bland J. M., Altman D. G. (1999). Measuring agreement in method comparison studies. Stat. Methods Med. Res. 8 (2), 135–160. doi:10.1177/096228029900800204
Blockley N. P., Driver I. D., Francis S. T., Fisher J. A., Gowland P. A. (2011). An improved method for acquiring cerebrovascular reactivity maps. Magn. Reson Med. 65 (5), 1278–1286. doi:10.1002/mrm.22719
Brambrink A., Orfanakis A. (2010). Therapeutic hypercapnia” after ischemic brain injury: Is there a potential for neuroprotection? Anesthesiology 112 (2), 274–276. doi:10.1097/ALN.0B013E3181CA8273
Brian J. E. (1998). Carbon dioxide and the cerebral circulation. Anesthesiology 88 (5), 1365–1386. doi:10.1097/00000542-199805000-00029
Carroll T. J., Rowley H. A., Haughton V. M. (2003). Automatic calculation of the arterial input function for cerebral perfusion imaging with MR imaging. Radiology 227 (2), 593–600. doi:10.1148/radiol.2272020092
Chai Y., Bush A. M., Coloigner J., Nederveen A. J., Tamrazi B., Vu C., et al. (2019). White matter has impaired resting oxygen delivery in sickle cell patients. Am. J. Hematol. 94 (4), 467–474. doi:10.1002/AJH.25423
Chappell M. A., MacIntosh B. J., Donahue M. J., Günther M., Jezzard P., Woolrich M. W. (2010). Separation of macrovascular signal in multi-inversion time arterial spin labelling MRI. Magn. Reson Med. 63 (5), 1357–1365. doi:10.1002/MRM.22320
Choyke P., Cady J., DePollar S., Austin H. (1998). Determination of serum creatinine prior to iodinated contrast media: Is it necessary in all patients? Tech. Urol. 4 (2), 65–69. Available at: https://pubmed.ncbi.nlm.nih.gov/9623618/ (Accessed July 2, 2022).
Coloigner J., Vu C., Borzage M., Bush A., Choi S., Miao X., et al. (2020). Transient hypoxia model revealed cerebrovascular impairment in anemia using BOLD MRI and near-infrared spectroscopy. J. Magn. Reson Imaging 52 (5), 1400–1412. doi:10.1002/JMRI.27210
Diedrichsen J., Balsters J. H., Flavell J., Cussans E., Ramnani N. (2009). A probabilistic MR atlas of the human cerebellum. Neuroimage 46 (1), 39–46. doi:10.1016/j.neuroimage.2009.01.045
Duffin J., Sobczyk O., Crawley A. P., Poublanc J., Mikulis D. J., Fisher J. A. (2015). The dynamics of cerebrovascular reactivity shown with transfer function analysis. Neuroimage 114, 207–216. doi:10.1016/j.neuroimage.2015.04.029
Giavarina D. (2015). Understanding Bland altman analysis. Biochem. medica 25 (2), 141–151. doi:10.11613/BM.2015.015
Grandin C., Bol A., Smith A., Michel C., Cosnard G. (2005). Absolute CBF and CBV measurements by MRI bolus tracking before and after acetazolamide challenge: Repeatabilily and comparison with PET in humans. Neuroimage 26 (2), 525–535. doi:10.1016/j.neuroimage.2005.02.028
Ho C. Y., Cardinal J. S., Kamer A. P., Lin C., Kralik S. (2016). Contrast leakage patterns from dynamic susceptibility contrast perfusion MRI in the grading of primary pediatric brain tumors. Am. J. Neuroradiol. 37 (3), 544–551. doi:10.3174/ajnr.A4559
Hou X., Liu P., Li Y., Jiang D., De Vis J. B., Lin Z., et al. (2020). The association between BOLD-based cerebrovascular reactivity (CVR) and end-tidal CO2 in healthy subjects. Neuroimage 207, 116365. doi:10.1016/j.neuroimage.2019.116365
Ibaraki M., Ito H., Shimosegawa E., Toyoshima H., Ishigame K., Takahashi K., et al. (2007). Cerebral vascular mean transit time in healthy humans: A comparative study with PET and dynamic susceptibility contrast-enhanced MRI. J. Cereb. Blood Flow. Metab. 27 (2), 404–413. doi:10.1038/sj.jcbfm.9600337
Ito H., Kanno I., Ibaraki M., Hatazawa J., Miura S. (2003). Changes in human cerebral blood flow and cerebral blood volume during hypercapnia and hypocapnia measured by positron emission tomography. J. Cereb. Blood Flow. Metab. 23 (6), 665–670. doi:10.1097/01.WCB.0000067721.64998.F5
Jahng G-H., Li K-L., Ostergaard L., Calamante F. (2014). Perfusion magnetic resonance imaging: A comprehensive update on principles and techniques. Korean J. Radiol. 15 (5), 554–577. doi:10.3348/kjr.2014.15.5.554
Joshi A. A., Choi S., Liu Y., Chong M., Sonkar G., Gonzalez-Martinez J., et al. (2022). A hybrid high-resolution anatomical MRI atlas with sub-parcellation of cortical gyri using resting fMRI. J. Neurosci. Methods 374, 109566. doi:10.1016/j.jneumeth.2022.109566
Kety S. S., Schmidt C. F. (1948). The effects of altered arterial tensions of carbon dioxide and oxygen on cerebral blood flow and cerebral oxygen consumption of normal young men. J. Clin. Invest. 27 (4), 484–492. doi:10.1172/JCI101995
Knutsson L., van Westen D., Petersen E. T., Bloch K. M., Holtas S., Stahlberg F., et al. (2010). Absolute quantification of cerebral blood flow: Correlation between dynamic susceptibility contrast MRI and model-free arterial spin labeling. Magn. Reson Imaging 28 (1), 1–7. doi:10.1016/J.MRI.2009.06.006
Liu P., De Vis J. B., Lu H. (2019). Cerebrovascular reactivity (CVR) MRI with CO2 challenge: A technical review. Neuroimage 187, 104–115. doi:10.1016/J.NEUROIMAGE.2018.03.047
Liu P., De Vis J. B., Lu H. (2019). Cerebrovascular reactivity (CVR) MRI with CO2 challenge: A technical review. Neuroimage 187, 104–115. doi:10.1016/j.neuroimage.2018.03.047
Lu H., Clingman C., Golay X., Van Zijl P. C. M. (2004). Determining the longitudinal relaxation time (T1) of blood at 3.0 Tesla. Magn. Reson Med. 52 (3), 679–682. doi:10.1002/MRM.20178
Ma C., Jensen M. M., Smets B. F., Thamdrup B. (2017). Pathways and controls of N2O production in nitritation-anammox biomass. Environ. Sci. Technol. 51 (16), 8981–8991. doi:10.1021/acs.est.7b01225
MacDonald M. E., Berman A. J. L., Mazerolle E. L., Williams R. J., Pike G. B. (2018). Modeling hyperoxia-induced BOLD signal dynamics to estimate cerebral blood flow, volume and mean transit time. Neuroimage 178, 461–474. doi:10.1016/j.neuroimage.2018.05.066
Meier P., Zierler K. L. (1954). On the theory of the indicator-dilution method for measurement of blood flow and volume. J. Appl. Physiol. 6 (12), 731–744. doi:10.1152/jappl.1954.6.12.731
Østergaard L. (2005). Principles of cerebral perfusion imaging by bolus tracking. J. Magn. Reson Imaging 22 (6), 710–717. doi:10.1002/JMRI.20460
Østergaard L., Weisskoff R. M., Chesler D. A., Gyldensted G., Rosen B. R. (1996). High resolution measurement of cerebral blood flow using intravascular tracer bolus passages. Part I: Mathematical approach and statistical analysis. Magn. Reson Med. 36 (5), 715–725. doi:10.1002/MRM.1910360510
Poublanc J., Crawley A. P., Sobczyk O., Montandon G., Sam K., Mandell D. M., et al. (2015). Measuring cerebrovascular reactivity: The dynamic response to a step hypercapnic stimulus. J. Cereb. Blood Flow. Metab. 35 (11), 1746–1756. doi:10.1038/jcbfm.2015.114
Poublanc J., Han J. S., Mandell D. M., Conklin J., Stainsby J. A., Fisher J. A., et al. (2013). Vascular steal explains early paradoxical blood oxygen level-dependent cerebrovascular response in brain regions with delayed arterial transit times. Cerebrovasc. Dis. Extra 3 (1), 55–64. doi:10.1159/000348841
Poublanc J., Sobczyk O., Shafi R., Sayin E. S., Schulman J., Duffin J., et al. (2021). Perfusion MRI using endogenous deoxyhemoglobin as a contrast agent: Preliminary data. Magn. Reson Med. 86 (6), 3012–3021. doi:10.1002/MRM.28974
Schlaudecker J., Bernheisel C. (2009). Gadolinium-associated nephrogenic systemic fibrosis. Am. Fam. Physician 80 (7), 711–714. Available at: https://pubmed.ncbi.nlm.nih.gov/19817341/ (Accessed January 18, 2022).
Schulman J., Sayin E. S., Manalac A., Poublanc J., Sobczyk O., Duffin J., et al. (2022). Perfusion quantification in the human brain using DSC MRI – simulations and validations at 3T. bioRxiv. doi:10.1101/2022.04.27.489686
Slessarev M., Han J., Mardimae A., Prisman E., Preiss D., Volgyesi G., et al. (2007). Prospective targeting and control of end-tidal CO2 and O2 concentrations. J. Physiol. 581, 1207–1219. doi:10.1113/jphysiol.2007.129395
Spann S. M., Kazimierski K. S., Aigner C. S., Kraiger M., Bredies K., Stollberger R., et al. (2017). Spatio-temporal TGV denoising for ASL perfusion imaging. Neuroimage 157, 81–96. doi:10.1016/j.neuroimage.2017.05.054
Stewart G. N. (1893). Researches on the circulation time in organs and on the influences which affect it: Parts I.-III. J. Physiol. 15 (1-2), 1–89. doi:10.1113/jphysiol.1893.sp000462
Stokes A. M., Bergamino M., Alhilali L., Hu L. S., Karis J. P., Baxter L. C., et al. (2021). Evaluation of single bolus, dual-echo dynamic susceptibility contrast MRI protocols in brain tumor patients. J. Cereb. Blood Flow. Metab. 41 (12), 3378–3390. doi:10.1177/0271678X211039597
Strickler S. E., Clark K. R. (2021). Gadolinium deposition: A study review. Radiol. Technol. 92 (3), 249–258. Available at: http://www.ncbi.nlm.nih.gov/pubmed/33472877.
Thompson M. T. (2014). Intuitive analog circuit design. 2nd ed. Oxford: Newnes. doi:10.1016/C2012-0-03027-X
Tudorica A., Fang Li H., Hospod F., Delucia-Deranja E., Huang W., Patlak C. S., et al. (2002). Cerebral blood volume measurements by rapid contrast infusion andT2*-weighted echo planar MRI. Magn. Reson Med. 47 (6), 1145–1157. doi:10.1002/mrm.10167
Vu C., Chai Y., Coloigner J., Nederveen A. J., Borzage M., Bush A., et al. (2021). Quantitative perfusion mapping with induced transient hypoxia using BOLD MRI. Magn. Reson Med. 85 (1), 168–181. doi:10.1002/mrm.28422
Keywords: brain perfusion, respiratory challenges, cerebrovascular reactivity (CVR), carbon dioxide challenge, deoxygenation, dynamic susceptibility contrast (DSC)
Citation: Vu C, Xu B, González-Zacarías C, Shen J, Baas KPA, Choi S, Nederveen AJ and Wood JC (2023) Sinusoidal CO2 respiratory challenge for concurrent perfusion and cerebrovascular reactivity MRI. Front. Physiol. 14:1102983. doi: 10.3389/fphys.2023.1102983
Received: 21 November 2022; Accepted: 30 January 2023;
Published: 09 February 2023.
Edited by:
Alex Bhogal, Utrecht University, NetherlandsReviewed by:
Cesar Caballero-Gaudes, Basque Center on Cognition, Brain and Language, SpainDengrong Jiang, Johns Hopkins University, United States
Copyright © 2023 Vu, Xu, González-Zacarías, Shen, Baas, Choi, Nederveen and Wood. This is an open-access article distributed under the terms of the Creative Commons Attribution License (CC BY). The use, distribution or reproduction in other forums is permitted, provided the original author(s) and the copyright owner(s) are credited and that the original publication in this journal is cited, in accordance with accepted academic practice. No use, distribution or reproduction is permitted which does not comply with these terms.
*Correspondence: John C. Wood, jwood@chla.usc.edu