 Hossein Hosseiny
 Han Cao
 Virginia Smith
 Wenqing Xu1
- 1Department of Civil and Environmental Engineering, Villanova University, Villanova, PA, United States
- 2Department of Earth and Planetary Sciences, Washington University in St Luis, St Luis, MO, United States
Coastal zones receive upstream runoff and sediments, as well as the contaminants transported with sediments and flow. Constant urban growth in many coastal areas has raised an increasing concern about stream and floodplain contamination. This is a particularly challenging issue because fluvial hydraulics in the coastal zone is complex, due to the presence of backwater (BW) conditions which alter flow patterns and sediment transport regime. Polycyclic aromatic hydrocarbons (PAHs) are persistent organic pollutants that are widely distributed in urban areas and can be transported through stormwater runoff and by sediment facilitated transport. Even though this is a widespread problem in urban areas, the relationship between fluvial deposition and concentrations of PAHs is largely uninvestigated. To fill this gap, this paper investigates the correlation between PAHs concentration and sediment deposition in a backwater zone, using the lower Darby Creek, PA as a case study. A BW geomorphologic model was used to simulate the hydraulics of the flow in Darby Creek. The model identified locations of high and low shear stresses, erosion, and deposition of fluvial sediment. Twenty-eight core sediment samples, capturing a range of soil depths, were collected from the bed, the banks, and the floodplains of the creek and were analyzed for PAHs on a GC-MS. The results showed that PAHs concentrations were generally highest on depositional banks and were highly variable on the channel bed and in the floodplain. Further, PAH concentrations were more uniform across the cross section (bed, bank, and floodplain) at downstream sites compared to upstream. The results also showed that in erosional sites, unlike the depositional sites, there was little variation in PAHs concentration in the soil column. This analysis provides deeper insight into the transport and fate of PAHs in urban streams and floodplains, ultimately helping mitigate the impacts of pollutants on the environment.
Introduction
Polycyclic aromatic hydrocarbons (PAHs) are widely distributed persistent organic pollutants (Hong et al., 2020; Patel et al., 2020) that result mainly from urbanization and anthropogenic activities coupled with coal and petroleum combustion (Li et al., 2020b; Wang et al., 2020). Over the last three decades, PAHs pollutant has been extensively studied by different institutes due to its life-threatening effects (Hong et al., 2020; Li et al., 2020a). PAHs pollutants adversely affect the health of humans as well as animals (Gou et al., 2020; Patel et al., 2020) and therefore, many PAHs are subject to worldwide mandatory regulations (Sushkova et al., 2019). For this reason, there is a critical need to describe the transport and fate of PAHs pollutants in the urban landscape (Sushkova et al., 2019).
Generated PAHs in urban environments can be transmitted through the atmosphere (Li et al., 2020b) as well as the surface water (Bispo et al., 1999). In addition to the PAHs transported to the waters downstream of urban areas (lake, sea, or ocean), the PAHs pollutants in urban areas eventually deposit and accumulate in the soil (Hong et al., 2020), which is known to be the final sink for PAHs (Wang et al., 2020). Although soil is the ultimate receiver of the PAHs (Bispo et al., 1999), the method of transportation of the PAHs is quite complex. As a result, PAHs pollutants are highly dispersed spatially due to their complex methods of transportation (Chung et al., 2007; Wang et al., 2020). One of the least understood aspects of PAHs in urban environment is the transport of such pollutants through urban fluvial systems. This makes the study of the transport and accumulation of the PAHs (Sushkova et al., 2019) in urban rivers of great importance.
In cities, as surface water runoff from the urban landscape flows downstream in urban streams, it carries transported fluvial sediment. The PAHs pollutant in the water flow is received in the downstream environments. For many cities this is the coastal zone. PAHs pollutant is deposited into coastal sediment, and its concentration will vary depending on the backwater (BW) hydraulics, caused by the water level in the downstream standing water. Nevertheless, the variation in sediment distribution in complex urban environments and its influences on the transport of sediment and PAHs are not well-understood. Therefore, analyzing and understanding the transportation of PAHs pollutants by fluvial sediment is of great importance to the health of humans and ecosystems in coastal areas (Bonaglia et al., 2020). The geomorphologic model for the BW conditions, developed by Hosseiny and Smith (2019), allows for analysis of such relationships.
The mechanisms driving the transport of the PAHs pollutant through aquatic systems by sediment displacements are largely unknown, especially regarding their interaction with the sediment's deposition and re-suspension. While there are robust studies on the transport and fate of contaminants in fluvial systems (Walling and Owens, 2003; Walling et al., 2003; Du Laing et al., 2009) but there is a dearth of studies taking an interdisciplinary approach to understanding the chemistry of the pollutants and the transport mechanisms (Taylor and Owens, 2009). Most of the studies for the quantification of PAHs pollutants are solely based on the spatial analysis of sampled topsoil from urban areas (Cazals et al., 2020; Gou et al., 2020; Li et al., 2020b; Wang et al., 2020). The role of urban fluvial channels and the mechanics governing PAHs transport and deposition in rivers has never been investigated.
We hypothesize that the spatial distribution of contaminants in a fluvial system is associated with sediment deposition. In this research we tested this hypothesis by utilizing a geomorphic model, field sampling, and laboratory testing to investigate the effects of river hydraulics, sediment transport dynamics, and PAHs concentration to establish a relationship between sediment transportation and the fate of PAHs downstream of urban normal (hydraulically) and backwater environments. This is an important step in understanding the risk of PAHs pollution in coastal wetlands, as it postulates the spatial risks that contaminants pose to wetland ecosystems.
The novel pairing of a geomorphic model, that accounts for the flow hydraulics and sediment transport under BW conditions, with the field data and laboratory analysis, made it feasible to recreate a qualitative description (as opposed to quantitative) of spatial relationship between fluvial sediment transport dynamics and the distribution of PAHs contaminants in sediments. The results illuminate a connection between natural and anthropogenic factors on coastal environments downstream of urban areas, and how these factors impact ecosystem function and resilience.
Methods
Study Area
The present study examined the lower part of Darby Creek, where surface runoff from a highly urbanized watershed drains into a coastal wetland (Figure 1). Lower Darby Creek is located southwest of metropolitan Philadelphia and is an important tributary that flows into the Delaware River. Delaware River flows result in upstream changes in the water surface elevation of Darby creek, which complicate flow hydraulics and the sediment transport regime. This phenomenon is called backwater (BW) conditions. Lower Darby Creek was an ideal study area for this investigation because of its urban watershed, active morphology, and history of contamination issues.
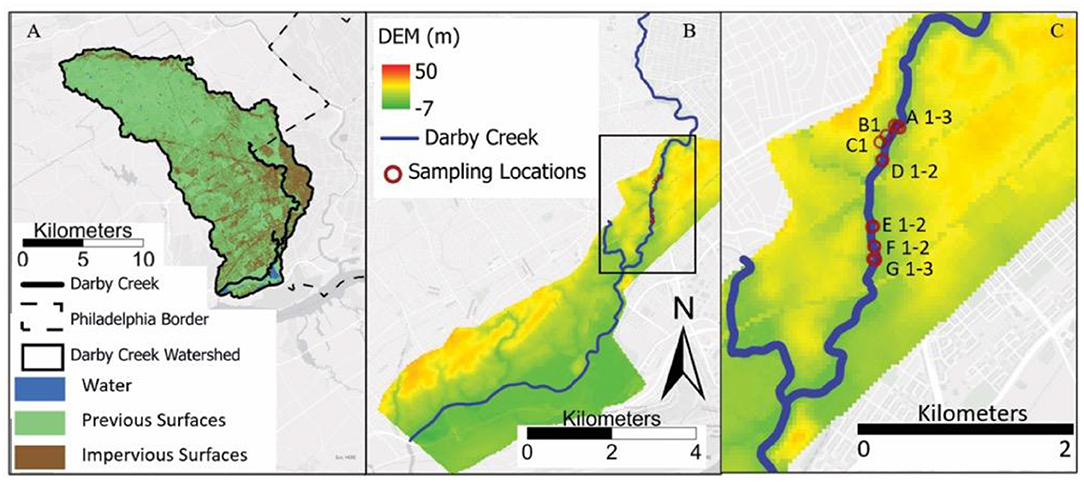
Figure 1. (A) Darby Creek watershed adjacent to the Philadelphia border. (B) Digital elevation model (DEM) of the study area. The black box shows the boundary of image (C). (C) A zoomed in image of the sampling locations.
Figures 1B,C show urbanization in the Darby Creek watershed and the topography of the creek. The creek feeds into the John Heinz Wetlands, a critical ecosystem, and then joins the Delaware River downstream (Stolz, 2012). Darby Creek has been the subject of hydrologic engineering since the late seventeenth century. The banks of the creek are frequently inundated by floodwaters, which has become increasingly common in recent years (Stolz, 2012).
In addition to the frequent flooding, the creek has a long history of contamination issues and is currently listed as a superfund site (Stolz, 2012). Extensive water quality monitoring of the Darby Creek has been carried out in the past decades. These studies suggest that stormwater runoff contributes significantly to the transport of pollutants, such as the loadings of nutrients and heavy metals (PWD, 2004), legacy organic pollutants, and PAHs, and these have had negative impacts on species native to the wetland (Pinkney et al., 2004; Bell et al., 2006; Van Meter et al., 2006). Furthermore, frequent flooding in and around superfund areas amplifies the adverse effects of the pollutions and reduces the life expectancy of the residents (Kiaghadi et al., 2021). The segment of the creek selected for this research is located in the lowest 15 river kilometers that flows within the fully urbanized area downstream (Figure 1).
Field Sampling
To analyze the spatial distribution of the PAHs along the creek, 28 core sediment samples were collected from the bed, banks, and floodplains at 14 sites along Darby Creek. The sample locations are shown in Figure 2, with the associated modeled water depth for a 5-year flood. The sample locations span the hydraulic transition from normal flow to backwater flow.
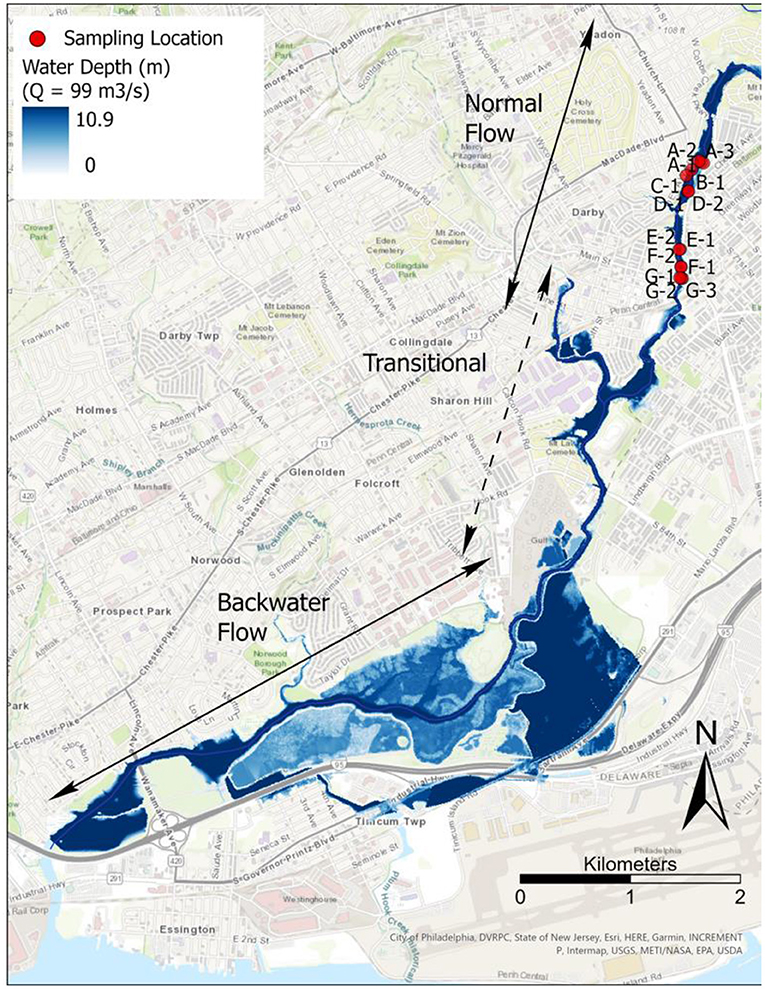
Figure 2. Twenty-eight soil samples were collected in Darby Creek from 14 sites.
Figure 3 illustrates the sampling locations, which were individually assessed and defined as erosional or depositional points, based on the observations in the field. For instance, banks with vertical walls with fresh signs of erosion were classified as erosional. The locations on the floodplains or behind the dam were classified as depositional. Samples were taken from the bed, banks, and floodplains at various depths.
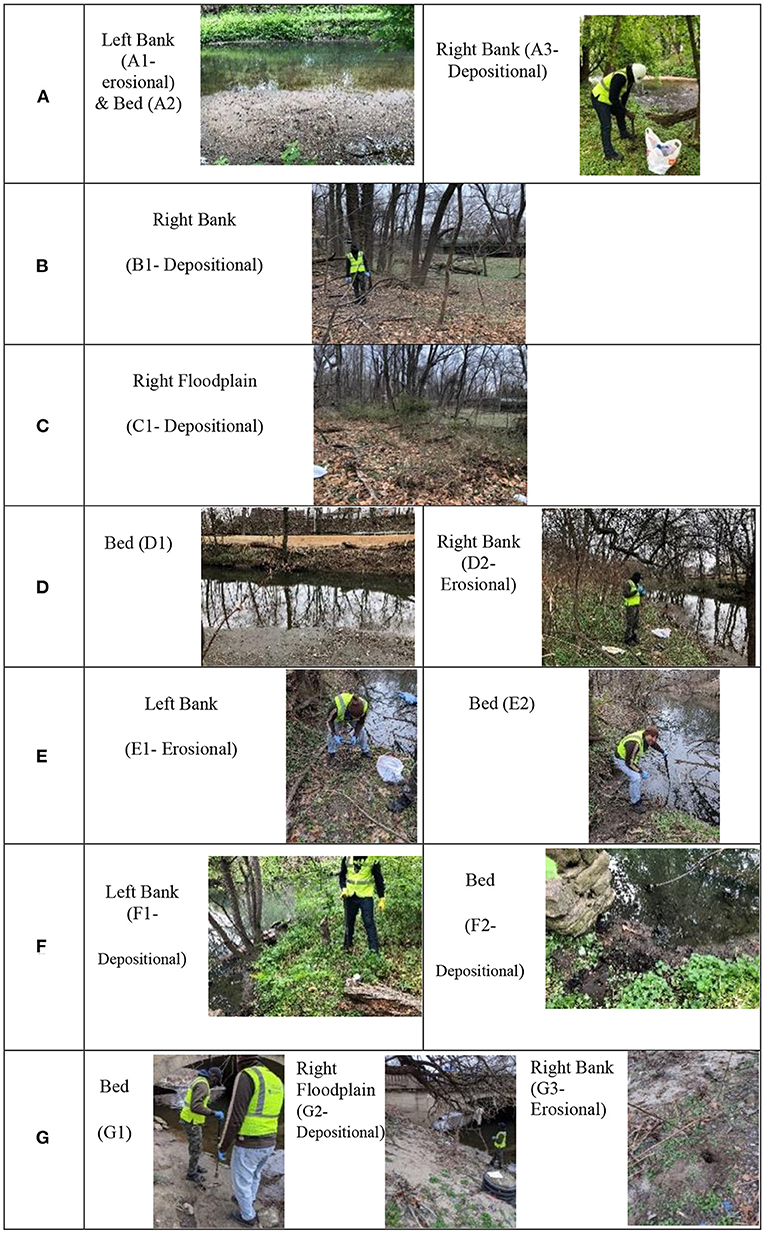
Figure 3. (A–G) Samples were collected from different sites along the creek and erosional or depositional sites were identified.
The core sediment sampling was executed by an AMS auger (Figure 4) with a core sampler, which had dimensions of 15.2 cm (height) by 5 cm (diameter) (AMS, 2021). The samples were collected from depths of 0–15, 15–30, and 30–45 cm for each location. Due to the presence of hard rock, sampling in some areas was limited to lesser depths.
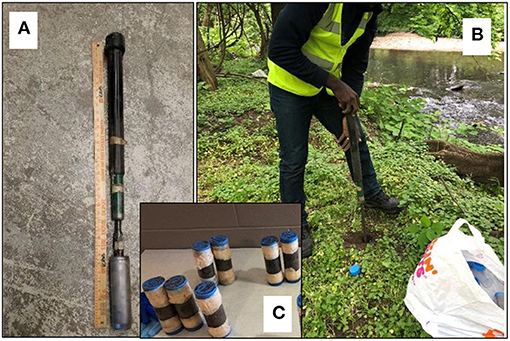
Figure 4. (A) Auger used for sampling sediment in the bed and the banks. (B) Sampling up to 38 cm with the auger. (C) Samples were collected in tubes with dimensions of 15.2 cm (height) by 5 cm (diameter).
The collected samples were sealed and labeled (Figure 4C) immediately after sampling and were transferred to the lab for PAHs concentrations analysis.
PAHs Measurements
This section describes the methods used to measure and determine the PAHs concentrations in the collected samples.
Chemicals
Standard mixture of 13 PAHs (500 μg/mL in acetone) including acenaphthylene (ACY), fluorene (FLO), phenanthrene (PHE), anthracene (ANT), pyrene (PYR), benz(a)anthracene (BaA), chrysene (CHR), benzo(b)fluoranthene (BbF), benzo(k)fluoranthene (BkF), benzo(a)pyrene (BaP), indeno(1,2,3-cd)pyrene (IcdP), benzo(g,h,i)perylene (BghiP), and dibenz(a,h)anthracene (DahA); PAHs internal standard solution (500 μg/mL in acetone) including acenaphthene-d10, chrysene-d12, perylene-d12, and phenanthrene-d10; surrogate standard solution (98 atom % D, p-terphenyl-d14), silica gel (Grade 923, 100–200 mesh), sodium sulfate (ACS grade, ≥ 99%), hexane (HPLC grade, ≥ 95%), acetone (HPLC grade, ≥ 99%), dichloromethane (DCM, HPLC grade, ≥ 99%), and fiber glass wool (pore size 8 μm) were obtained from Sigma-Aldrich (Milwaukee, MI). Ten mL disposable pipette was purchased from VWR (Radnor, PA). Deionized (DI) water was obtained from milli-Q-plus water system (≥18.2 MΩ cm at 25°C; MilliporeSigma, St. Louis, MO, USA). All reagents were used without additional purification.
Sample Extraction
Soil sample was homogenized before conducting the extraction process. The extraction method was adopted from a previous study (Guerin, 1999), which was slightly modified. Briefly, 3 g of soil was placed into a clean amber vial. Then, 1 mL surrogate solution (1 mg/L in acetone) was subsequently spiked into the soil, after which 6 g of anhydrous sodium sulfate was added. The sample was then extracted using 10 mL of a hexane-acetone (1:1, v/v) mixture, shaken by hand for 2 min, and lastly sonicated for 10 min (Branson 1800, Branson Ultrasonics, CT, USA). The mixture was then centrifuged at 4,000 rpm for 5 min. The organic layer was then collected, and the sediment was re-extracted using the same procedure. Finally, all extracts were pooled together.
Sample Cleanup
All samples underwent solvent exchange to hexane prior to cleanup process. Soil sample cleanup followed the EPA method 3630c (EPA, 1996) with minor modifications. Silica gel was activated at 130°C for at least 16 h prior to use. Briefly, the silica gel was firstly dispersed in dichloromethane (DCM) and was then slowly added to a single use column, which was composed of a disposable pipette with packed fiber glass wool. Sodium sulfate was then added to the column, following by pre-elution using 10 mL of hexane, which was discarded. The sample was then transferred into the column, after which 10 mL hexane/DCM (1:1, v/v) was added. The eluent was collected for sample concentration analysis using Reacti-Therm Heating/Stirring modules (Pierce, Rockford, IL). The final volume of the sample was 1 mL, and 10 μL of internal standard (10 mg/L in acetone) was spiked before PAHs analysis.
Sample Analysis
PAHs analysis in this study followed the EPA method 8270D (EPA, 2007) with a minor modification. Briefly, gas chromatography (GC: Agilent 6890N, MS: Agilent 5973 MS, Santa Clara, CA) coupled with a capillary column (Rxi-5ms, 0.25 mm i.d. × 30 m, 0.25 mm film thickness, Restek, USA) was used for analysis. The injection volume of sample was 1 μL using splitless mode. GC-MS oven temperature program is shown in Supplementary Figure 1. Mass spectrometry was acquired with selective ion monitoring (SIM) mode, and the ion of quantification for individual PAHs is listed in Supplementary Table 1. The abundance of each PAHs compound was quantified using the response factor of each standard PAHs relative to the respective internal standard. The recovery efficiency of the PAHs was based on recovery rate of the surrogate compound. Soil sample at each height was duplicated, and the PAHs concentration was reported as a sum on dry-weight basis.
Sediment Transport Model
The geomorphologic model described in Hosseiny and Smith (2019) was used to simulate the flow hydraulics and sediment transport across the study area, accounting for the change in hydraulics due to the influence of the BW zone. The model solves the one-dimensional water surface profile along the creek in the BW and transitional zones from downstream (known boundary conditions at Delaware River downstream) toward upstream. Assuming that the lateral variations in the water surface elevation in the BW and transitional zones are negligible, the 2D water depth along the thalweg of the creek can be obtained. Once the flood depth is obtained, the model solves, the Meyer-Peter and Müller (MPM) equation (Meyer-Peter and Müller, 1948) in the direction of the flow to estimate sediment transport from upstream toward downstream. To solve such an equation, the model assumes that the lateral sediment transport in each cross section is negligible. Finally, the model uses the 2D Exner Equation to characterize the bed elevation changes (erosion or deposition) along the creek. The model was based on the 1 m resolution topographic data. However, the mesh grids within the model were set to 5 m. This size of the mesh was computationally efficient and helped the stability of the model (Zarzar et al., 2018). More information about the geomorphologic model development, numerical scheme, boundary conditions, calibration, and model verifications can be found in Hosseiny and Smith (2019) and Zarzar et al. (2018). The model can identify the extent of the BW conditions along the creek and can simulate the average velocity, shear stress, and sediment flux in the normal and backwater zones, as well as the transitional zone between these two regions.
Estimation of the sediment discharge will depend on subjective choices among different sediment transport equations. Therefore, in this paper, the shear stress was used as a proxy for the sediment transport model. The geomorphologic model was run for a high discharge of 99 cubic meters per second (m3/s), which historically has been a measurement achieved for 5 years return period flood event, and the shear stress domain was obtained. The 5-year return period flood was selected for the analysis because the results from the geomorphologic model (Hosseiny and Smith, 2019) indicated that for discharges lower than this discharge resulted in insignificant geomorphologic activities, specifically in the BW and transitional zones. Because the 5-year return period discharge was the minimum but most frequent discharge that causes significant morphological alterations across the study area it was selected as an example discharge. The outputs of the model at this discharge have been verified using satellite imagery (Hosseiny and Smith, 2019). The shear stress results obtained from the model for a 1-year flood (39 m3/s) and a 7.5-year flood (164 m3/s) were also obtained for comparison. The higher shear stress associated with high discharges, in general, indicated the higher probability of erosion and sediment transport in the creek, but showed the same general pattern of erosion and deposition in the channel. As such, since this trend was constant for these discharges, the 5-year flood (99 m3/s) was selected as a representative discharge for this analysis.
Results
This section presents the results obtained from the geomorphologic model described above along with measured PAHs concentrations. Figure 5 shows the shear stress distribution in the study area for a flood discharge of 99 m3/s. The shear stress can be used as a proxy for the pattern of erosion and deposition of sediment in a way that high shear stress areas are more prone to erosion while low shear stress areas are likely to experience deposition of sediment. Figure 5 shows that relative shear stress magnitude is low on the banks, and high in site G due to a contraction in the creek width.
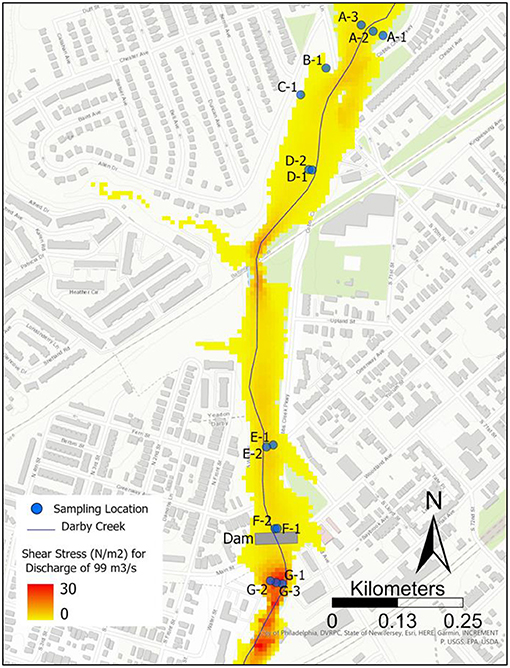
Figure 5. Simulated shear stress distribution obtained from the geomorphologic model for the sampling locations.
To illustrate the spatial variations in the measured PAHs concentrations, the cross sections of the sampling sites were extracted from the Digital Elevation Model (DEM) of the study area1. Figure 6 shows the PAHs concentrations variation within the cross sections and along the creek in different depths of soil.
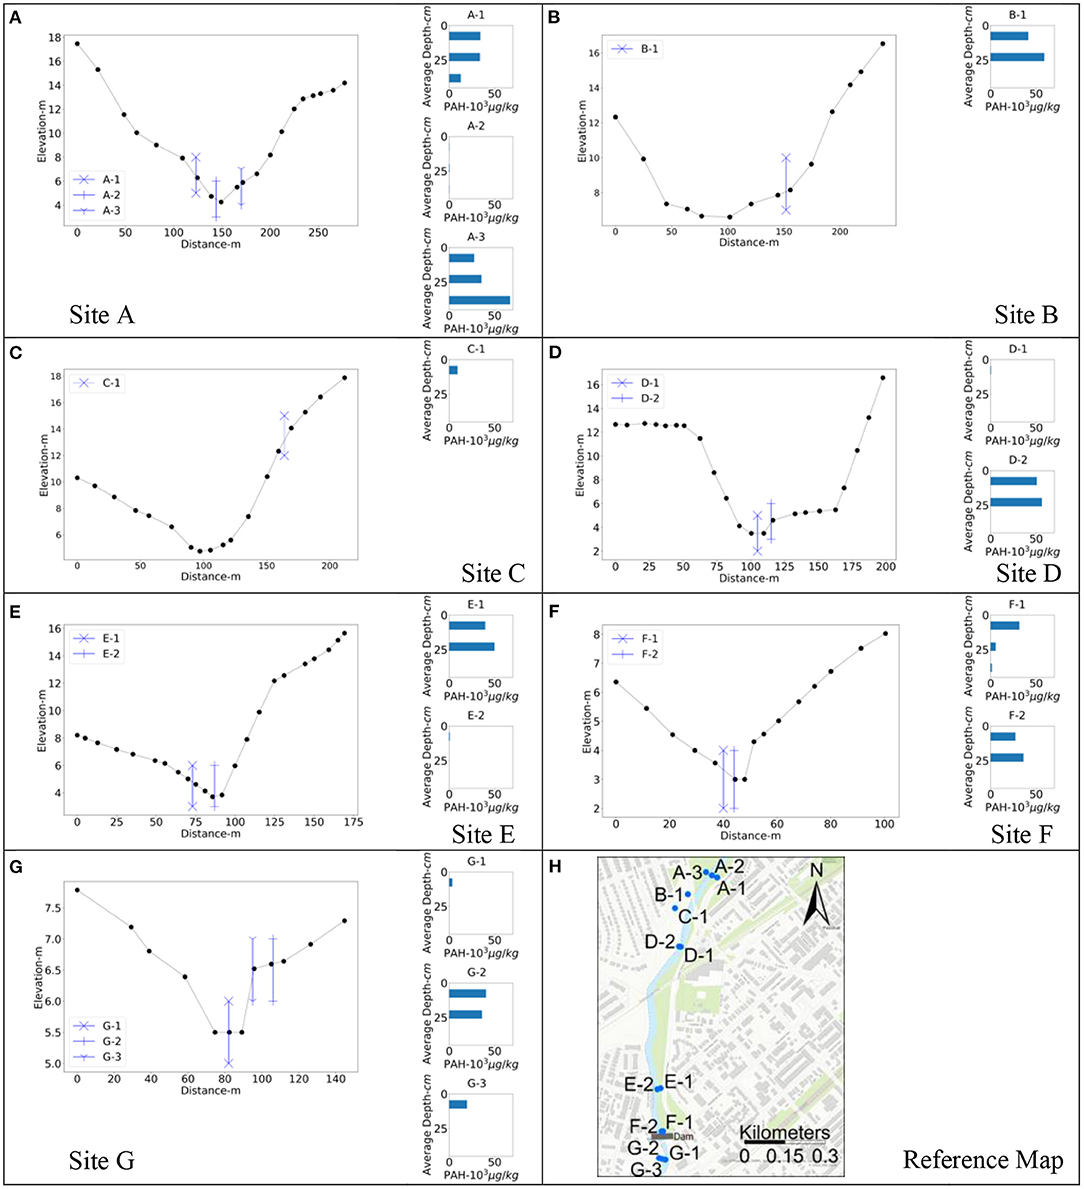
Figure 6. Cross sections of the sampling locations along with measured PAH concentrations at each of the sampling locations (A–G), aligning with the sites shown in (H).
Figure 6 shows that in general, the PAHs concentration in the creek bed is low relative to the banks. It also shows that in general, high PAHs concentrations are more likely to take place upstream.
PAHs Spatial Analysis
The study area for this research is composed of the segments of the creek with normal flow, gradually varied flow (BW conditions), and the transitional zone from the normal to the BW conditions. As a result, the hydraulics of the flow varies spatially along the creek. Variations in the type of the flow are expected to change the sediment transport regime and consequently cause variations in the spatial distribution of the PAHs concentrations. Figure 7 shows how measured PAHs concentrations in the bed, the bank, and the floodplain vary with the soil depth across the study area.
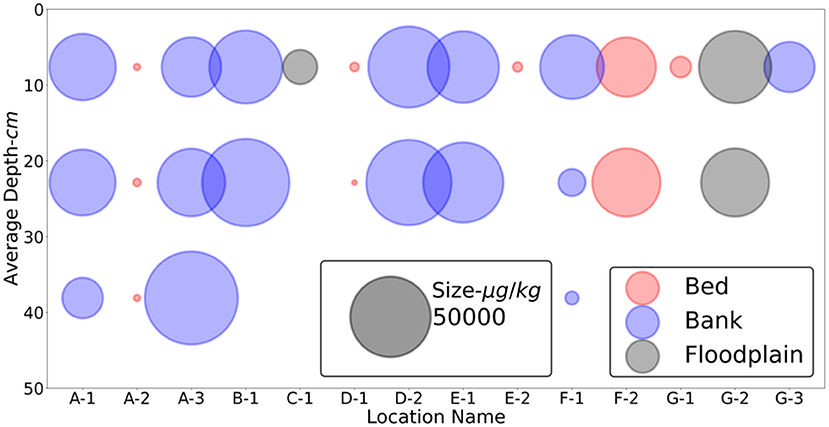
Figure 7. PAHs concentration distribution in the creek (going from upstream—A to downstream—G). Erosional sites included A1, D2, E1, and G3. Depositional sites included A3, B1, C1, F1, F2, and G2. Missing circles indicate the lack of measured data. The bubble size demonstrates the scale of PAHs concentration.
Further, the transport of sediment in a river system depends on the applied shear stress, which results from the flow velocity applied to sediment grains. The results in Figure 7 shows that in general, the PAHs concentrations in the banks are relatively high, with a less variation in the magnitude, compared to the ones from the bed and the floodplains. However, the number of samples from the floodplains are limited. While there are some fluctuations in PAHs concentration with depth, there is no discernible trend between sites. Given the limited number of samples, additional data may provide more insight into PAH variation with depth.
Figure 8 shows how measured PAHs concentrations vary with modeled shear stress (for a discharge of Q = 99 m3/s) in the bed, the banks, and the floodplains in the creek. Figure 8 also shows that site G, located downstream of a low head dam (Figure 5), has the highest shear stress in the segment of the creek selected for this study.
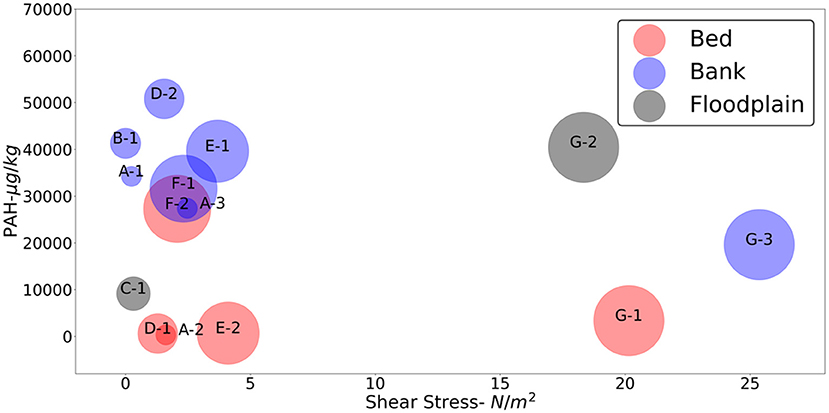
Figure 8. Variations in PAHs concentration and shear stress in topsoil (average depth of 7.6 cm) at the bed, the banks, and the floodplains. The bubble sizes show the distance from upstream (smallest diameter) to downstream (largest diameter). Red, blue, and gray colors are designated for the bed, the bank, and the floodplain, respectively. The names of the sampling locations are shown within or next to the bubbles.
The measured PAHs concentrations in our study are comparable with those reported in the literature, with lower values similar to those of rural and urban sites (Agarwal, 2009; Liu et al., 2019), and higher ones comparable to those of industrial sites (Fismes et al., 2002; Joner and Leyval, 2003). There has been limited information regarding the regulatory standard for PAHs in soil matrices. However, PAHs are listed as some of the most hazardous substances on the Agency for Toxic Substances and Disease Registry (ATSDR) priority list of hazardous substances (Gehle, 2009).
Discussion
The study area for this research is highly complex. It drains a watershed that is highly developed, its hydraulics transitions from normal to backwater (BW) flow, and it covers a critical coastal environment that supports large human populations as well as varied critical ecosystems. Due to the urban location of this site, many people live within the floodplain of the creek.
To understand how PAHs move through the system, soil samples for the PAHs measurements were collected from the bed, the banks, and the floodplains in the normal and transitional zone to the backwater conditions. The samples were analyzed in the streamwise and cross sectional direction. The shear stress associated with 1-, 5-, and 7.5 years were obtained and compared. Because the 5-year flood was the minimum but most frequent discharge that caused significant morphological alterations, it was selected as a representative discharge for this analysis.
Cross Sectional Correlation
The shape of a cross section in a segment of a river may show the patterns of local erosion or deposition of the sediment in the river (Figure 6). Figures 7, 8 show a trend that PAHs concentrations in the banks are in general higher than those in the bed, which can be a result from frequent bank inundation with deposition of polluted sediment. The urbanization of the watershed can result in steeper hydrographs and possibly more frequent bank inundation. The bed is not as depositional, but experiences constant flow and more erosion. As such, the PAHs concentrations in the bed are generally less than the ones in the banks (Figure 8). An exception for this is the high concentration of the PAHs in the bed at site F due to the presence of a dam downstream (Figure 9). The dam creates a local deceleration in the flow and causes a local backwater condition. As a result, there is a high rate of sediment deposition behind the dam in the channel, at site F. This consequently leads to high deposition and accumulation of PAHs pollution behind the dam. The effects of the dam on the hydraulics of the flow were embedded in the changes in topographic data (changes in the bed elevation and river width) and therefore were indirectly included in the calculations of the modeled shear stress.
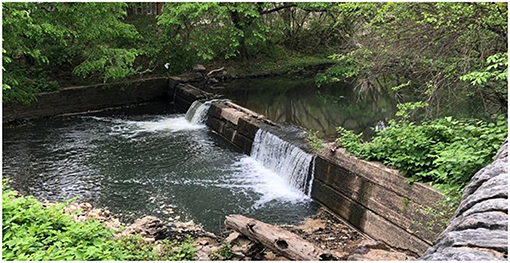
Figure 9. Small dam located just downstream site F and upstream of site G.
The shear stress in site G, located after the dam reaches to its maximum due to a contraction in the cross section (Figure 6). On the other hand, the PAHs concentration on the bed at this site is relatively low but high in the banks and floodplain. As a result, it can be postulated that high shear stress magnitudes resulted from high discharges in this segment of the creek, causes significant sediment displacement in the bed, and deposition of the polluted sediment on the banks and floodplain.
Floodplain PAHs concentrations varied compared to the bank samples taken. In the upstream, where the normal flow is dominant, the floodplain PAHs concentrations were much lower. There are two possible reasons for this occurrence. The bank concentrations may be higher due to more frequent inundation. Alternatively, PAHs may not be reaching the floodplain because the shear stress isn't able to carry the polluted sediment with PAHs pollution to the floodplain. Often, in the cross section of a channel, the coarsest material is deposited on the banks, while finer material is on the floodplain, as shown in Figure 10 (Brierley et al., 1997). The PAHs material may be “stuck” in the banks with the coarser sediments or with the vegetations.
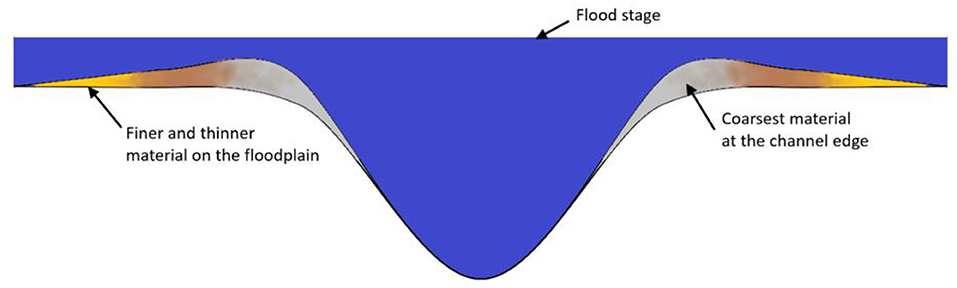
Figure 10. Cross sectional sediment deposition (created from information in Brierley et al., 1997).
An exception to this is at site G, downstream of the dam. As can be seen in Figures 5, 8, the shear stress is higher downstream of the dam. PAHs concentrations in the bed and banks are slightly lower at this site. The PAHs values in the floodplain are higher than in upstream floodplains. Inundation of this area occurs only during high flow events. We hypothesize that the higher concentrations in this area reflect PAHs transported during a flood and deposited during the falling limb of the hydrograph. However, more sediment samples from the floodplains are required to make further conclusions.
Streamwise Correlation
The results presented in Figures 6–8 show an analysis of the PAHs concentrations in the streamwise direction. When considering all the data, there isn't a clear trend in PAHs concentration and downstream distance. Isolating the most recent bank deposits at 7.6 cm (the average depth of the shallowest soil sample (0–15.2 cm), the data shows a trend in PAHs concentration decreasing from upstream to downstream, toward the BW zone. The samples taken from the bed and floodplain show an inverse trend. The PAHs concentrations in the bed and floodplain near the surface increase as the creek is increasingly influenced by BW hydraulics.
Generally, the difference between PAHs concentration of the sample types (bed, bank, or floodplain) decreases in the downstream direction, suggesting that PAHs pollutants are being deposited downstream in a more uniform manner. Figure 5 shows the variation in shear stress across the study area. There is generally a notable variation in cross sectional shear stress in the study area (sites B, C, and E). Most of the downstream cross sections near the small dam (Figure 5, sites F and G) show less variation in cross sectional shear stress. Upstream of the dam (site F) PAHs concentrations were higher at the bed, while downstream (site G) of the dam PAHs concentrations were slightly higher in the floodplain. This indicates that the presence of the dam has caused longitudinal variations in the PAHs concentrations upstream and downstream of the dam.
Correlation With Soil Depth
Figure 7 shows PAHs concentrations correlated with soil depth. This graph represents analysis from two perspectives: (1) PAHs variation with sample type and (2) the erosional or depositional nature of the site. The findings suggest that the sample type (bed, bank, or floodplain) tends to control how much change in PAHs concentration there is in the soil column. Samples taken from the banks exhibited far more variation in PAHs concentration than those taken from the bed or floodplain. In this urban stream the banks are frequently inundated, but unlike the stream bed do not experience constant flow. In erosional sites, such as A-1, D-2, or E-1, there is little variation in PAHs concentration in the soil column. At the depositional site of A-3, the PAHs concentration increases with an increase in the soil depth which supports the hypothesis defined in this research. B-1 also shows a weakly positive correlation between PAHs concentration and soil depth. This suggests either a change in the depositional environment through time or PAHs migration vertically in the soil column. Inversely, the depositional bank at site F-1 shows a negative correlation between PAHs concentration and soil depth. The sediment transport dynamics at site F are unlike the other locations, due to the influence of the dam immediately downstream of the site. More measured data is required for making significant conclusions for consistent trends between sites.
Correlation With Modeled Shear Stress
Figure 8 shows the variations of PAHs concentrations at the surface compared to modeled shear stress. There is no strong correlation between PAHs concentrations and modeled shear stress in the bed and the banks. This is likely driven by the resolution of the raster used for the modeling the shear stress. The banks generally have higher PAHs concentrations than the bed, but the shear stress values between the bed and banks are relatively similar. That is likely because of the resolution of the raster file (8 × 8 m) for the modeled shear stress used in the analysis. The fact that bank PAHs concentrations are higher than bed concentrations also supports the hypothesis defined in this research.
The floodplain at site C, C-1, has a much lower shear stress value than the one in site G, G-2. PAHs concentrations at C-1 are much lower than the ones in G-2. The reason for that is possibly related to the mechanism of sediment transport from within the channel to floodplains during the high flows. As such, low shear stress magnitude may indicate that polluted sediment cannot reach the floodplain at site C (Figure 10). In site G however, the high magnitude of the shear stress below the dam increases the rate of sediment transport and consequently increases the accumulation of pollutions in the bank. Nevertheless, more measured data in the floodplains are required for definitive conclusions.
Limitations and Future Work
The main limitations of this study included obtaining field sediment samples and measurements of sediment flux. The creek in the study area has limited locations accessible, restricting the spatial distribution of soil samples. In addition, sampling from the bed of the creek was limited to the surface of the creek for most of the sampling locations, due to instability of the bed soil. The sediment supply in this study and in the geomorphologic model was assumed to be unlimited through the study area. This indicates that the erosion or deposition of the sediment were not affected by the availability of the sediment sources. For the future work, coupling more measured sediment data with more variations in simulated flooding discharges can enhance the findings of this study. Additionally, an analysis of grain size through the bed, banks, and floodplain of the study area will provide greater insight into the style of PAHs transport.
Conclusions
This paper presented an analysis of which pairs a geomorphologic model for normal and backwater (BW) conditions with the spatial variations of the PAHs concentrations in the bed, the banks, and the floodplains. We hypothesized that the spatial distribution of the PAHs in a fluvial system is associated with sediment deposition. The research utilized Darby Creek, an urban coastal stream subject to frequent flooding as a study area. The geomorphologic model was used to quantify the distribution of shear stress for the 5-year return flood event (99 m3/s) along the creek study area as it transitions from normal to BW flow. The 5-year return period discharge was selected for this analysis because it was the minimum but most frequent discharge that caused significant morphological alterations. Twenty-eight soil samples from the bed, the banks, and the floodplains were collected at a range of depths (7.6, 22.9, and 38.1 cm). The PAHs concentrations were then measured in the lab and presented as the sum of 13 individual PAHs (Supplementary Table 1).
The results showed that the PAHs concentration is highly variable along and across the creek, but when analyzed in respect to different variables trends begin to appear. The findings show that in general, the PAHs concentration was higher in upstream close to the normal flow zones, but are highly influenced by instream infrastructure (i.e., the low head dam between sites F and G). The PAHs concentrations were relatively low in the bed and were generally higher in the banks. PAHs concentrations in the floodplain appear to be tied to local hydraulics. It was postulated that floods were likely responsible for the transport of the PAHs along the creek. The results showed that the areas in the banks with high shear stress, low PAHs concentrations could be expected. This is true at site G, downstream of the dam, both in the channel and floodplain. The other sites show a relatively low cross-sectional variation in shear stress, making it difficult to identify a relationship between shear stress and PAHs concentration. However, the floodplain site at C, C-1, has a much lower shear stress value than the other floodplain site at G, G-2, and the PAHs concentration at C-1 are much lower than those of G-2. The highest PAHs concentration took place at the maximum depth of the soil (38 cm) in a depositional bank (A-3). The results also indicated that at erosional sites there was little variation in PAHs concentration in the soil column. In the depositional site, however, the PAHs concentration increases with an increase in the soil depth, which supports the hypothesis defined in this research.
This research demonstrated a method for quantifying the transportation of PAHs in fluvial sediment in urban streams and relationships between PAHs concentration, hydraulic regime, channel geometry, modeled shear stress, and soil depth. This analysis provides deeper insight into the transport and fate of PAHs in urban streams and floodplains. The analysis presented here is a base for understanding the transport and accumulation of the PAHs pollutants in urban rivers, ultimately helping mitigate the impacts of pollutants on the environment and human health.
Data Availability Statement
The original contributions presented in the study are included in the article/Supplementary Material, further inquiries can be directed to the corresponding author/s.
Ethics Statement
Written informed consent was obtained from the individual(s) for the publication of any potentially identifiable images or data included in this article.
Author Contributions
HH: conceptualization, methodology, hydraulic modeling, field sampling, writing, original draft preparation, review, edit, data analysis, visualization, and generating figures. HC: methodology, lab analysis, and writing. VS and WX: conceptualization, methodology, writing, supervision, fund acquisition, and project administration. All authors contributed to the article and approved the submitted version.
Funding
Funding for this project was provided by the Villanova Center for Sustainable Engineering and Villanova University's Department of Civil and Environmental Engineering.
Conflict of Interest
The authors declare that the research was conducted in the absence of any commercial or financial relationships that could be construed as a potential conflict of interest.
Publisher's Note
All claims expressed in this article are solely those of the authors and do not necessarily represent those of their affiliated organizations, or those of the publisher, the editors and the reviewers. Any product that may be evaluated in this article, or claim that may be made by its manufacturer, is not guaranteed or endorsed by the publisher.
Acknowledgments
The authors would like to thank the Villanova Center for Resilient Water Systems (VCRWS) for supporting this project. The authors would like to thank Dr. Ampomah for helping with collecting sediment samples. Finally, the authors would like to thank Pamela Samonte for the experimental and editorial assistance, and Mr. Ward Barnes for the editorial assistance.
Supplementary Material
The Supplementary Material for this article can be found online at: https://www.frontiersin.org/articles/10.3389/frwa.2021.705694/full#supplementary-material
Footnotes
1. ^Pennsylvania Spatial Data Access | Data Summary (2015). Available online at: http://www.pasda.psu.edu/uci/DataSummary.aspx?dataset=1048 (accessed October 12, 2018).
References
Agarwal, T. (2009). Concentration level, pattern and toxic potential of PAHs in traffic soil of Delhi, India. J. Hazard. Mater. 171, 894–900. doi: 10.1016/j.jhazmat.2009.06.081
AMS (2021). Soil Sampler. Available online at: https://www.ams-samplers.com/hand-tooling/soil-samplers/soil-core-samplers/soil-core-samplers.html (accessed March 24, 2021).
Bell, B., Spotila, J. R., and Congdon, J. (2006). High incidence of deformity in aquatic turtles in the John Heinz National Wildlife Refuge. Environ. Pollut. 142, 457–465. doi: 10.1016/j.envpol.2005.10.020
Bispo, A., Jourdain, M. J., and Jauzein, M. (1999). Toxicity and genotoxicity of industrial soils polluted by polycyclic aromatic hydrocarbons (PAHs). Organ. Geochem. 30, 947–952. doi: 10.1016/S0146-6380(99)00078-9
Bonaglia, S., Broman, E., Brindefalk, B., Hedlund, E., Hjorth, T., Rolff, C., et al. (2020). Activated carbon stimulates microbial diversity and PAH biodegradation under anaerobic conditions in oil-polluted sediments. Chemosphere 248:126023. doi: 10.1016/j.chemosphere.2020.126023
Brierley, G. J., Ferguson, R. J., and Woolfe, K. J. (1997). What is a fluvial levee? Sediment. Geol. 114, 1–9. doi: 10.1016/S0037-0738(97)00114-0
Cazals, F., Huguenot, D., Crampon, M., Colombano, S., Betelu, S., Galopin, N., et al. (2020). Production of biosurfactant using the endemic bacterial community of a PAHs contaminated soil, and its potential use for PAHs remobilization. Sci. Tot. Environ. 709:136143. doi: 10.1016/j.scitotenv.2019.136143
Chung, M. K., Hu, R., Cheung, K. C., and Wong, M. H. (2007). Pollutants in Hong Kong soils: polycyclic aromatic hydrocarbons. Chemosphere 67, 464–473. doi: 10.1016/j.chemosphere.2006.09.062
Du Laing, G., Rinklebe, J., Vandecasteele, B., Meers, E., and Tack, F. M. G. (2009). Trace metal behaviour in estuarine and riverine floodplain soils and sediments: a review. Sci. Tot. Environ. 407, 3972–3985. doi: 10.1016/j.scitotenv.2008.07.025
EPA (2007). Method 8270D—Semi-Volatile Organic Compounds by Gas Chromatography/Mass Spectrometry (GC/MS).
Fismes, J., Perrin-Ganier, C., Empereur-Bissonnet, P., and Morel, J. L. (2002). Soil-to-root transfer and translocation of polycyclic aromatic hydrocarbons by vegetables grown on industrial contaminated soils. J. Environ. Qual. 31, 1649–1656. doi: 10.2134/jeq2002.1649
Gehle, K. (2009). Case Studies in Environmental Medicine, Toxicity of Polycyclic Aromatic Hydrocarbons (PAHs). ATSDR
Gou, Y., Zhao, Q., Yang, S., Wang, H., Qiao, P., Song, Y., et al. (2020). Removal of polycyclic aromatic hydrocarbons (PAHs) and the response of indigenous bacteria in highly contaminated aged soil after persulfate oxidation. Ecotoxicol. Environ. Saf. 190:110092. doi: 10.1016/j.ecoenv.2019.110092
Guerin, T. (1999). The extraction of aged polycyclic aromatic hydrocarbon (PAH) residues from a clay soil using sonication and a Soxhlet procedure: a comparative study. J. Environ. Monit. 1, 63–67. doi: 10.1039/A807307D
Hong, W. J., Li, Y. F., Li, W. L., Jia, H., Minh, N. H., Sinha, R. K., et al. (2020). Soil concentrations and soil-air exchange of polycyclic aromatic hydrocarbons in five Asian countries. Sci. Tot. Environ. 711:135223. doi: 10.1016/j.scitotenv.2019.135223
Hosseiny, H., and Smith, V. (2019). Two dimensional model for backwater geomorphology: Darby Creek, PA. Water 11:2204. doi: 10.3390/w11112204
Joner, E. J., and Leyval, C. (2003). Rhizosphere gradients of polycyclic aromatic hydrocarbon (PAH) dissipation in two industrial soils and the impact of arbuscular mycorrhiza. Environ. Sci. Technol. 37, 2371–2375. doi: 10.1021/es020196y
Kiaghadi, A., Rifai, H. S., and Dawson, C. N. (2021). The presence of Superfund sites as a determinant of life expectancy in the United States. Nat. Commun. 12, 1–12. doi: 10.1038/s41467-021-22249-2
Li, F., Wu, S., Wang, Y., Yan, D., Qiu, L., and Xu, Z. (2020a). A new spatially explicit model of population risk level grid identification for children and adults to urban soil PAHs. Environ. Pollut. 263:114547. doi: 10.1016/j.envpol.2020.114547
Li, Q., Wu, J., Zhou, J., Sakiev, K., and Hofmann, D. (2020b). Occurrence of polycyclic aromatic hydrocarbon (PAH) in soils around two typical lakes in the western Tian Shan Mountains (Kyrgyzstan, Central Asia): local burden or global distillation? Ecol. Indicat. 108:105749. doi: 10.1016/j.ecolind.2019.105749
Liu, Y., Gao, P., Su, J., da Silva, E. B., de Oliveira, L. M., Townsend, T., et al. (2019). PAHs in urban soils of two Florida cities: background concentrations, distribution, and sources. Chemosphere 214, 220–227. doi: 10.1016/j.chemosphere.2018.09.119
Meyer-Peter, E., and Müller, R. (1948). “Formulas for bed load transport,” in 2nd Meeting, Int. Assoc. for Hydroaul. Environ. Eng. and Res. (Madrid),39–64.
Patel, A. B., Shaikh, S., Jain, K. R., Desai, C., and Madamwar, D. (2020). Polycyclic aromatic hydrocarbons: sources, toxicity, and remediation approaches. Front. Microbiol. 11:562813. doi: 10.3389/fmicb.2020.562813
Pinkney, A., Harshbarger, J., and Roberts, M. (2004). Tumor Prevalence in Brown Bullheads (Ameiurus nebulosus) from Darby Creek, John Heinz National Wildlife Refuge at Tinicum, Philadelphia, PA. Philadelphia, PA. Available online at: http://www.fws.gov/chesapeakebay/pdf/CBFO-CO403.pdf
Stolz, G. (2012). John Heinz National Wildlife Refuge at Tinicum, Comprehensive Conservation Plan. Philadelphia, PA: U.S. Fish & Wildlife Service.
Sushkova, S., Minkina, T., Deryabkina, I., Rajput, V., Antonenko, E., Nazarenko, O., et al. (2019). Environmental pollution of soil with PAHs in energy producing plants zone. Sci. Tot. Environ. 655, 232–241. doi: 10.1016/j.scitotenv.2018.11.080
Taylor, K. G., and Owens, P. N. (2009). Sediments in urban river basins: a review of sediment-contaminant dynamics in an environmental system conditioned by human activities. J. Soils Sediments 9, 281–303. doi: 10.1007/s11368-009-0103-z
Van Meter, R. J., Spotila, J. R., and Avery, H. W. (2006). Polycyclic aromatic hydrocarbons affect survival and development of common snapping turtle (Chelydra serpentina) embryos and hatchlings. Environ. Pollut. 142, 466–475. doi: 10.1016/j.envpol.2005.10.018
Walling, D. E., and Owens, P. N. (2003). The role of overbank floodplain sedimentation in catchment contaminant budgets. Hydrobiologia 494, 83–91. doi: 10.1023/A:1025489526364
Walling, D. E., Owens, P. N., Carter, J., Leeks, G. J. L., Lewis, S., Meharg, A. A., et al. (2003). Storage of sediment-associated nutrients and contaminants in river channel and floodplain systems. Appl. Geochem. 18, 195–220. doi: 10.1016/S0883-2927(02)00121-X
Wang, C., Zhou, S., Song, J., Tang, J., and Wu, S. (2020). Formation mechanism of soil PAH distribution: high and low urbanization. Geoderma 367:114271. doi: 10.1016/j.geoderma.2020.114271
Keywords: floodplains, polycyclic aromatic hydrocarbons, backwater, urban hydrology, geomorphology
Citation: Hosseiny H, Cao H, Smith V and Xu W (2021) Unraveling the Transport and Fate of Polycyclic Aromatic Hydrocarbons Through Coupling Fluvial Geomorphic Modeling and Measured Data. Front. Water 3:705694. doi: 10.3389/frwa.2021.705694
Received: 06 May 2021; Accepted: 12 July 2021;
Published: 09 August 2021.
Edited by:
Ryan Morrison, Colorado State University, United StatesReviewed by:
Roderick Lammers, University of Georgia, United StatesYan Liu, University of Freiburg, Germany
Copyright © 2021 Hosseiny, Cao, Smith and Xu. This is an open-access article distributed under the terms of the Creative Commons Attribution License (CC BY). The use, distribution or reproduction in other forums is permitted, provided the original author(s) and the copyright owner(s) are credited and that the original publication in this journal is cited, in accordance with accepted academic practice. No use, distribution or reproduction is permitted which does not comply with these terms.
*Correspondence: Hossein Hosseiny, shossein@villanova.edu