 Shivanand Nalgire
 Pennan Chinnasamy
- Centre for Technology Alternatives for Rural Areas (CTARA), Indian Institute of Technology Bombay (IITB), Mumbai, India
Mahatma Gandhi National Rural Employment Guarantee Act (MGNREGA) is currently the largest funded rural development program in India to ensure rural livelihood by providing employment through different activities. Owing to climate change impacts and water scarcity for the last 5 years, approximately more than 70% of activities (budget of 5 billion USD per year) are focused on water issues. For better utilization of resources, MGNREGA has been implementing these works in convergence with many other schemes like the integrated watershed management programme (IWMP), with the aim of restoring rural natural resources, like soil, vegetation, and water. Although the largest Rural Development Scheme in India, the monitoring and evaluation (M&E) does not focus on the actual impact on water resources but only focuses on the amount spent. This can lead to only information on funds spent but does not have much an impact on water resources and earmarking data for monitoring. The recent advancements in remote sensing techniques have provided open access to high-resolution satellite data along with the processing platform. Considering the available technologies and gaps in the existing M&E framework, the current study developed a low-cost, comprehensive, robust, and near real-time M&E framework to assess the impact of water projects. A novel remote sensing-based ecological index (RSEI) has been developed to assess the overall ecological status of land surfaces due to the water infrastructures developed. The performance of RSEI has also been assessed using the secondary data of crop production, which shows excellent results (adjusted R2 value of 82% and Pearson's correlation coefficient of 0.92). In addition, RSEI results were compared against the results of government audits (e.g., by the Comptroller Auditor General of India), wherein RSEI found similar areas of increased water status and crop productivity. The results indicate that the use of the RSEI-based M&E framework will allow for an impact assessment of water infrastructure and also aid to identify the priority areas demanding immediate intervention. Thus, RSEI can be used as a decision support system for stakeholders, including for smooth planning, designing, implementation, monitoring, and evaluation of water infrastructure for combating climate change extremes such as droughts.
1. Introduction
Climate change has impacted the water resources of India, which is an agrarian nation where most of the population is in agriculture. Due to the adverse effects of climate change, especially droughts, many farmers have abandoned agriculture and moved to cities for menial jobs. The Indian Government formulated different policies and measures to aid such farmers for protecting the water resources and for sustainable water resource management under climate change. Of these, the Mahatma Gandhi National Rural Employment Guarantee Act (MGNREGA) is one of the largest funded rural development programs in India with an annual budget of INR $71,000 crores (~9 billion USD) in 2020 compared with an initial allocation of INR $11,300 crores in 2006–2007 (McCord and Paul, 2019). The natural resource management (NRM) component of MGNREGS along with the Integrated Watershed Management Programme (IWMP), currently known as Watershed Development Component under Pradhan Mantri Krishi Sinchai Yojana, carries out water conservation efforts to enhance the soil moisture regime, regenerate natural vegetation, reduce the impact of climate change, and increase productive land and productivity of a region (Ranaware et al., 2015). Most funds are invested in the construction of water infrastructures (such as farm ponds, infiltration ponds, percolation tanks, and check dams). With such large funds invested, it is necessary to understand the performance of these efforts as tools for climate change adaptation and for effective sustainable water resource management under climate change. The success of these efforts is also needed to assess scalability and increase the coverage of schemes. The current monitoring efforts of the government need to be updated by using holistic datasets.
The successful implementation of any program needs to have a robust monitoring and evaluation (M&E) framework to track, analyze, and report on relevant information and data throughout the life cycle of a program. Hence, to track the implementation and outputs systematically and measure the effectiveness of the program, the Ministry of Rural Development and National Informatics Center developed the DISHA dashboard. The DISHA dashboard helps Members of Parliament (MPs), Members of the Legislative Assembly (MLAs), and district officials to track the performance of the scheme in their districts and constituencies at any geographic level and at any time period to enable data-driven decision-making. Instead of being the largest funded scheme, most of the monitoring under the DISHA dashboard is inclined to the assessment of fund spending, employment generated, and the number of works completed, but to draw maximum benefits out of the program, there also needs to be a rigorous post-implementation monitoring and impact assessment of assets created to restore natural resources and increase productivity (Chakraborty and Das, 2014). Traditionally, impact assessment works of MGNREGA are carried out with the help of sample surveys by government agencies such as the National Sample Survey Office (NSSO), which collects data from 12,784 first-stage units (FSUs) comprising 1.5 crores of the population at the national level (National Sample Survey Office, 2015). Apart from this, recently, the Comptroller Auditor General of India (CAG) evaluated the effectiveness of Jalyukta Shivar Yojana, a state version of IWMP-MGNREGS based on sample data from 120 out of 63,363 villages in Maharashtra (Comptroller Auditor General of India, 2020), but the major problem in such type of impact assessments is the small sample size, huge underlying cost, efforts, time consumption, and reliability of the results with a given sample size, which may not holistically map the effectiveness of the program. This creates a need to develop a comprehensive, low-cost, reliable, and robust M&E framework to assess the impacts and effectiveness of the program in restoring natural resources (Department of Land Resources, 2018).
In the past, many studies (e.g., Rouse et al., 1974; Rondeaux et al., 1996; Ceccato et al., 2001; Ghulam et al., 2007; Gu et al., 2007; Wang and Qu, 2007; Feng et al., 2013; Zhu et al., 2014) developed indices that were used to assess the water resource availability (in different formats, for e.g., soil moisture and plant available water), such as Normalized Difference Multiband Drought Index (NDMI). Most of the aforementioned studies did not have observation data to start with, and hence, they used remote sensing-derived data, mostly optical bands from satellite data. These indices have been widely used across the world and have been helpful in assessing individual factors for plant water availability.
Although the existing remote sensing indices provide ecological-related images, they are usually oriented to a specific ecological-related theme (such as NDVI) and thus are not ecologically comprehensive (Chinnasamy and Sood, 2020; Chinnasamy and Parikh, 2021; Chinnasamy et al., 2022; Lonare et al., 2022; Singh et al., 2022). Hence, aggregated remote sensing-based ecological indices have advantages over single ones, as the aggregated index monitors ecological status with two or more metrics and can be used to identify more features related to the ecological status, which reveals the comprehensive ecological status (Coutts et al., 2016). A site-specific aggregated index can facilitate the quick and effective quantification and detection of surface biophysical characteristics over a time to make the technique a robust ecological change detection tool. The most desirable ecological conditions would have higher vegetation coverage, higher soil–plant moisture, and less land surface dryness. The poor ecological conditions may occur mainly in the deserts and intense soil erosion areas, with almost no vegetation and extremely hot and dry conditions. Based on the notion of Hughey et al. (2004) pressure state response (PSR) framework, the above conditions of the ecological status like higher soil–plant moisture, less surface dryness, and higher vegetation cover will lead to increased areas under cultivation as well as increased crop productivity of a region. While the need for the aggregated index is now understood, the use of such an index for monitoring and evaluating sustainable water resources development is not available. Moreover, the aggregation of indices is a site-specific method, wherein the function of each index would vary depending on the geophysical and environmental conditions. While India has invested a lot of funds in establishing these infrastructures to reduce climate change impacts, overall evaluation and data for such evaluations are limited.
Given such issues in the current monitoring framework, the current study aimed to improve the monitoring and evaluation of water infrastructure projects by using a holistic indicator-based approach. The major objective of the study is to develop a multidimensional index-based M&E framework using high-resolution and open-source remote sensing data, which can aid in rapid and open source–based assessments. The development of such remote sensing-based monitoring and impact assessment system will help to build an accountable, transparent, unbiased, low-cost, swift and effective implementation mechanism, with a feedback loop for the optimum utilization of resources.
2. Materials and methods
2.1. Study area
The MGNREGS-IWMP projects are implemented at the watershed level, and are delineated under the IWMP. Among all the delineated watersheds in India, Maharashtra (Figure 1) has the highest number of IWMP watersheds and hence is shortlisted for determining the study area. To have a focused study, the current study analysis has been limited to the district level, wherein the aim will be on developing the M&E framework for three categories of works under MGNREGS, that is, water conservation and water harvesting for sustainable water resource management under climate change, drought proofing, and renovation/restoration of traditional water bodies. On the same note, the total completed projects of the aforementioned categories in Maharashtra from 2011 to 2020 have been analyzed district-wise as shown in Figure 2. The Ahmednagar district in Maharashtra is one of the top three districts with a maximum number of completed projects, that is, 20,028 after Amravati and Jalgaon. Apart from this, the Comptroller Auditor General of India (CAG) has also audited Ahmednagar district as a part of the evaluation of Jalyukta Shivar Abhiyan, a state version of MGNREGS-IWMP, to ensure the water availability and enhance crop production. Hence, since the Ahmednagar district (Figure 1) had evaluation data and remote sensing data, it has been selected as the study area so that the developed monitoring index can be validated.
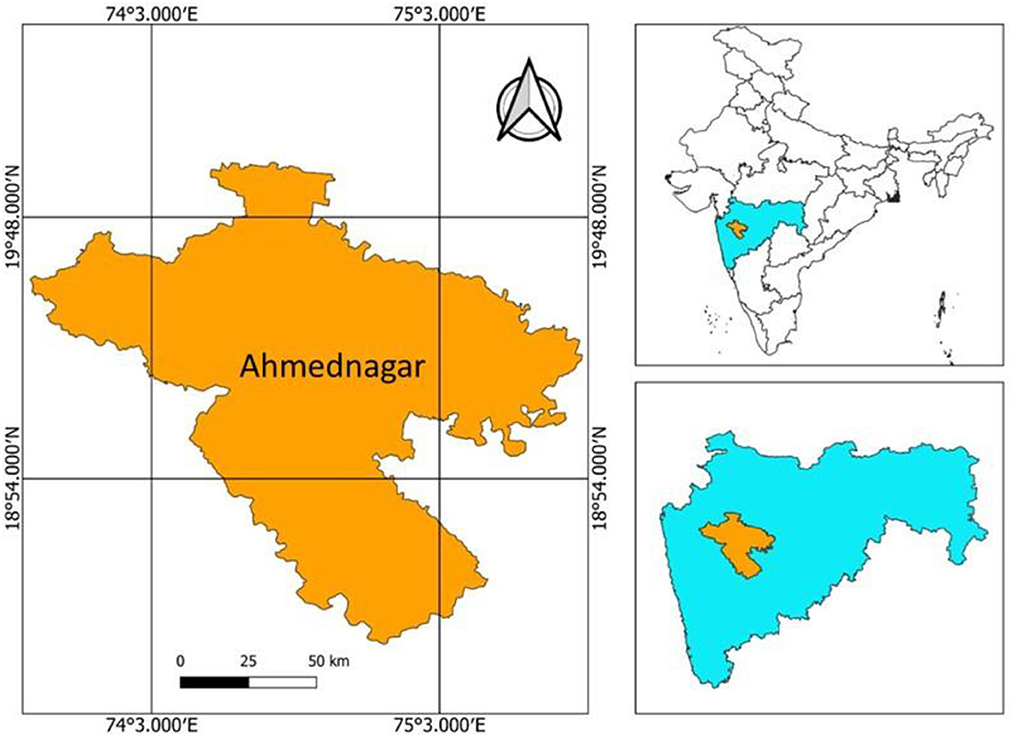
Figure 1. Study area geographical location of Ahmednagar district (Orange) in Maharashtra state (blue) of India.
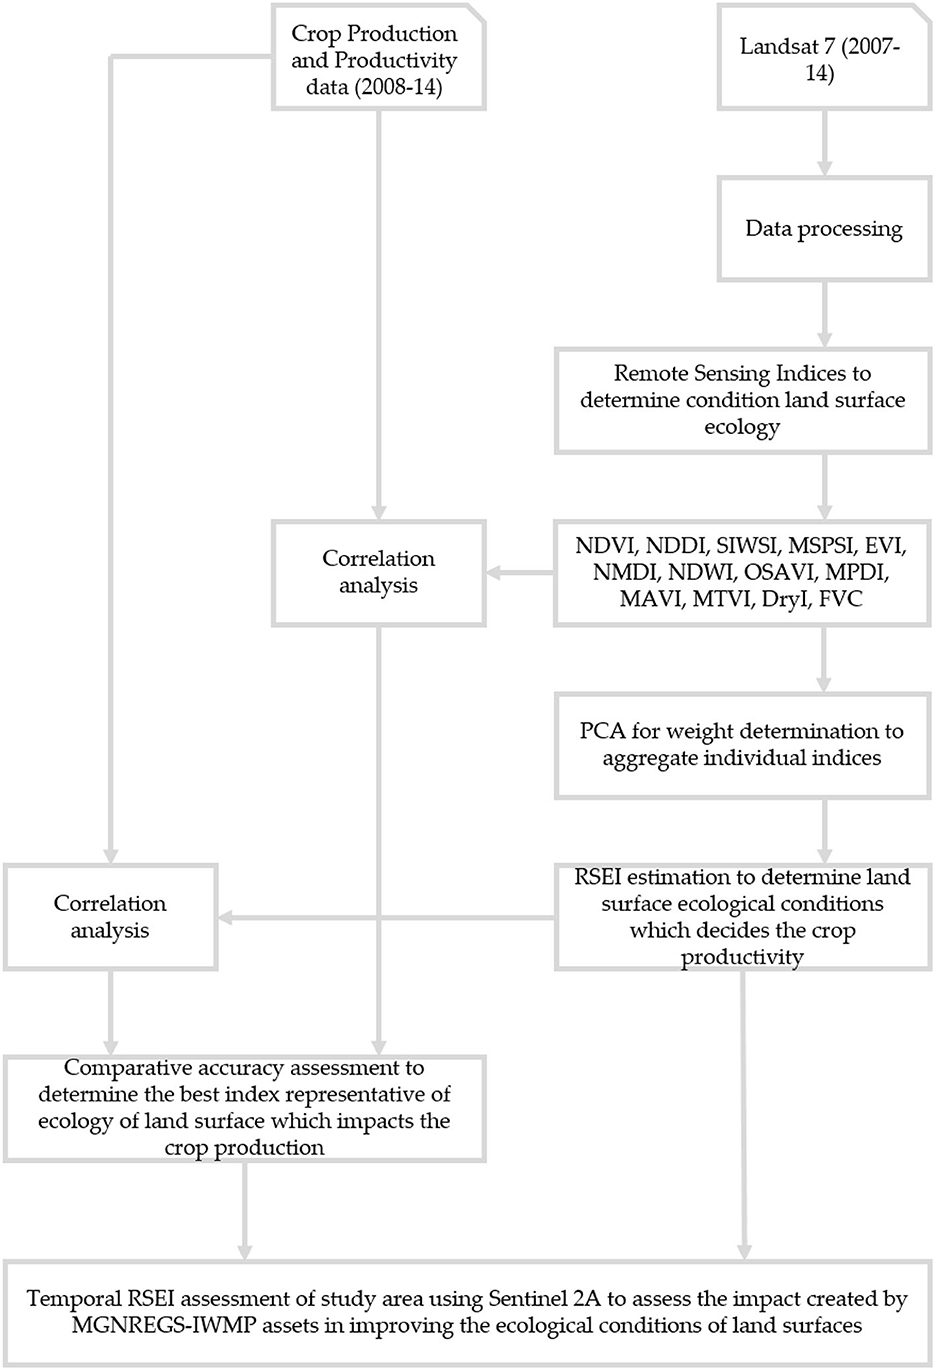
Figure 2. Framework and methodology of study.
2.2. Methods
The flowchart for the methodology is shown in Figure 2. In the first step, a comprehensive literature review of remote sensing indices was conducted to identify key indices (Table 1), which represent the conditions of land surface ecology, which in turn impacts crop production of a region. The selected 15 remote sensing indices were identified as shown in Table 1. In the second step, the trend of these 15 remote sensing indices and their spatiotemporal variations of the remote sensing data-derived biophysical characteristics for the study area were evaluated and correlated with the crop productivity data provided by the Government of India. In the third step, the important surface characteristics, including heat, greenness, dryness, and wetness, were combined based on RSEI, and surface ecological conditions were modeled using Landsat 7 imagery. Then, the spatiotemporal variations for the study area using the RSEI were evaluated and correlated with crop productivity. In the fourth step, the accuracy of correlation analysis by individual indices and RSEI was evaluated to identify the best index that can be used to determine the crop productivity of a region. The RSEI analysis was further carried out for the period of 2015 to 2020 to determine village-level spatiotemporal variation of RSEI vis-à-vis biophysical characteristics. Such analysis of spatiotemporal variations can be used as the proxy for the performance of the MGNREGS-IWMP projects, which was aimed at enhancing the crop productivity of a region by enhancing the land surface ecological conditions.
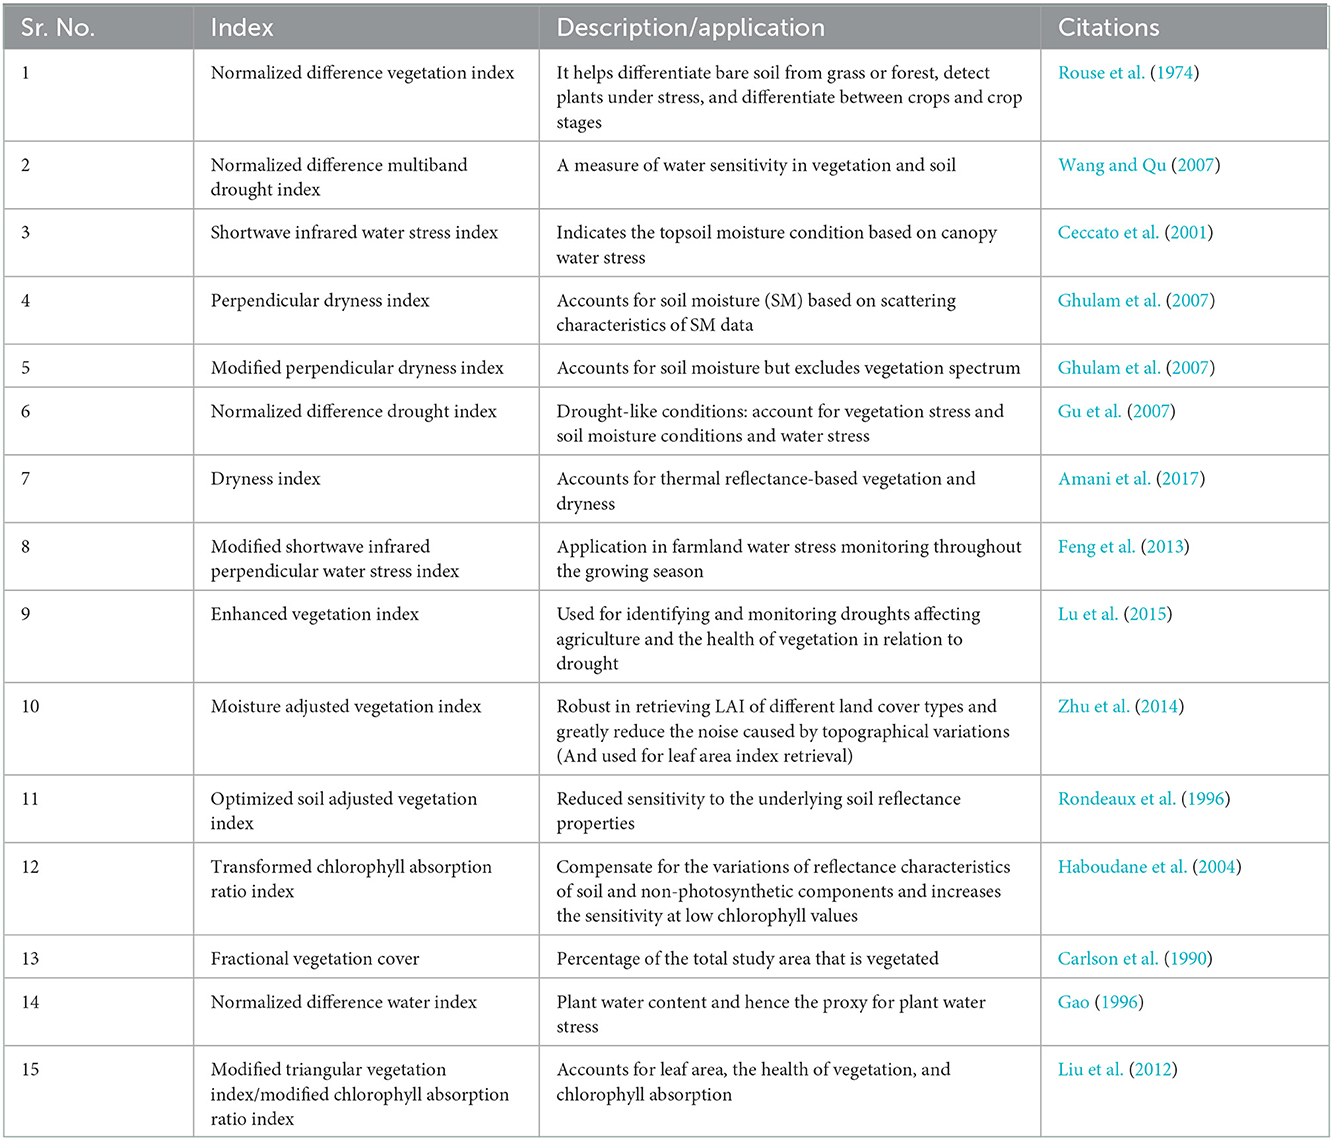
Table 1. Description and application of remote sensing indices to be used in the RSEI model.
Landsat 7 reflective bands have been used to calculate surface biophysical characteristics. The different spectral indices identified through the literature review, as shown in Table 1, were used to extract biophysical characteristics, such as vegetation condition, crop water stress, and soil moisture conditions.
2.2.1. Development of remote sensing-based ecological index
In this study, RSEI was used to model the surface ecological conditions. The concept behind RSEI is such that any ecological changes will have a significant alteration in four important characteristics of land surfaces, which are moisture, greenness, dryness, and heat (Xu et al., 2019). Accordingly, RSEI can be expressed as a function of the four indicators: greenness (representing vegetation), moisture (representing soil moisture), heat (representing temperature), and dryness (drought conditions), which are often involved in assessing ecological status as the four indicators are strongly correlated to ecological status and can be directly perceived by people (Mishra et al., 2015; Coutts et al., 2016). Accordingly, as per Xu et al. (2019), RSEI can be expressed as a function of the four indicators as follows:
To assess the surface ecological conditions based on RSEI, first, the values of all the spectral indices used were standardized between 0 and 1. Afterward, the PCA was utilized for identifying the relative importance of spectral indices related to greenness, moisture, and dryness. The eigenvalue of the first three components of PCA (PC1, PC2, and PC3) integrates most characteristics of all variables, and therefore, a surface ecological condition map was built with PC1, PC2, and PC3. To mitigate the problems associated with high dimensional data, a set of techniques referred to as “dimensionality reduction techniques” are used (Reddy et al., 2020). Some of the commonly used dimensionality reduction techniques are the low variance filter technique and the high correlation filter technique. In the low variance filter technique, the variance in the distribution of all the attributes is compared, and the attributes with very low variance are eliminated. A high correlation filter technique determines the pairwise correlation between attributes, and one of the attributes in the pairs that show a very high correlation is eliminated. After identifying the best attributes, the model performance was assessed against the crop production in the Ahmednagar district, and such models with a reduced number of attributes are also known as reduced models (RMs).
2.3. Data
In this study, multiple remote sensing satellite data were used based on the date of availability and best resolution. Landsat 7 images (with a spatial resolution of 30 m and a temporal resolution of 16 days) were used for the period of 2001 to 2014 to calculate monthly and annual mean values of 15 distinct individual remote sensing indices identified through a comprehensive literature study (listed in Table 1). Landsat 7 imagery was selected for the period of 7 years in such a way that the maximum cloud cover of the study area at satellite overpass time was 10%. For the period of 2015 to 2020, the Landsat 8 (with a spatial resolution of 30 m and a temporal resolution of 16 days) and Sentinel 2A (with a spatial resolution of 10 m and temporal resolution of 10 days) images were used. All the datasets were accessed, processed, and analyzed on the Google Earth Engine, a free and open-source cloud computing platform. The study used the data from Landsat 7, Landsat 8, and Sentinel-2A as per the availability and open accessibility, but the use of high-resolution data or super-resolution/resampling techniques can further enhance the model performance, accuracy, and reliability. Apart from the satellite images, the secondary data on crop production and productivity were used for the study area provided by the web data portal of the Government of India (https://data.gov.in). The secondary data of crop production were used to validate the model and assess the accuracy of the model in determining the crop productivity of a region.
3. Results
3.1. Assessing the best reduced model
To find out the best model to assess the ecological status of land surfaces, multiple reduced models (RMs) are developed by pruning the attributes to the highest accuracy, as shown in Table 2. The RSEI index calculated is standardized between 0 and 1. The RSEI value of 0 and 1 indicates the worst and best surface ecological conditions, respectively. The results indicated that, out of the various RMs (RM1 to RM15), the Reduced Model 3 (RM3) with three attributes, such as spectral indices, Vegetation Condition Index (VCI), Normalized Difference Multi-Band Drought Index (NMDI), and Optimized Soil-Adjusted Vegetation Index (OSAVI), generates the optimum model with 85% of adjusted R2 and 70% of predicted R2. Hence, the dimensionality of the model was reduced from 15 attributes to three attributes with considerable improvement in model performance, reduced computing time, and reduced cost for monitoring data. After finalizing the attributes, the RSEI maps were generated for the study area for the period of 2015 and 2020, and the performance of MGNREGS-IWMP assets in improving the natural conditions was assessed at the village level.
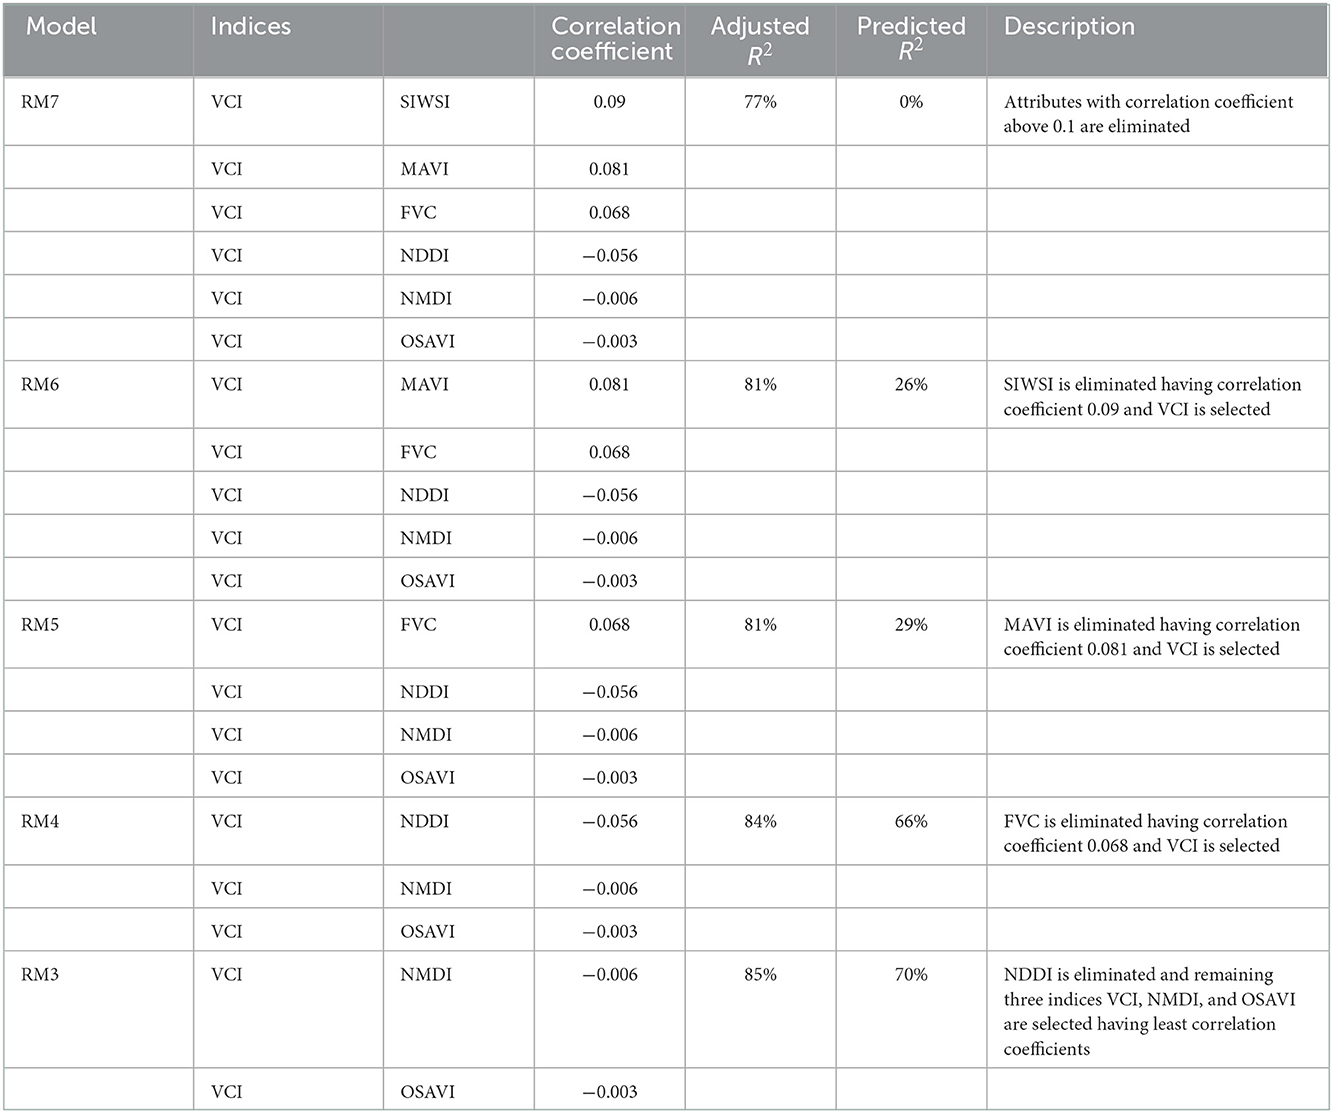
Table 2. Accuracy assessment of various reduced models (RMs).
3.2. Variations of spectral indices and RSEI for the study area
The performance of the individual spectral indices and the RSEI to represent the ecological status has been validated against crop productivity (government records) of the study area from 2001 to 2014. The model efficiency was assessed using the adjusted R2 and predicted R2. The analysis of crop productivity against the individual and aggregated spectral remote sensing indices in terms of adjusted R2 value and the predicted R2 value is shown in Table 3.
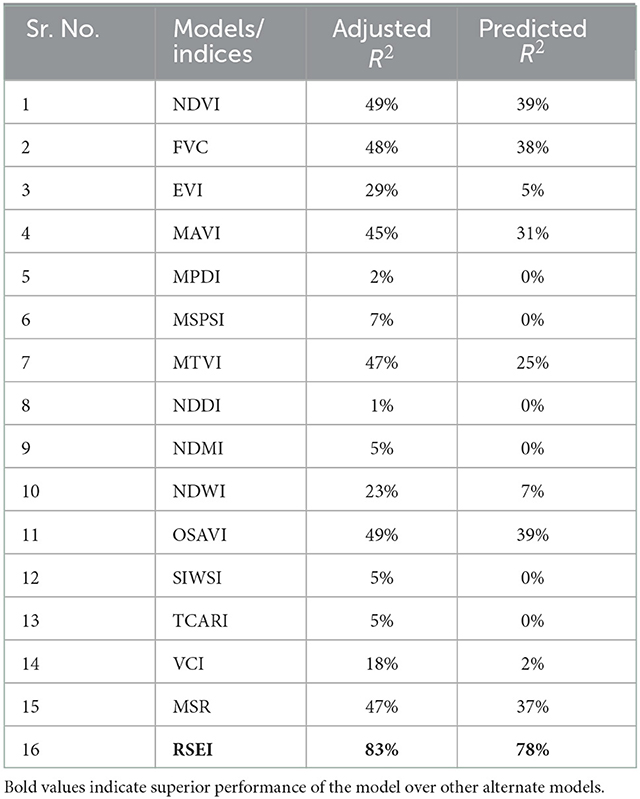
Table 3. Accuracy assessment of RSEI and other remote sensing indices against the crop productivity.
It is clear that the RSEI index shows an adjusted R2 value of 83% against the predicted R2 value of 78%, which is 1.8 times higher than all other index. The Pearson correlation coefficient of RSEI with crop productivity comes out to be 0.92, which is considered to be good statistics to trust the model performance. The validity of the regression model was also checked with the help of a normal probability plot of residuals, which helps to make a valid inference. To make this model valid, the residuals of the regression need to be normally distributed. The following Figure 3 shows the normal probability plot of deleted residuals of the regression model for RSEI against the crop production data. To assess whether the residuals of regression are normally distributed, the Anderson–Darling normality test statistic was calculated. A P-value of more than 0.05 indicates that the model failed to reject the null hypothesis that the dataset is normally distributed. Hence, this confirms the normality of residuals and the validity of the regression model, which is considered sound enough to proceed with further analysis.
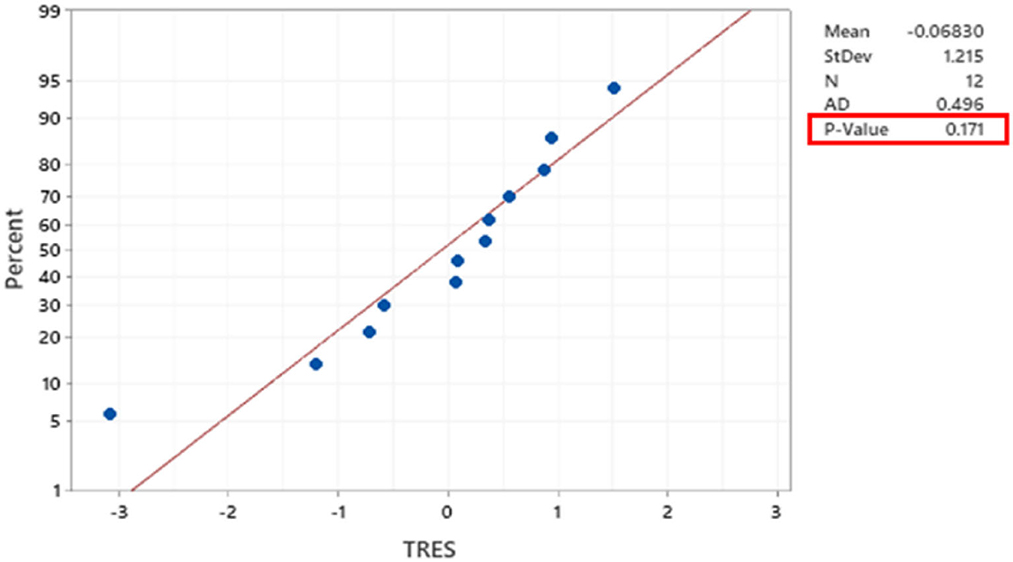
Figure 3. Normal probability plot of deleted residuals of RSEI (Note: TRES: deleted residuals).
3.3. Comparative impact assessment of MGNREGS-IWMP projects in Ahmednagar district using RSEI framework and Comptroller Auditor General of India's report
In December 2014, the Government of Maharashtra launched a program, in a campaign mode, named Jalyukta Shivar Abhiyan, converging existing water conservation schemes in line with the central government schemes like MGNREGS and IWMP (WDC-PMKSY) in an endeavor to make Maharashtra a drought-free state by 2019. The objectives of the Jalyukta Shivar Abhiyan were to harvest maximum rainwater in the surrounding village, increase the groundwater level, increase the area under irrigation, assured water for farming, and the efficiency of water usage, and create decentralized water storages (Comptroller Auditor General of India, 2020). The program provisioned for the implementation of works like creating water structures, storage structures–cement nala bandh, chain cement concrete nala bandh, continuous contour trench, compartment/graded bunding, farm ponds, earthen dam, recharge shaft, repair of old structures, such as percolation tank, storage tank, and Kolhapur type weir, in convergence with MGNREGS-IWMP, which lies mainly under three categories of works–water conservation, drought proofing and renovation of traditional water bodies. The total number of projects completed under these three categories in the Ahmednagar district from 2007 to 2020 is shown in the following Table 4.
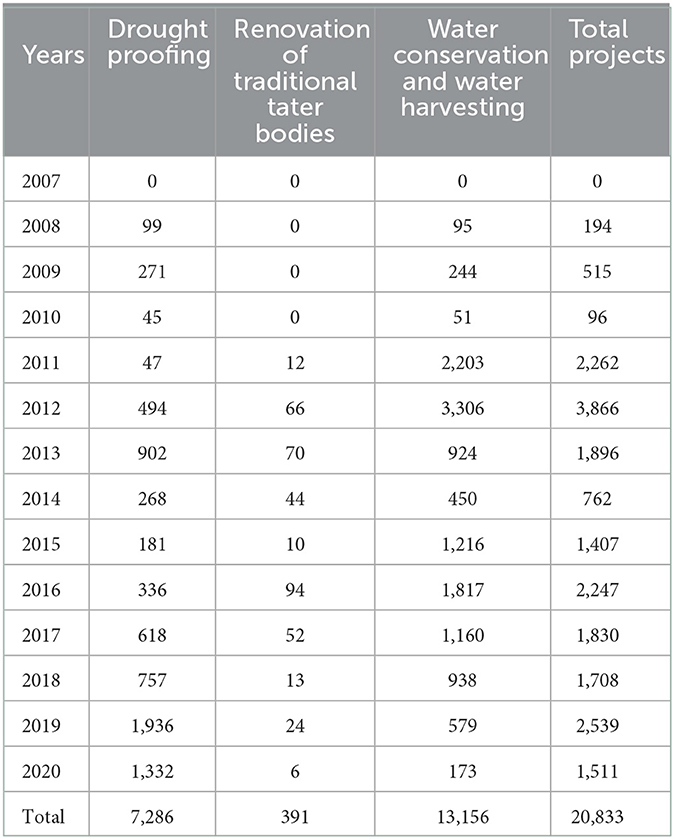
Table 4. MGNREGS-IWMP projects completed in Ahmednagar district from 2007 to 2020.
The CAG conducted an audit to assess whether appropriate planning was done for effective and efficient implementation of the Abhiyan, adequate funds were provided, monitoring was effective, and the Abhiyan was able to overcome the drought situation in the state to increase the area under cultivation and crop production (Comptroller Auditor General of India, 2020). CAG conducted the audit for 6 districts, namely Ahmednagar, Beed, Buldhana, Palghar, Nagpur, and Solapur, and 12 talukas (two talukas from each selected district) having the highest expenditure were selected for scrutiny. Taluka is a local unit of administrative division within a district including the designated city, town, and hamlet that serves as its administrative center, with possible additional towns and usually several villages.
3.3.1. RSEI-based impact assessment Ahmednagar district
The CAG audit found that, in 83 of the 120 villages selected for the study, the storage created was not sufficient to meet the water requirement, as indicated in the village plan for drinking and irrigation (Comptroller Auditor General of India, 2020). Out of the total 112 villages, which prepared the Water Neutral Report (the village is declared as water neutral if the water storage created meets the water requirement of the village), 66% did not achieve water neutral status, but upon the site survey and investigation, it was found that, in reality, only 26% of the villages achieved water neutrality. Although the list of villages achieving and failing water neutrality was not disclosed, the number of villages from each district failing to achieve water neutrality was provided. This current section of the study aimed to analyze the villages surveyed by CAG with the RSEI framework to find out the aspirational areas to achieve water neutrality. CAG surveyed Karjat and Jamkhed talukas in the Ahmednagar district as samples to evaluate the effectiveness of projects. Hence, these two talukas were selected for detailed analysis. The location of the study area is shown in Figure 4. The village-wise RSEI for the years 2015 and 2020 is calculated for Jamkhed and Karjat talukas in the Ahmednagar district to assess the ecological status of land surfaces.
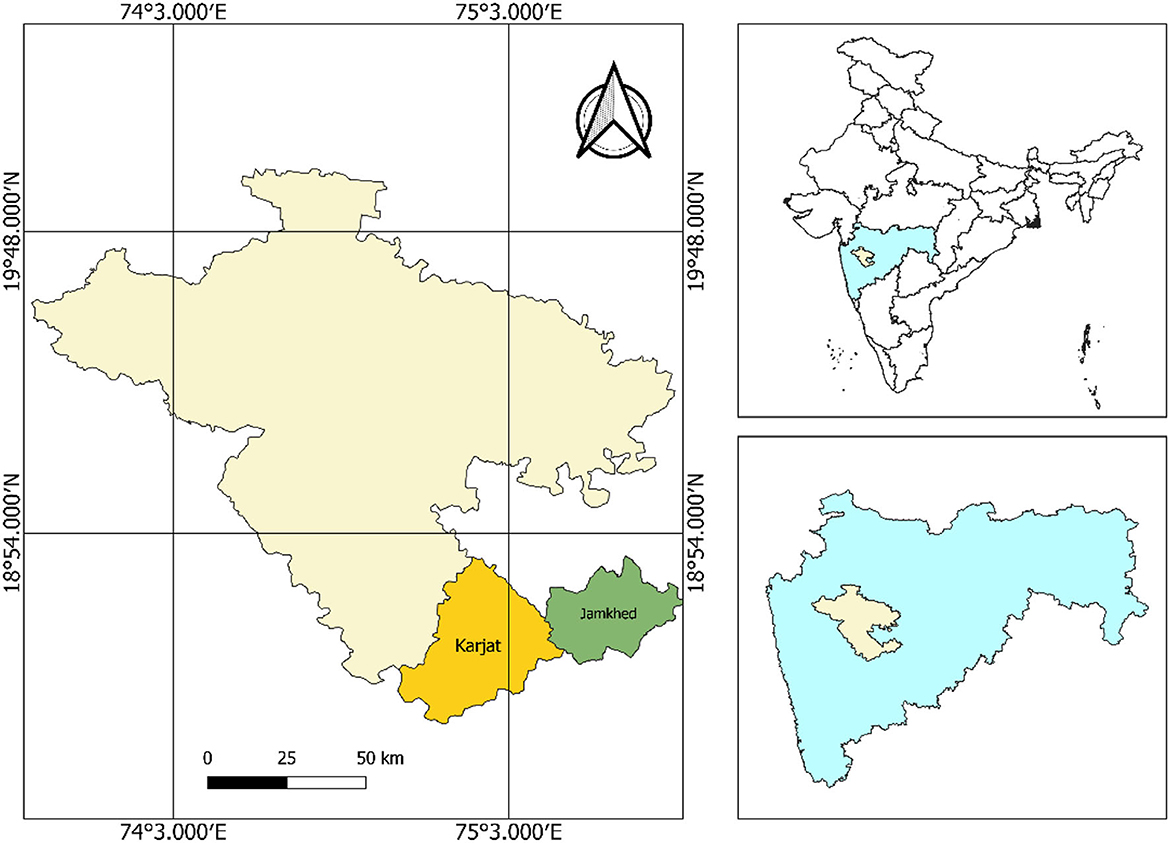
Figure 4. Jamkhed (green) and Karjat (orange) talukas in Ahmednagar (orange) district of Maharashtra state (sky blue).
3.3.2. Village-wise RSEI analysis for Jamkhed and Karjat taluka
The RSEI status (higher value indicates healthier ecological status) of villages in 2015 is compared with the RSEI in 2020 to assess the impact and effectiveness of the projects in Jamkhed and Karjat talukas. In addition, the RSEI framework, to assess the impact of projects, helps to identify the spatial location of poorly performing projects in the form of areas with a poor ecological status of land surfaces and hence creating possibilities for recommendations on immediate intervention in the crop cycles.
The analysis of Figures 5, 6 shows the areas whose ecological status of land surfaces has been improved over a period of 5 years, which may be due to the positive impact of projects, like water conservation, drought proofing and restoration of traditional water bodies. The comparative analysis of the aforementioned figures identifies the villages in which RSEI has increased and the positive impact of which is clearly seen in the western part of Jamkhed talukas in the villages like Chondhi, Bavi, Fakrabad, Halgaon, Aghi and Jawala, with an overall increase from 0.3 to 0.45. The Khamgaon village in the taluka has not shown an improvement in the RSEI value over a period of 5 years, which indicates that there is some issue in terms of the performance of the MGNREGS-IWMP (WDC-PMKSY) projects.
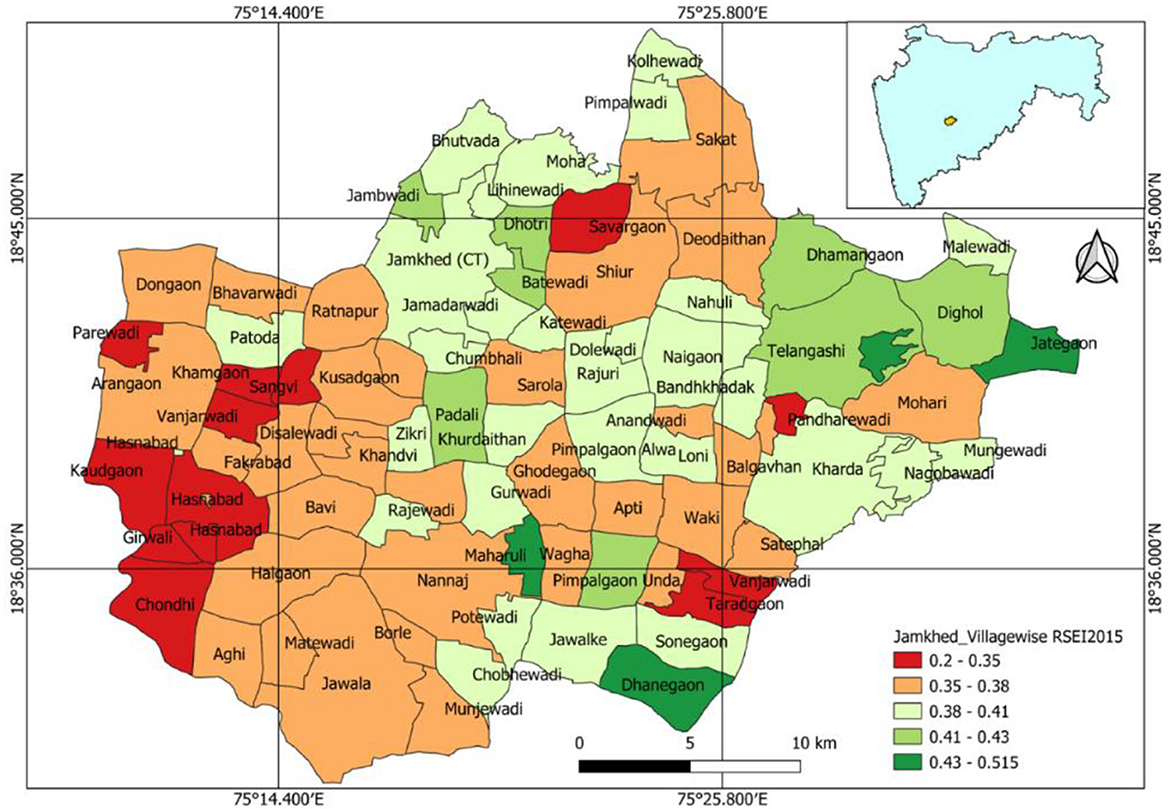
Figure 5. Village-wise RSEI of Jamkhed taluka for the year 2015.
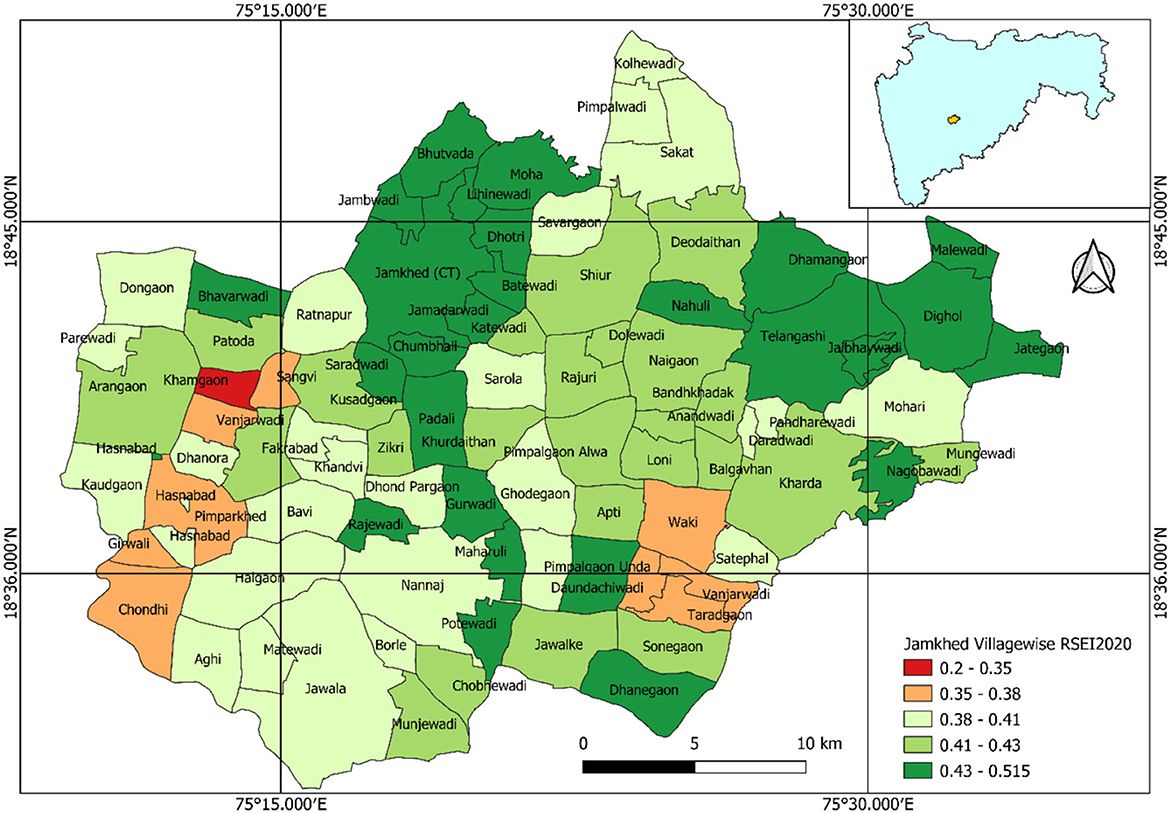
Figure 6. Village-wise RSEI of Jamkhed taluka for the year 2020.
The analysis of Figures 7, 8 shows the areas whose ecological status of land surfaces has been improved over a period of 5 years, which may be due to the positive impact of projects like water conservation, drought proofing, and restoration of traditional water bodies. The comparative analysis of RSEI in 2015 and 2020 identifies the villages in which RSEI has increased, which is seen in most of the parts of Karjat talukas in the villages like Bargewadi, Nandgaon, Sonalwadi and Benwadi. Some villages like Nagamthan and Chande Kh. show mild improvements in RSEI than the rest of the villages in Karjat taluka. The analysis of RSEI for the years 2015 and 2020 shows that there is a good improvement (from 0.3 to 0.5) in the RSEI-based ecological status of the region, and hence, it can be concluded that the MGNREGS-IWMP (WDC-PMKSY) projects effectively generated the results, such as, increasing the water availability and restoring natural resources and crop production.
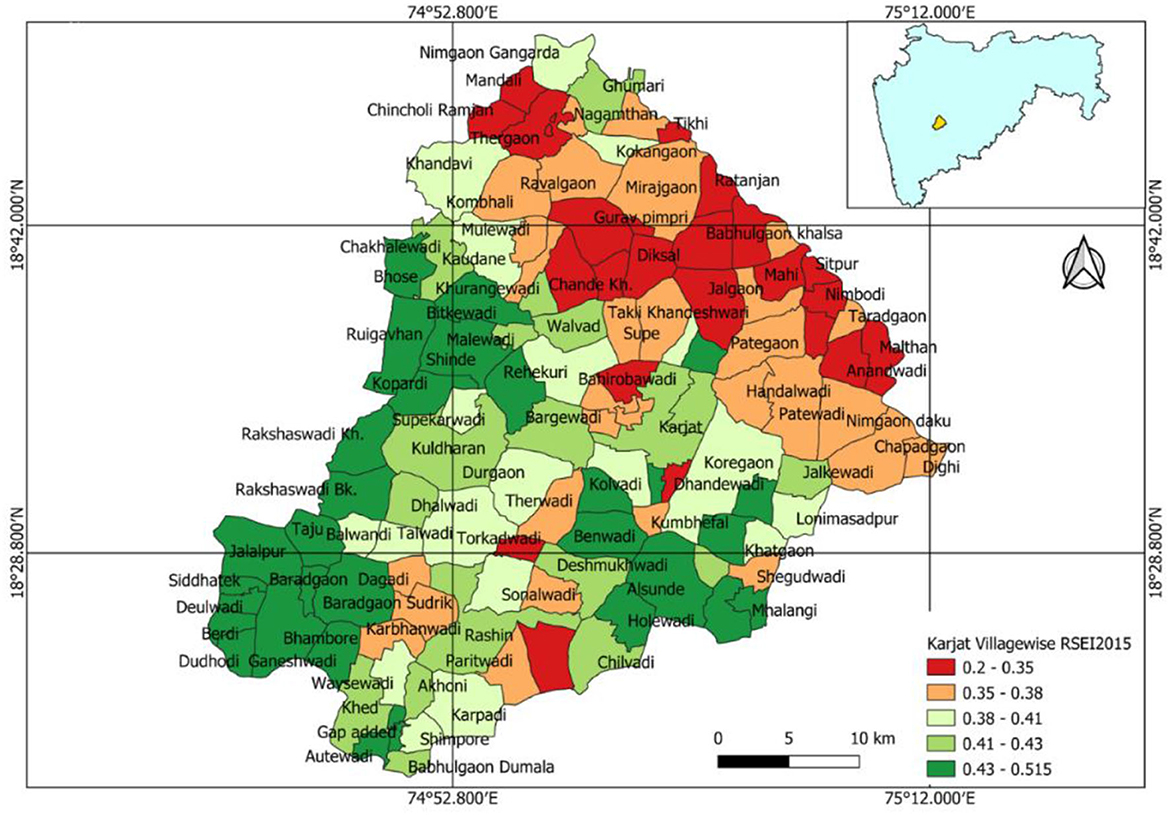
Figure 7. Village-wise RSEI of Karjat taluka for the year 2015.
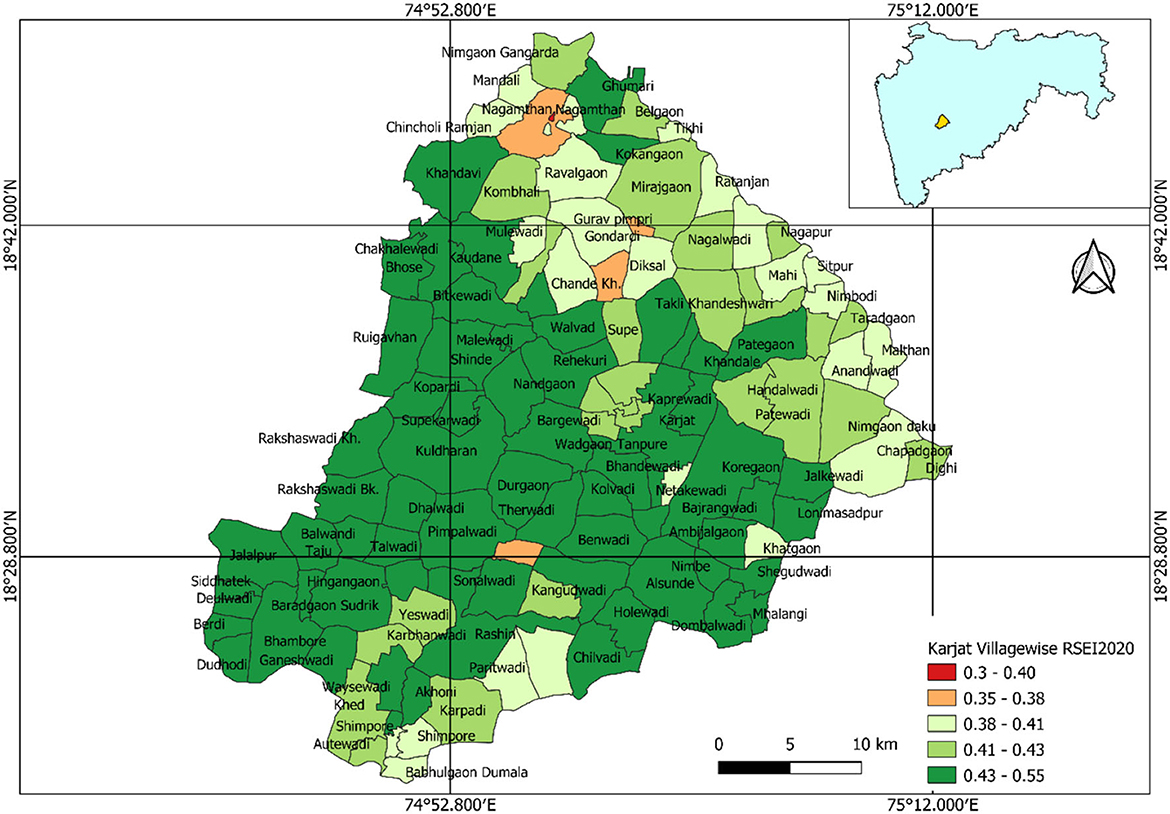
Figure 8. Village-wise RSEI of Karjat taluka for the year 2020.
The aforementioned results indicate that the RSEI-based M&E framework will help in assessing the project impacts and the ecological status of land surfaces in near real-time with regular monitoring in 10 days' temporal resolution and 10 m of spatial resolution (as per the satellite data spatial and temporal resolutions). The resolutions are expected to be higher with new satellites and data processing. In this study, among the 120 test-checked villages, 76 villages had less than the estimated runoff (Comptroller Auditor General of India, 2020), among which 15 villages were in the Ahmednagar district. Therefore, there will be less water stored during climate change extremes of floods and isolated rainfall. Less water storage leads to a shortage in water availability to the crops and hence will produce crop water stress, which ultimately will hamper crop production. This water stress in plants, bare land, and soil moisture conditions can be tapped using RSEI. The lists of villages in Jamkhed taluka, which show poor RSEI values (<0.38) even in 2020 as compared to 2015, are as follows: Khamgaon, Sangvi, Vanjarwadi, Hasnabad, Pimparkhed, Girwali, Chondhi, Waki, and Taradgaon. The villages in Karjat taluka with low RSEI values (<0.38), even in 2020 as compared to 2015, are as follows: Chande Kh. and Nagamthan.
3.4. Impact assessment of MGNREGS-IWMP projects on applied and controlled sites
To understand the effect of projects/assets created under the program, the analysis was conducted on an applied site, that is, the district with the maximum completed projects and a control site with minimum completed projects (with similar geophysical and environmental conditions). The analysis found out whether the applied site generates any additional benefits over the controlled site, which helps to understand whether the project implementation has been able to improve the ecological conditions of the region aiding an optimum resource allocation and utilization. The ecological status of land surfaces in any region highly depends on the agroclimatic conditions. The agroclimatic zones are delineated based on the soil, water, temperature, rainfall conditions, and water availability, which influence the type of vegetation, cropping intensity, cropping pattern, etc. The soil slope, soil texture and soil drainage play a crucial role in the regional ecology of land surfaces. The regions with the same agroclimatic conditions demonstrate similar characteristics and behavior in cropping patterns. Hence, while selecting the controlled and applied sites, all these parameters need to be identical for a fair comparison and accurate design of the experiment. Ahmednagar is one of the districts having the highest number (20,028) of works completed under the category of water conservation, restoration of traditional water bodies, and drought proofing. Solapur district is one of the districts with the lowest number (2,800) of MGNREGS-IWMP works completed. Ahmednagar and Solapur districts lie in the same agroclimatic zones of very high rainfall zone with non-laterite soils, as shown in Figure 9. Both districts have soil slopes ranging from 3 to 8%, clayey soil texture, and moderately well-drained soil (ICAR-National Bureau of Soil Survey and Land Use Planning, 2020). Hence, based upon the aforementioned criteria, which make both the districts have the same climatic and geological conditions, Ahmednagar is selected as an applied site, and Solapur district is selected as the controlled site.
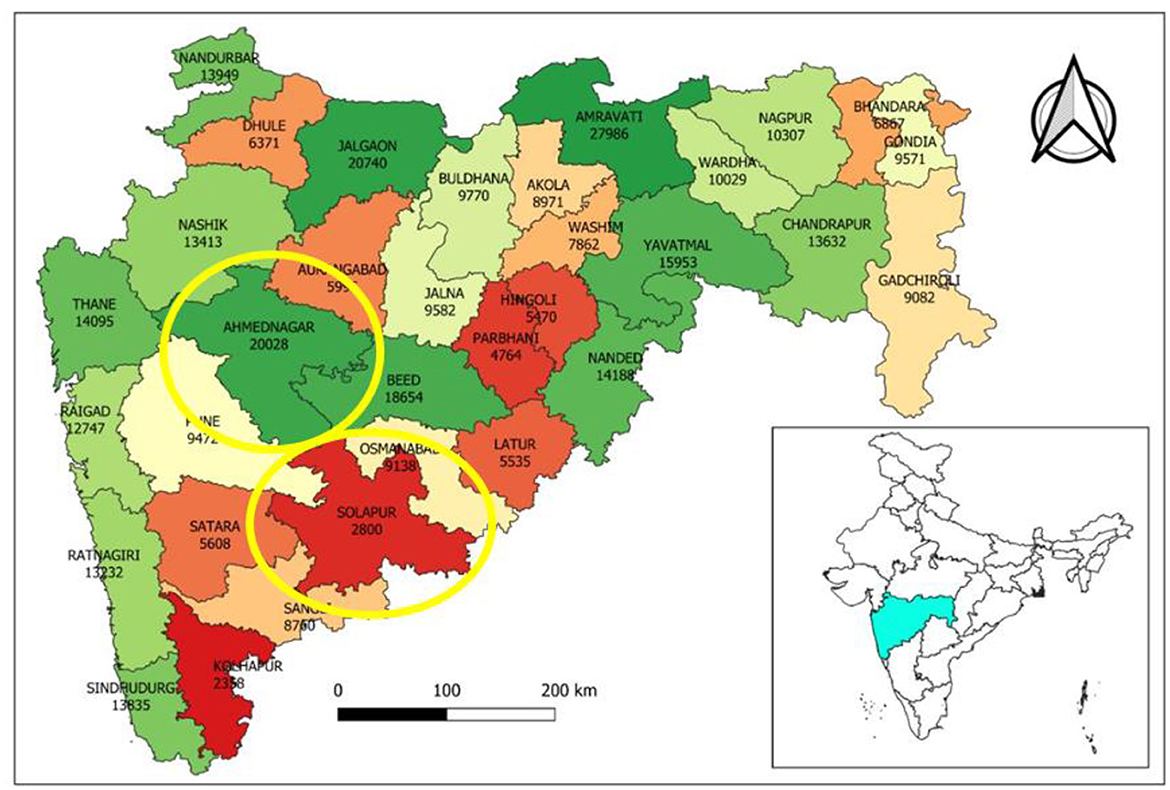
Figure 9. District-wise MGNREGS-IWMP projects completed from 2007 to 2020 highlighting the applied (green) and controlled (brown) sites in yellow markings.
The crop productivity of the Ahmednagar and the Solapur districts were calculated, and the average annual growth rate (AAGR) of crop productivity was analyzed for the same. The AAGR of the Solapur district was 6%, whereas the Ahmednagar district was observed to be 3%. The newly developed RSEI was also calculated for both districts for the period of 2008 to 2020 using Landsat 7 images. The AAGR of RSEI from 2008 to 2014 for the Ahmednagar district was 4%, whereas it was 6% for the Solapur district, that is, 2% higher than the Ahmednagar district. The RSEI analysis supports the results of the productivity analysis, which was 3% higher for the Solapur district. These results again support the performance efficiency of RSEI in determining the water and crop productivity and hence the ecological status of a region, which in turn acts as a proxy M&E framework to assess the impact of MGNREGS-IWMP projects.
These results demonstrate that the implementation of MGNREGS-IWMP projects has created limited additional benefits in increasing the crop productivity of the Ahmednagar district (in comparison with the Solapur district), which was in line with the findings from the CAG report (2020). This questions the implementation effectiveness and quality of MGNREGS-IWMP projects, which needs to be further investigated with a detailed ground study so that the fund resources will be utilized in the right place, at the right time, and for the right cause.
3.5. Replicability of the RSEI model to other regions
The RSEI index used in the study to assess surface ecological conditions and estimate crop production is a composite index iteratively developed using multiple spectral indices. RSEI was initially developed using 15 spectral indices (called RSEI15/Full Model) identified through a comprehensive literature review. To mitigate the problems associated with high dimensional data, the dimensionality reduction technique was used and such models with a reduced number of attributes are called reduced models (RMs). Afterward, the PCA was applied to the full model (FM) and reduced models (RMs) for identifying the relative importance of spectral indices related to greenness, moisture, and dryness, and the model performances were analyzed. The study found that the RSEI3 (RM with three attributes) was outperforming all other models and hence finalized for the study. The study deploys a systemic method for the selection of attributes (spectral indices) for a specific region, since the performance of spectral indices may vary from region to region. The set and number of spectral indices to be used in the RSEI model can vary from region to region based on regional agroclimatic conditions. In this way, the RSEI model and the methodology used in this study based on the selection of specific spectral indices can be replicated in any part of the world.
4. Summary and conclusion
The study emphasizes the limited monitoring and evaluation mechanisms for impact assessment in the existing system, rather than critiquing earlier investment decisions, especially in Asian regions. To address the same, RSEI has been developed to identify the underperforming areas so that corrective measures can be incorporated in future program implementation. The spatial and temporal change detection for a region's water and ecological status is difficult due to fewer observation data. Hence, most new water resource infrastructures are not evaluated and therefore less space for increasing efficiencies. To overcome this limitation, the study developed a prototype method by employing the remote sensing-based ecological index, that is, RSEI. The RSEI technique makes distinctions among different water availability and ecological change-related approaches using individual indices because the result of the RSEI approach is not only provided with a single numeric value but also a comprehensive image that illustrates the spatial difference of regional water and ecological conditions. This status image will help to make change detections spatially and temporally as demonstrated for the Ahmednagar district, which otherwise would be difficult with the current non-availability of data.
Currently, available high-resolution satellite data have been widely used for creating such indices, and this study used an aggregate index to establish a tool for the periodic monitoring of projects at a large scale. The newly developed RSEI framework, with a spatial resolution as high as 10 m and a temporal resolution as long as 10 days, respectively, with the satellites such as Sentinel-2A, was tested for field sites with the available data. The analysis of CAG's audit shows that the MGNREGS-IWMP projects have not generated the desired outcomes in the study areas of Ahmednagar in Maharashtra. The use of the RSEI framework for the same site also demonstrated that the results in line with CAG's findings. In addition, the RSEI helped to identify the areas with the poor performance of projects and provide an opportunity for data-driven decision-making and intervention design. The RSEI based on open-source remote sensing big data has enabled the near real-time, comprehensive, robust, unbiased, and low-cost monitoring of the projects to provide a decision support system for decision-makers to ensure that the resources will be utilized in the right place, at the right time, and for the right cause.
The RSEI has been effective in monitoring the actual impacts of the MGNREGS-IWMP (WDC-PMKSY) projects in improving the ecological status of the region, with an adjusted R2 value of 82% and Pearson's correlation coefficient of 0.92. The RSEI framework demonstrated the results in line with CAG's findings, and it helped us to identify the areas with the poor performance of projects at a large scale. The analysis of controlled vs. applied sites shows that the applied site, that is, the Ahmednagar district with 20,028 MGNREGS-IWMP projects, has generated no additional benefits toward the restoration of natural resources and improvement of productivity of a region. Contrary to that, the Solapur district with just 2,800 MGNREGS-IWMP projects has shown an annual increase in productivity of 6% against 3% for the Ahmednagar district. The findings from the secondary and remote sensing data seriously question the need, implementation and methodology of the MGNREGS-IWMP program, which are in line with the government's individual audits. This type of M&E framework will definitely help the stakeholders from gram panchayats, district officials, state, and national levels for improving the performance of water resource management structures and also in wisely using funds.
In the age of climate change, water conservation has been critical. MGNREGA is the world's biggest adaptation program that harnesses the labor of people to invest in fighting drought and building resilience. Considering the importance of water conservation and adaptation to climate change, 60% of the expenditure and 75% of the projects permissible under MGNREGA contribute to water conservation efforts and directly improve water security. The program has contributed not only just as a social security scheme but also by increasing access to water as climate resilience. Given that climate change will increase the incidence of weather shocks, for instance, too much rain over a short period, over a small geography, or scanty rain in areas that were used to abundant rainfall, there is a need to build robust adaptation programs. To build a robust adaptation program, there is a need for a robust monitoring mechanism to assess the impact of implemented projects and suggest corrective measures for future program implementation. As the RSEI helps to assess the ecological condition such as drought and its impact on crop production, it provides the decision support system for adaptive and corrective program implementation for building climate adaptation.
5. Limitations and future directions
The RSEI-based M&E framework helps to identify the problematic project sites, but it needs ground-truthing data to further investigate the issues in the projects/assets created. The set and number of spectral indices to be used in the RSEI model can vary from region to region based on regional agroclimatic conditions. Hence, the RSEI model needs to be modified for different regions. The RSEI model development uses the Landsat 7 data with a spatial resolution of 30 m and a temporal resolution of 16 days, whereas future studies may incorporate the higher-resolution techniques that may lead to the improvement in model accuracy. MGNREGA data sources provide data about the number of projects but there are limited data available on the capacity factors of individual projects, hence making it difficult to quantify the capacity/quality of built water infrastructure. The parameter of the capacity factor of water infrastructures created can be included in future studies that would further enhance the understanding of project impact. The study is based on remote sensing data, it uses the secondary data provided by government agencies, and the reliability of which might impact the model validation. The results obtained from the RSEI-based M&E framework are completely based on the remote sensing data and the supplementary primary data collected from the ground will definitely boost aid for M&E. The study attempted to identify the spatial location of problematic project cases but does not comment anything about its causes, which needs a detailed ground study. These challenges may be reduced in future studies.
MGNREGS's role in building ecosystems resilient to the climate crisis is being increasingly recognized. Given climate change will increase the incidence of weather shocks, there is a need to build robust adaptation programs. The government needs to look at MGNREGA afresh with dual objectives of providing income support while creating ecological assets that become the mainstay of climate support in the decades to come. The majority of the activities under MGNREGA, such as digging wells, farm ponds, construction of farm bunds, community wells, community ponds, renovation of old water bodies, plantation, and watershed treatment, are considered as a measure of climate change adaptation and mitigation. It is well known that water storage and its management is one of the major measures for adapting to climate change. Considering the importance of water infrastructure and the amount of resources put in for bolstering water sufficiency and management, it is equally important to also have a monitoring and evaluation system in place to assess the impacts of the projects. The RSEI index-based model enables the data-driven monitoring of impacts and also helps to identify the underperforming areas where corrective measures can be taken. In this way, RSEI index-based monitoring of water infrastructure contributes to the goal of climate change adaptation.
Data availability statement
The original contributions presented in the study are included in the article/supplementary material, further inquiries can be directed to the corresponding author.
Author contributions
PC initiated the idea, identified the data and process, while SN performed the analysis. Both authors contributed to the article and approved the submitted version.
Conflict of interest
The authors declare that the research was conducted in the absence of any commercial or financial relationships that could be construed as a potential conflict of interest.
Publisher's note
All claims expressed in this article are solely those of the authors and do not necessarily represent those of their affiliated organizations, or those of the publisher, the editors and the reviewers. Any product that may be evaluated in this article, or claim that may be made by its manufacturer, is not guaranteed or endorsed by the publisher.
References
Amani, M., Salehi, B., Mahdavi, S., Masjedi, A., and Dehnavi, S. (2017). Temperature vegetation soil moisture dryness index (TVMDI). Remote Sens. Environ. 197, 1–14. doi: 10.1016/j.rse.2017.05.026
Carlson, T. N., Perry, E. M., and Schmugge, T. J. (1990). Remote estimation of soil moisture availability and fractional vegetation cover for agricultural fields. Agric. For. Meteorol. 52, 45–69.
Ceccato, P., Flasse, S., Tarantola, S., Jacquemoud, S., and Grégoire, J. M. (2001). Detecting vegetation leaf water content using reflectance in the optical domain. Remote Sens. Environ. 77, 22–33. doi: 10.1016/S0034-4257(01)00191-2
Chakraborty, B., and Das, S. (2014). MGNREGA and water management: sustainability issues of built forms in Rural India. J. Const. Dev. Count. 19, 33. Available online at: http://hdl.handle.net/10419/188016
Chinnasamy, P., and Parikh, A. (2021). Remote sensing-based assessment of Coastal Regulation Zones in India: A case study of Mumbai, India. Environ. Develop. Sustain. 23, 7931–7950. doi: 10.1007/s10668-020-00955-z
Chinnasamy, P., Shah, Z., and Shahid, S. (2022). Impact of lockdown on air quality during COVID-19 pandemic: A case study of India. J. Indian Soc. Remot. Sens. 1–18.
Chinnasamy, P., and Sood, A. (2020). Estimation of sediment load for Himalayan Rivers: Case study of Kaligandaki in Nepal. J. Earth Syst. Sci. 129, 1–18. doi: 10.1007/s12040-020-01437-6
Comptroller and Auditor General of India (2020). Report of Comptroller and Auditor General of India on General and Social Sector and Public Sector Undertakings for the Year Ended 31 March 2019. Maharashtra: Comptroller and Auditor General, Government of Maharashtra, 9–18.
Coutts, A. M., Harris, R. J., Phan, T., Livesley, S. J., Williams, N. S., and Tapper, N. J. (2016). Thermal infrared remote sensing of urban heat: Hotspots, vegetation, and an assessment of techniques for use in urban planning. Remote Sens. Environ. 186, 637–651. doi: 10.1016/j.rse.2016.09.007
Department of Land Resources (2018). Forty Ninth Report of Standing Committee on Rural Development for Watershed Development Component of Pradhan Mantri Krishi Sinchayee Yojana. New Delhi: Ministry of Rural Development, Government of India, 3–11.
Feng, H., Chen, C., Dong, H., Wang, J., and Meng, Q. (2013). Modified shortwave infrared perpendicular water stress index: a farmland water stress monitoring method. J. Appl. Meteorol. Climatol. 52, 2024–2032. doi: 10.1175/JAMC-D-12-0164.1
Gao, B. C. (1996). NDWI: a normalized difference water index for remote sensing of vegetation liquid water from space. Remote Sens. Environ. 58, 257–266.
Ghulam, A., Qin, Q., Teyip, T., and Li, Z. L. (2007). Modified perpendicular drought index (MPDI): a real-time drought monitoring method. ISPRS J. Photogram. Remote Sens. 62, 150–164. doi: 10.1016/j.isprsjprs.2007.03.002
Gu, Y., Brown, J. F., Verdin, J. P., and Wardlow, B. (2007). A 5-year analysis of MODIS NDVI and NDWI for grassland drought assessment over the central Great Plains of the United States. Geophys. Res. Lett. 34, 1–6. doi: 10.1029/2006GL029127
Haboudane, D., Miller, J. R., Pattey, E., Zarco-Tejada, P. J., and Strachan, I. B. (2004). Hyper-spectral vegetation indices and novel algorithms for predicting green LAI of crop canopies: modeling and validation in the context of precision agriculture. Remote Sens. Environ. 90, 337–352. doi: 10.1016/j.rse.2003.12.013
Hughey, K. F., Cullen, R., Kerr, G. N., and Cook, A. J. (2004). Application of the pressure–state–response framework to perceptions reporting of the state of the New Zealand environment. J. Environ. Manag. 70, 85–93. doi: 10.1016/j.jenvman.2003.09.020
ICAR-National Bureau of Soil Survey and Land Use Planning. (2020). ICAR- NBSS&LUP Annual Report 2020. Available online at: https://nbsslup.icar.gov.in/wp-content/uploads/2021/10/Annual_Report/NBSSLUP_AR2020.pdf
Liu, J., Pattey, E., and Jégo, G. (2012). Assessment of vegetation indices for regional crop green LAI estimation from Landsat images over multiple growing seasons. Remote Sens. Environ. 123, 347–358. doi: 10.1016/j.rse.2012.04.002
Lonare, A., Maheswhwari, B., and Chinnasamy, P. (2022). Village level identification of sugarcane in Sangali, Maharashtra using open source data. J. Agrometeorol. 24, 249–254. doi: 10.54386/jam.v24i3.1688
Lu, L., Kuenzer, C., Wang, C., Guo, H., and Li, Q. (2015). Evaluation of three MODIS-derived vegetation index time series for dryland vegetation dynamics monitoring. Remote Sens. 7, 7597–7614. doi: 10.3390/rs70607597
McCord, A., and Paul, M. H. (2019). An introduction to MGNREGA innovations and their potential for India-Africa linkages on public employment programming. Gesellschaft für Internationale Zusammenarbeit 2019, 1–65.
Mishra, N. B., Crews, K. A., Neeti, N., Meyer, T., and Young, K. R. (2015). MODIS derived vegetation greenness trends in African savanna: deconstructing and localizing the role of changing moisture availability, fire regime and anthropogenic impact. Remote Sens. Environ. 169, 192–204. doi: 10.1016/j.rse.2015.08.008
National Sample Survey Office (2015). Sampling Design for Socio Economic Survey. New Delhi: Ministry of Statistics and Programme Implementation, Government of India, 1–63.
Ranaware, K., Das, U., Kulkarni, A., and Narayanan, S. (2015). MGNREGA works and their impacts. Econ. Polit. Weekly 50, 53–61.
Reddy, G. T., Reddy, M. P. K., Lakshmanna, K., Kaluri, R., Rajput, D. S., Srivastava, G., et al. (2020). Analysis of dimensionality reduction techniques on big data. IEEE Access 8, 54776–54788. doi: 10.1109/ACCESS.2020.2980942
Rondeaux, G., Steven, M., and Baret, F. (1996). Optimization of soil-adjusted vegetation indices. Remote Sens. Environ. 55, 95–107.
Rouse, J. W., Haas, R. H., Schell, J. A., and Deering, D. W. (1974). “Monitoring vegetation systems in the great plains with ERTS proceeding,” in Third Earth Reserves Technology-Satellite Symposium, Greenbelt: NASA. Washington, DC: NASA, SP-351, 30103017.
Singh, N., Nalgire, S. M., Gupta, M., and Chinnasamy, P. (2022). Potential of open source remote sensing data for improved spatiotemporal monitoring of inland water quality in India: Case study of Gujarat. Photogram. Eng. Remot. Sens. 88, 155–163. doi: 10.14358/PERS.21-00044R2
Wang, L., and Qu, J. J. (2007). NMDI: a normalized multi-band drought index for monitoring soil and vegetation moisture with satellite remote sensing. Geophys. Res. Lett. 34, 1–5. doi: 10.1029/2007GL031021
Xu, H., Wang, Y., Guan, H., Shi, T., and Hu, X. (2019). Detecting ecological changes with a remote sensing based ecological index (RSEI) produced time series and change vector analysis. Remote Sens. 11, 2345. doi: 10.3390/rs11202345
Keywords: integrated watershed management programme, sustainable water resources management, climate change impact, monitoring and evaluation (M&E), natural resource management (NRM), remote sensing based ecological index (RSEI)
Citation: Nalgire S and Chinnasamy P (2022) Index-based impact monitoring of water infrastructures in climate change mitigation projects: A case study of MGNREGA-IWMP projects in Maharashtra. Front. Water 4:956161. doi: 10.3389/frwa.2022.956161
Received: 30 May 2022; Accepted: 25 November 2022;
Published: 22 December 2022.
Edited by:
Ibrahim N. Mohammed, National Aeronautics and Space Administration (NASA), United StatesReviewed by:
Lance W. Vail, Independent Researcher, Richland, WA, United StatesSuhas P. Wani, International Crops Research Institute for the Semi-Arid Tropics (ICRISAT), India
Copyright © 2022 Nalgire and Chinnasamy. This is an open-access article distributed under the terms of the Creative Commons Attribution License (CC BY). The use, distribution or reproduction in other forums is permitted, provided the original author(s) and the copyright owner(s) are credited and that the original publication in this journal is cited, in accordance with accepted academic practice. No use, distribution or reproduction is permitted which does not comply with these terms.
*Correspondence: Pennan Chinnasamy,  cC5jaGlubmFzYW15QGlpdGIuYWMuaW4=
†These authors have contributed equally to this work