 Celio Bermann
 Sonia Maria Gaspar Lontro Hermsdorff
- Institute of Energy and Environment, University of São Paulo, São Paulo, Brazil
This study analyzes whether the low rate of universalizing water supply and sanitation services in Brazil is related to the low participation of private companies in the concession of these services in municipalities in the country. To this end, it discusses basic sanitation in Brazil and its current scenario, its problems from the point of view of environmental injustice, and the existing public/private conflicts. The empirical analysis conducted a data survey of eight municipalities defined in four population groups, comparing data from 13 operational, efficiency, quality, and cost indicators of the services provided. Each population group compared two municipalities providing water and sewerage services, one provided by a public company and the other by a private company. The compared data were from 2021, obtained through the Brazilian National Sanitation Information System (SNIS). As a result of the comparative analyses, it was shown that the performance of public companies was more positive for most indicators, compared to private companies. It is concluded that the main challenge to overcome the social and environmental injustice resulting from the deficit in basic sanitation coverage lies in the promotion of public management instruments that enable the articulation of public and private investments in the expansion of basic sanitation services, in the improvement of the quality of services with the inclusion of social control through popular participation.
1 Introduction
Resolution 64/292, adopted by the United Nations General Assembly on 28 July 2010, recognizes the right to safe and clean drinking water and sanitation as a human right that is essential for the full enjoyment of life and all human rights and calls upon States and international organizations to provide financial resources, capacity-building and technology transfer, through international assistance and cooperation, in particular to developing countries, to scale up efforts to provide safe, clean, accessible and affordable drinking water and sanitation for all. Therefore, access to drinking water and sanitation is a human right.
The debate surrounding the role of public and private companies in guaranteeing water supply and sanitation services is an international one.
Heller (2020), United Nations special rapporteur on the human rights to safe drinking water and sanitation, makes an essential contribution by analyzing the risks of the privatization process of the sanitation sector on an international scale for the human rights to water and sanitation established by Resolution 64/292. For him, it is of fundamental importance to distinguish that “water should be treated as a social and cultural good, and not primarily as an economic good,” citing paragraph 11 of the committee's general comment, referring to both public and private providers.
However, since Great Britain became the first and only country to sell off its entire water industry in the 1980's, the neo-liberal wave of that time began to direct the debate on the difficulties faced by public companies in efficiently meeting the goal of universal access to sanitation services for the entire population.
In this direction, the World Bank published a paper in 1993 indicating that:
“The privatization of public water service agencies or their transformation into financially autonomous entities and the use of management contracts for service delivery will be encouraged. These steps will improve incentives for recovering costs and providing better services and will give users a sense of ownership and participation.” (Easter et al., 1993, p. 73)
It is worth remembering that this World Bank position was extended to other sectors, such as the Electric Power Sector, to ensure the return of loans from international banks endorsed by the World Bank for infrastructure investments that governments could no longer pay (Foster and Rana, 2020).
The IFC-International Finance Corporation, a member of the World Bank Group, has long been the world's largest funder of global water projects, providing advice for governments and loans for companies to take over and invest in under-resourced water and sanitation systems in developing countries, often as part of a broader set of privatization policies.
According to IFC figures, in 2014 about 768 million people still lacked access to clean drinking water, 2.5 billion people were without safe sanitation, and roughly 3.5 million died annually from water-related diseases. From 1993 to 2013, 847 water privatization projects were completed by IFC, nearly half of which were in Latin America (The Guardian, 2015).
The right to access to water was given a notable boost in 2015 with the definition by the United Nations of Sustainable Development Goal number 6 (or SDG 6): “Ensure availability and sustainable management of water and sanitation for all.” The main targets are to provide safe and affordable drinking water, end open defecation and access sanitation and hygiene, improve water quality, wastewater treatment, and safe reuse, increase water-use efficiency and ensure freshwater supplies, implement an Integrated Water Resources Management (IWRM) and protect and restore water-related ecosystems. All these targets are part of the 2030 Agenda.
A report by the Transnational Institute et al. (2013) suggests that 180 cities and communities in 35 countries, including Buenos Aires, Johannesburg, Paris, Accra, Berlin, La Paz, Maputo, and Kuala Lumpur, have all “re-municipalized” their water systems in the past decade. More than 100 of the “returnees” were in the US and France, 14 in Africa, and 12 in Latin America. Those in developing countries tended to be bigger cities than those in wealthier countries (Transnational Institute et al., 2013).
More recently, the privatization of water and sanitation services in Great Britain that began in 1989, has been severely criticized. According to the newspaper The Guardian (2023), the British politician Keir Starmer accused the government of “turning Britain's waterways into an open sewer,” as data showed raw discharges were sent into English rivers 825 times a day in 2022. Private water companies have been consistently accused of failing to take action, and the Environment Agency admitted there were more than 384,000 spillages into rivers and coastal areas in 2022. Moreover, according to the National Audit Office, water bills have increased 40% above inflation since 1989.
Furthermore, campaigners highlighted that despite the failure to stop sewage spills, water companies continued to pay out vast sums to shareholders. At the same time, the Guardian revealed that England's privatized water firms had paid £57 billion in dividends since 1991 (The Guardian, 2023).1
For its part. in Brazil the privatization process of companies that provide water supply and sewage services, inspired by the neoliberal wave of the 1990's, has yet to reach the expected goals.
With a population of 212.65 million inhabitants (IBGE, 2022) occupying an area of 8.510 million km2, 177.0 million inhabitants, or 84.2% of the Brazilian population, were served by a water network, while only 117.3 million inhabitants, or 55.8% of the total population, was served by a sewage network (SINS, 2022).
The source of this data is the National Sanitation Information System (SNIS), linked to the National Sanitation Secretariat of the Ministry of Regional Development (SNS/MDR) of Brazil, which annually collects information about the water supply and sewage services in the country.
The central question of this study is to evaluate if the low rate of universalization of water supply services (84.2%) and, mainly, the even lower rate of universalization of sanitary sewage services (55.8%) are consequences of the low participation of private companies in the provision of these services in Brazil.
With this objective, this study considered the information available by SNIS on providing public water supply and sanitary sewage services in 5,335 municipalities (95.8% of the 5,570 in the country).
2 Methodology
For a comparative evaluation between public and private companies in the provision of basic sanitation services, the criterion adopted was to consider in the universe of Brazilian municipalities the scale in terms of population to enable a comparative evaluation of performance from the same (or close to the same) population size.
In this sense, four groups were defined:
A: Total Municipality Population up to 20,000 inhabitants.
B: Total Municipality Population up to 200,000 inhabitants.
C: Total Municipality Population up to 700,000 inhabitants.
D: Total Population of the Municipality with more than 2 million inhabitants.
For each of the four groups, two municipalities were identified, the first with a public legal-administrative nature and the second with a private legal-administrative nature. As a criterion for determining the municipalities to be compared, only those where the company provided water supply and sewage services were considered. We also thought only the cities that presented data for all the defined indicators since several service providers did not send data to the SNIS, therefore not allowing comparisons. This way, the sample of eight municipalities enables the comparison of the performance of the set of information made available by the SNIS.
From the point of view of the legal-administrative nature of the service companies, they can be classified as private, with a majority or a totally private capital and managed by private individuals; and public, comprising the following forms: (i) Direct Administration, as a municipal government body (secretariats, departments); (ii) Autarchy,2 with administrative autonomy and its own patrimony, and under municipal or state control. For this study, the following were also considered as public: (iii) Mixed Economy Corporations, with public and private capital, and public management or with minority participation of private partners; and (iv) Public Company, formed by one or several entities with exclusively public capital.
Still, the information survey considers as Social Organization only four non-profit civil entities with delegation to manage services, whose number is hugely reduced.
About mixed economy corporations, although their objective is to indemnify their shareholders, the minority participation of private partners and the management still maintained under public control allows us to consider these companies as public.
Table 1 presents the defined Municipalities, the States, the identification of the company providing basic sanitation services, its legal nature, the municipality's total population, and the HDI-Human Development Index of each municipality for 2010.
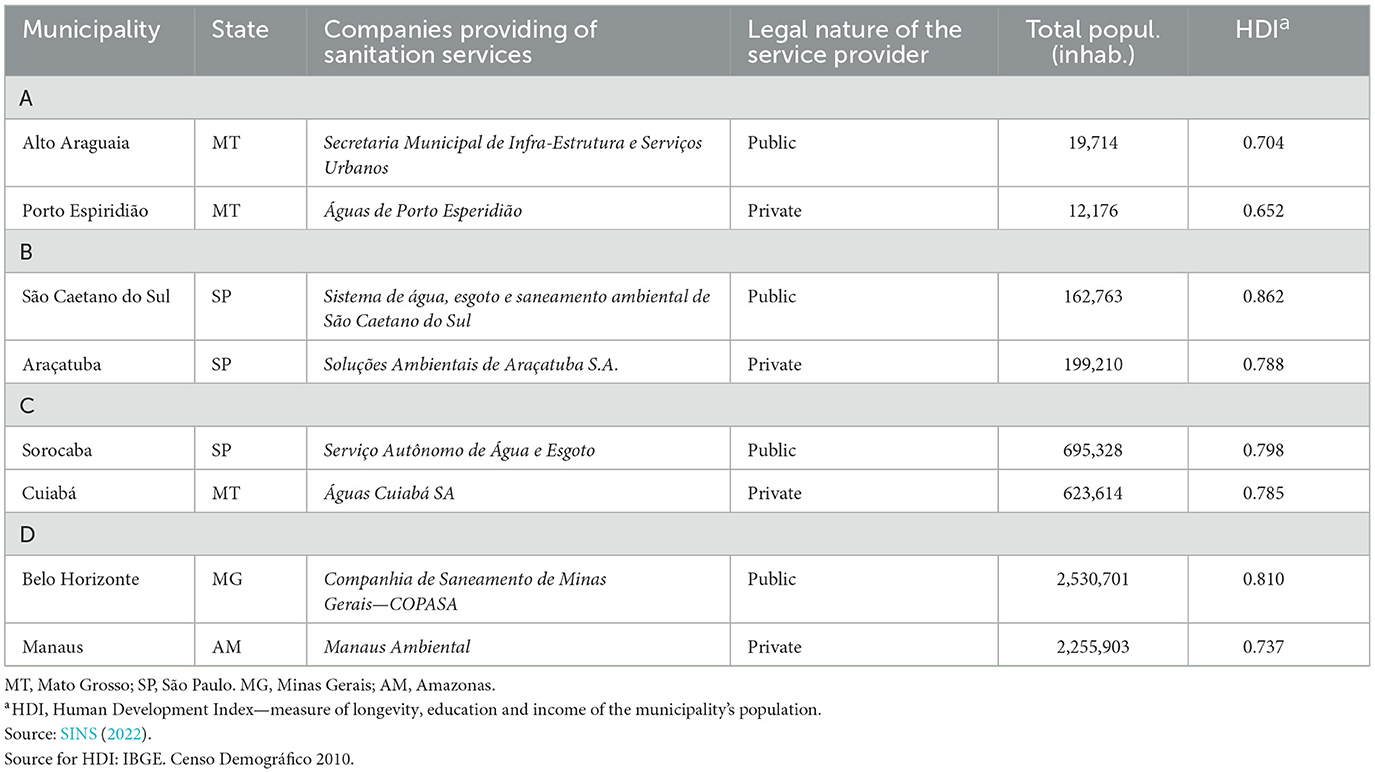
Table 1. Information about the municipalities of the sample.
The indicators chosen to compare the services of each company followed those defined in the National Sanitation Information System (SNIS), managed by the National Sanitation Secretariat of the Ministry of Regional Development (SNS/MDR), an instrument of knowledge on basic sanitation services and which provides a robust set of structured data to assess the evolution of water supply and sewage services in the country. The sample data were from 2021, except the HDI whose data was for 2010.
The indicators used to benchmark the performance of public and private companies were organized according to the nature of the evaluation: (i) operational evaluation of services; (ii) evaluation of service efficiency; (iii) evaluation of service quality; and (iv) evaluation of service costs.
3 On the subject of sanitation and environmental (in)justice
Debates about equality and, by extension, inequality and justice present a paradox; everyone wants to combat the problems to which they devote their analyses, but few can agree on how to do so, what the universal public policies should be to produce a reduction in injustices, and what the metrics are to assess or even measure increased justice.
Environmental justice is a historical movement that became prominent in the United States in the 1980's, and is a conceptual framework for analyzing environmental problems (Herbert, 2020). Its central ethical premise is that the burdens and benefits of social life concerning the environment should be fairly distributed. However, empirical evidence shows that this ideal still needs to be realized. Unfortunately, those who already suffer from discrimination and injustice in society (for example, the poor and social and racial minority groups) tend also to bear the burden of environmental risks and disadvantages, living and working in dangerous and polluted environments.
These points have also been highlighted in the Brazilian debate on environmental justice (Amaral et al., 2021). Evans and Pelhan (2016) have rescued the analytical axis that allows making the connection between environmental justice and just transitions. Environmental justice is an approach that focuses on procedural and distributive justice, does not oppose development as such, and neither on the “not in my backyard” (also called Nimby) logic, where communities advocate moving dangerous industries from one locality to another.
The discussion on environmental justice originates primarily within social movements. However, even in the early years of debates promoted by the political movement and research on environmental justice, damage to the environment was conceived in relatively narrow ways regarding the inequalities reflected among different social groups (Herbert, 2020).
According to Acselrad (2010), the notion of environmental justice has been materializing in the recent Brazilian experience from the constitution of collective subjects that demand broad access to relevant information on the use of environmental resources and autonomous resources and autonomous capacity to decide on their territories, aiming to establish fair and equitable to establish fair and equitable access to the country's environmental resources.
This perception is more evident in contexts of social inequality where situations of vulnerability manifest themselves. For Porto (2011), the environmental justice movement seeks, at its core, to integrate the environmental dimension with those of law and democracy through transformative actions. It has been developing in the last two to three decades from decades based on the struggle against discriminatory dynamics that place certain population groups on the shoulders of specific population groups, the evils of economic and industrial development.
The consequences of the absence of sanitation services for public health and the quality of life of populations living in cities, rural areas, and regions should be considered environmental injustice as such a situation does not respect Resolution 64/292, which recognizes the right to safe and clean drinking water and sanitation as a human right. The privatization of basic sanitation in Brazil has generated debate about the possible impacts on the population and the environment. Advocates of this policy argue that private sector participation can contribute to the expansion of services and the improvement of quality, through investments in infrastructure and the adoption of more advanced technologies.
In this study, it is worth questioning the capacity of private companies to meet the needs of the most vulnerable population and to guarantee universal access to services. In addition, one must emphasize the concerns regarding environmental sustainability since market logic can lead to predatory exploitation of natural resources and environmental degradation.
One caveat needs to be raised in the context of the present study. Social inequalities and vulnerabilities are masked when the database used is that of municipalities. This analytical weakness can only be overcome with case studies where the vulnerabilities are hidden when the scale of analysis is the municipality presented. Many case studies, such as those developed by Arruda and Heller (2022), and by Narzetty and Marques (2022), go in this direction and highlight the aspects related to social and environmental (in)justice present in these contexts. These studies show how the water injustice in low-income communities that live on the urban periphery is revealed by the deficiencies or even the absence of basic sanitation—access to drinking water and sewage treatment.
In turn, this research is restricted to the comparative analysis of the performance between public and private companies in providing water supply and sanitation services without the necessary income cut-off to enable a more in-depth analysis from the point of view of water (in)justice.
4 The Brazilian sanitation sector and the public/private conflict
The sanitation sector structure in Brazil got its current shape in 1971 when the federal government launched the PLANASA (National Sanitation Plan), which centralized the policy of the sector, proposing the creation of state sanitation companies (CESBs). PLANASA was instituted during the dictatorial military regime in Brazil.
Among the companies created under PLANASA is Sabesp (the company of the state of São Paulo, created in 1973). According to PLANASA, the municipalities, in order to receive federal investments, would have to delegate the provision of water and sewage services. The adhesion of the municipalities to the plan reached 75% than, although several municipal services continued to operate.
Analyzing the consequences of PLANASA, Becker and Egler (1994, p. 170) comment:
“The authoritarian regime tried to massify social policies, thus degrading the quality of services. This view is supported by PLANASA, since this policy injected resources into CESBs in a careless way regarding the way sanitation projects would be implemented. Thus, water supply was massified, while sanitation remained practically stagnant. More than that, the projects and works carried out under the PLANASA privileged richer areas, exacerbating inequalities and depreciating the services.”
As previously indicated, the privatization process of companies providing water supply and sanitary sewage services did not reach the expected objectives.
The implementation of a comprehensive privatization process in Brazil, which began with the transfer to the private sector of the government's control of the steel sector, expanded with the government's withdrawal from the petrochemical sector, and became concrete through the process of transferring public services to the private sector, was originated in Law no. 8.031/1990, which instituted the National Destatization3 Program—PND, and defined the BNDES—National Bank for Economic and Social Development as its manager.
The objective of the PND, explicitly stated in Article 1, was “the reordering of the State's strategic position in the economy, transferring to private enterprise activities unduly explored by the public sector.” According to the text of this law, privatization was considered to be:
a) The sale, by the Union (Federal Government), of rights that assure it, directly or through other controlled companies, preponderance in the company's deliberations, the power to elect the majority of the company's managers;
b) The transfer to the private initiative the execution of public services explored by the Union, directly or through controlled entities, as well as those of its responsibility;
c) The transfer or granting of rights over movable and immovable Federal Government property (BRASIL, 1997).
Privatization was based on the belief in greater efficiency of the private sector in managing these activities, the need to reduce public debt, and the public sector's incapacity to invest. Regarding the Brazilian sanitation public sector, Parlatore (2000, p. 290–291) pointed out the main problems:
- “priority to water production, to the detriment of optimization of distribution, which is explained by the historical perspective of executing works to provide satisfactory services, giving preference to the expansion of production instead of reducing losses and rationalizing consumption;
- deficient performance in the commercial area, mainly due to lack of an adequate registration of users and installations, consumption measurement, adequate tariff policies and structures, and practical rules for cutting off service for non-payment, generating billing, and collection losses;
- deficient user service, with delays or lack of response to service requests, and difficulties in communication, especially concerning the clarification of the difficulties in communication, especially for clarification of the tariff policy;
- excessive increase in the number of staff due to the political use of the organization;
- delays in opportunities for managerial and technological modernization, contributing to the increase in operational costs;
- administrative discontinuity associated with non-professional management; and
- poor supply of sewage networks and treatment systems, generating problems for public health and pollution of water resources (Parlatore, 2000, the text was translated by the authors. Consider that the referenced text was written in Portuguese).”
Within this political frame, Federal Law no. 8.987/1995 was a law of concessions of public services in general, opened opportunities for municipalities not operated by the state companies to privatize the supply of sanitation, including to foreign companies.
Despite the criticism and the efforts of the Brazilian government of that time to push forward the process of privatization of sanitation services, the result was that by the end of the 1990's, only 32 Brazilian municipalities had their water supply or sewage services, or both, transferred to the private sector.
Subsequently, Law no. 11.445/2007 established the national guidelines for basic sanitation in Brazil, defining the principles and objectives of the sector. In Article 11, general goals were established for universal access, quality, and regularity of services, but without establishing deadlines for their achievement.
More recently, Law no. 14.026/2020, also called the New Framework for Basic Sanitation, promoted a series of changes such as the obligation of a bidding process for the contracting of sanitation services, the obligation of the winning company to prove its investment capacity, the regionalization of the provision of services, and the definition of ANA-National Water and Basic Sanitation Agency with the new competence to institute reference standards for the regulation of public basic sanitation services, in a way to concentrate at the federal level a competence previously spread among states and municipalities. In particular, this restriction imposed on municipal autonomy for the managing and providing sanitation services disregards the fact that sanitation services comprise attributions inherent to local interests.
With these changes, the new law was presented as a way to guarantee the legal security necessary to attract private investment in the sector.
It should be noted that during the pandemic of the new coronavirus, starting in 2020, the debate about basic sanitation gained shape and more space in the public arenas due to the importance of constant hygiene to control contamination and also the relevance of social isolation in places without adequate sanitation. In this context, with broad public support, Law 14.026/2020 was approved, the new legal framework for basic sanitation.
Furthermore, Article 11-B of the new regulatory framework established that contracts for the provision of public basic sanitation services must define universalization goals that guarantee that 99% (ninety-nine percent) of the population is served with drinking water and 90% (ninety percent) of the population is served with sewage collection and treatment by December 31, 2033, as well as quantitative goals for non-intermittent supply, reduction of losses and improvement of treatment processes.
In this context, among the 5,570 Brazilian municipalities, only 118 had private companies providing these public services in 2021. This study analyzes the sanitation services based on the sanitation situation in Brazil in 2021. It discusses whether this absence of private companies in the provision of these services would explain the environmental injustice existing in Brazil, arising from the fact that 15.8% of its population does not have access to water supply (about 35.65 million inhabitants) and 44.2% of its population does not have access to sanitary sewage (about 95.35 million inhabitants)?
5 Current panorama of sanitation in Brazil
The National Sanitation Information System (SNIS) gathers information on 1,342 water supply service providers and 3,347 sewage service providers, systematized at the national, macro-regional, state, and municipal levels.
Among the 1,342 companies providing water supply services, only 131 (9.7%) are private companies, while 711 (53.5%) are city council bodies, and 463 (34.5%) are municipalities. Concerning the 3,347 companies providing sewage services, only 124 (3.7%) are private companies, while 2,725 (67.9%) are city government agencies, and 459 (13.7%) are municipalities.
Of the total sewage generated, SNIS shows that only 51.2% is treated, and of the sewage collected (6,046.8 million m3), 80.8% is treated (4,862.5 million m3).
5.1 Macroregional evaluation of sanitation in Brazil
To analyze the panorama of water supply and sanitation in Brazil, it is important to consider the scenario in which the country is divided into macroregions: North, Northeast, Southeast, South, and Center-West. Figure 1 presents the map of Brazil with its five macro-regions.
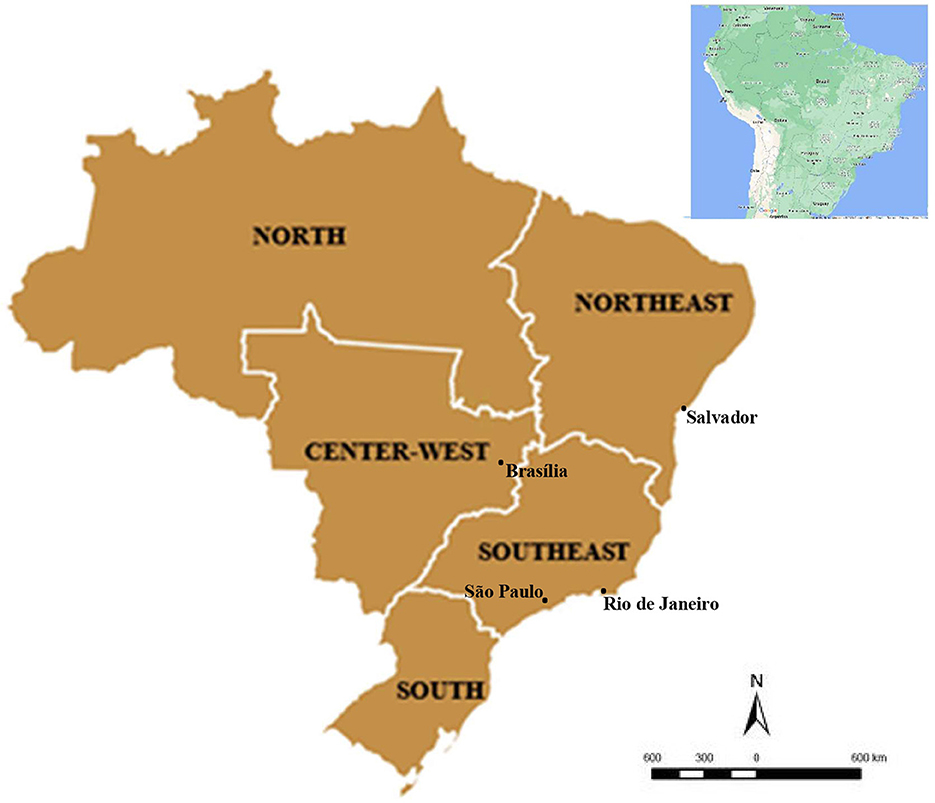
Figure 1. Macro-regions of Brazil.
Tables 2–5 that follow present the sanitation indicators that reveal the regional inequality in the country.
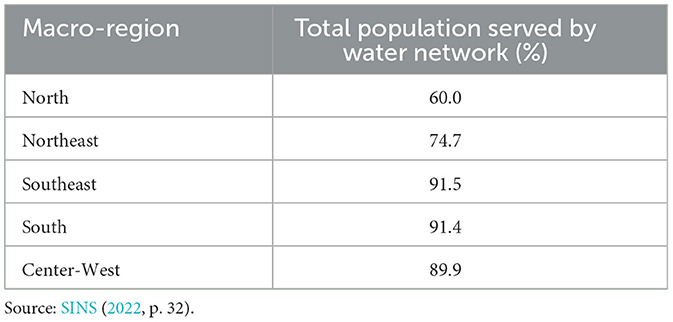
Table 2. Water supply according to the macro-regions of Brazil.
Table 2 shows the total population served by water supply in the Brazilian macro-regions. The highest water supply coverage is observed in the Southeast and South regions and the worst rates in the North and Northeast.
Table 3 shows the index of water distribution losses in the Brazilian macro-regions. It is important to note that water loss means that the provider loses part of the resource along the way, either due to a lack of maintenance and monitoring or to clandestine access to the public supply network. These losses translate into a reduction in revenues and, consequently, in the ability to fund its activities. The highest water distribution loss rate is observed in the North and Northeast regions, despite these regions having the lowest water supply rate, as shown in Table 2.
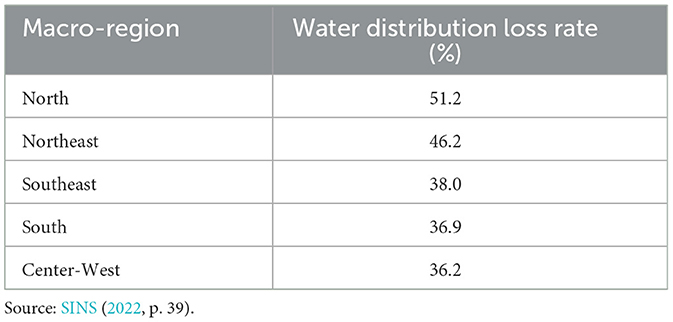
Table 3. Losses in water distribution according to the macro-regions of Brazil.
Table 4 shows the percentage of the population served with a sewage system. Similarly, to the previous indicators, the North and Northeast regions present the lowest sewage system coverage rat. The difference between the region with the lowest rate with sewage system—North, with 14%, and the Southeast, with 81.7%, stands out.
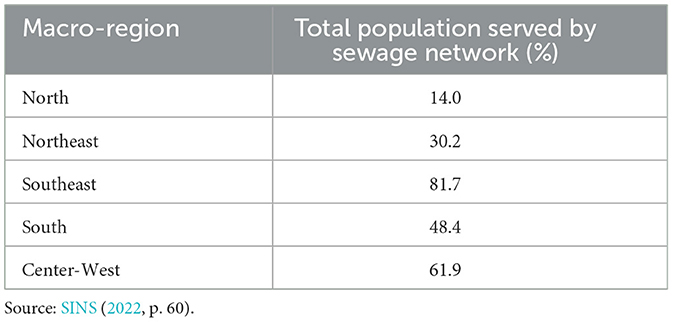
Table 4. Coverage of sanitary sewage services according to the macro-regions of Brazil.
Table 5 shows the treatment index of the sewage generated in the Brazilian macro-regions. The North and Northeast regions have once again the lowest sewage treatment rates, with 20 and 35.5%, respectively.
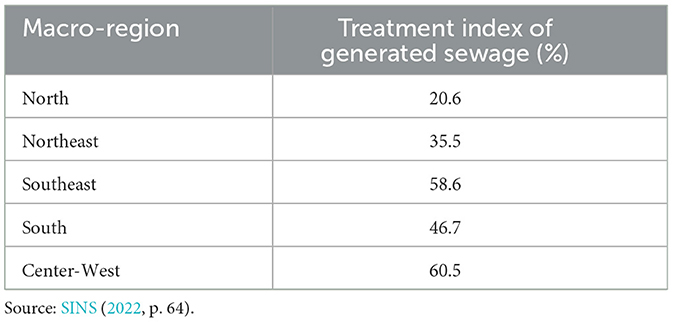
Table 5. Treatment of generated sewage according to the macro-regions of Brazil.
As observed in Tables 2–5, the North region has the lowest percentage of water supply (60%), the most significant loss in distribution (51.2%), the smallest population served by public sewage systems (14%), and the lowest index of sewage generated (20.6%). In second place is the Northeast region, having 74.7% of the population served by a water supply network, 46.2% of distribution losses, 30.2% of the population served by public sewage network, and 35.5% only by the sewage treatment index.
Another important indicator of the public health conditions imposed by the lack of basic sanitation is the Infant Mortality Rate (IMR).
Infant mortality is an essential indicator of a population's health and living conditions. By calculating its rate, it estimates the risk of a live birth dying before 1 year. High values reflect precarious living and health conditions and low social and economic development levels. In Brazil, a decline in the mortality rate in this group has been observed. Despite the reduction in the mortality rate in all regions of the country, intra- and inter-regional inequalities still remain. In 2019, Brazil recorded an Infant Mortality Rate (IMR) of 13.3 per thousand live births (LB); in the North and Northeast Regions they were, respectively, 16.6 and 15.2 per thousand LB, while in the Southeast, South, and Center-West Regions they were, respectively, 11.9, 10.2, and 13.0 per thousand LB (BRASIL. Secretaria de Vigilância em Saúde, 2021).
It is worth noting that in 2021 the expansion of the public supply networks was only 0.9%, with the most significant growth identified in the Southeast (40.5%), the region with the most extensive public network for water (91.5%) and sewage (81.7% of the population). The Northern and Northeastern regions, which are the poorest in coverage, grew 6.2 and 21.5%, respectively, in 2021.
In 2020 the amount of water withdrawn for consumption was on the order of 1,947.55 M3/S. Considering water uses by sector, in Brazil, the most significant water withdrawal is for irrigation (49.5%), followed by urban supply, while the smallest share goes to supplying the rural population (1.7%), as highlighted in Figure 2.
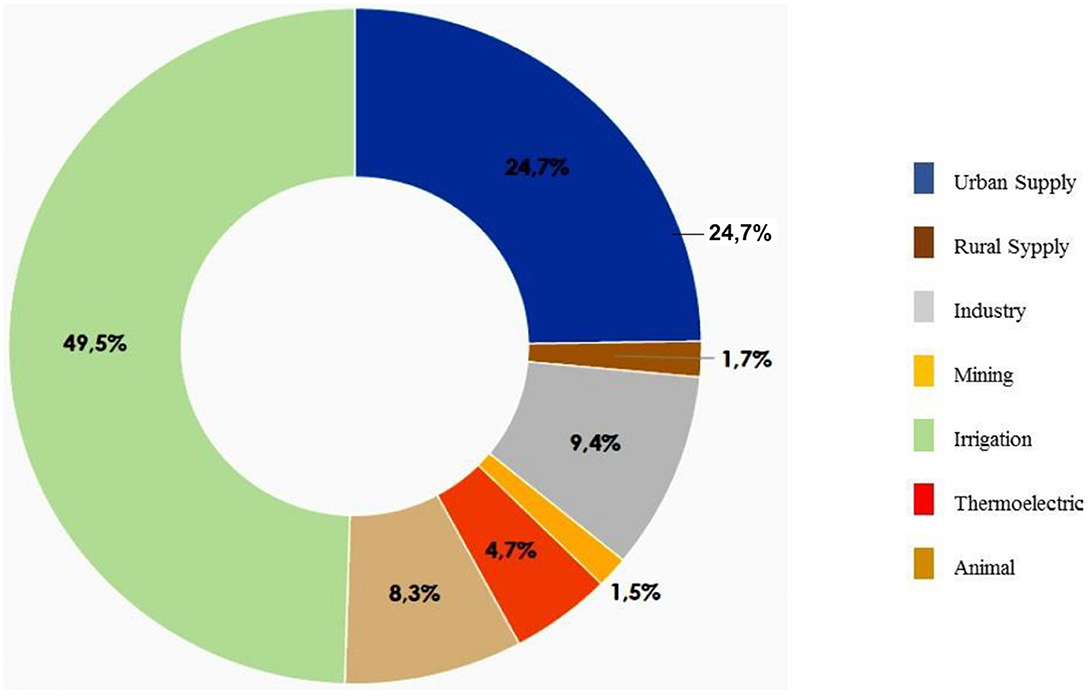
Figure 2. Water withdrawal for sectorial uses.
In order to analyze whether the performance of private sanitation companies in the current context allows a glimpse that the deficiencies verified could be overcome by a broad privatization process of the Brazilian sanitation sector, this study presents a comparative evaluation of the performance presented by public and private companies in the year 2021 from the defined sample of eight municipalities, according to the criteria previously explained.
The indicators used for the comparative evaluation of the performance of public and private companies were organized according to the nature of the evaluation.
1. Operational evaluation of services.
2. Evaluation of the efficiency of services.
3. Evaluation of the quality of services.
4. Evaluation of the costs of services.
6 Results
6.1 Operational evaluation of the services
For the evaluation of the operational indicators of the companies, two indicators were compared.
- Water supply coverage rate (in %), which is defined from the municipality's total population served with water supply, and the municipality's total population according to IBGE.
- Rate of coverage by sewage services (in %), which considers the total population served by sewage services and the municipality's total population, according to IBGE.
The municipality's total population in the reference year is the sum of a municipality's urban and rural populations, municipal headquarters, and localities in the reference year. The estimate performed annually by IBGE is used in the SNIS. It includes both the population served and those not served by the services.
Table 6 presents the values found in the SNIS database for each indicator considered in the evaluation.
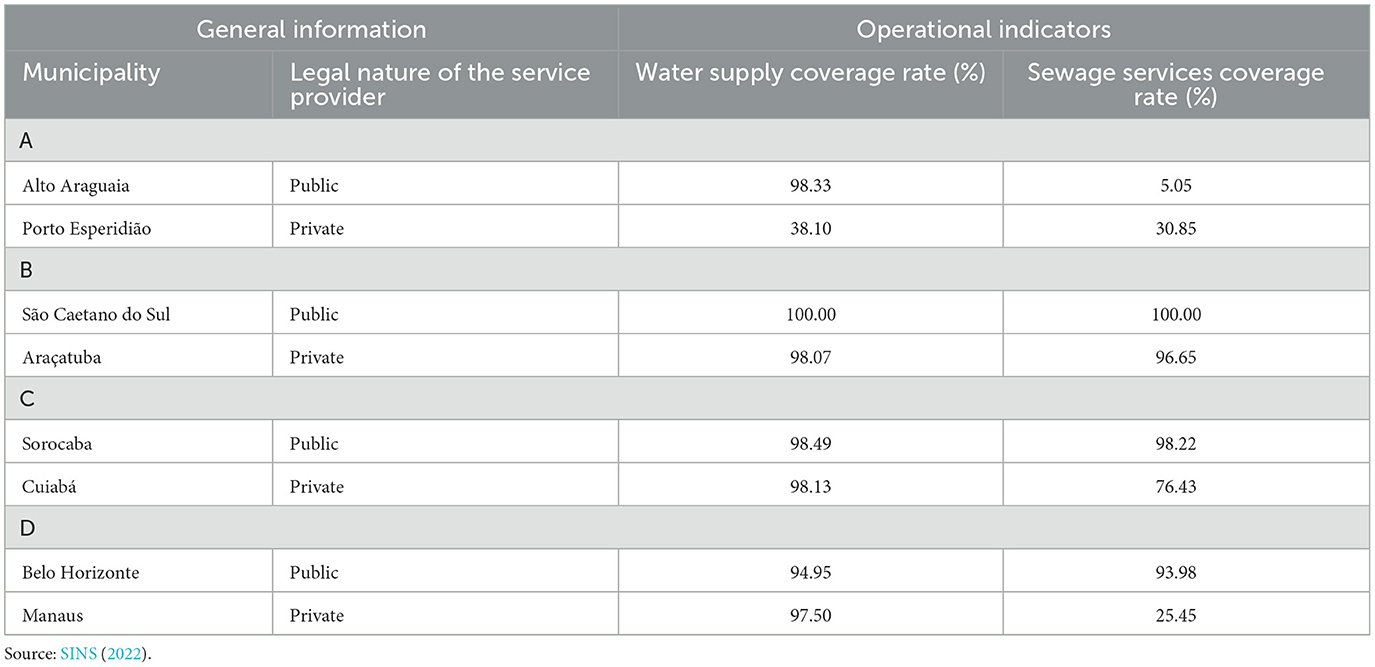
Table 6. Operational evaluation.
In the comparative analysis of the municipalities, in all four groups, the public companies show a better performance in meeting the operational indicator of water supply coverage. Although the rates are very close, we highlight the smaller municipalities where the municipality of Porto Espiridião (private) shows a rate about three times lower than Alto Araguaia (public), while the municipality of Manaus (private) shows a relatively better performance than Belo Horizonte (public).
Concerning the operational indicator of sanitary sewage coverage, the very low coverage rate presented by the municipality of Alto Araguaia (public) stands out. Such performance indicates and confirms the precariousness with which the investment in the sewage service is present in the smaller municipalities because a reduced rate also characterizes the performance of Porto Espiridião (private). However, the same precariousness of investment in sewage services is present in Manaus (private), a municipality with more than 2 million inhabitants.
6.2 Evaluation of the efficiency of services
In evaluating the efficiency of the services, five indicators were defined for analysis, referring to the quantity and duration of stoppages in the Water Distribution System, besides the indices of electric energy consumption in the water and sewage systems and the distribution loss index.
Description of the indicators used:
- Quantity of Outages in the Water Distribution System (Outages/year):
Number of times in the year, including repetitions, when outages occurred in the water distribution system. Only shutdowns that individually had a duration equal to or >6 h should be added up. In the case of a municipality served by more than one system, the stoppages of the various systems should be added up. A shutdown is an interruption in the supply of water to the user by the distribution system, due to problems in any of the units of the supply system, from production to the distribution network, which has caused damage to the regularity of the water supply. It includes, among others, interruptions resulting from repairs and power outages.
- Downtime Duration (Hours/year):
The number of hours in the year in which outages occurred in the water distribution system. Only the shutdown duration equal to or over than 6 h should be added up. In the case of municipalities served by more than one system, the duration of the outages of the various systems must be added together. The durations must correspond to the computed downtime.
- Index of electrical energy consumption in water supply systems (kWh/m3):
Total electrical energy consumption in water systems.
- Index of electric energy consumption in sewage systems (kWh/m3):
Total electrical energy consumption in sewage systems.
- Distribution loss index (%) considers two loss categories:
1- Real or physical loss, when water does not reach the consumer due to leaks in pipelines, branches, reservoirs, and other operational units caused by excess pressure in the sewage system and due to the state of conservation of the pipes.
2- Apparent loss, when the water consumed is not accounted for (charged) due to situations such as clandestine connections (“cats” or gatos in Portuguese) and sub-measurement (lack of calibration in hydrometers); and real loss, when there are leaks in points of the distribution infrastructure.
Table 7 presents the service efficiency data for each municipality and service provider.
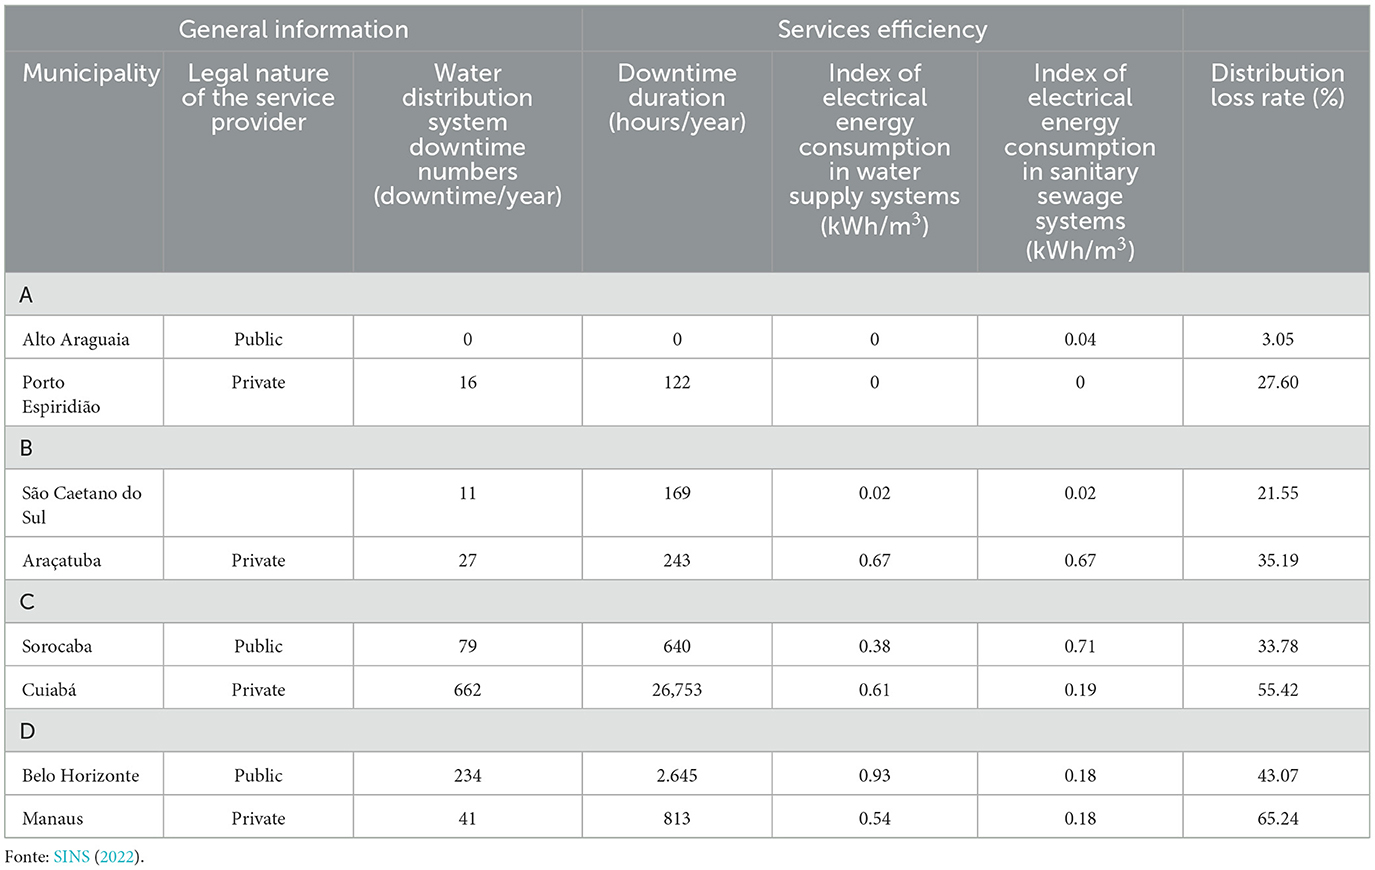
Table 7. Comparison of service efficiency evaluation.
Notably, the municipality of Alto Araguaia showed a (zero) for three indicators, drawing attention specifically to the Index of electricity consumption in water supply systems (kWh/m3), the same happening in this indicator for the municipality of Porto Espiridião.
Evidently, it is not possible to have no interruptions in the water distribution system since all the other municipalities in the survey present numbers and duration of interruptions. Much less of an absence of electricity in the water and sewage systems, as the data appear to indicate.
Although SNIS audits the data, this is a point of attention, that makes us question the reliability of this data.
Also deserves attention is the high number and duration of stoppages in the municipality of Cuiabá, in the provision of water distribution services that are private.
On the other hand, it also draws attention to the high rate of losses in the services provided by private concessionaires since private companies are expected to pay more attention to the maintenance of the systems in order to increase their revenues.
The data show a marked diversity concerning the efficiency indicators for electricity consumption. While for electricity consumption in the water supply systems of municipalities in population groups B and C, public companies are more efficient than private ones, private companies are less efficient in population group D.
As for electricity consumption in the sanitary sewage systems, in population group B the public company is the most efficient, while in population group C the private company is the most efficient. In range D, both have the same efficiency index.
6.3 Evaluation of service quality
The indicators of quantities of samples of residual chlorine, turbidity, and total coliforms with substandard results were assessed to evaluate the quality of services.
Description of the indicators used:
- Quantity of Samples for Residual Chlorine with out-of-standard results:
Total annual quantity of samples collected at the exit(s) of the treatment unit(s) and in the water distribution system (reservoirs and networks), to measure the free residual chlorine content in water, whose analysis result was outside the standard determined by Ordinance 2.914/2011 of the Ministry of Health (Note: According to Art. 34 of the Ordinance, it is mandatory to maintain a minimum of 0.2 mg/L of free residual chlorine or 2 mg/L of combined residual chlorine or 0.2 mg/L of chlorine dioxide throughout the distribution system (reservoir and network). In Art. 39, §2, the maximum free residual chlorine content at any point in the supply system is recommended to be 2 mg/L).
- Quantity of Samples for Turbidity outside the standard:
The total annual amount of samples collected at the outlet(s) of the treatment unit(s) and in the water distribution system (reservoirs and networks), for gauging the turbidity content of the water, whose analysis result was outside the standard determined by Ordinance 2.914/2011 of the Ministry of Health [Note: Annex II of the Ordinance defines for Water Treatment, a Maximum Allowable Value (VMP) for Disinfection (for groundwater) and for Slow Filtration of 1.0 uT in 95% of the samples and for Rapid Filtration (complete treatment or direct filtration), of 0.5 uT in 95% of the samples].
- Quantity of samples for total coliforms with results out of the standard:
The total annual amount of samples collected at the outlet(s) of the treatment unit(s) and in the water distribution network to measure the content of total coliforms, whose analysis result was outside the standard determined by Ordinance 2,914/2011 of the Ministry of Health [Note: Annex I of the Administrative Rule, as mentioned above, defines the microbiological standard for water for human consumption, for total coliforms at the treatment output, the Maximum Allowable Value (MPV) absent in 100 ml, and in the water distribution network, the following standards: Systems or collective alternative solutions that supply < 20,000 inhabitants—Only one sample, among the samples examined in the month, may present a positive result; in Systems or collective alternative solutions that supply more than 20,000 inhabitants—Absence in 100 mL in 95% of the samples examined in the month].
Note: According to Ordinance 2.914/2011, the minimum annual amount of mandatory samples to be collected at the outlet(s) of the treatment unit(s) and in the water distribution system (reservoirs and networks) varies with the number of people supplied and the number of treatment units. In the case of a municipality served by more than one system, the information from the various systems must be added together.
Table 8 presents the results of the service quality assessment.
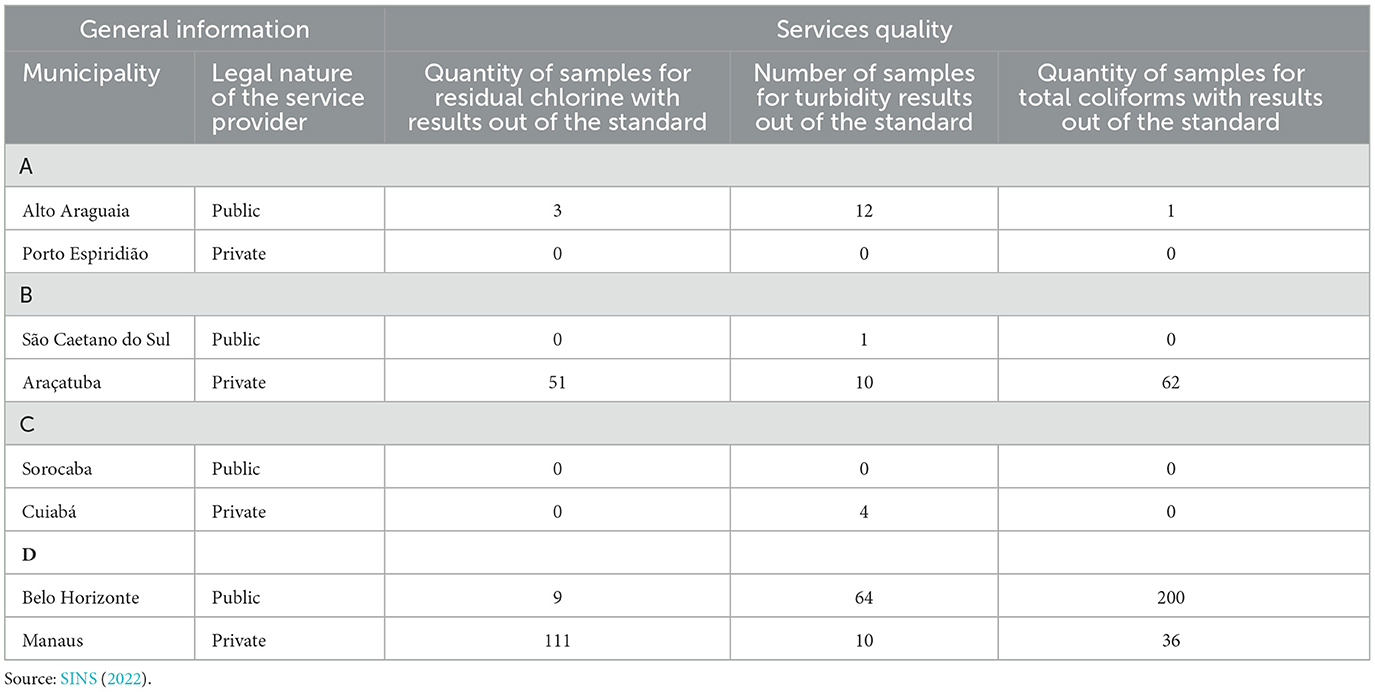
Table 8. Comparison of water quality indicators.
The water quality indicators that should meet legal standards show poor results for both services, with positive results only in Sorocaba and São Caetano do Sul (Public) and Porto Espiridião (Private). The highest non-standard rate was for fecal coliforms in the services provided by the public company in Belo Horizonte, with 200 samples outside the standard.
The water quality indicators that should meet legal standards show worrying results from the public health point of view, with positive results only in Sorocaba and São Caetano do Sul (public) and Porto Espiridião (private). The highest non-standard rate was for total coliforms in the services provided by the public company in Belo Horizonte, with 200 samples out of the standard.
It is worth pointing out the data for the municipality of Sorocaba that did not present any non-conformity. Twenty-two thousand and twenty-four samples were analyzed for residual chlorine out of 15,324 defined as mandatory by legislation, with none of them non-compliant.
As for turbidity, 21,692 samples of the 15,324 defined as mandatory were analyzed, and as for the number of fecal coliforms, 7,558 samples of 6,972 defined as mandatory were analyzed, which attests to the reliability of this information.
6.4 Evaluation of service costs and benefits
The evaluation considered the average water and sewage tariffs. The values in Reais (R$) were transformed into dollars by the Commercial Exchange Rate for Purchase of R$ 5.5799/US dollar (US$)—an average of December 31, 2021.4
It is important to consider that the current regulation defines, based on criteria such as the economic and financial balance of the contracts and tariff moderation, the values of the tariffs for the provision of services. With the update of Law 11,445, the National Water and Basic Sanitation Agency (ANA) now defines the reference standards for regulators and inspection entities. They include quality and efficiency of services, tariff regulation, evaluation of goal achievement, progressive reduction and control of water losses, and reuse of sanitary effluents, among others.
Another essential element for cost analysis is the existence or not of the Social Tariff in the sanitation services provider company. The Social Tariff is a benefit that reduces invoices and enables low-income families to have access to water and adequate disposal of their sewage and could be considered as a way to reduce social and environmental injustices.
Table 9 presents the comparative results of the average water and sewage tariffs and the adherence to social tariff for each municipality considered in this study.
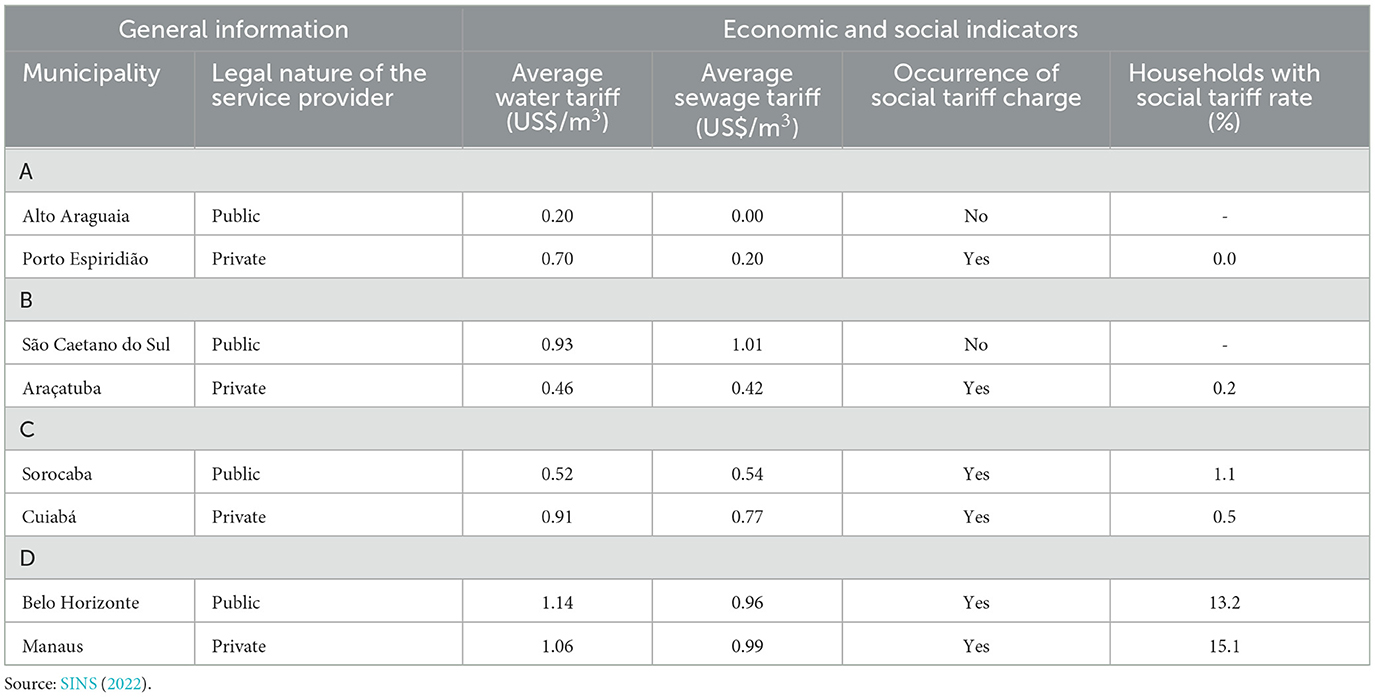
Table 9. Comparison of service costs and adherence to social tariff.
With regard to water supply tariffs, a significant diversification of behavior is observed, with the public companies' tariffs being lowest in the municipalities in population groups A and C, while in population groups B and D, it is the private companies that present the lowest tariffs.
As for sewage tariffs, population ranges C and D present the public companies with the lowest tariffs, while in range B, the private company presents the lowest tariff. It should be noted that the municipality of Alto Araguaia does not charge for the service because it provides sewage for only 5% of its population.
Concerning the Social Tariff benefit, it is noteworthy that the two municipalities with public companies—Alto Araguaia and São Caetano do Sul—do not offer this social benefit.
However, for the municipalities that do offer the social tariff, the share of households benefited is extremely small, even in the most populous range.
This can be explained by the difficulties imposed by the companies for low-income households to access the tariff benefit. For example, Águas de Manaus defines the following pre-conditions: “The user must be simultaneously the holder of the Bolsa Família program at the federal level and must have a hydrometric device that cannot be, under any circumstances, adulterated or violated.
The user must keep up with the bills generated from the framing of the Social Tariff and will lose the benefit after three past due bills, with non-compliance with the obligations to the Concessionaire.5”
It is worth mentioning the municipality of Manaus that has historically had an inefficient sanitation policy, with the supply of water and sewage under state control or controlled by the market. Since 1881, the municipality went through privatizations, later returning to state control because the private concessionaires did not comply with the concession contract, committed abuses, disrespected municipal regulations, and had service deficiencies. In 2000, the municipality again had its sanitation services privatized. Currently, although the SNIS brings the concessionaire the company Manaus Ambiental, since 2018, the concession of water supply services, collection, and treatment of sewage in the capital of Amazonas, passed to Águas de Manaus, which is a company of Aegea Saneamento, the largest private company in the sector in the country.
7 Conclusions
The deficit in basic sanitation coverage harms public health due to water-borne diseases that mainly affect children, the olders, and the environment, with untreated sewage flowing back into rivers and springs. With the absence of inspection, the irregular drainage, usually close to residential urban areas, also contributes to social and environmental injustice growing more vigorously.
The social damage occurs unequally between social classes and regions: poor people and poor municipalities suffer more from the lack of basic sanitation.
The right to safe and clean drinking water and sanitation as a human right is foreseen in international legal regulations, such as Resolution 64/292 of 2010, adopted by the United Nations General Assembly, and by several national regulations, such as the Brazilian Federal Constitution of 1988, which among others foresees as common competence of the Union, States, Federal District, and Municipalities the improvement of housing conditions and basic sanitation.
In this context, the research conducted for the elaboration of this article shows that the policy of expanding the privatization of basic sanitation services in Brazil has not reached the expected goals. In 2021, of the 5,570 Brazilian municipalities, only 118 were operated by private companies. Based on this fact, the article discusses whether this absence of private companies in providing these services would explain the environmental injustice in the country, where 15.8% of the population still did not have access to water supply, and 44.2% did not have access to sewerage.
The study sought to analyze whether private companies could supply the most vulnerable populations with access to the service. The result of the comparative analyses between the performance of public and private companies for four population groups, where the operational performance, efficiency and quality of services were analyzed, besides the cost of services, showed that the performance of public companies was more efficient for most indicators, concerning private companies.
Despite the empirical evidences raised in this article, and examples of the disastrous consequences of the privatization of sanitation services, such as the case of British private companies, in December 2023, the neoliberal politically oriented governor of the state of São Paulo managed to pass a bill in the São Paulo State Assembly of Deputies that allows the privatization of the public company Sabesp.
This mixed economy company serves 375 municipalities in the state of São Paulo, with 30.5 million people served with water supply and 28.3 million people served with sewage systems (SINS, 2022).
The transfer of Sabesp to the private sector has yet to be completed, but future studies on the consequences of this privatization will be very important for the following debate.
In any case, the expansion of the universalization of sanitation services to the most vulnerable populations, both in the less favored regions and in the outskirts of large cities, in order to meet the basic rights of sanitation and health to all, must be increasingly discussed and made possible in the public control of services. For the private control, given the results found, the supervision of the state must be expanded so that the expected results of the privatization are felt when the objective of improving the services and meeting the universalization goals is sought.
Data availability statement
The datasets presented in this study can be found in online repositories. The names of the repository/repositories and accession number(s) can be found at: https://www.gov.br/mdr/pt-br/assuntos/saneamento/snis/produtos-do-snis/diagnosticos/diagnosticos_snis.
Author contributions
CB: conceptualization, methodology, analysis, and writing—original draft preparation. SH: research, data analysis, and writing. All authors have read and agreed to the published version of the manuscript.
Funding
The author(s) declare financial support was received for the research, authorship, and/or publication of this article. This work was supported by FAPESP-São Paulo Research Foundation (Process: 2015/03804-9) and by CAPES-Coordenação de Aperfeiçoamento de Pessoal de Nível Superior, through the PROEx-Programa de Excelência Acadêmica.
Conflict of interest
The authors declare that the research was conducted in the absence of any commercial or financial relationships that could be construed as a potential conflict of interest.
The reviewer VS declared a shared affiliation with the authors to the handling editor at the time of review.
Publisher's note
All claims expressed in this article are solely those of the authors and do not necessarily represent those of their affiliated organizations, or those of the publisher, the editors and the reviewers. Any product that may be evaluated in this article, or claim that may be made by its manufacturer, is not guaranteed or endorsed by the publisher.
Footnotes
1. ^The information on the increase in water tariffs is from the website of the Chartered Institution of Water and Environmental Management (2019).
2. ^Note by the authors: Unlike the English language meaning, in the Portuguese language the term Autarchy means the administrative autonomy of a government body.
3. ^The term Destatization has the same sense as Privatization.
4. ^Available at: http://www.ipeadata.gov.br/ExibeSerie.aspx?serid=38590&module=M&module=M (accessed at: 03/26/2023).
5. ^Text extracted from the Complete Table of Aggregated Information from Local Service Providers—Private Company, from SINS (2022). Available at: https://www.gov.br/mdr/pt-br/assuntos/saneamento/snis/produtos-do-snis/diagnosticos/diagnosticos_snis (accessed at: 03/07/2023).
References
Acselrad, H. (2010). Ambientalização das lutas sociais - O caso do movimento por justiça ambiental. Estudos Avançados 24, 103–119. doi: 10.1590/S0103-40142010000100010
Amaral, M. H., Benites-Lazaro, L. L., Sinisgalli, P. A. A., Alves, H. P. F., and Giatti, L. L. (2021). Environmental injustices on green and blue infrastructure: urban nexus in a macrometropolitan territory. J. Clean. Prod. 289:125829. doi: 10.1016/j.jclepro.2021.125829
Arruda, A. E., and Heller, L. (2022). Access to water and sanitation in urban occupation in the Metropolitan Region of Belo Horizonte: effects on health, quality of life and gender relations. Physis Revista de Saúde Coletiva. 32:73312022320204. doi: 10.1590/S0103-73312022320204
Becker, B. K., and Egler, C. A. G. (1994). Brasil: Uma Nova Potência Regional na Economia-Mundo. Rio de janeiro: Editora Betrand Brasil, Edição 3. Available online at: https://idoc.pub/documents/becker-bertha-k-egler-claudio-a-g-brasil-uma-nova-potencia-regionall-na-economia-mundo-wl1pwmkeqjlj (accessed March 08, 2023).
BRASIL (1997). Lei n° 9.491, de 9 de setembro de 1997 - Programa Nacional de Desestatização. Available online at: https://www.planalto.gov.br/ccivil_03/leis/l9491.htm (accessed March 14, 2023).
BRASIL. Secretaria de Vigilância em Saúde (2021). Mortalidade Infantil no Brasil. Brasília (DF): Boletim Epidemiológico n. 37, v. 53, 15. Available online at: https://www.gov.br/saude/pt-br/centrais-de-conteudo/publicacoes/boletins/epidemiologicos/edicoes/2021/boletim_epidemiologico_svs_37_v2.pdf (accessed April, 22, 2023).
Chartered Institution of Water and Environmental Management (2019). Thirty Years on, What Has Water Privatisation Achieved? Available online at: https://www.ciwem.org/the-environment/how-should-water-and-environmental-management-firms-tap,-retain-and-promote-female-talent (accessed January 05, 2024).
Easter, K. W., Feder, G., Le Moigne, G., and Duda, A. M. (1993). Water Resources Management. Washington, DC: World Bank Policy Paper n. 12335, 141.
Evans, G., and Pelhan, L. (2016). Transition to a post-carbon society: linking environmental justice and just transition discourses. Energy Pol. 99, 329–339. doi: 10.1016/j.enpol.2016.05.003
Foster, V., and Rana, A. (2020). Rethinking Power Sector Reform in the Developing World. Washington, DC.: World Bank Sustainable Infrastructure Series, 359.
Heller, L. (2020). Human Rights and the Privatization of Water and Sanitation Services. United Nations General Assembly. Seventy-Fifth Session- A/75/208 Available online at: https://digitallibrary.un.org/record/3878974#record-files-collapse-header (accessed June 19, 2023).
Herbert, J. (2020). Environmental justice. In: Newcastle Social Geographies Collective. Social Geographies: An Introduction. Lanham, MD: Rowman & Littlefield Publishers.
IBGE (2022). PNAD-Pesquisa Nacional por Amostra de Domicílios Contínua, Tabela 7436. Available online at: https://sidra.ibge.gov.br/tabela/7436#resultado (accessed January 27, 2023).
Narzetty, D. A., and Marques, R. C. (2022). Policies and incentives for developing universal access to water and sanitation for vulnerable families. Water Policy 24, 485–499. doi: 10.2166/wp.2022.227
Parlatore, A. C. (2000). “Privatização do setor de saneamento no Brasil,” in A privatização no Brasil: O caso dos serviços de utilidade pública (Rio de Janeiro: BNDES), 280–320.
Porto, M. F. S. (2011). Complexidade, processos de vulnerabilização e justiça ambiental: um ensaio de epistemologia política. Revista Crítica de Ciências Sociais 93, 31–58. doi: 10.4000/rccs.133
SINS (2022). Diagnóstico dos Serviços de Água e Esgotos - Visão Geral (Brasília: Ministério do Desenvolvimento Regional), 92. Available online at: https://www.gov.br/mdr/pt-br/assuntos/saneamento/snis/produtos-do-snis/diagnosticos/diagnosticos_snis (accessed January 16, 2023).
The Guardian (2015). Water Privatization: a Worldwide Failure? by John Vidal, 01.30.2015. Available online at: https://www.theguardian.com/global-development/2015/jan/30/water-privatisation-worldwide-failure-lagos-world-bank (accessed January 25, 2023).
The Guardian (2023). Starmer accuses government of ‘turning Britain's waterways into an open sewer' by Helena Horton, Rowena Mason and Peter Walker, 03. 31. 2023. Available online at: https://www.theguardian.com/environment/2023/mar/31/raw-sewage-spilled-english-rivers-824-times-day-last-year (accessed January 03, 2024).
Transnational Institute Public Services International Research Unit, and the Multinational Observatory. (2013). Remunicipalisation: Putting Water Back into Public Hands. Available online at: http://www.remunicipalisation.org (accessed January 27, 2023).
Keywords: environmental injustice, Brazilian sanitation, privatization of sanitation services, public health, human rights, Brazilian municipalities
Citation: Bermann C and Hermsdorff SMGL (2024) Environmental injustice in the privatization of Brazilian sanitation: an empirical analysis. Front. Water 6:1211629. doi: 10.3389/frwa.2024.1211629
Received: 25 April 2023; Accepted: 18 January 2024;
Published: 11 March 2024.
Edited by:
Mariana Gutierres Arteiro Da Paz, National Institute of Space Research (INPE), BrazilReviewed by:
Priscila Neves Silva, Oswaldo Cruz Foundation (Fiocruz), BrazilRobert Home, Anglia Ruskin University, United Kingdom
Vanessa Souza, University of São Paulo, Brazil
Copyright © 2024 Bermann and Hermsdorff. This is an open-access article distributed under the terms of the Creative Commons Attribution License (CC BY). The use, distribution or reproduction in other forums is permitted, provided the original author(s) and the copyright owner(s) are credited and that the original publication in this journal is cited, in accordance with accepted academic practice. No use, distribution or reproduction is permitted which does not comply with these terms.
*Correspondence: Celio Bermann, cbermann@iee.usp.br