 Md Izazul Haq1,2,3*
 Mohammad Shamsudduha3
 Anwar Zahid4
 Kazi Matin Ahmed5
 A. S. M. Maksud Kamal2
 Richard G. Taylor1
- 1Department of Geography, University College London, London, United Kingdom
- 2Department of Disaster Science and Climate Resilience, University of Dhaka, Dhaka, Bangladesh
- 3Institute for Risk and Disaster Reduction, University College London, London, United Kingdom
- 4Ground Water Hydrology, Bangladesh Water Development Board, Dhaka, Bangladesh
- 5Department of Geology, University of Dhaka, Dhaka, Bangladesh
The salinisation of freshwater resources is a priority concern in Asian mega-deltas including the Bengal Basin of Bangladesh where the livelihoods, ecosystem services and health of coastal populations are increasingly under threat. Understanding trends and variations in surface water salinity is required to inform sustainable use of freshwater supplies in the face of hydrological regimes intensified by global environmental change. We interrogate 86 time series of fortnightly records of in situ surface water salinity between 1990 and 2019. Statistical and geospatial techniques were employed to characterise spatiotemporal distributions and trends in surface water salinity and identify key drivers of change in the coastal region of Bangladesh. The observed spatiotemporal structure in surface water salinity is primarily controlled by the magnitude and seasonality of river discharge entering the delta. In the moribund delta north of the Sundarbans, the contour between fresh and brackish water migrates seasonally between ~20 and ~40 km northward during the dry season. Abrupt increases in surface water salinity are observed throughout the coastal region in response to variations in upstream river discharge; the prominence of these events highlights their importance in driving salinity increases. Areas which are better connected to more voluminous seasonal river discharge (active delta), show greater recovery to these episodic inundations by cyclones than those less-well flushed by river discharge (moribund delta). Our reported observations provide a baseline for understanding the consequences of global environmental change and informing more climate-resilient adaptation strategies in coastal environments of Bangladesh and other Asian mega-deltas.
1 Introduction
Under global environmental change, the salinisation of freshwater resources in coastal environments threatens the livelihoods and health of resident populations and the ecosystems upon which they depend (Vineis et al., 2011; Dasgupta et al., 2015; Wilson, 2017; Chen and Mueller, 2018; Mahtab and Zahid, 2018; Naser et al., 2019; Ostrowski et al., 2021; Barbour et al., 2022). It is estimated that globally the salinisation of freshwater and soils affects 500 million people, most conspicuously in riverine deltas (Rahman et al., 2019). Chronic consumption of brackish water increases the incidence of hypertension (Rahman et al., 2019; Khan et al., 2020) as well as pre-eclampsia and eclampsia (Pinchoff et al., 2019) in affected communities. In coastal environments, salinisation is a more prominent driver of human migration than inundation (Chen and Mueller, 2018).
Previous research in low-lying Asian mega-deltas (Figure 1) has suggested a range of factors influencing the salinity of surface waters and groundwater (Yu et al., 2010; Salehin et al., 2018; Akter et al., 2019, 2020; Sherin et al., 2020; Bricheno et al., 2021; Feist et al., 2023; Raff et al., 2023). These include: (i) changes in the magnitude and seasonality of upstream river discharge and sediment deposition; (ii) subsidence, sea-level rise (SLR) and seasonal tidal fluctuations; and (iii) the intensity and frequency of tropical cyclones and storm surges. In the Bengal Basin of Bangladesh, surface water salinity regimes are also locally influenced by land-use change and human interventions such as coastal embankments known locally as “polders,” shrimp farming, and dry-season irrigation from surface waters and wells (Ayers et al., 2017; Islam et al., 2019; Shamsudduha et al., 2022; Feist et al., 2023). The complex interplay of these different factors makes it challenging to identify the primary drivers of saltwater intrusion over large, complex low-lying deltaic systems (Bricheno et al., 2021; Feist et al., 2023).
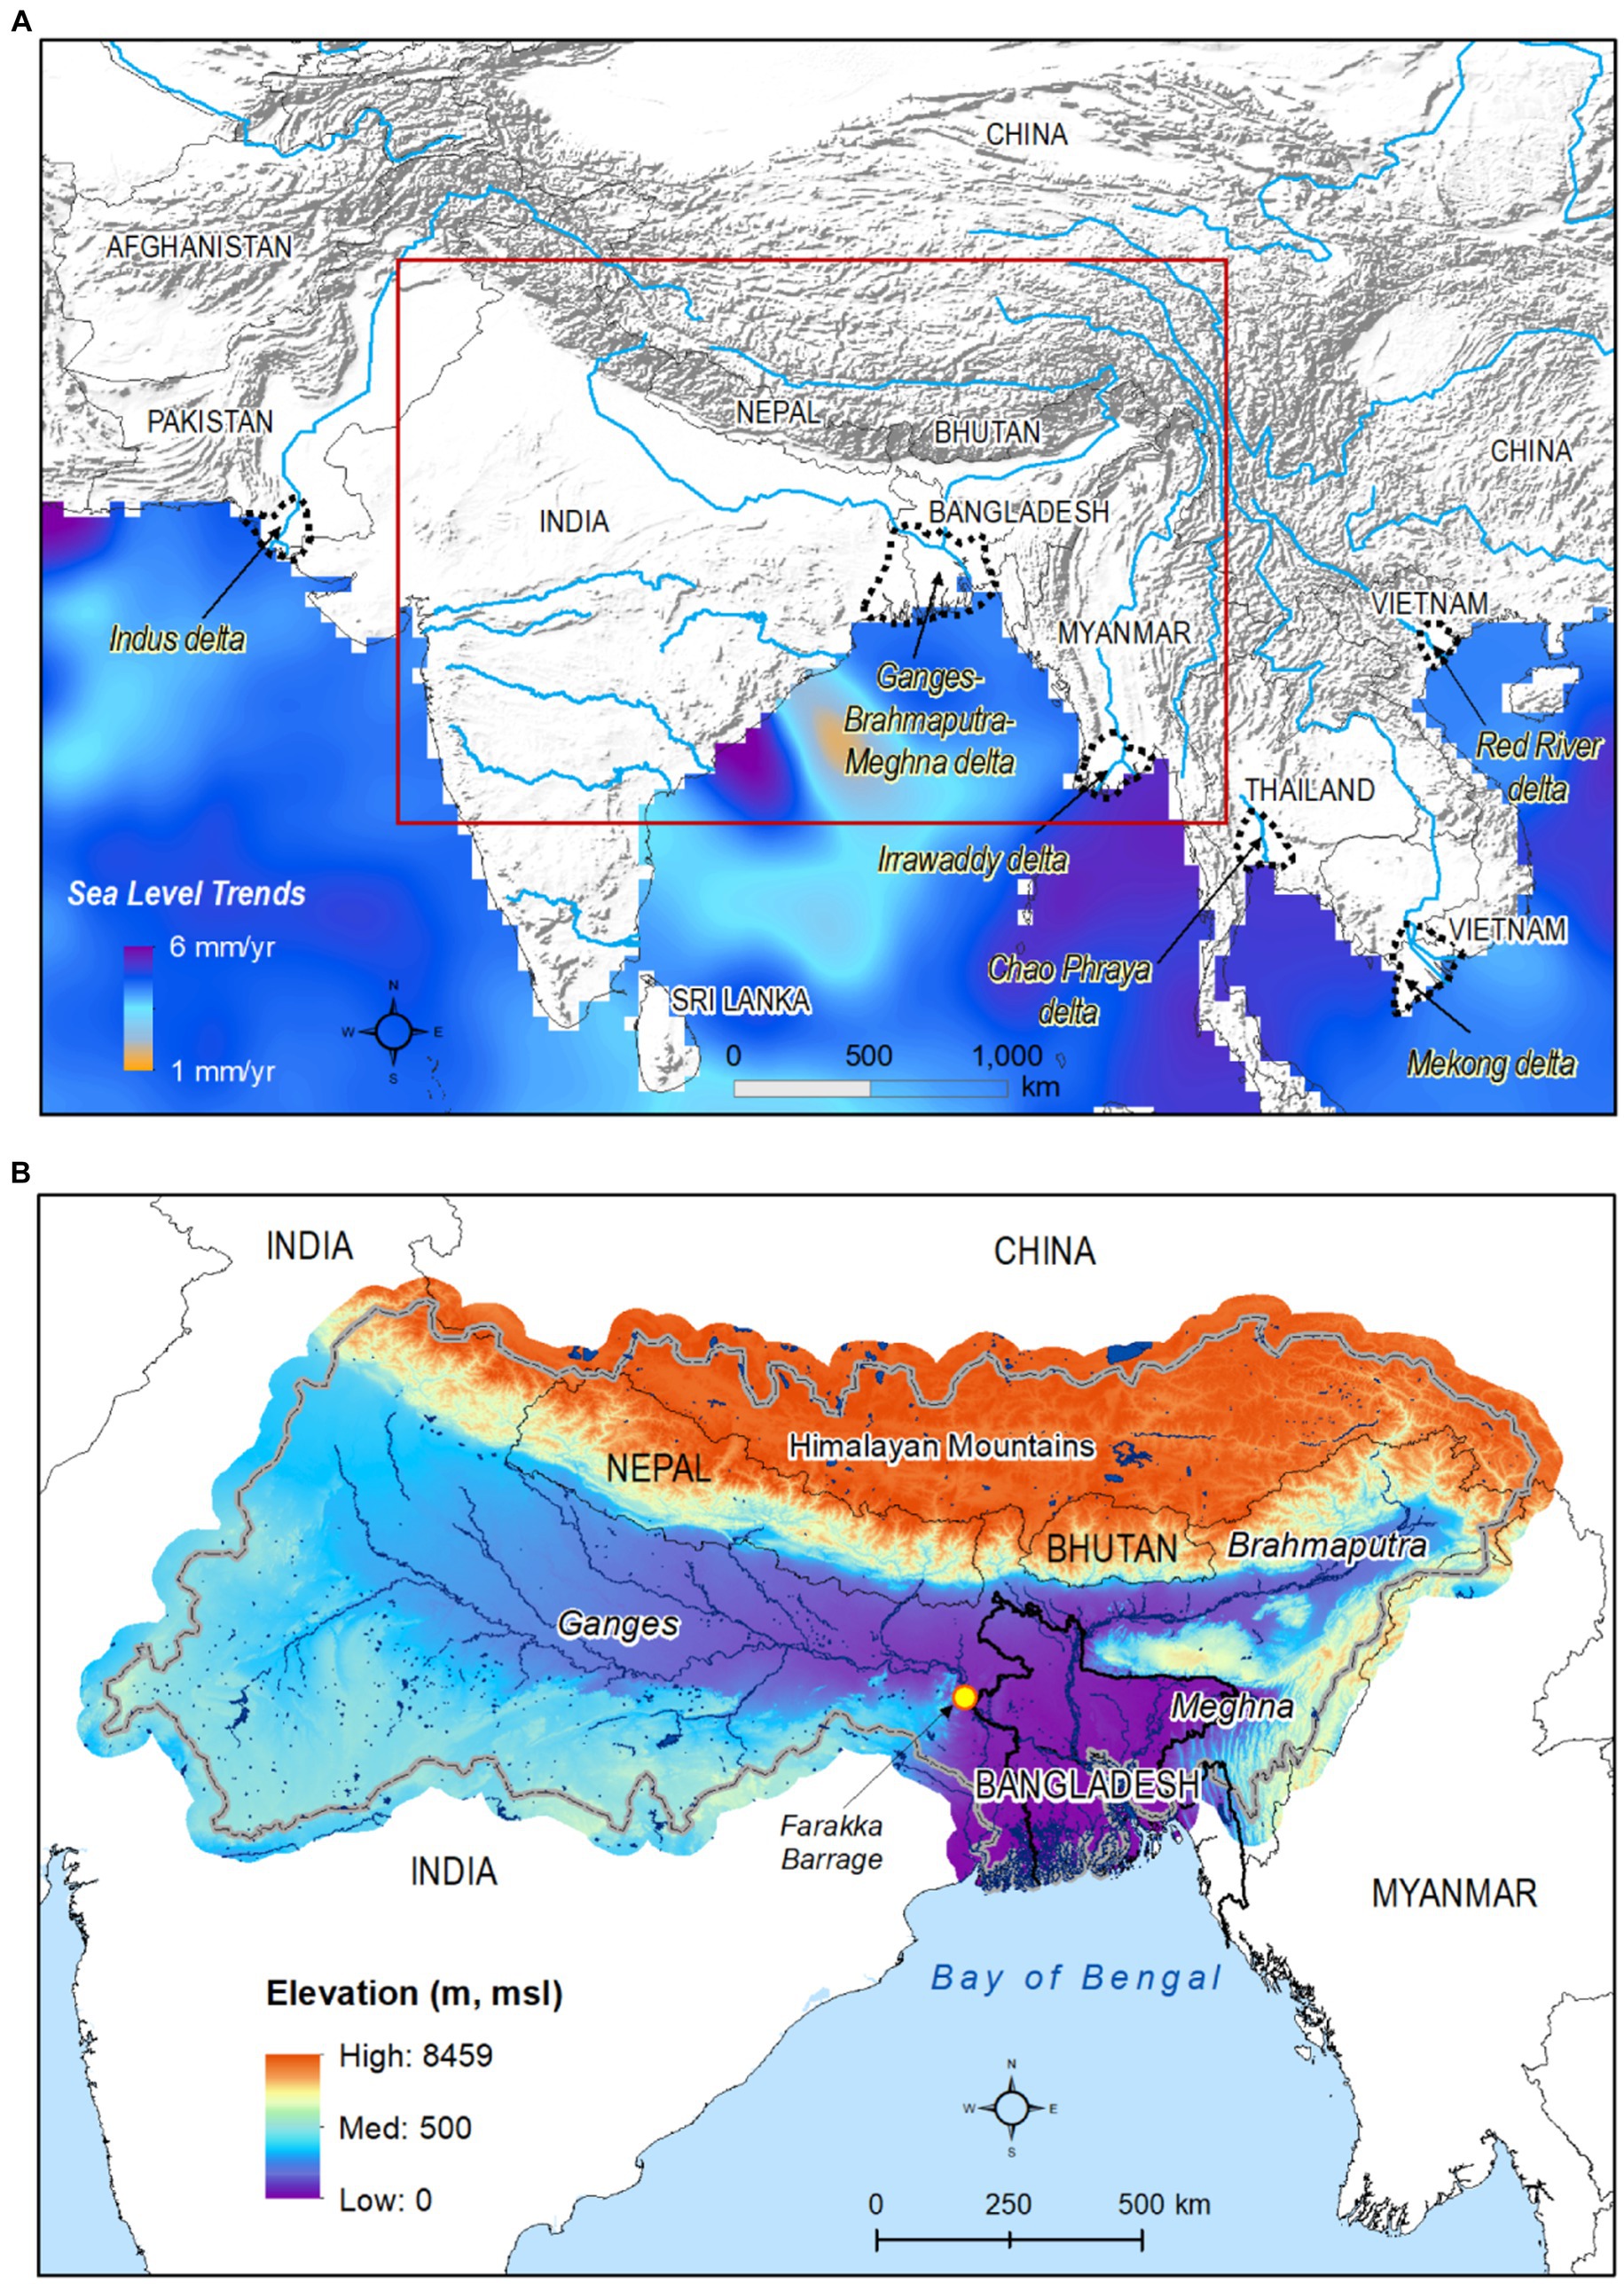
Figure 1. (A) Location of Bengal Basin with locations of other Asian mega-deltas (dotted boundaries) superimposed on trends in sea level from AVISO (Archiving, Validation and Interpretation of Satellite Oceanographic, https://www.aviso.altimetry.fr/en/data.html). (B) GBM river basin elevation and drainage network based on NASA’s Shuttle Radar Topography Mission (SRTM) elevation data; yellow dot denotes the location of the Farakka barrage in India.
Previous research in the Bengal Basin drawing from observations and models has yielded insight into the drivers of spatiotemporal changes in salinity in the coastal region of Bangladesh. Reductions in the discharge of the transboundary River Ganges (Padma), especially during the dry season, have lowered flows from its main distributary (River Gorai) to the southwestern coastal region; these are thought to have, in turn, amplified the intrusion of salinity from the Bay of Bengal (Dasgupta et al., 2014; Sherin et al., 2020; Feist et al., 2023). Dry-season reductions in river discharge exacerbating the intrusion of salinity are also thought to result from freshwater withdrawals for irrigation either directly from surface water or as a consequence of groundwater use through freshwater capture (Sherin et al., 2020; Shamsudduha et al., 2022). Seasonal variations in surface water salinity across the coastal region of Bangladesh are thought to arise from the combined influences of monsoonal riverine flow and sea-surface height (Sherin et al., 2020; Bricheno et al., 2021). Interannual variability in surface water salinity across the coastal region remains unclear (Sherin et al., 2020); year-to-year sea-surface salinity in the Bay of Bengal is considered to be driven primarily by variability in freshwater fluxes from upstream river flow (Chaitanya et al., 2015).
Numerical models imposing conceptual models of the drivers of change in surface water salinity in the Bengal Basin project increases in the dry-season salinity of rivers (Bricheno et al., 2021); that are simulated to be greatest in the central estuarine section. Dasgupta et al. (2014) project a 50% decrease in the river area that is fresh from ~40% in 2012 (baseline) to ~20% by 2050; modelled changes are especially pronounced in the southwestern coastal zone. During the monsoon season, Bricheno et al. (2021) project higher river discharges under future climate scenarios that would enhance freshwater delivery to the delta and thereby maintain lower salinity at the mouth of the River Meghna. Further they assert that, given SLR and projected increases in monsoonal river discharges, the disparity in wet and dry season intrusion of salinity is projected to widen.
Observational datasets are critical to the development and testing of conceptual and numerical models of how both climate change through, for example, the amplification of climate extremes and SLR, and human activity, in form of irrigation and construction of polders, influence the salinity of coastal water resources (Payo et al., 2017; Feist et al., 2023). As noted by Feist et al. (2023), the spatiotemporal distribution in salinity and its rate of change in surface water remains inadequately constrained by observational records. Yet the Bengal Basin of Bangladesh is among the most intensely monitored hydrological systems on the planet through its network of in situ stations. Fed by the combined discharge of the Rivers Ganges (Padma in Bangladesh), Brahmaputra (Jamuna) and Meghna (GBM), the Bengal Basin forms an ideal laboratory to examine both the spatiotemporal dynamics in the salinity of surface waters and the drivers (e.g., river discharge, SLR) of changing surface water salinity. Our analysis here draws from a larger time series (86 stations) of surface water salinity than recent studies (e.g., Dasgupta et al., 2014; Sherin et al., 2020; Feist et al., 2023) to: (1) analyse the spatiotemporal distribution of surface water salinity; (2) identify the recent trends in surface water salinity; and (3) evaluate the key drivers of surface water salinity.
2 Study area: the Bengal Basin
Research was conducted in the low-lying coastal zone (i.e., deltaic region) of the Bengal Basin in Bangladesh. The basin is bounded by the Himalayan Mountains in the north, the Bay of Bengal in the south, the Indian Shield to the west and the Indo-Burman Hills in the east. The Bengal Basin is the largest sedimentary basin in the world (area 300,000 km2), formed by the transport of sediments (1 × 10⁹ tonne/year) carried by three major river systems, Ganges–Brahmaputra–Meghna (GBM) and their numerous tributaries and distributaries (Goodbred and Kuehl, 2000; Alam et al., 2003; Rudra, 2018). Weathering of the Himalayan Plateau provides an effectively endless supply of sediment to the delta region; the Bengal Basin is the outlet for the entire GBM river basin (area 1,612,000 km2) that encompasses parts of India, China, Nepal, Bhutan and Bangladesh (Figure 1B). River discharge (1 × 10¹² m3/year) generated over this catchment area flows into the Bay of Bengal through the lower Meghna sub-basin outlet (Goodbred and Kuehl, 1999; Wasson, 2003; Akter et al., 2016). The Sundarbans, the largest mangrove forest in the world, is located in the southwest boundary of the Bengal Basin.
The Bengal Basin is generally of very low relief (Figure 1B). In the south, which is open to the Bay of Bengal, ground elevation is <1 m above the global mean sea level (m amsl) and gradually increases towards the north (30 to 50 m amsl). Geomorphologically, the basin comprises 80% Holocene floodplains and 20% Tertiary eastern hills and isolated Pleistocene terraces (Mukherjee et al., 2009; Brammer, 2014). Goodbred and Kuehl (2000) argue that recurrent marine transgressions and regressions occurred during the Holocene from approximately 3,000 to 7,000 years ago in the GBM delta. The coastline along the southwest has been migrating inland due to the land subsidence and rising sea levels whereas more centrally in the basin, the Meghna estuary in Bangladesh has been expanding southwards due to accretion (Rudra, 2018).
Since the Tertiary, the geology of the basin has been shaped by the GBM river system. More recently during the Late Quaternary, variations in monsoon winds and fluctuations in sea level have had a pronounced influence on the hydrology of the GBM river system (Goodbred and Kuehl, 2000). Present landforms were formed by fluvio-deltaic processes during the Late-Quaternary. Quaternary alluvial-deltaic deposits support an agricultural base upon which many livelihoods in Bangladesh and the state of West Bengal in India depend. Sedimentary sequences range from hundreds of metres to several kilometres in thickness, deposited in the remanent ocean basin of the Cenozoic Tethys Sea (Alam et al., 2003). Shallow sedimentary sequences to a depth of a few hundred metres form a highly productive, regional aquifer system that largely meets demand for freshwater used in irrigation, drinking-water supplies, and industrial activities (Hoque, 2010; Shamsudduha et al., 2011).
Bangladesh has a subtropical monsoon climate with distinct seasonal patterns of rainfall, warm temperatures, and high humidity (Water Resources Planning Organization, 2001). The Asian monsoon plays a significant role in the climate, affecting pre-monsoon and post-monsoon circulations (Agrawala et al., 2003). The year can be divided into four seasons: the dry winter (December–February), the hot pre-monsoon season (March–May), the wet monsoon season (June–September), and the brief post-monsoon season (October–November). During the winter, temperatures are cooler and drier, ranging from 7–13°C minimum to 24–31°C maximum (Agrawala et al., 2003). The pre-monsoon season is typically hot with an average maximum temperature of 37°C, and heavy rainfall accompanied by thunderstorms and tropical cyclones. During the monsoon season, the country experiences heavy rainfall that amounts to ~80% of the annual total; the post-monsoon season is marked by rainfall associated with episodic tropical cyclones (Hoque, 2010; Shamsudduha et al., 2020). Mean annual precipitation is ~2,300 mm but noticeable variations in rainfall depths occur; eastern and northeastern areas of Bangladesh receive over 5,000 mm of rainfall whereas rainfall in western areas is 1,200 mm (Shahid, 2010; Dewan et al., 2022).
3 Datasets and analytical methods
3.1 Observational records
Time-series records of surface water salinity were collected by the Bangladesh Water Development Board (BWDB) from a monitoring network of 119 tidal stations used to monitor surface water salinity. The BWDB reports surface water salinity in terms of electrical conductivity (EC in units of μS/cm) and chloride concentrations (Cl in units of mg/L) for both high and low tides. Data were collated over three decades between January 1990 and January 2019. The frequency of the collated data is inconsistent and varies from weekly, bi-weekly, to monthly; data gaps also occur in the dataset. Following a careful review of surface water salinity times series records, 86 surface water salinity monitoring stations (Figure 2A) were selected for further analysis. A district headquarters map is also provided in Figure 2B to relate patterns and processes revealed by the surface water salinity data to an administrative level and facilitate risk-informed policy making. The interrogated dataset contains 39,464 observations of EC. Between 1990 and 2000, the number of stations (~10) and continuity of records are much more limited relative to the subsequent two decades and especially between 2001 and 2017 (Figure 3). Further, data gaps are consistently observed during the peak of the monsoon season (July to October) and are attributed to the challenges of conducting field measurements during monsoonal flooding in Bangladesh. We report salinity observed at BWDB’s surface water monitoring stations across coastal Bangladesh which largely comprise rivers but exclude shrimp-farming ponds and inland (closed) water bodies.
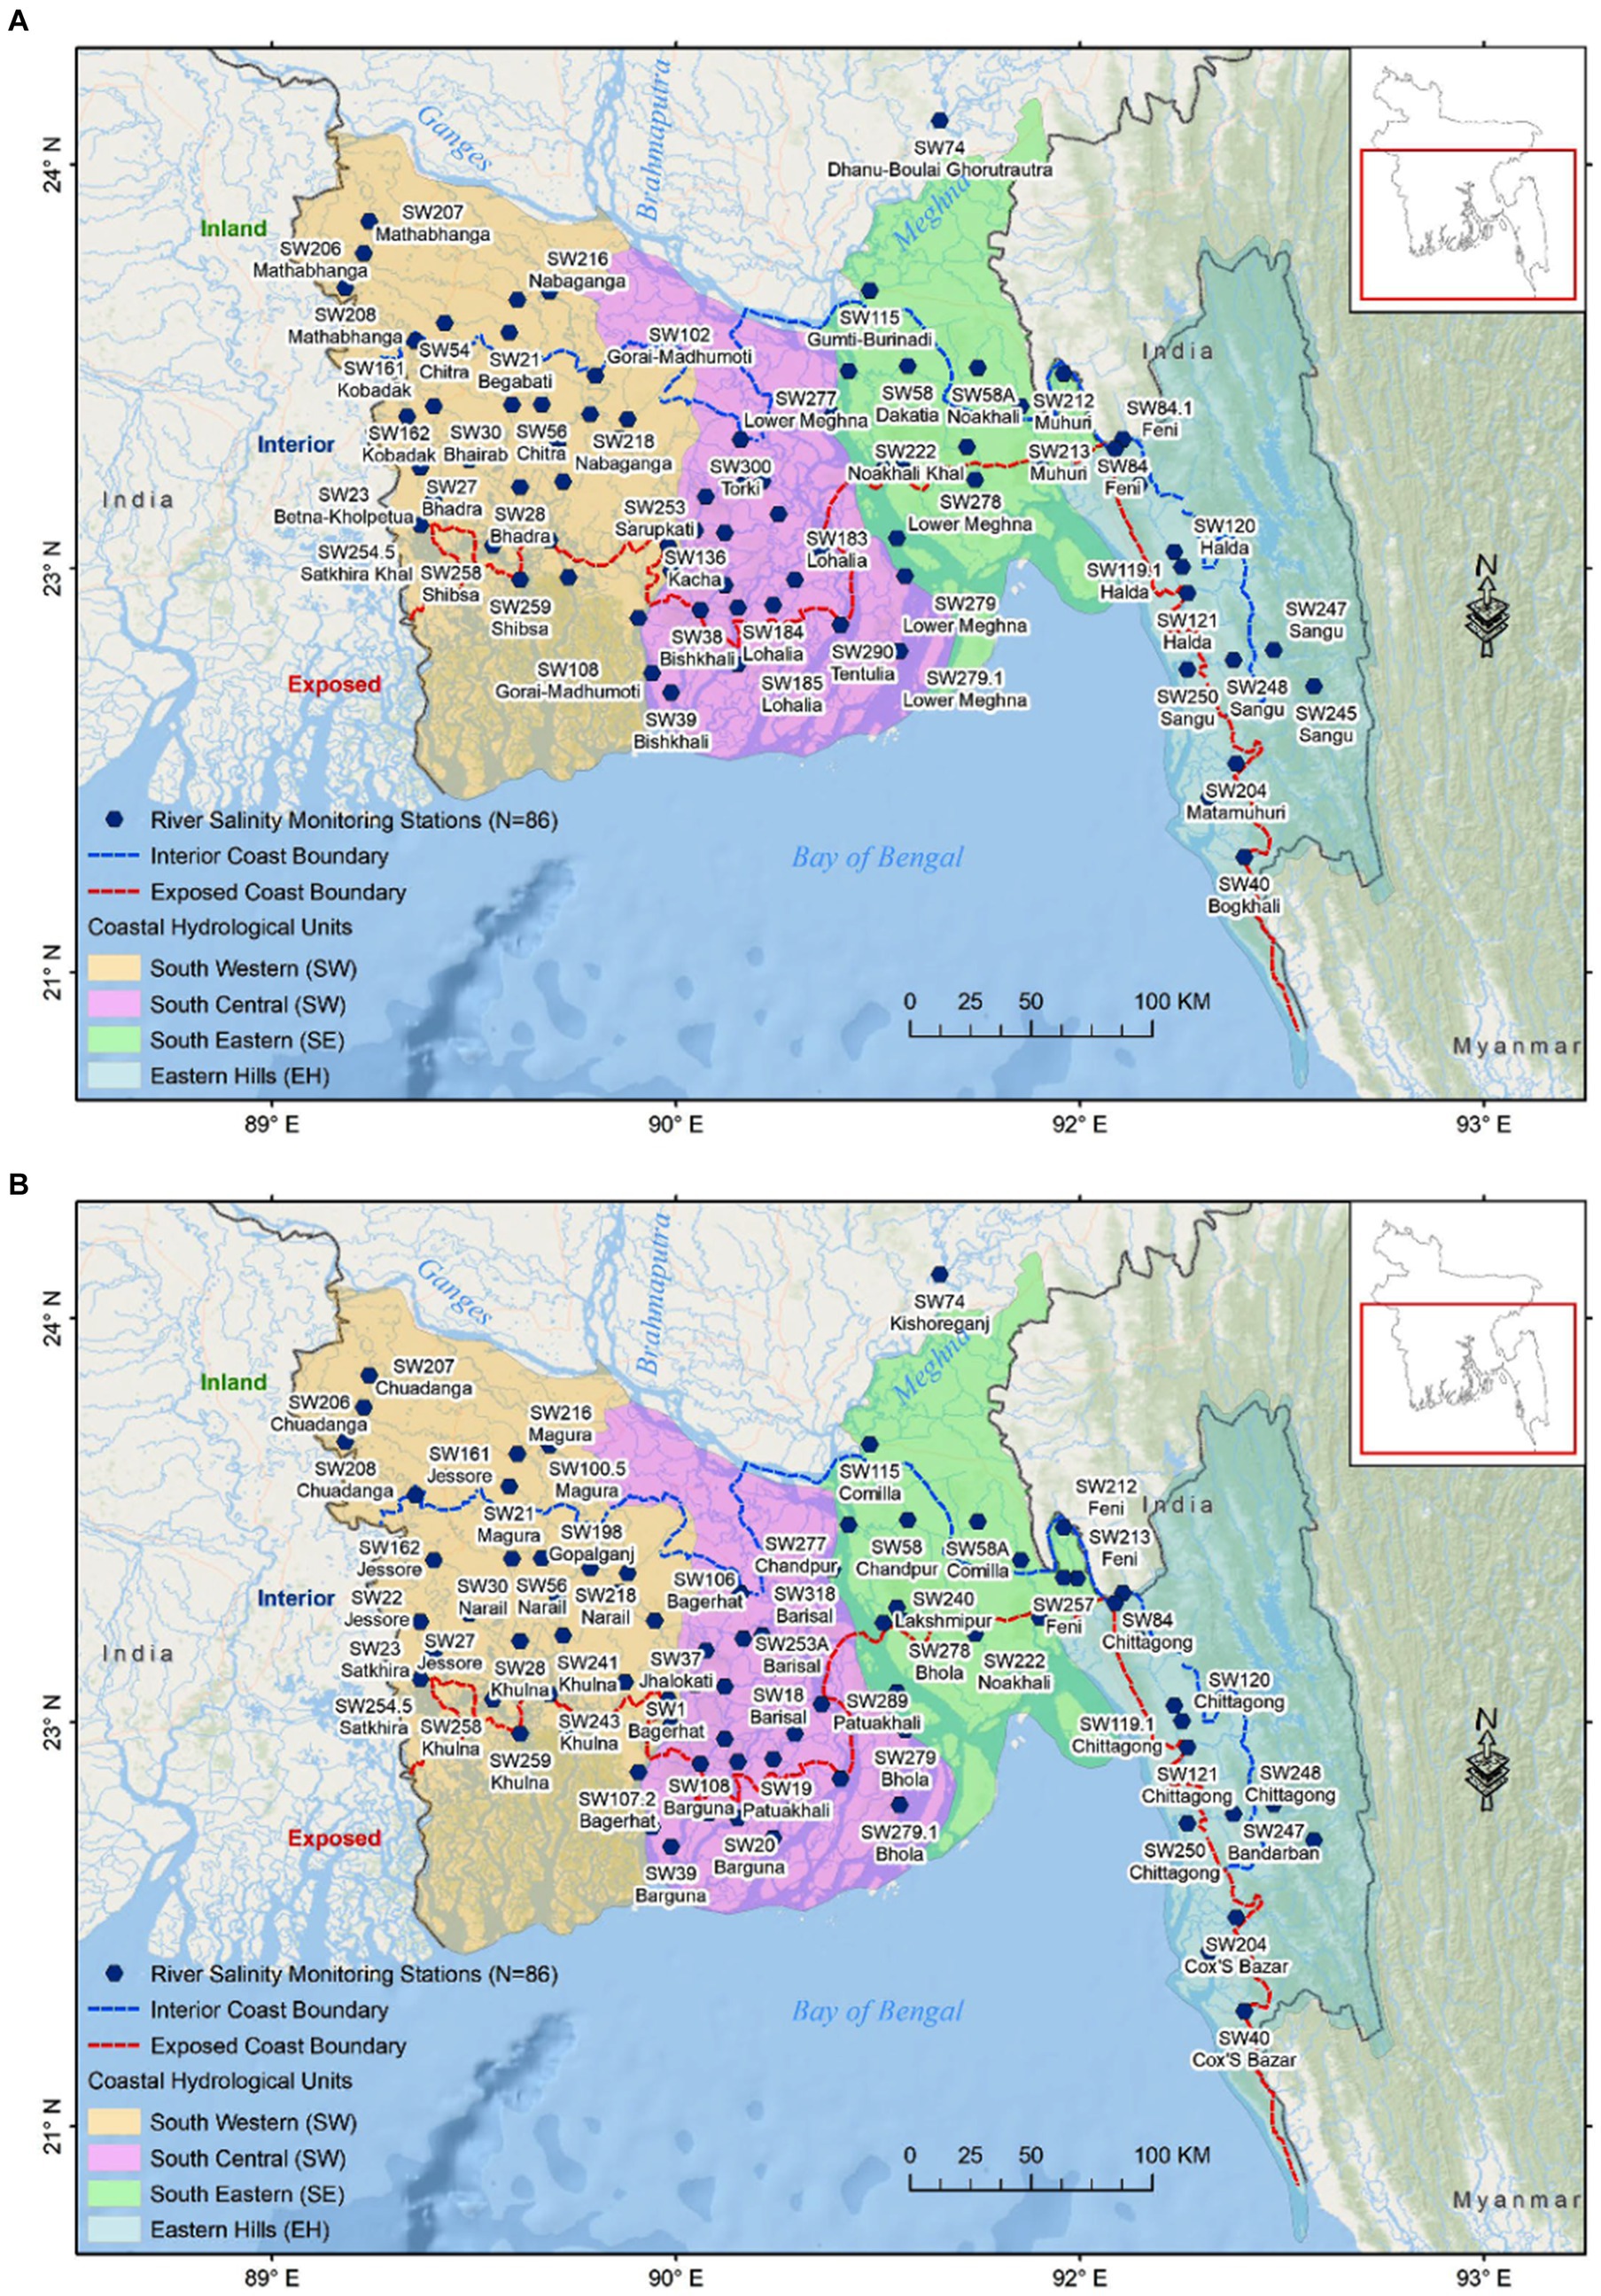
Figure 2. (A) Map of surface water salinity monitoring stations in Bangladesh (N = 86) by Bangladesh Water Development Board (BWDB); red dashed line demarcates the boundary between the “exposed” and “interior” coast; blue dashed line demarcates the northern extent of the “interior” coast with the inland area (Uddin and Kaudstaal, 2003); blue dashed lines demarcate the area of coastal hydrological units: South West (SW), South Central (SC), South Eastern (SE) and Eastern Hills (EH) (Water Resources Planning Organization, 2001); (B) district headquarters. A detailed location map with the names of rivers, river discharge monitoring stations and rainfall monitoring stations used in this study is provided in the Supplementary Figure S1.
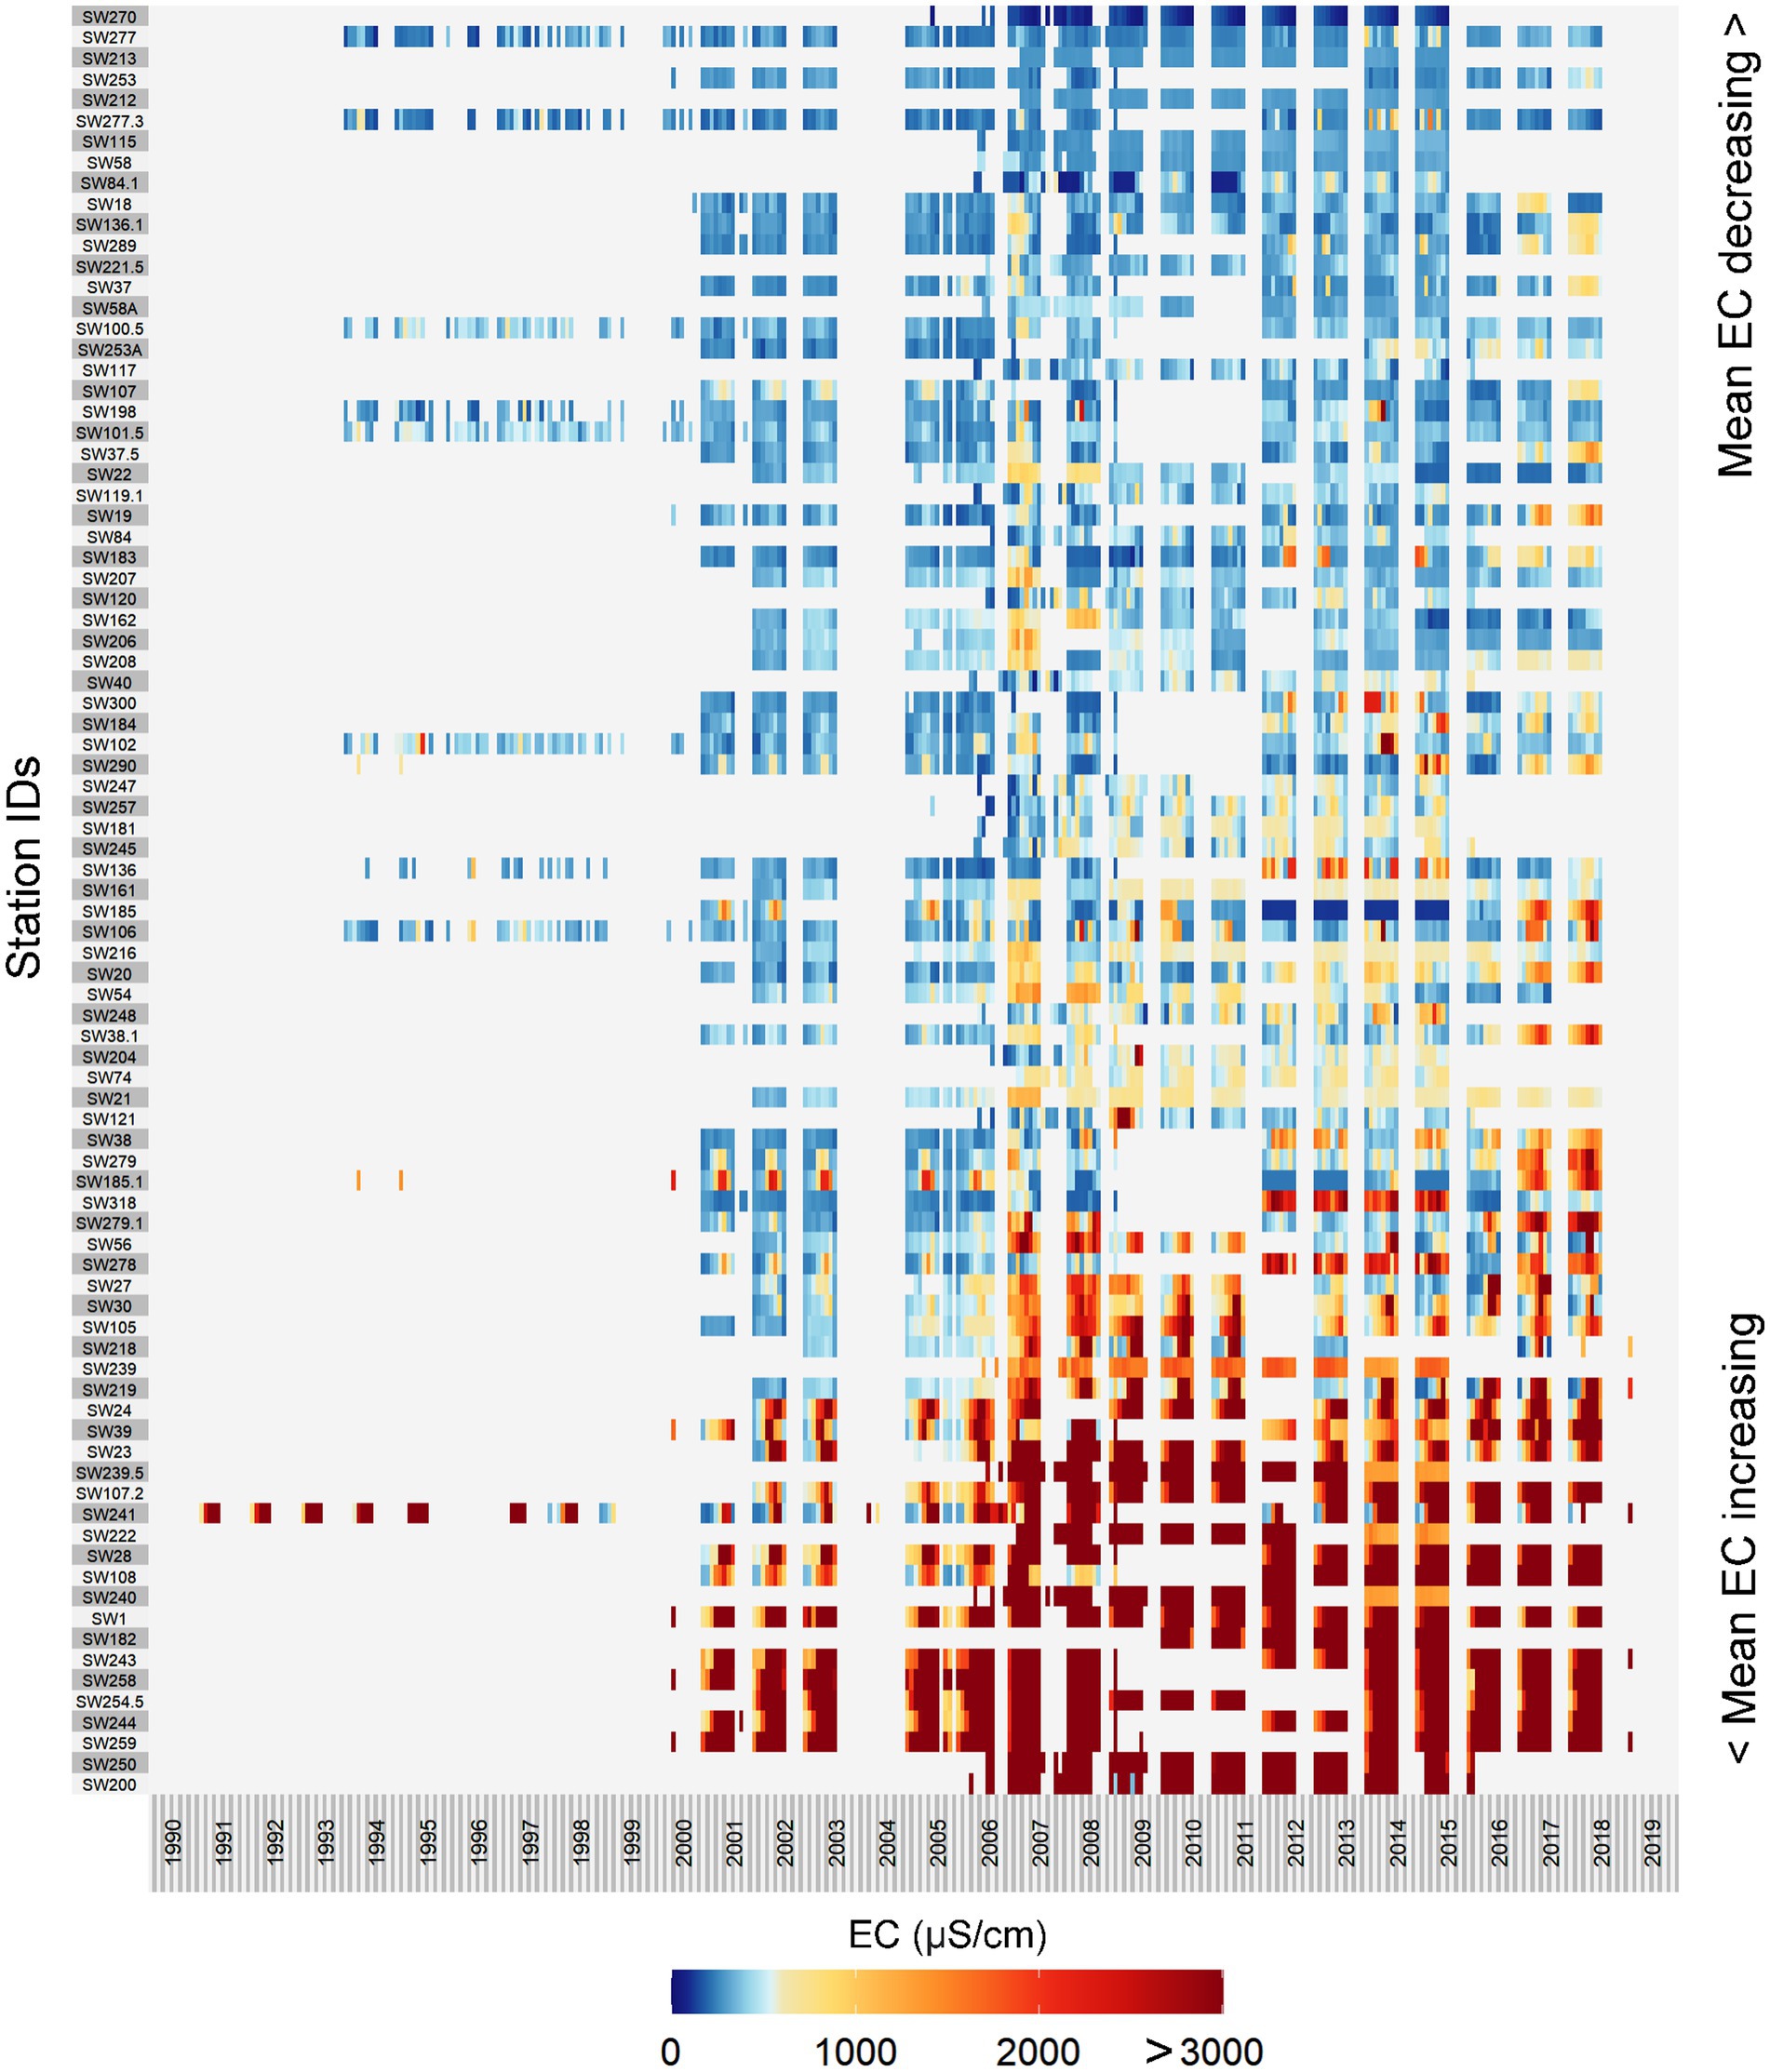
Figure 3. Heatmap showing the availability of surface water salinity (EC in units of μS/cm) from 1990 to 2019; data are primarily available from 2001 to 2017. Stations are arranged by their mean EC values from the top (lowest) to the bottom (highest). Heatmap is created using functions available in “superheat” R package (Barter and Yu, 2018).
For the purpose of integrated coastal zone management, the coastal region of Bangladesh is delineated into two distinct sections: “exposed” and “interior” coasts (Figures 2A,B) based on their degree of interaction with the sea in a north–south direction such as tidal fluctuations, soil salinity, surface water or groundwater, and their vulnerability to cyclones and storm surges (Uddin and Kaudstaal, 2003). Areas situated to the north of the coastal boundary are classified as “inland.” Water Resources Planning Organization (2001) divided the coastal area of Bangladesh into four hydrological units (Figures 2A,B) that include South West (SW), South Central (SC), South Eastern (SE), and Eastern Hills (EH); SE and EH parts are collectively referred to as the SE coast in this study.
3.2 Exploratory analyses
Exploratory (scoping) analyses of surface water salinity data were employed to assess its spatiotemporal structure across coastal Bangladesh. Applied statistics include long-term mean, standard deviation, and decadal means. Long-term mean and standard deviations were calculated between the 1991–2019 periods at the mean tide (i.e., arithmetic means of high tide and low tide salinity) to explore the spatial structure of the surface water salinity dataset. Similarly, decadal means were calculated over the last three decades (i.e., 1990–1999, 2000–2009 and 2010–2019) to assess changes in spatiotemporal patterns. Surface water salinity for individual stations was also plotted to identify erroneous values and assess trends.
3.3 Analysis of trends
The analysis of salinity trends focused on a subset of the surface water salinity dataset from 2001 to 2017 during which there are fewer data gaps. Linear regression is a parametric model commonly applied to detect trends in time series data but assumes that analysed datasets are normally distributed (McBean and Motiee, 2008). Many hydrological variables do not follow a normal distribution (Viessman et al., 1989) but show a pronounced “right skewedness” as is evident from the surface water salinity dataset in coastal Bangladesh (Supplementary Figure S2). Consequently, a non-parametric measure of trend, Sen Slope Estimator (Sen, 1968), was also employed. For the calculation of Sen Slope Estimator, data gaps were infilled using “MissForest”, a random forest imputation algorithm for missing data and converted to a uniform monthly time series (Stekhoven and Bühlmann, 2012). Additionally, to identify trends and seasonal patterns in surface water salinity, we applied another non-parametric technique, seasonal-trend decomposition procedure based on Loess (STL) (Cleveland et al., 1990; Shamsudduha et al., 2009). The STL method detects nonlinear patterns in long-term trends that cannot be assessed through linear trend analyses. It comprises a series of smoothing operations with variable moving window widths chosen to extract different frequencies within a time series and can be regarded as an extension of classical methods for decomposing a series into its individual components.
3.4 Cluster analyses
We further applied a partitional (non-hierarchical) clustering method (K-means) with a pre-assigned number of clusters as it is computationally more efficient and faster than hierarchical clustering with high-dimensional (i.e., number of features) time-series data (Aghabozorgi et al., 2015; Javed et al., 2020; Shamsudduha et al., 2022). K-means clustering is fundamentally different from hierarchical clustering in that it is a form of partitional clustering where data are divided into K number of partitions based on a priori knowledge about the optimum number of clusters in the dataset. To determine the optimum number of clusters, we applied several techniques to the groundwater-level dataset ranging from the sum of squared error (SSE) or “elbow” method to the Caliñski and Harabasz (1974) criteria. These methods indicate that the optimum number of clusters is 6 by the “elbow” method, and between 2 and 6 clusters by the Caliñski–Harabasz index. Here, we considered 6 clusters for grouping surface water salinity monitoring records from 86 stations. To bring further homogeneity to the automatically performed clustering, we reviewed all the time-series data in 6 clusters and moved some stations between clusters. The supervised re-classification of the original clusters was performed by objectively looking at the individual time series plots and reconciling patterns revealed by the composite cluster plots. It is based on the proximity and magnitude surface water salinity monitoring stations and works as a proxy indicator to infer about key processes that governs surface water salinity regime at a local level such as complex hydro-morphology and anthropogenic factors. These localised process and patterns enable us to comment about the major surface water salinity pathways at the regional level.
3.5 Geospatial analyses
Analytical outcomes from the analyses were mapped using a Geographic Information System (GIS). The confluence of the Rivers Ganges, Brahmaputra and Meghna in the north, Bay of Bengal in the south, and the national boundary between India and Bangladesh in the West and coastal zone boundary in the west demarcate the area of interpolation used in this study. Here, we applied the Empirical Bayesian Kriging (EBK) interpolation algorithm available in the ESRI ArcGIS desktop environment, which is a geostatistical interpolation method that automates the most difficult aspects of building a valid kriging model (Krivoruchko and Gribov, 2019). Other kriging methods in Geostatistical Analyst in ArcGIS require manual adjustments of parameters to generate accurate results whereas EBK automatically calculates these parameters through a process of sub-setting and simulations. Empirical Bayesian Kriging differs from other kriging methods by accounting for the error introduced by estimating the underlying semi-variogram. This approach has an advantage over other kriging methods in that it calculates the semi-variogram from known data locations and uses this single semi-variogram to make predictions at unknown locations. Semi-variogram analysis of surface water EC data in this study shows a strong spatial dependence up to a distance of 50 km suggesting that the EBK algorithm is suitable for interpolation.
4 Results
4.1 Spatiotemporal distribution of surface water salinity
The spatial distribution of surface water salinity defined by long-term mean EC is presented in Figure 4. For contouring purposes, long-term mean surface water salinity is divided into five categories based on EC: (i) very low—freshwater (≤1,500 μS/cm), (ii) low (1,501 to 5,000 μS/cm), (iii) moderate (5,001 to 10,000 μS/cm), (iv) high (10,001 to 15,000 μS/cm), and (v) very high (>15,001 μS/cm). Surface water salinity is consistently high in the southwest (SW) coastal region (e.g., tidal rivers in Khulna, Satkhira and Bagerhat districts). Here, moderate to high surface water salinity is observed in the exposed coastal part of this region whereas the interior and inland coastal area to the north shows very low to low salinity. The surface water salinity contour of 5,000 μS/cm reaches up to 100 km inland, just north of Khulna (Figure 4). The highest surface water salinity (14,500 μS/cm) observed in the SW coastal region is in the River Shibsa in Koyra, ~40 km southwest of Khulna. In contrast to the SW coastal region of Bangladesh, very low to low surface water salinities are observed in the south-central (SC) coastal region and include tidal rivers in Barisal, Barguna, Patuakhali, Priojpur, and Bhola districts where surface water salinity is predominantly below 1,500 μS/cm (i.e., freshwater), except for one station located near the SW coastal boundary.
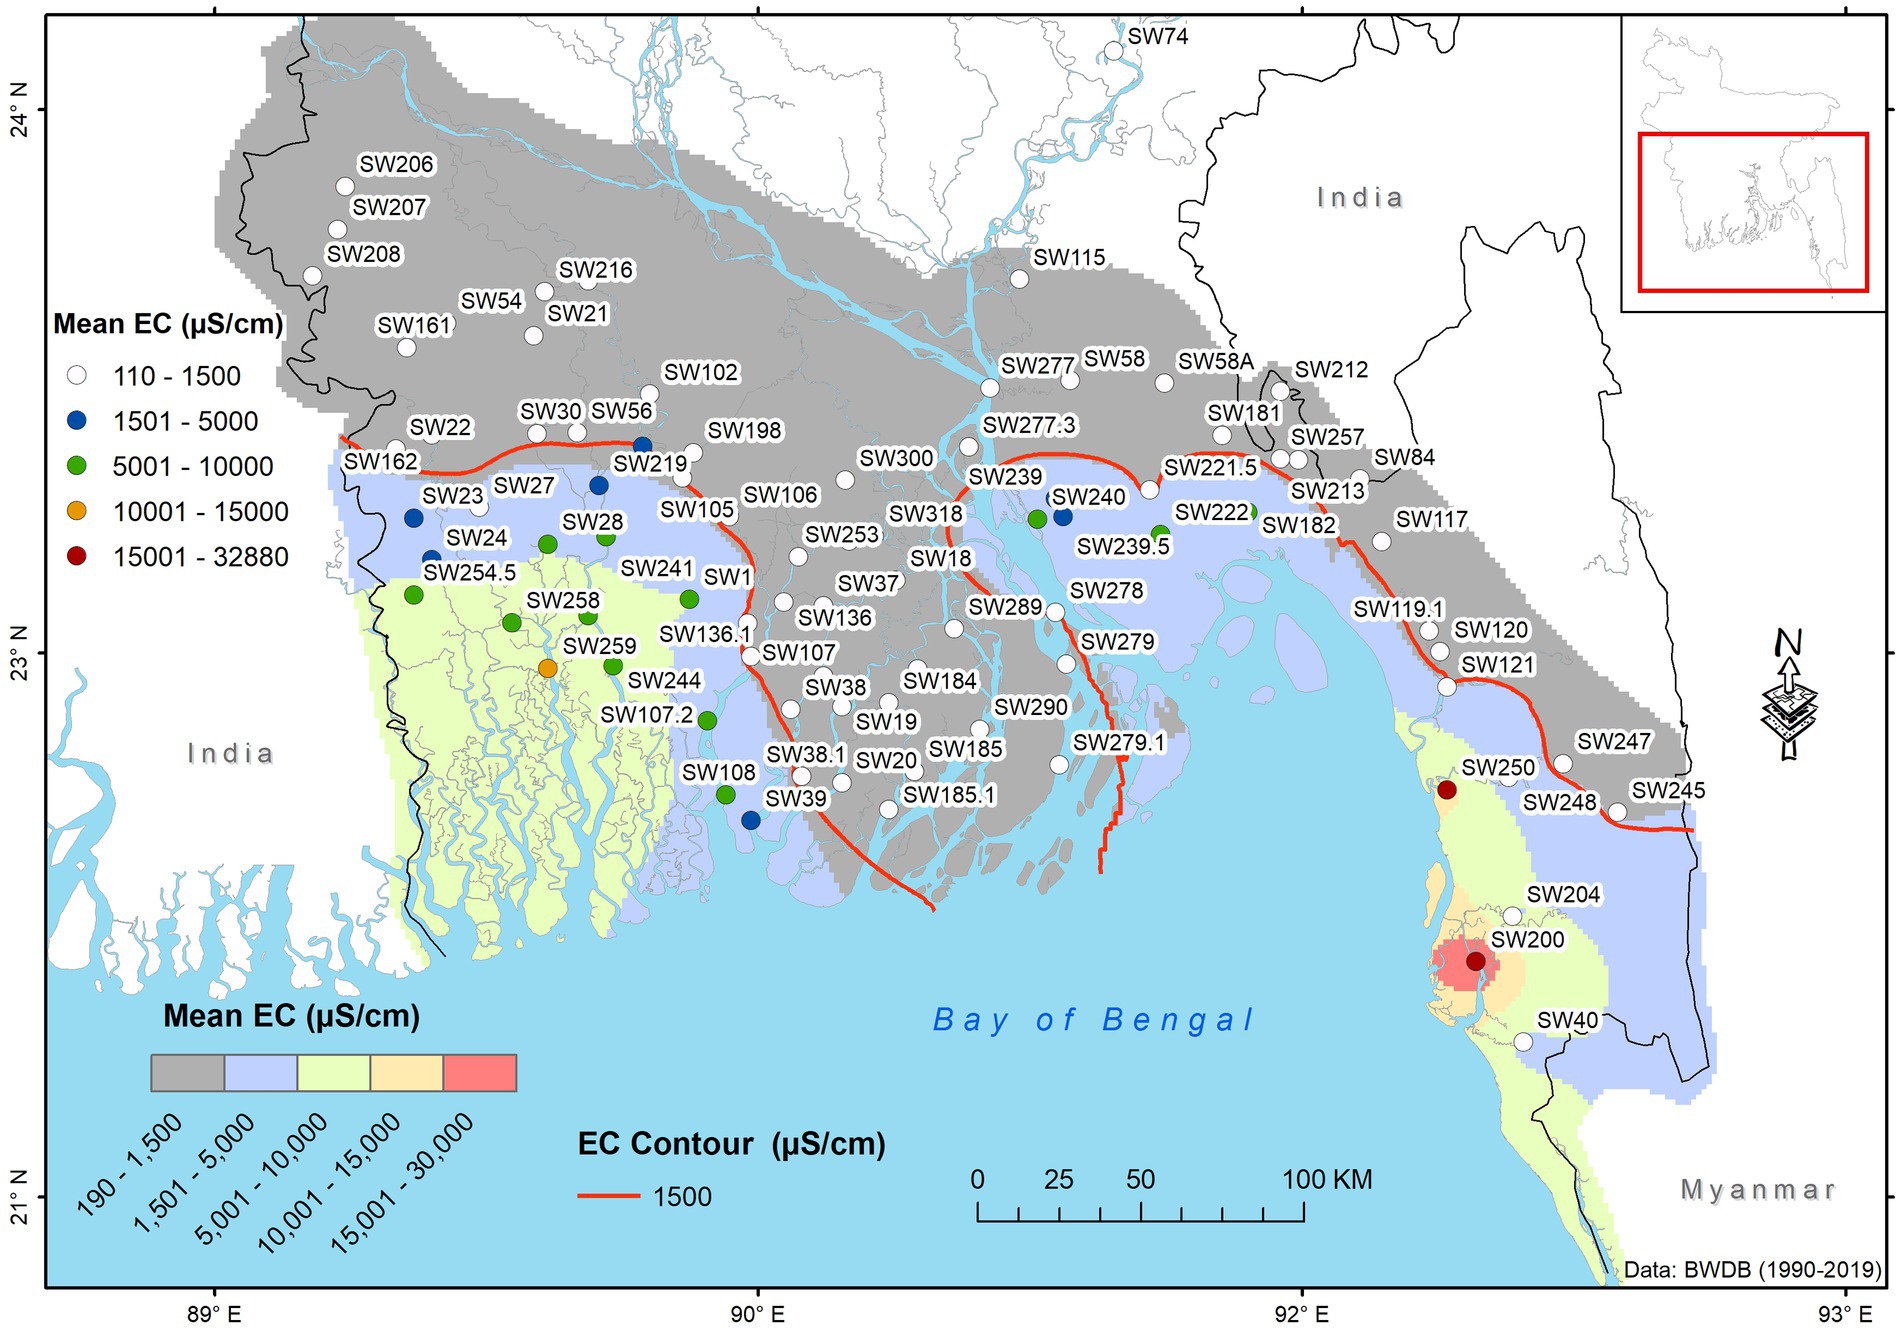
Figure 4. Long-term (1990–2019) mean values of surface water salinity (EC) in the coastal region of the Bengal Basin (shaded circles), interpolated by Empirical Bayesian Kriging, freshwater contour (1,500 μS/cm) line shown in red; data derive from BWBD surface water salinity monitoring stations (N = 86). Uncertainty in interpolated salinity contours is such that some individual point values exceed or fall below contour intervals.
Surface water salinity in the southeast (SE) coastal region is higher and more variable, influenced by some extreme values (Figure 4). Very high surface water salinity is observed around Chittagong and Cox’s Bazar where monitoring stations are close (<25 km) and well connected to the sea. Low to moderate surface water salinity is observed in the interior part of Chittagong and Hill Tracts and exposed part of Noakhali and Laxmipur. Surface water salinity monitoring stations located near the Meghna basin outlet at Naokhali and Laxmipur (Figure 4) show low salinity (1,500 to 5,000 μS/cm).
At most surface water salinity monitoring stations in the coastal region of Bangladesh, mean EC values are below 10,000 μS/cm, except for three stations (Supplementary Figure S3A): River Shibsa in Koyra, Khulna (14,500 μS/cm); River Sangu in Banshkhali, Chittagong (20,400 μS/cm) and Maheshkhali Channel in Maheshkhali, Cox’s Bazar (32,900 μS/cm). The latter two stations are located very near the open sea and their EC values are close to that of seawater (~50,000 μS/cm). An increasing trend in the lower 5th percentile is also observed in Maheshkhali Channel and River Shibsha (Supplementary Figure S3B).
4.2 Outcomes of statistical clustering
Statistical clustering identifies six distinct patterns (i.e., supervised clusters) in the time series of observed salinity changes at 86 stations in coastal Bangladesh (Figures 5A,B; Supplementary Figure S4). These statistically characterised time series patterns demonstrate a clear spatial structure (Figure 6 and Table 1A).
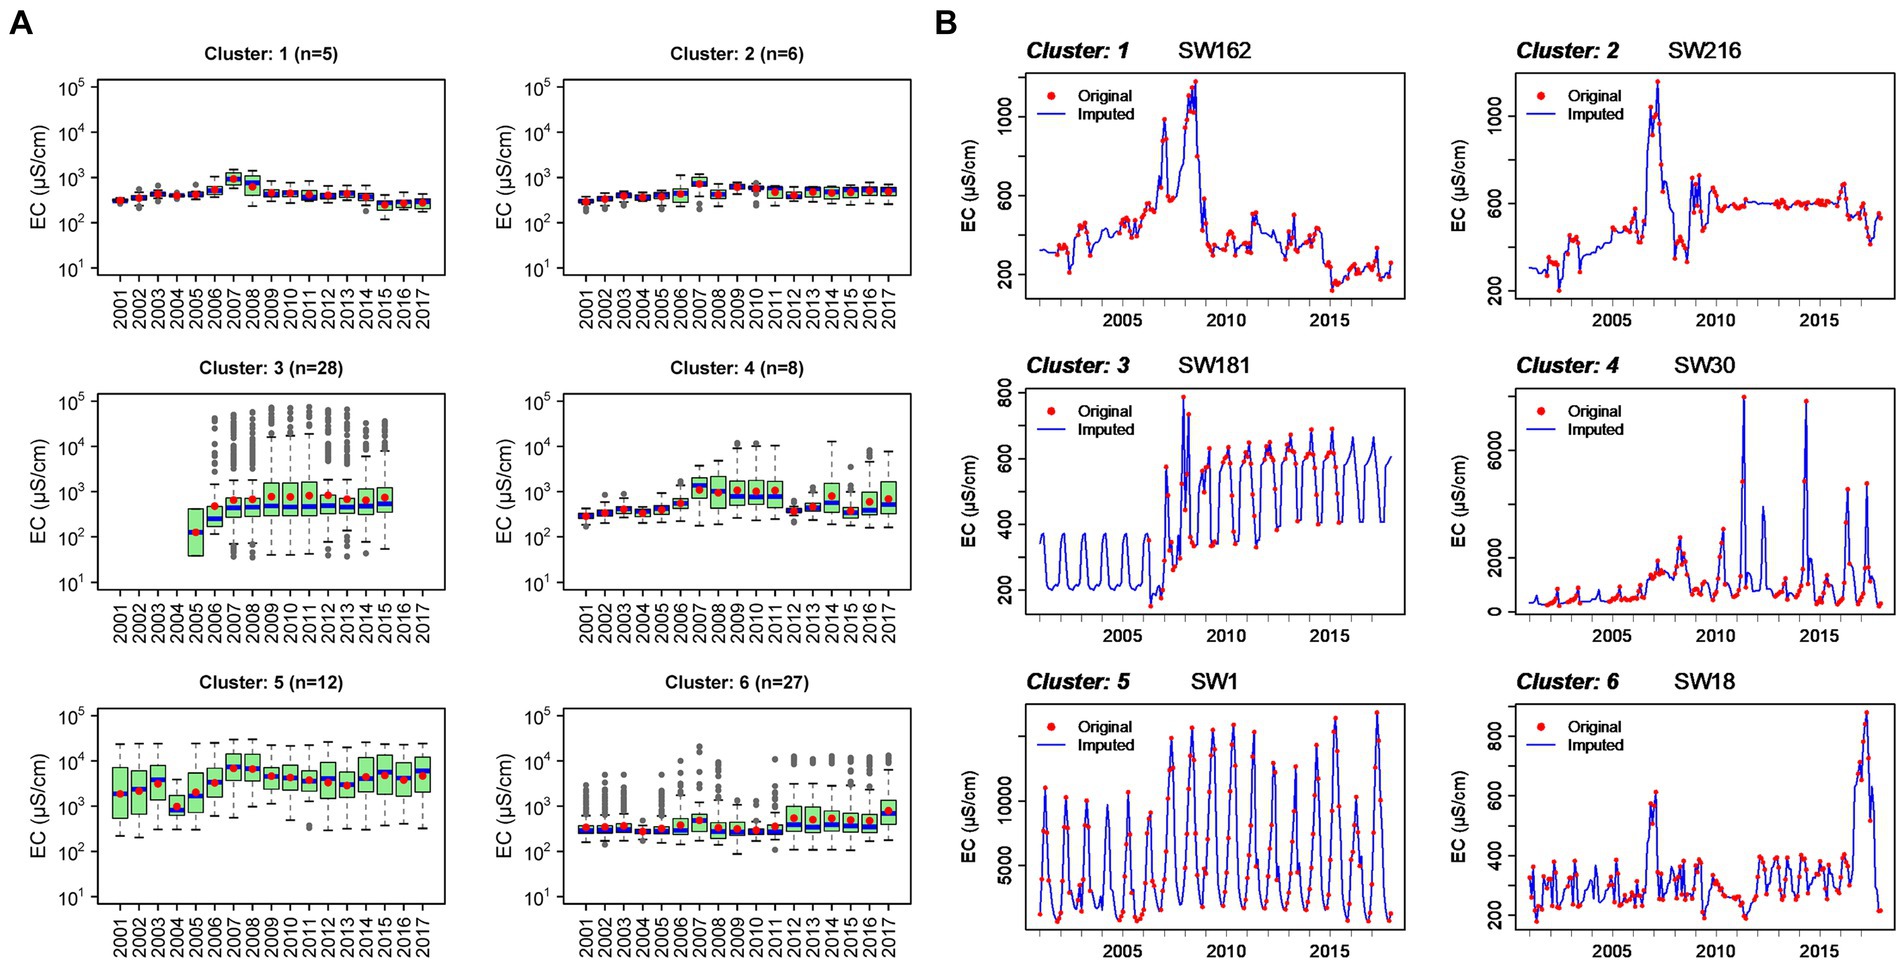
Figure 5. Six supervised clusters of surface water salinity times series patterns defined by Partitioning Around Medoids (PAM) algorithm represented by (A) “box and whisker” plots (whiskers represent minimum and maximum values, boxes represent lower and upper quartiles); blue lines and red dots represent median and mean; (B) representative time series plots for individual stations for each cluster.
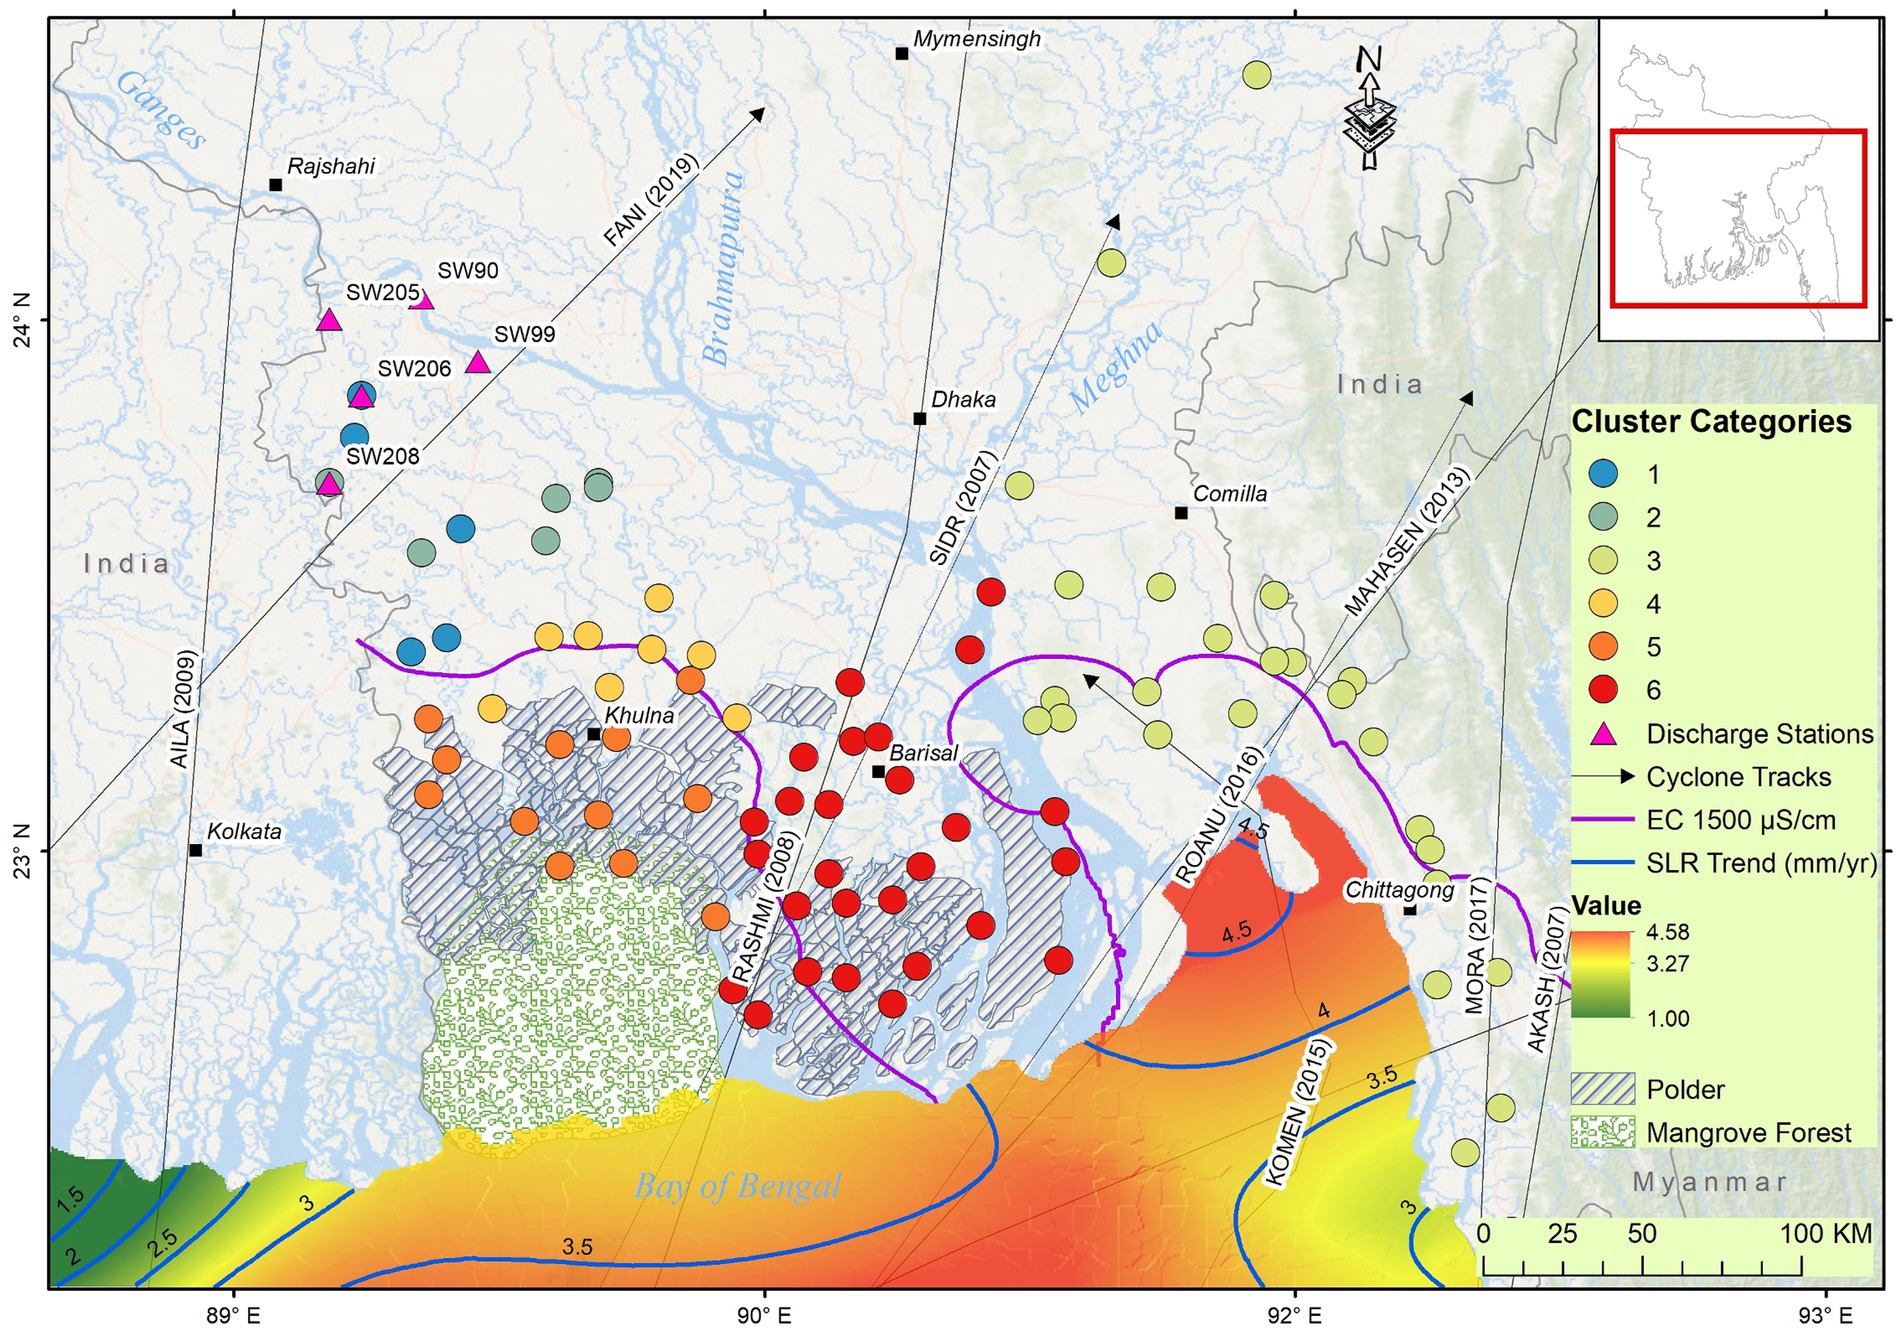
Figure 6. Map showing the location of six supervised clusters defined by Partitioning Around Medoids (PAM) algorithm (N = 86); stations monitoring discharge of River Padma (Ganges); cyclone tracks that made landfall in Bangladesh between 2001 and 2017; trends of sea level rise, both shaded and contoured, revealed from satellite altimetry (AVISO, https://www.aviso.altimetry.fr/en/data.html) data from 1993 to 2021; long-term (2000–2017) mean EC contour (1,500 μS/cm); location of earthen embankments (polders).
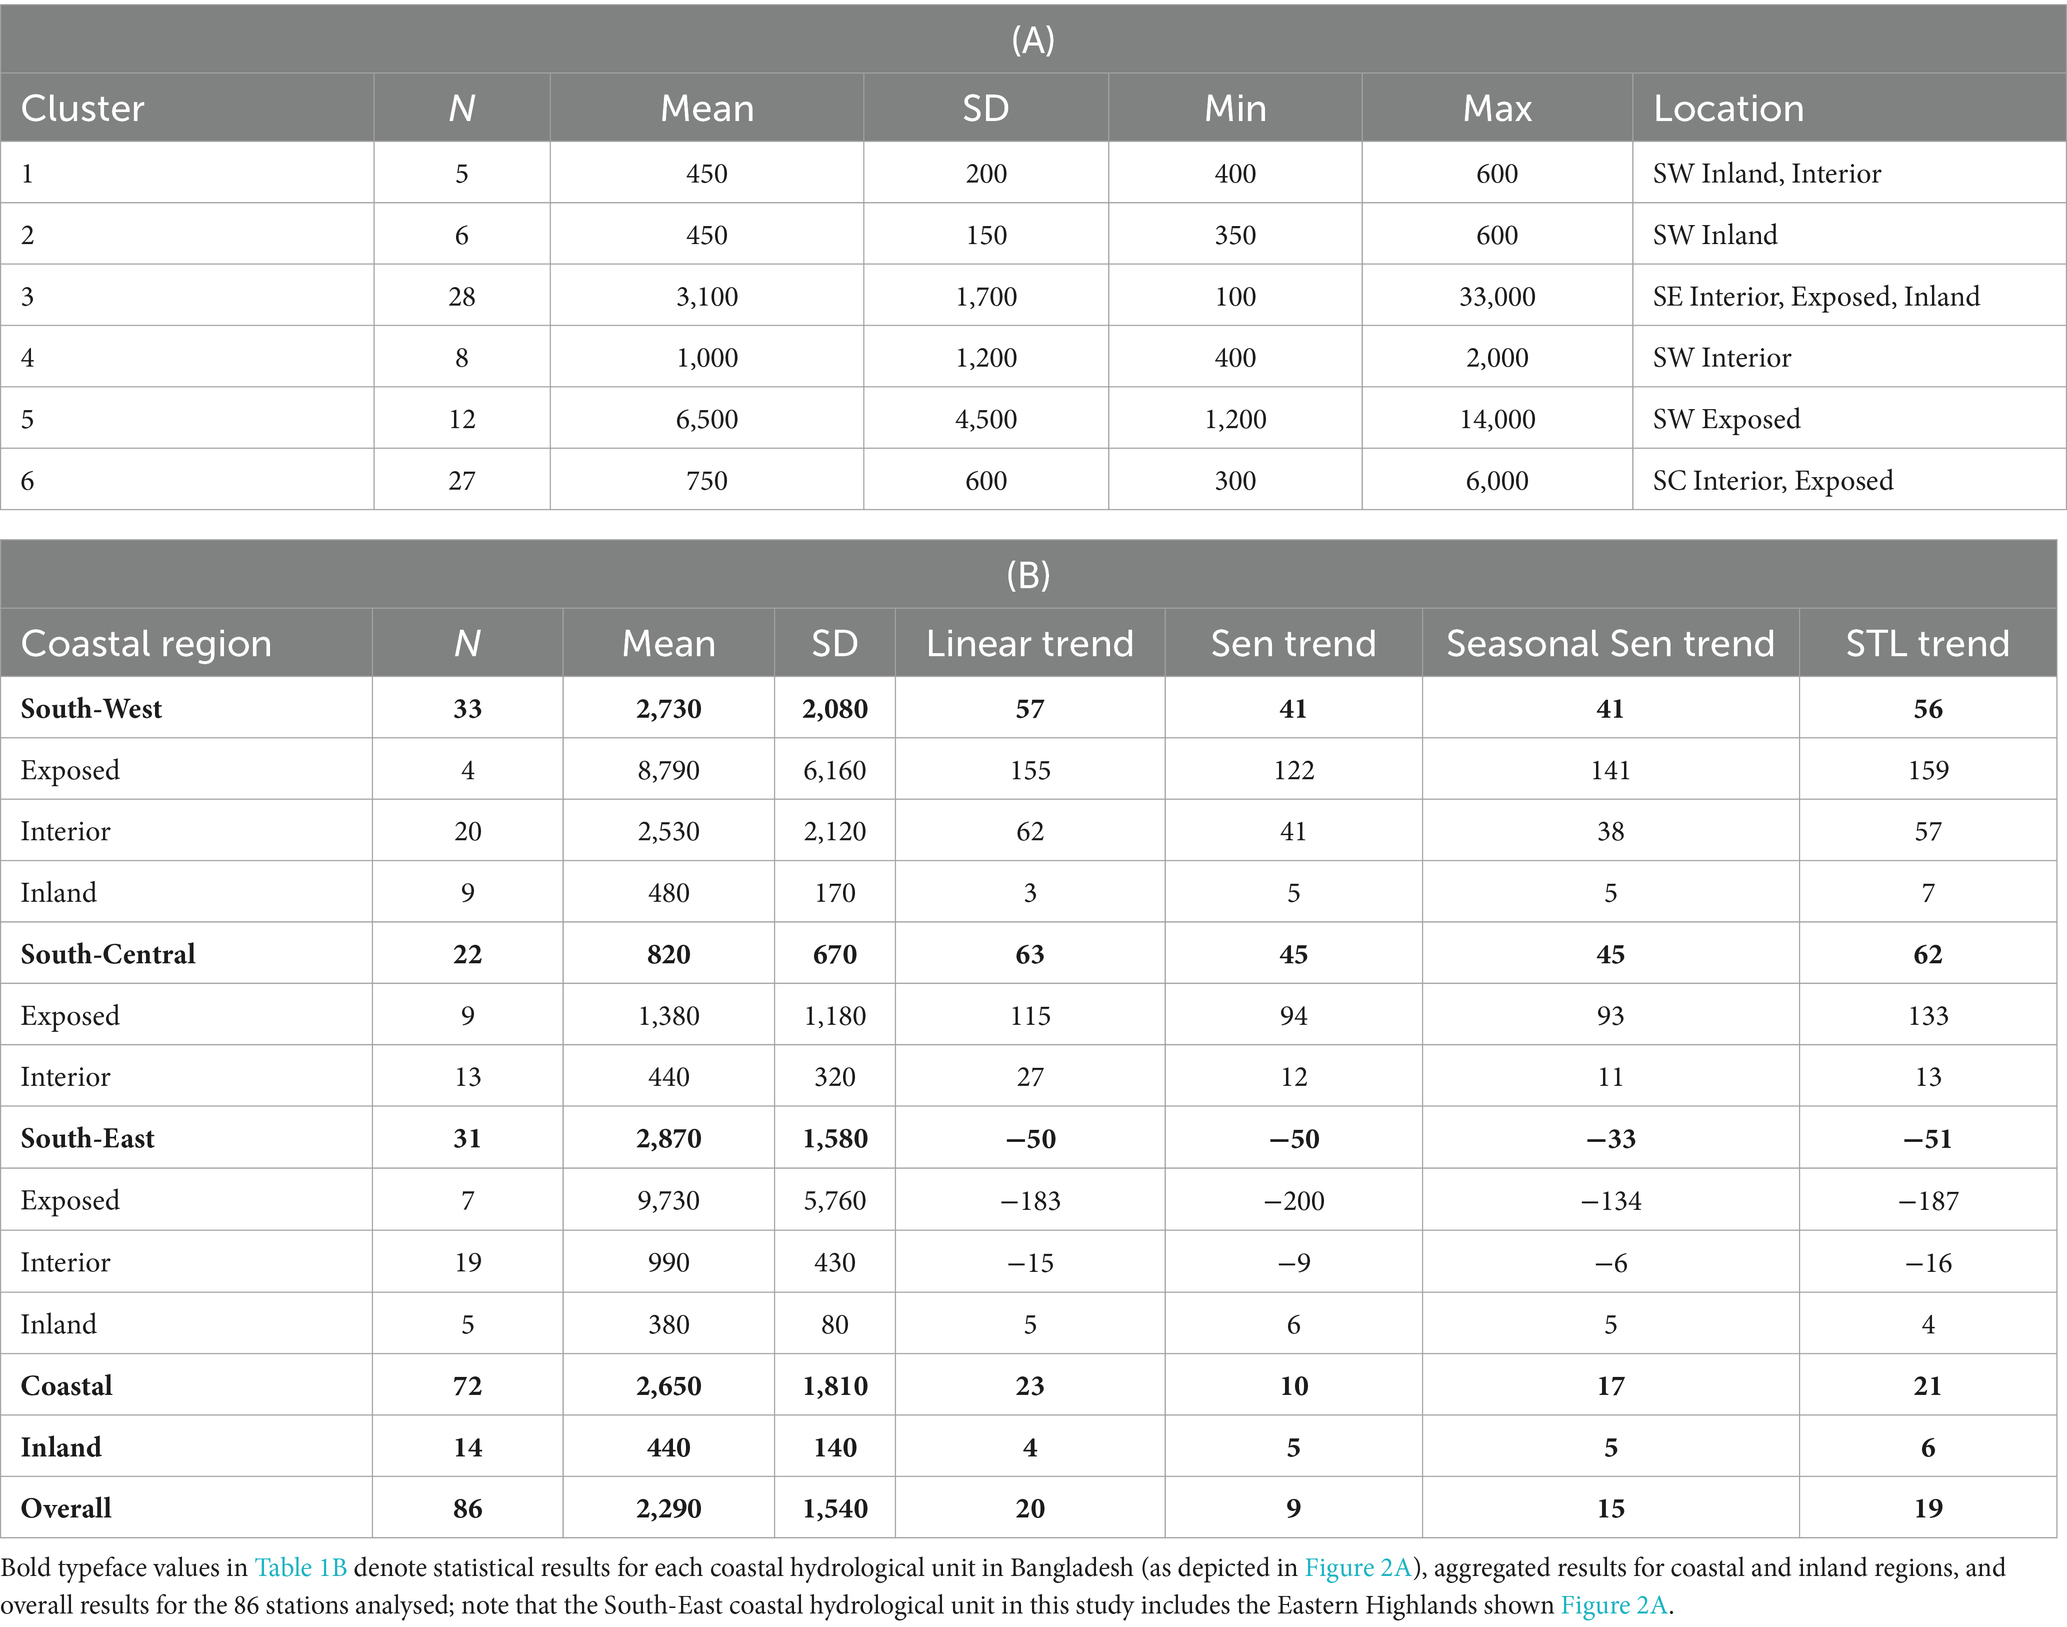
Table 1. (A) Descriptive statistics [mean, standard deviation (SD), minimum, maximum] from 2001 to 2017 of electrical conductivity (EC, μS/cm) values for each of the six supervised statistical clusters; (B) mean values (μS/cm) and trends (μS/cm per year) in surface water salinity (EC) from 2001 to 2017 by coastal region (N = 86) computed using linear regression, Theil-Sen trend estimator, and season-trend decomposition using Loess (STL); SD, standard deviation.
Clusters 1 (N = 5) and 2 (N = 6) describe observed changes in surface water salinity in the SW interior coast. Here, the mean salinity is generally low (mean= ~450 μS/cm; SD = ~200 μS/cm) and varies minimally (Figures 5A,B). A small but distinct positive deflection (i.e., rise) in salinity is observed in 2007 in both clusters. Time-series records in cluster 1 show evidence of recovery from this rise in salinity whereas time series records in cluster 2 do not (Figures 5A,B).
Cluster 3 comprise 28 time-series records from monitoring stations in the SE exposed and interior coastal regions (Figures 2, 5, 6). Mean salinity in these records is almost an order of magnitude higher (mean = ~3,100 μS/cm; SD = ~1,700 μS/cm) with a high seasonal range (~80,000 μS/cm) and a step-change rise in salinity in 2007 (Figures 5A,B) affecting seasonal lows and highs such that the amplitude of seasonal oscillations remain consistent (Figures 5A,B).
Cluster 4 (N = 8) comprises time series records with a mean salinity of ~1,000 μS/cm (SD = 1,200 μS/cm) that is found in a transition zone in the SW (Figure 6) between the exposed and interior coastal regions (Figure 2). Rises in surface water salinity are observed in 2007 and 2014 but there is also evidence of a partial recovery to lower salinities as well as a shift to more frequent higher seasonal salinities (Figures 5A,B).
Cluster 5 (N = 12) includes stations found in the SW coastal region, just north of the Sundarbans (Figure 6), where the mean surface water salinity is brackish (~6,500 μS/cm; SD = 4,500 μS/cm). Here, there is a noticeable increase in peak surface water salinities in 2007 and 2014; this peak salinity continues to rise, increasing the seasonal amplitude in observed salinity as seasonal low salinities remain effectively constant (Figures 5A,B).
Cluster 6 (N = 27) is found in the south-central coastal area (Figure 6) in both the exposed and interior coastal regions (Figure 2A). As noted above (Figure 4), mean surface water salinities are low, consistent with freshwater (mean = ~750 μS/cm; SD = 600 μS/cm). Rises in surface water salinity are visible in 2007, 2011 and 2017 (Figures 5A,B; Supplementary Figure S5); seasonal oscillations in surface water salinities recover quickly but there is evidence of a trend toward rising salinities over the time series as reported above.
4.3 Insight from a Seasonal-Trend decomposition procedure based on Loess (STL)
STL decomposition of time-series records of surface water salinity reveal the respective contributions of seasonality, trend and residuals to the overall variance observed in the coastal region of Bangladesh (Figure 7). Variance in surface water salinity in the SW exposed coastal region (cluster 5) is dominated (>80%) by seasonality. Seasonal components continue to explain some of the variance in salinity observed in the SW interior coastal region (cluster 4) just north of Khulna where monitoring stations are connected (proximate) to major distributaries. In SW inland coastal region (clusters 1 and 2) remote from major distributaries, trend (and residual) components explain almost all of the observed variance in surface water salinity. In the SC coastal region (cluster 6), much (50 to 60%) of the variance in surface water salinity is explained by the trend component. In the SE coastal region (cluster 3) no consistency is observed in the dominance of seasonal, trends or residual components.
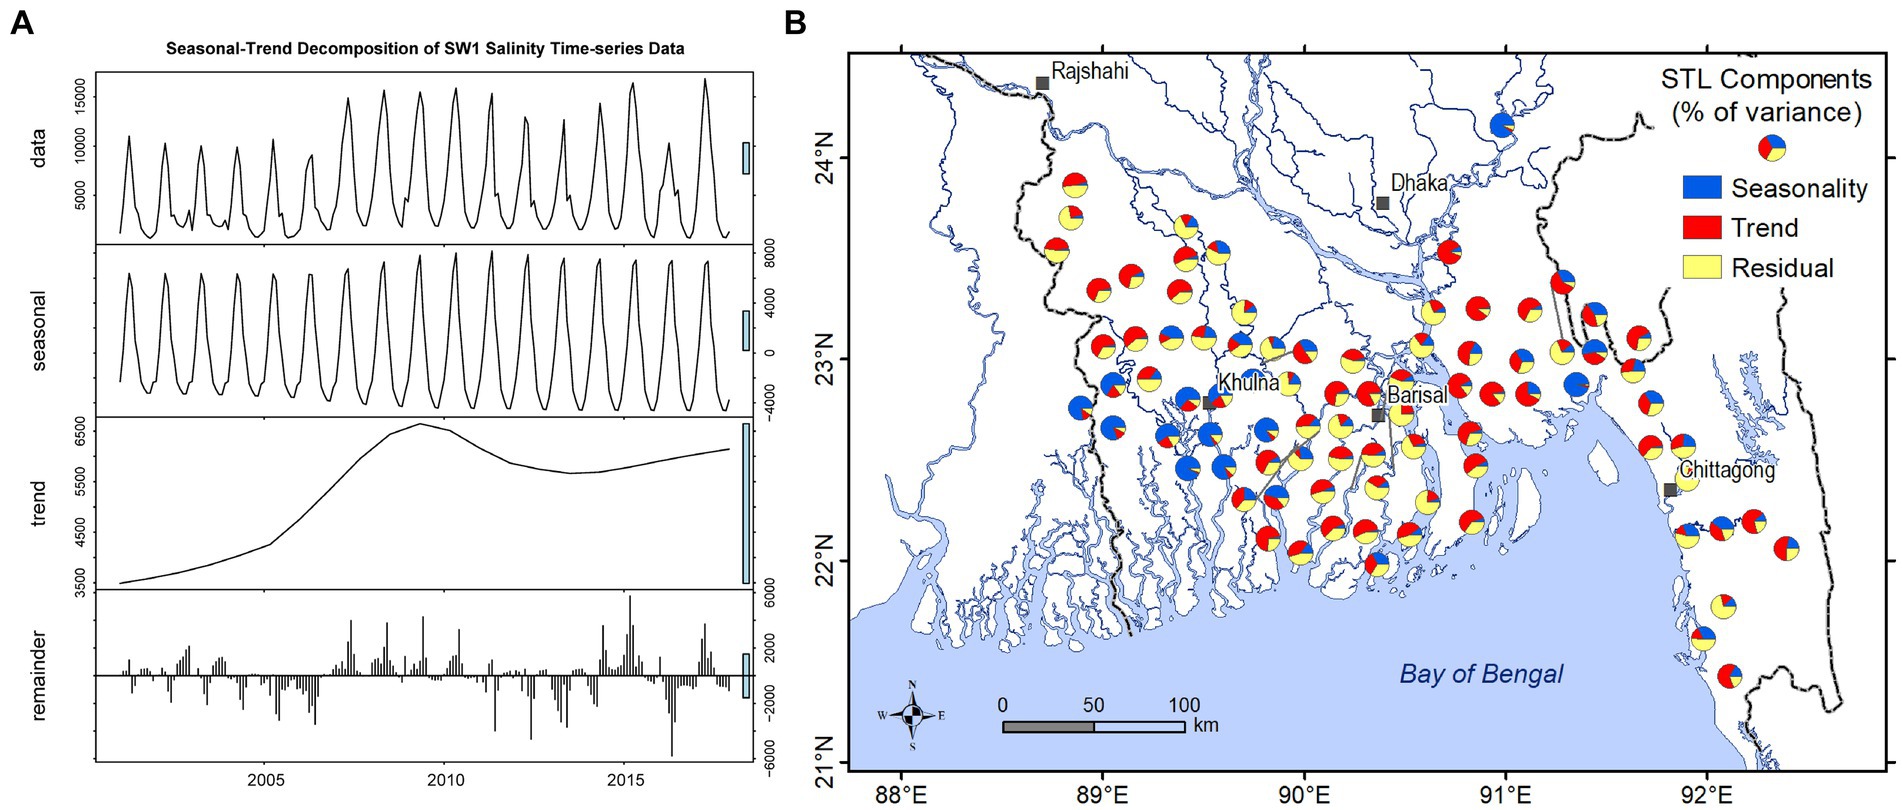
Figure 7. (A) STL plot of the surface water salinity time series data EC (μS/cm) for SW1 from cluster 5. (B) Contribution of various STL components, e.g., seasonal, trend and residual in surface water salinity monitoring stations (N = 86) expressed as relative proportions of variance (%).
4.4 Seasonality in surface water salinity
Surface water salinity time-series exhibit seasonal regimes of varying amplitudes across the 86 stations. For clusters 1, 2, 3 and 6 in the SW inland, SC, and SE coastal regions, surface water salinity is highest during the dry season between February and April and lowest during the monsoon from June to August (Supplementary Figure S6), consistent with simulations by Bricheno et al. (2021) and Bricheno and Wolf (2018). The amplitude of these seasonal variations in surface water salinities is small (<30%) relative to clusters 4 and 5 in the SW exposed and interior coastal regions (>100%) where peak salinities occur later in the dry season in April and May and lowest salinities are observed in October and November.
During the post-monsoon season from September to November (Figure 8A), surface water salinity across the entire coastal region is below 10,000 μS/cm and remains fresh (<1,500 μS/cm) in the SC region. During the dry season, surface water salinities rise considerably in the SE and SW exposed coastal regions, the latter just north of the Sundarbans (Figure 8B). Here, the contour between fresh and brackish water migrates between 20 and 40 km northward during the dry season (Figure 8C). In terms of magnitude, surface water salinity increases 3 to 5 times that observed in the wet season. In the SE, surface water salinity doubles at some monitoring stations near the sea whereas in the SC coastal region surface water remains fresh (<1,500 μS/cm), though the spatial extent of this freshwater zone shrinks slightly during the dry season.
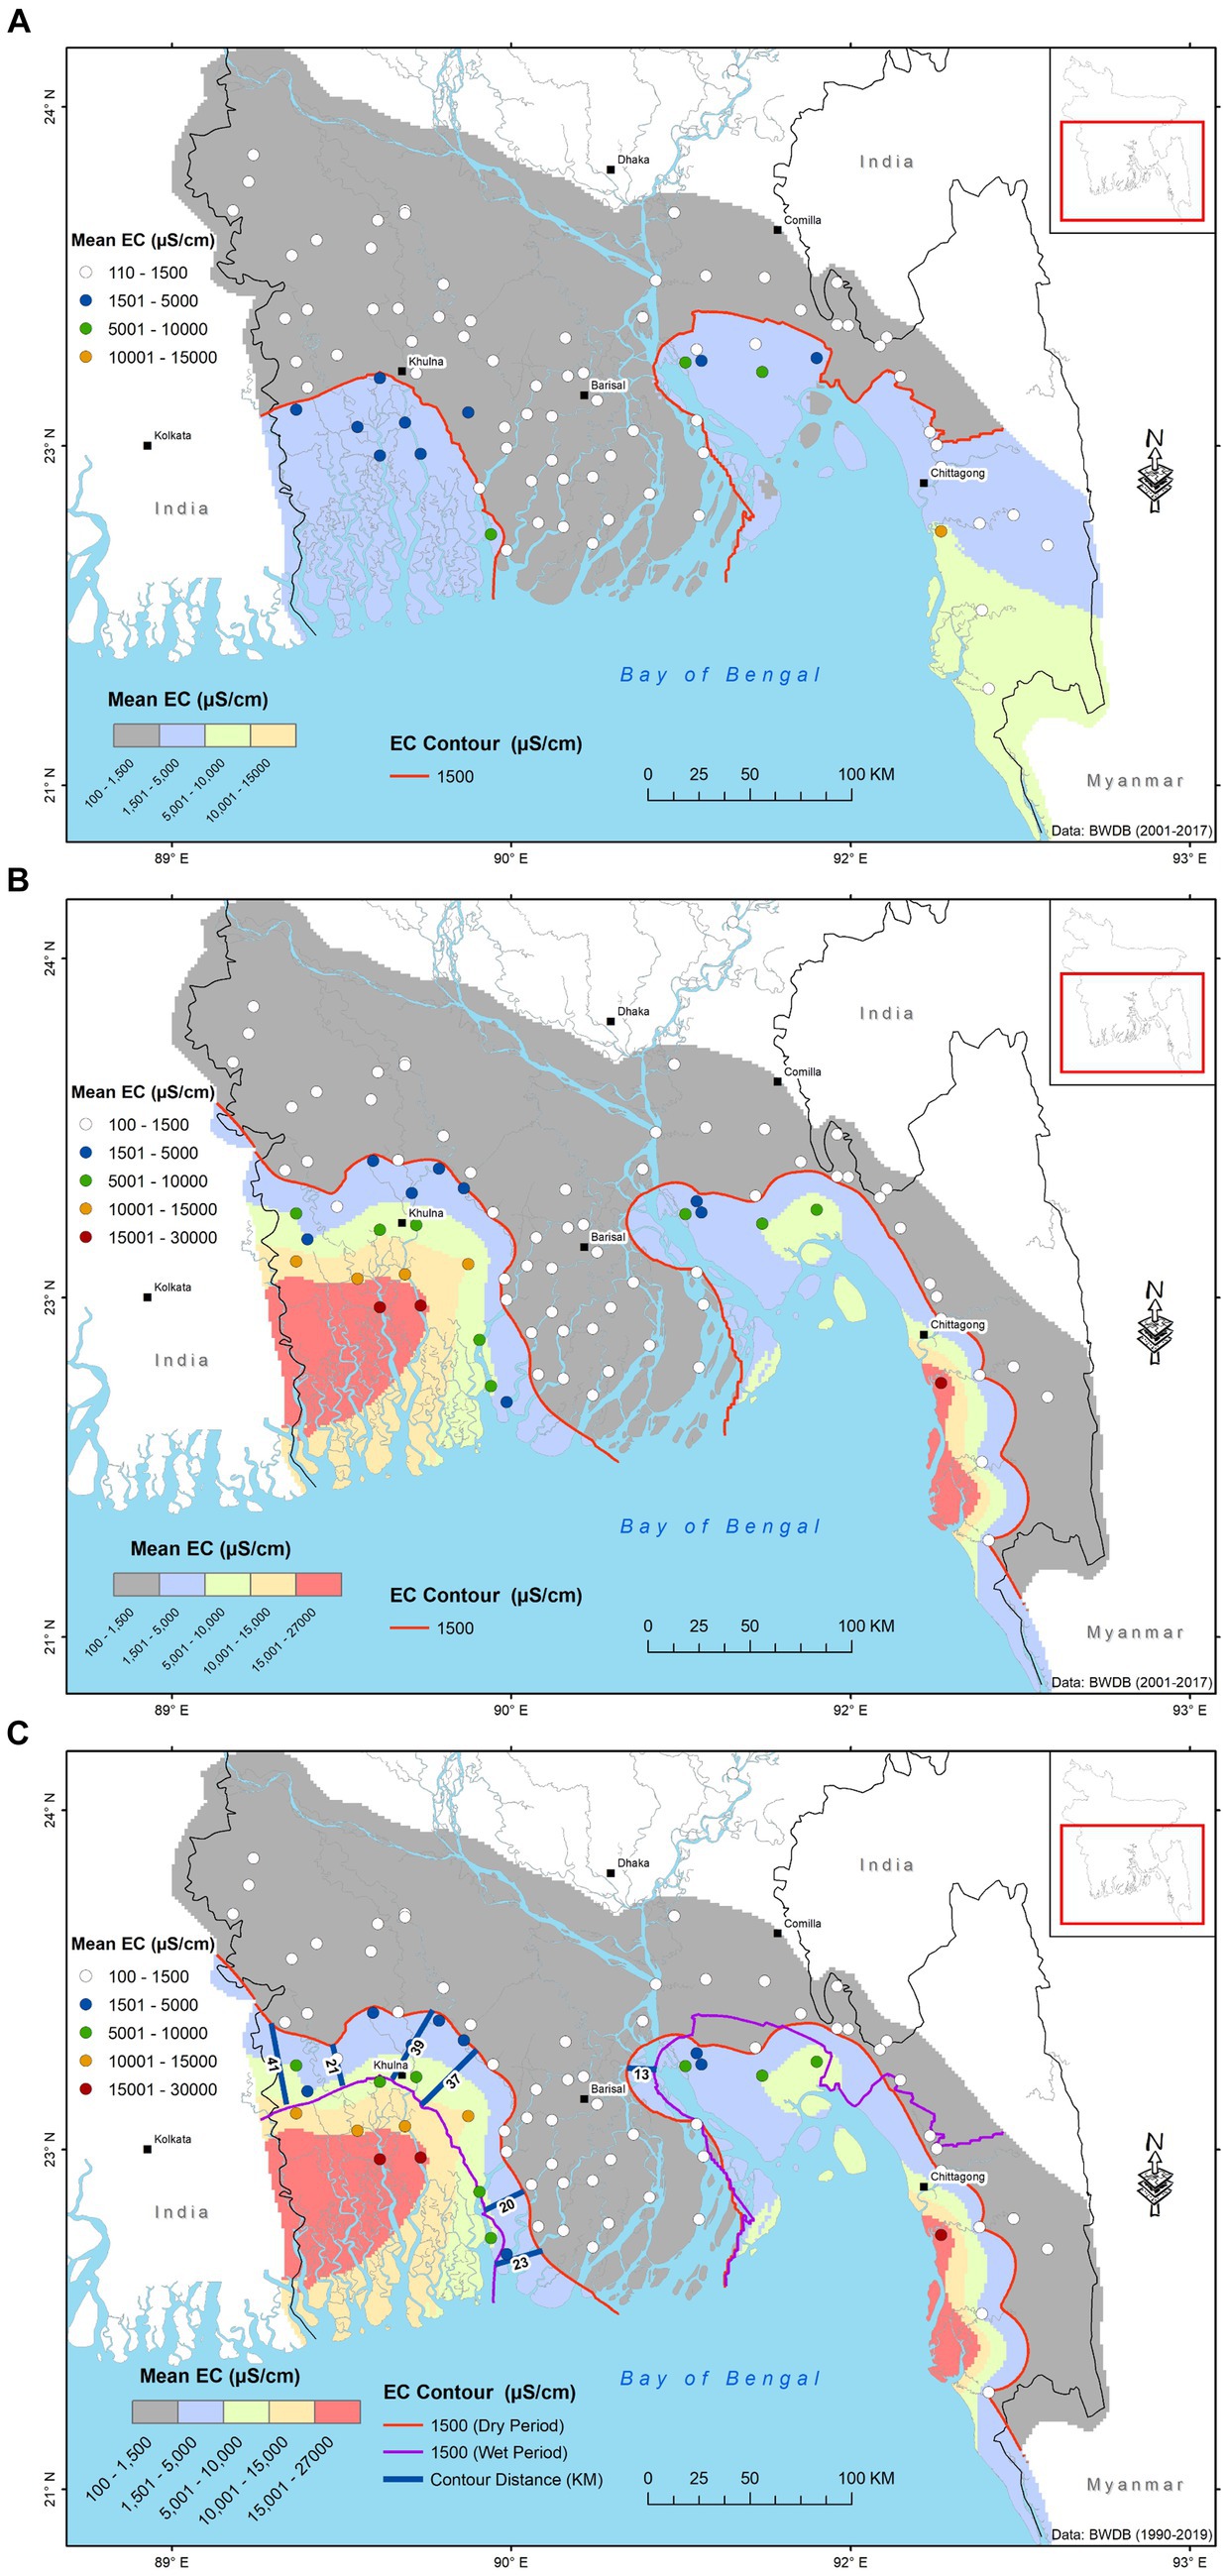
Figure 8. Long-term mean seasonal distribution of surface water salinity (2001–2017) EC (μS/cm) (A) wet season (September–November) salinity; (B) dry season (March–May) salinity; (C) seasonal shifts in surface water salinity contour (1,500 μS/cm) superimposed on dry period mean surface water salinity. Uncertainty in interpolation explains the anomaly observed between the dry and wet season contours in the SE coastal region.
4.5 Long-term trends in surface water salinity
Spatiotemporal changes in surface water salinity depicted in Figure 9 show how surface water salinity has evolved over the last two decades (2000–2019); the very limited number and distribution of observations from 1990 to 1999 prevent meaningful representations of salinity prior to 2000 (Supplementary Figure S5). Two major changes that can be observed by comparing Figures 9A,B are: (i) a generalised increase in salinity in the SW coastal region; and (ii) shrinking of the freshwater (<1,500 μS/cm) “pocket” in the SC coastal region.
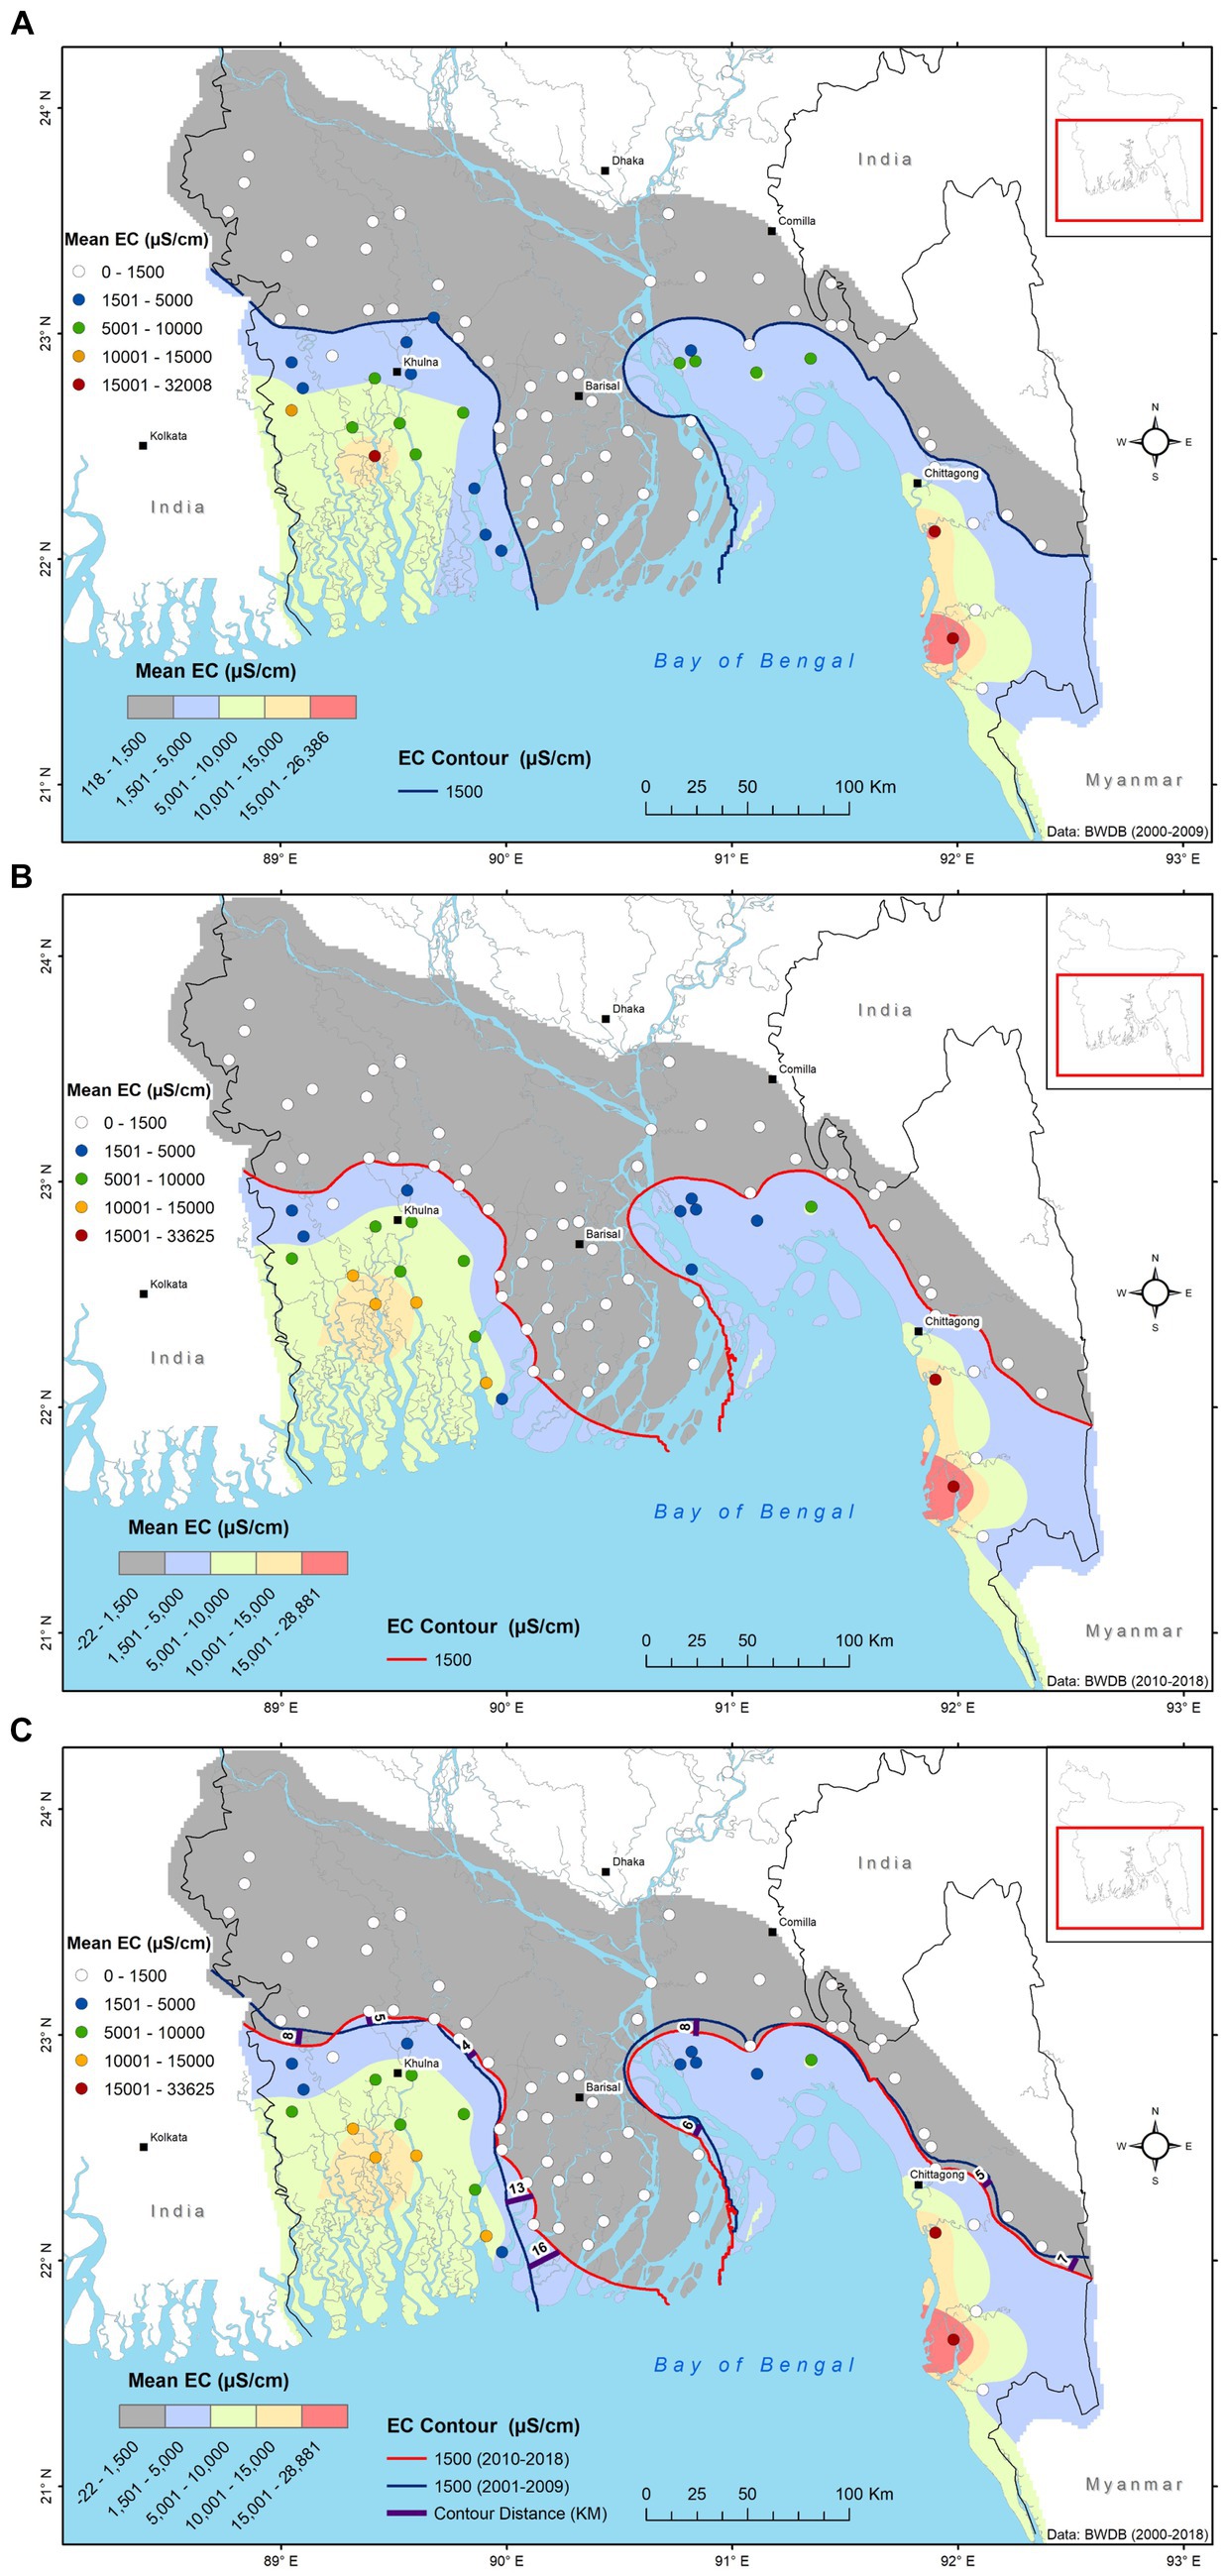
Figure 9. Decadal changes in the spatiotemporal distribution of surface water salinity in the coastal zone of Bangladesh over two decades: (A) mean surface water salinity from 2000 to 2009; (B) mean surface water salinity from 2010 to 2018; (C) changes in surface water salinity contour (1,500 μS/cm) between periods 2000–2009 and 2010–2018.
Long-term trends in surface water salinity over the last two decades 2001–2017 are mapped in Figure 10 and summarised in Table 1A. Overall, there is a rising trend of surface water salinity in the coastal region. Moderate to high positive trends (+100 to +450 μS/cm per year) in surface water salinity are observed in the exposed SW coastal region up to Khulna and parts of the SE coastal region near Chittagong. Lower positive trends in surface water salinity (+1 to +100 μS/cm per year) are observed in the rest of the coastal region including the SC region; marginally negative trends (i.e., reducing salinity) are computed in the interior and inland SW coast north of Khulna and western part of SC coast south of Comilla; these are thought primarily to derive from uncertainty and data gaps in the times series observations. Substantial increases in salinity are observed primarily in the SW coastal region, north of The Sundarbans. Highest trends are observed near Khulna (e.g., stations SW258—River Shibsa in Paikgacha, SW28—River Bhadra in Dumuri) and further south (e.g., SW107.2—River Gorai-Madhumati in Sarankhola Bagerhat, SW 108—River Gorai-Madhumati in Barguna, Patharghata). Most stations in the interior coast show marginally increasing (<70 μS/cm per year) salinity; marginally increasing salinity is also observed in the south-central exposed coastal region.
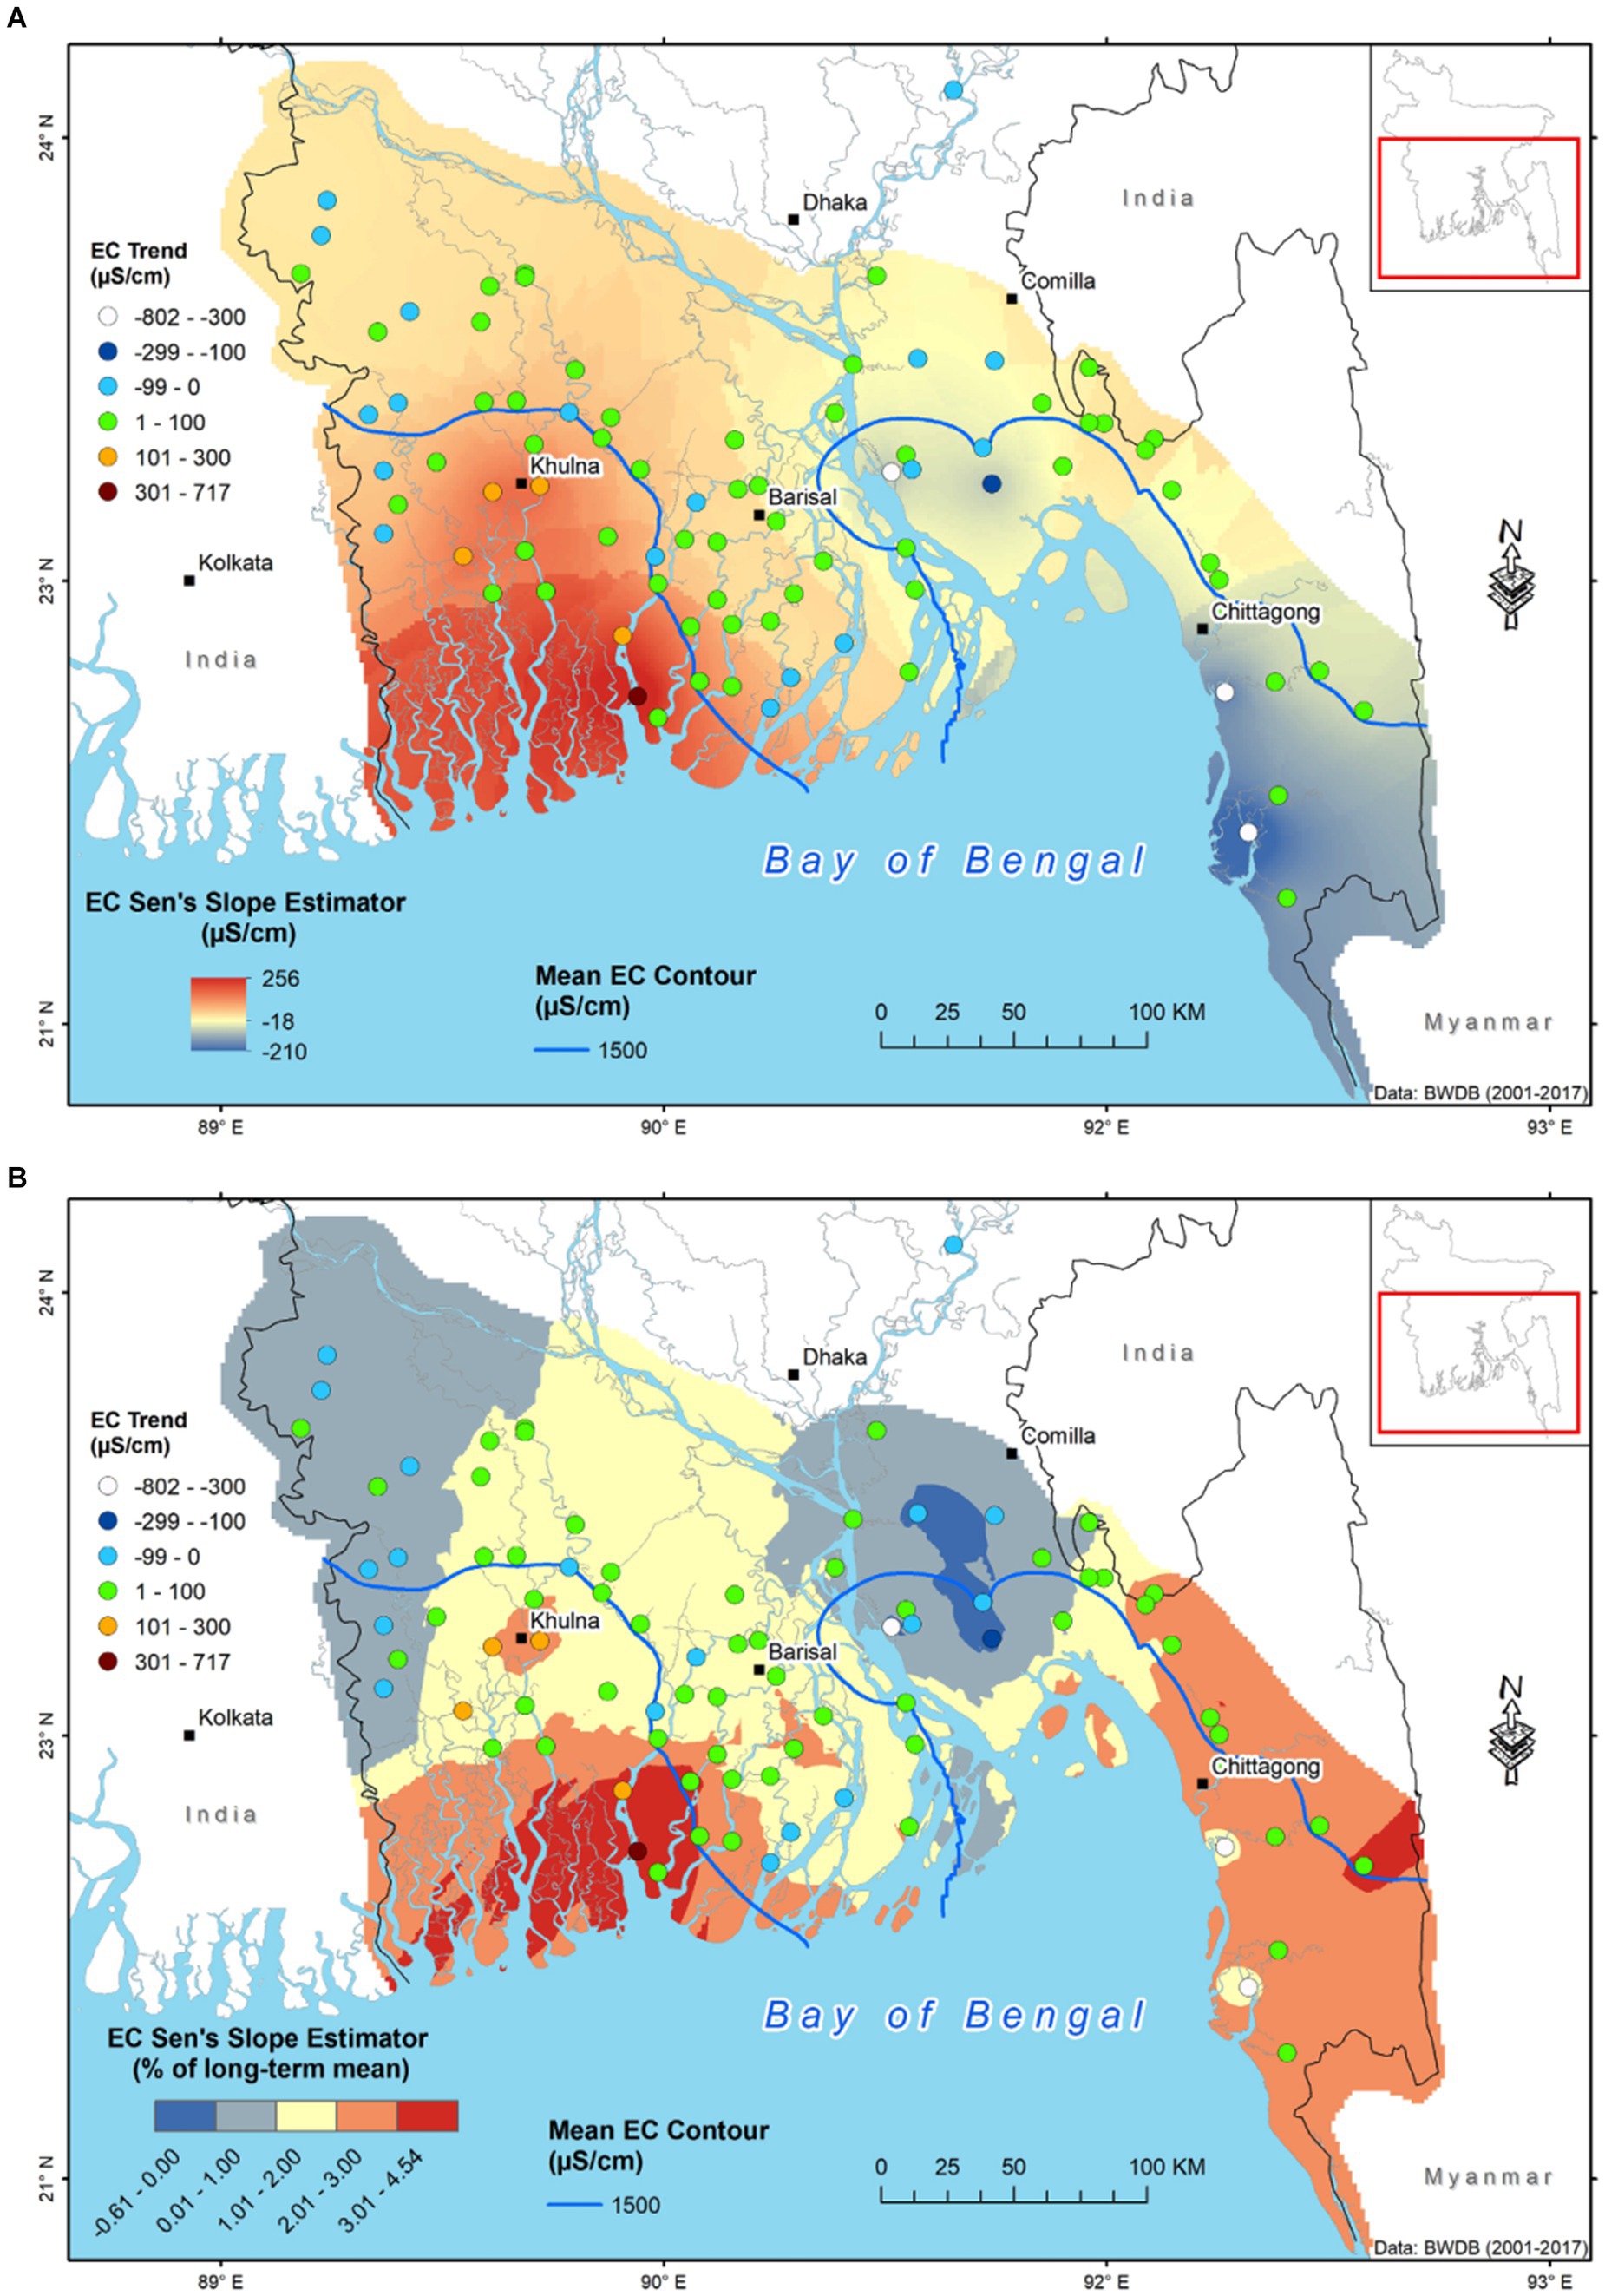
Figure 10. Long-term trends in surface water salinity (EC) superimposed on long-term mean 1,500 μS/cm EC contours (2001–2017) using (A) Sen’s slope estimator (B) trend as a percentage of long-term mean.
4.6 Responses to tropical cyclones
From 2006 to 2009, five tropical cyclones hit the coastal region of Bangladesh including severe cyclones Sidr in 2007 and Aila in 2009 (Supplementary Figure S4; Figure 11). Notwithstanding sharp increases in surface water salinity observed in 2007 within each cluster across the coastal region, these rises preceded the landfall of cyclone Sidr in mid-November of 2007. They are pronounced in stations within clusters 1, 2, 4 and 6 where mean surface water salinities are comparatively lower than stations within clusters 3 and 5 (Table 1B). Figure 11 compares mean surface water salinity between the period of 2001 to 2005 and that of 2006 to 2010. An increase in the magnitude of surface water salinity and area with a mean salinity exceeding that of freshwater (EC = 1,500 μS/cm) is observed between these periods in the SW coastal region where the freshwater contour migrated between 11 and 28 km northward and between 4 and 22 km eastward.
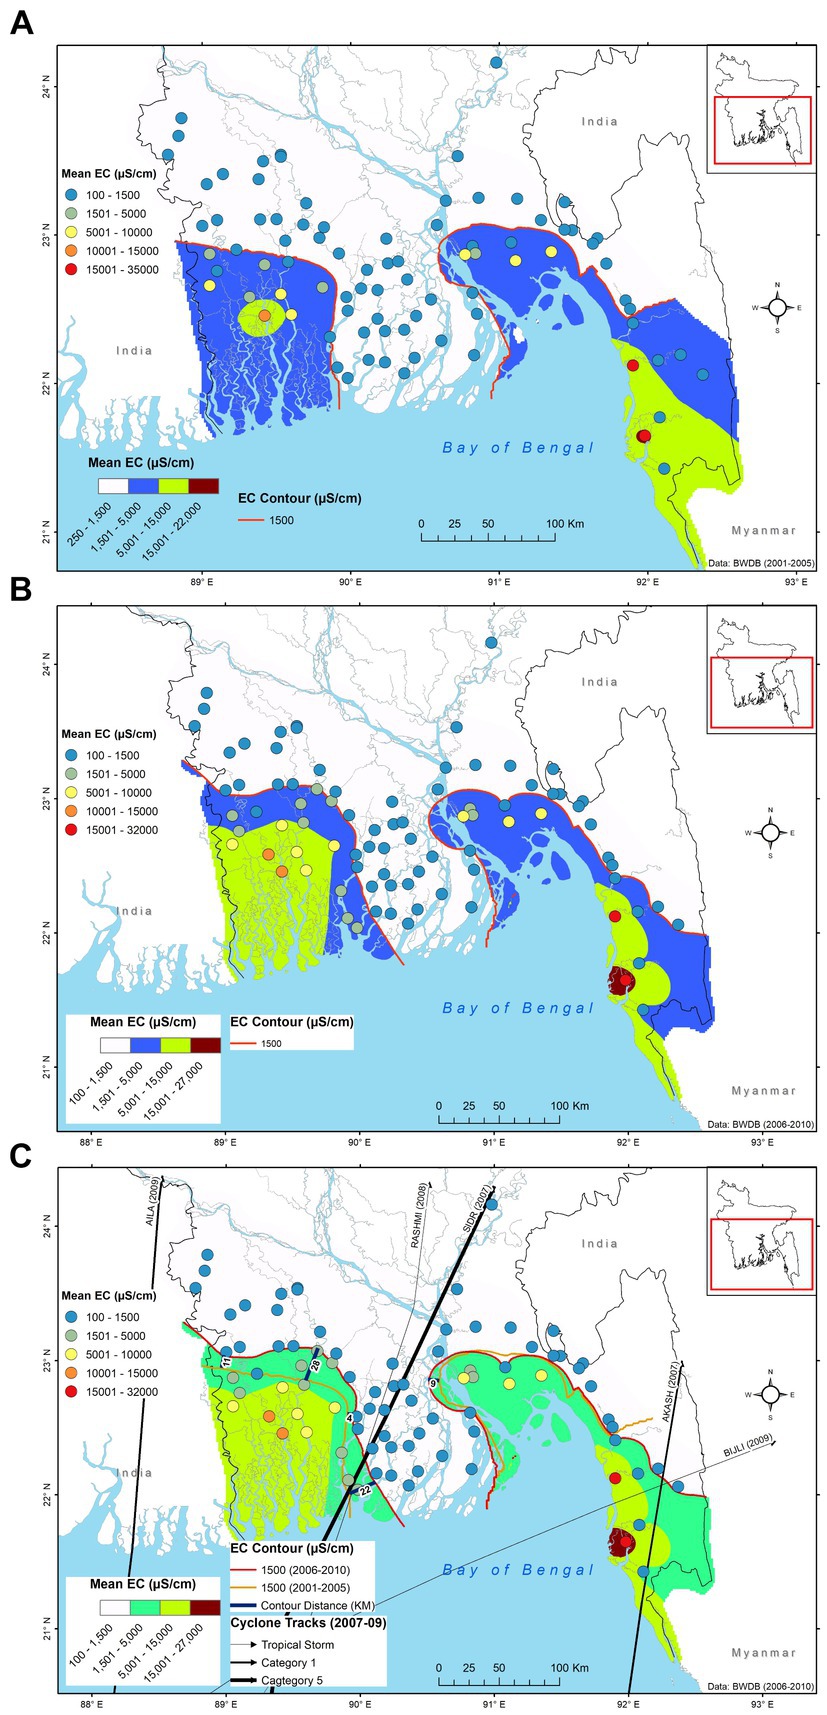
Figure 11. Changes in the surface water salinity distribution between the intervals of 2001 to 2005 and 2006 to 2010: (A) mean surface water salinity from 2001 to 2005 (pre-cyclone); (B) mean surface water salinity from 2006 to 2010 (post-cyclone); (C) changes in surface water salinity contour (1,500 μS/cm) between pre-cyclone and post-cyclone periods and the cyclone tracks that made landfall in Bangladesh between 2007–2009 period.
5 Discussion
Previous research (Yu et al., 2010; Salehin et al., 2018; Akter et al., 2019, 2020; Sherin et al., 2020; Bricheno et al., 2021; Feist et al., 2023) has identified three major factors that influence the salinity of surface waters in coastal deltaic environments in the tropics: (i) changes in the magnitude and seasonality of upstream river discharge; (ii) sea-level rise and seasonal tidal fluctuations; and (iii) the intensity and frequency of tropical cyclones and storm surges. At local scales, it has also been suggested that surface water salinity regimes are influenced by land-use change and human interventions such as coastal embankments known locally as “polders” and dry-season irrigation from surface waters and wells (Ayers et al., 2017; Islam et al., 2019; Shamsudduha et al., 2022). We examine below the extent to which these regional to local-scale influences and their interactions explain observed variations in surface water salinity from 86 stations in the Bengal Basin of Bangladesh.
5.1 Changes in the magnitude and seasonality of river discharge
Variations in river discharge (Q) across the coastal region of the Bengal Basin provide a compelling explanation for the spatial structure in observed surface water salinity in Figure 4. Surface water salinities are higher and more variable in the SW exposed (mean: 6,500 μS/cm, SD: 4,500 μS/cm) and interior (mean: 1,000 μS/cm, SD: 1,200 μS/cm) coastal regions, north of the Sundarbans, relative to the freshwater conditions that persist in the SC (mean: 750 μS/cm, SD: 600 μS/cm) coastal region (Table 1A). Freshwater fluxes to the SW coastal region derive from distributaries within the moribund delta draining the River Padma (see locations of gauging stations on Rivers Gorai (SW99) and Mathavanga (SW205) in Figure 6) with a combined mean Q (1967–2016) of ~1,200 m3/s (Supplementary Figures S7–S11). In contrast, freshwater discharges to the SC region within the active delta are supplied by the combined contributions from the Rivers Padma (Ganges), Jamuna (Brahmaputra), and Meghna with a combined mean Q of ~37,000 m3/s (Sarker et al., 2003; Palash et al., 2018). Surface water salinities are also high in the SE exposed coastal region (mean: 9,730 μS/cm, SD: 5,760 μS/cm, Table 1B) where the magnitude of freshwater fluxes is constrained by smaller, localised catchment areas (e.g., River Karnaphuli) that drain the Chittagong Hill Tracts to the Bay of Bengal.
Very considerable seasonal variations in the combined discharge of Rivers Padma, Jamuna and Meghna (flood Q: ~140,000 m3/s, dry-season Q: ~5,000 m3/s; see Figure 3 and Table 1 in Palash et al., 2018) occur and explain, in part, observed seasonal variations in the salinity of surface waters in the coastal region, which can vary from 1,000 to >20,000 μS/cm at individual stations (e.g., SW250 and SW1 in Figure 6B; Supplementary Figure S3). Across the coastal region during the monsoon season, observed salinity at all stations but one lie below 10,000 μS/cm (Figure 5A) whereas during the dry season mean EC values at seven stations exceed 10,000 μS/cm (Figure 5B). Dry-season (5th percentile) river discharge (~55 m3/s) to the SW coastal region (SW99, Supplementary Figures S7, S8) reduces to just 1.5% of the mean discharge (1976 to 2015); this seasonal reduction in flow coincides with a shrinking of the SC freshwater zone and seasonal (northward) migration of the freshwater contour (1,500 μS/cm) by ~20 to ~40 km (Figure 5C). Across coastal Bangladesh, observed seasonality in EC is greatest in the SW exposed and interior coastal regions, represented by clusters 4 and 5 (Supplementary Figure S6), and lags behind other coastal zones (Figure 8). It is here within the southern part of the moribund delta where distributaries are least well connected to seasonal freshwater fluxes of the Rivers Padma, Jamuna and Meghna, and their distributaries.
Observed reductions in dry-season (5th percentile) discharge of the River Padma and its distributaries including the River Gorai (Supplementary Figures S7, S9, S10; Ali and Hasan, 2022), the principal dry-season source of freshwater to the SW coastal region (Rahman and Rahaman, 2018), are expected to have enhanced the seasonal (northward) migration of salinity. Hydrological records at Hardinge Bridge (SW90 in Figure 6) on the River Padma reveal a more than 50% decrease from 2,080 m3/s (1963–1975) to 910 m3/s (1976–2015) in the dry-season discharge (Supplementary Figures S7C,D) following the commissioning of the Farraka Barrage in 1975 (Mirza, 1998; Rahman and Rahaman, 2018; Sherin et al., 2020; Feist et al., 2023). The barrage, 18 km upstream of the River Padma (Ganges) from the border between India and Bangladesh, diverts flow from the River Padma (Ganges in India) to the River Hooghly in India. As argued by Goes et al. (2021) and is detectable from time series records of river discharge (Supplementary Figures S7C,D), dry-season flow of the River Padma declined somewhat steadily to ~500 m3/s from 1975 to the mid-1990s; implementation of the 1996 Ganges (Padma) Treaty between India and Bangladesh then led to a partial recovery in the mean dry-season flow to ~1,080 m3/s (1996 to 2015). The reduction in the dry-season flow of the River Padma disproportionately affected downstream distributary discharges including the River Gorai (SW99, Supplementary Figure S8), which occasionally ceased to flow during the dry season between 1988 and 1998 (Monirul Qader Mirza and Sarker, 2004); mean estimated dry-season flow 1988 to 1992 was ~1 m3/s. This non-linear reduction in river flow has been attributed to both the development of a sandbar inhibiting flow at the mouth of the River Gorai and dry-season extraction of surface water to supply the Ganges Kobadak Irrigation Project (Goes et al., 2021).
Trends in surface water salinity exist within the dynamic seasonal regimes observed in the coastal region of Bangladesh. The freshwater zone in the SC exposed and interior coastal regions has shrunk primarily from the moribund delta in the SW exposed zone (Figure 9C); here the lateral extent of the freshwater zone reduced by ~13 to ~16 km between the periods of 2000–2009 to 2010–2018. Within the active delta, proximate to contemporary freshwater fluxes from the Rivers Padma, Jamuna and Meghna, the lateral reduction in SC freshwater zone is lower, between 4 and 9 km over the same time periods. Notwithstanding small rising trends (Sen slopes) in EC detected most notably at monitoring stations in the exposed SW and SC coastal zones (Table 1B and Figure 10), the freshwater contour in SW interior coastal zone remained largely unchanged between the periods of 2000–2009 to 2010–2018 (Figure 9C). Similar to reductions in dry season discharge, monsoonal flood (95th percentile) discharges of the Rivers Padma and Gorai decreased (Supplementary Figures S7A,B, S9) with a disproportionate (non-linear) 32% reduction in the mean flood discharge of the River Gorai between the periods 1976 to 1995 and 1996 to 2015, relative to a 12% reduction in the flood discharge of the River Padma over the same two periods. Over this latter period (1996–2015), the annual flood discharge of the River Gorai (mean: ~3,030 m3/s, Supplementary Figure S5) declined by ~50 m3/s per year (p-value: 0.04).
5.2 Sea level rise, subsidence and seasonal to tidal fluctuations in sea level
The influence of sea-level rise (SLR) on surface water salinity in the coastal region of Bangladesh is itself affected by changes in land elevation due to variable sedimentation rates and subsidence (Steckler et al., 2016; Becker et al., 2020; Paszkowski et al., 2021; Hanebuth et al., 2022; Steckler et al., 2022). Mean rates of SLR derived from satellite altimetry in coastal Bangladesh are consistent with and, in places (e.g., SE Bangladesh), slightly exceed the global mean of between ~3.3 and ~3.6 mm/year (Akter et al., 2016; Ubelmann et al., 2021). Observed SLR varies from ~3.0 to ~3.5 mm/year in the SW coastal region to ~3.5 to ~4.0 mm/year in the SC, and ~4.0 to ~5.0 mm/year in the SE (Figure 6). Subsidence rates, recorded from in situ observations (Steckler et al., 2022), also vary over the coastal region from 5.5 to 8.0 mm/year in the SW exposed and interior coastal region (moribund delta) to between 3.7 and 4.6 mm/year in the exposed SC coastal region.
The combined influence of SLR and subsidence, the twin drivers of the northward intrusion of saline waters from the Bay of Bengal to the delta, is highest in the SW coastal region where rising trends in surface water salinity in the exposed and interior coasts are greatest (Table 1B and Figure 10); it is also in the SW exposed coastal region where land elevation is lowest (e.g., Pinchoff et al., 2019). Trends in surface water salinity in the exposed and interior coasts of the SC region are lower where combined rates of SLR and subsidence are lower. SLR is greatest in the SE coastal region but its impact on surface water salinity is constrained by a higher land elevation.
Sea level and subsidence vary seasonally (Ubelmann et al., 2021; Steckler et al., 2022) with lower values occurring in the dry season (e.g., March) when the northward migration of surface water salinity peaks (Figure 8). As the Bengal Basin is a tide-dominated delta (mean tidal range exceeds 4 m, Bricheno et al., 2016), it is also during this period when tidal hydrodynamics can serve to drive seawater furthest inland (Bricheno et al., 2021). Although spatial variability in the magnitude of observed trends in surface water salinity in the coastal region (i.e., higher salinity trends in the SW than the SC coastal region) is consistent with observed trends in the combined influences of SLR and subsidence, substantial changes in surface water salinity in the SW coastal region between periods 2000–2009 and 2010–2018 are not observed (Figure 9C) as noted above.
5.3 Intensity and frequency of tropical cyclones
Salinity rises observed in the dry season preceding the 2007 monsoon, follow in 2006 the lowest monsoonal river discharge ever recorded to that date at River Gorai (SW99, Supplementary Figure S7A) and the lowest monsoonal river discharge recorded at River Padma (SW90, Supplementary Figure S7B) since 1989. Annual rainfall in the Bengal Basin in 2006 was also the lowest recorded to that date since 1994 (Supplementary Figure S12). In the SW coastal region in 2014, sharp rises in surface water salinity are again observed in clusters 4 and 5 (Figure 5; Supplementary Figure S4) independent of the landfall of any tropical cyclones. These increases occur during the dry season that follows monsoonal discharge at River Gorai (Supplementary Figure S7A) that is even lower than in 2006 and the lowest in the entire time series from 1972 to 2016.
Although these two intervals represent pre-cyclone and cyclone periods (Figure 11C), the disconnection between the timing of cyclones and salinity rises means that the salinity incursion between these two time periods is better explained by a 20% reduction in the median monthly discharge of the River Gorai. Reductions in dry-season (February to April) river discharge of ~26% not only influence the salinity of intruding water from the Bay of Bengal (Chaitanya et al., 2015) but may also be driven, in part, by freshwater capture through groundwater-fed irrigation (Sherin et al., 2020; Shamsudduha et al., 2022). In the SE coastal region, increases in the salinity of surface water are largely limited to near-sea areas and, with few exceptions, mostly unchanged between these two periods. Full to partial recovery from sharp rises in salinity is observed in clusters 1, 2, 4 and 6 (Figure 6), which are better connected to more voluminous seasonal river discharge than clusters 3 and 5 (e.g., Supplementary Figure S10: cluster 5—SW105, 107.2, 258, 28, and 243) located in the SW and SE coastal regions. The precise processes by which these episodic rises in surface water salinity persist, require further investigation (Ayers et al., 2017). The impacts of tropical cyclones and storm surge inundation on river-water salinities can be short-lived as our observations show. However, the impact of tropical cyclones may be more substantial for inland water bodies especially within polders, in case of their breach, and coastal water-logged wetlands due to inhibited drainage and evaporation effects.
5.4 Local human influences on surface water salinity
Human interventions such as polders and upstream diversions alter sedimentation patterns in the coastal region of Bangladesh. These are largely thought to interrupt sedimentation inside polders, reducing subsidence but also a relative elevation through impeded deposition (Auerbach et al., 2015). Subsequent breaches in the form of storm surges and cyclones inundate these areas with brackish water from the surrounding tidal channels and deposit salt-rich sediments, leading to the salinisation of surface water bodies in polders. Shrimp farming in southwestern Bangladesh during dry season also leads to increases in the salinity of water and soil around shrimp ponds (Ayers et al., 2017; Mahtab and Zahid, 2018). The impact of these human activities on surface water salinity monitored outside of polders and remote from shrimp ponds remains unclear. As cited above, dry-season irrigation of Boro rice through groundwater abstraction reduces baseflow contributions to surface water through freshwater capture (Shamsudduha et al., 2022), lowering river discharge, as reviewed above in section 5.1, that is most visible during the dry season. Use of cross-dams in tidal distributaries to trap fresh surface water for dry-season irrigation also serves to increase measured dry-season surface water salinity (Rashid et al., 2013).
5.5 Uncertainty in observational data
The outcomes presented here are rooted in the analysis of the largest number of time series observations of surface water salinity in the Bengal Basin to date. Uncertainty in these observations and their processing exist and include most notably:
Seasonally occurring data gaps: During the monsoon season in Bangladesh, which usually peaks between July and October, gaps can occur in observations due primarily to the logistical challenges of collecting field data during severe flooding. Missing data were imputed using a Random Forest algorithm, MissForest, to enable the computation of Sen slopes (trends) as these cannot be calculated if there are gaps in the dataset.
Geospatial interpolation of point data: This process involves the estimation of values at unsampled locations based on the values measured at a finite set of points. The reliability of the interpolated values depends on the quality and representativeness of the original data as well as the interpolation method used. We used the Empirical Bayesian Kriging (EBK) for interpolation as it calculates the semi-variogram from known data locations and uses this single semi-variogram to make predictions at unknown locations. Semi-variogram analysis of surface water EC data in this study shows a strong spatial dependence up to a distance of 50 km, suggesting that the EBK algorithm is suitable for interpolation.
6 Conclusion
Observed changes in surface water salinity in the Bengal Basin, the world’s largest deltaic system, demonstrate considerable spatiotemporal variations. Records over the last 3 decades (1990–2019) from a network of 86 monitoring stations in the coastal region of Bangladesh, the largest dataset analysed to date, show a pronounced spatial structure in which mean 2001–2017 surface water salinities are brackish in the southwest (SW) and southeast (SE) coastal regions but fresh in the south-central (SC) region. Lower salinities in the SC region correspond to areas flushed by the discharge of Rivers Padma (Ganges), Jamuna (Brahmaputra) and Meghna (active delta); higher salinities occur in areas receiving substantially lower river discharge via distributaries draining the River Padma (moribund delta) in the SW and smaller river catchments in the SE. Statistical clustering identifies six patterns in the time series data that strongly reflect this spatial structure across the coastal region as well as northward and eastward transitions from brackish to fresh (EC <1,500 μS/cm) water in the SW coastal region.
Distinct seasonality in surface water salinity is observed and related to strong seasonal (intra-annual) variations in river discharge. In much of the coastal region (SW inland, SC, and SE), surface water salinities over the year can vary by 10 to 30% and are highest during the dry season between February and April and lowest during the monsoon from June to August. In the exposed and interior SW coastal regions (moribund delta) that are most distant from the seasonal freshwater fluxes from the Rivers Padma, Jamuna and Meghna, seasonal highs and lows in surface water salinity occur later (lagged) and can exceed 100%. Indeed, north of the Sundarbans, the contour between fresh and brackish water migrates northward, on average each year, between ~20 and ~40 km during the dry season.
Surface water salinity is generally rising over time in the coastal region of Bangladesh; exceptions to this trend occur primarily in inland coastal regions where declining trends are marginal and at two stations in the exposed SE coastal region where existing surface water salinities are very high. Rising trends in surface water salinity are highest in the exposed SW and SC coastal regions. Abrupt increases in surface water salinity are observed throughout the coastal region in response primarily to changes in river discharge and rainfall. In the SW coastal region, the magnitude of the salinity rise between pre-cyclone (2000–2005) and cyclone (2006–2010) periods is greater than observed changes in long-term (2000–2017) mean salinity. Coastal regions which are better connected to more voluminous seasonal river discharge (active delta) show full or partial recovery to these episodic inundations whereas areas less-well flushed by river discharge (e.g., moribund delta) do not.
Evidence from observational records of surface water salinity in Bangladesh highlights the importance of variations in river discharge in driving salinity increases in the coastal region. Both sea-level rise and reductions in dry-season river discharge in distributaries arising from local and basin-wide use of both surface water and groundwater for irrigation likely exacerbate the landward migration of brackish and saline waters. The amplification of seasonal and daily rainfall extremes through global warming may serve to accentuate spatiotemporal variations in salinity in the coastal region of Bangladesh with greater increases in salinity in areas like the SW coastal region that experience lagged and lower seasonal river flow (moribund delta), relative to areas that are better connected to more voluminous seasonal river discharge (active delta). Observations and analyses detailed here provide a baseline for understanding the consequences of global environmental change and informing climate-resilient adaptation strategies in coastal environments of Bangladesh and other Asian mega-deltas.
Data availability statement
We secured time-series datasets of river-water salinity and river discharge from the Bangladesh Water Development Board (BWDB) through long-term research collaboration and purchase. The datasets presented in this article are not readily available because we do not have the necessary permission to make them publicly available. Requests to access the surface water salinity and discharge datasets should be directed to the BWDB (http://www.hydrology.bwdb.gov.bd/). Requests to access the rainfall dataset should be directed to the Bangladesh Meteorological Department (https://dataportal.bmd.gov.bd/). Annual summary statistics of these datasets are available on request to the corresponding author.
Author contributions
MH, MS, and RT conceived the analysis. MH and MS conducted the analysis. MH and RT wrote the original manuscript. All authors contributed to the article and approved the submitted version.
Funding
The authors acknowledge the support to the lead author of a Commonwealth Doctoral Scholarship (Ref. BDCS-2017-60) from the UK Commonwealth Scholarship Commission funded by UK FCDO (Foreign, Commonwealth & Development Office) and provision of invaluable field data operated and managed by the Bangladesh Water Development Board (BWDB). MS, RT, and MH acknowledge the support of a grant from the Research England awarded through the UCL Public Policy QR Policy Support Fund 2023, Improving water-supply resilience in Bangladesh through research and policy engagement (RESIPY). RT acknowledges support of a Fellowship (Ref. 7040464) from CIFAR (Canadian Institute for Advanced Research) under the Earth-4D program.
Conflict of interest
The authors declare that the research was conducted in the absence of any commercial or financial relationships that could be construed as a potential conflict of interest.
Publisher’s note
All claims expressed in this article are solely those of the authors and do not necessarily represent those of their affiliated organizations, or those of the publisher, the editors and the reviewers. Any product that may be evaluated in this article, or claim that may be made by its manufacturer, is not guaranteed or endorsed by the publisher.
Supplementary material
The Supplementary material for this article can be found online at: https://www.frontiersin.org/articles/10.3389/frwa.2024.1220540/full#supplementary-material
References
Aghabozorgi, S., Seyed Shirkhorshidi, A., and Ying Wah, T. (2015). Time-series clustering—a decade review. Inf. Syst. 53, 16–38. doi: 10.1016/j.is.2015.04.007
Agrawala, S., Ota, T., Ahmed, A. U., Smith, J. A., and van Alast, M. (2003). Development and Climate Change in Bangladesh: focus on coastal flooding and the Sundarbans. Paris: Organisation for Economic Co-operation and Development (OECD). Available at: https://www.oecd.org/env/cc/21055658.pdf (Accessed March 25, 2024).
Akter, S., Ahmed, K. R., Marandi, A., and Schüth, C. (2020). Possible factors for increasing water salinity in an embanked coastal island in the southwest Bengal Delta of Bangladesh. Sci. Total Environ. 713:136668. doi: 10.1016/j.scitotenv.2020.136668
Akter, R., Asik, T. Z., Sakib, M., Akter, M., Sakib, M. N., Al Azad, A. S. M. A., et al. (2019). The dominant climate change event for salinity intrusion in the GBM delta. Climate 7:69. doi: 10.3390/cli7050069
Akter, J., Sarker, M. H., Popescu, I., and Roelvink, D. (2016). Evolution of the Bengal Delta and its prevailing processes. J. Coast. Res. 321, 1212–1226. doi: 10.2112/JCOASTRES-D-14-00232.1
Alam, M., Alam, M. M., Curray, J. R., Chowdhury, M. L. R., and Gani, M. R. (2003). An overview of the sedimentary geology of the Bengal Basin in relation to the regional tectonic framework and basin-fill history. Sediment. Geol. 155, 179–208. doi: 10.1016/S0037-0738(02)00180-X
Ali, M. S., and Hasan, M. M. (2022). Environmental flow assessment of Gorai River in Bangladesh: a comparative analysis of different hydrological methods. Heliyon 8:e09857. doi: 10.1016/j.heliyon.2022.e09857
Auerbach, L. W., Goodbred, S. L., Mondal, D. R., Wilson, C. A., Ahmed, K. R., Roy, K., et al. (2015). Flood risk of natural and embanked landscapes on the Ganges-Brahmaputra tidal delta plain. Nat. Clim. Change 5, 153–157. doi: 10.1038/nclimate2472
Ayers, J. C., George, G., Fry, D., Benneyworth, L., Wilson, C., Auerbach, L., et al. (2017). Salinization and arsenic contamination of surface water in southwest Bangladesh. Geochem. Trans. 18:4. doi: 10.1186/s12932-017-0042-3
Barbour, E. J., Adnan, M. S. G., Borgomeo, E., Paprocki, K., Khan, M. S. A., Salehin, M., et al. (2022). The unequal distribution of water risks and adaptation benefits in coastal Bangladesh. Nat. Sustain. 5, 294–302. doi: 10.1038/s41893-021-00846-9
Barter, R. L., and Yu, B. (2018). Superheat: an R package for creating beautiful and extendable heatmaps for visualizing complex data. J. Comput. Graph. Stat. 27, 910–922. doi: 10.1080/10618600.2018.1473780
Becker, M., Papa, F., Karpytchev, M., Delebecque, C., Krien, Y., Khan, J. U., et al. (2020). Water level changes, subsidence, and sea level rise in the Ganges–Brahmaputra–Meghna delta. Proc. Natl. Acad. Sci. U.S.A. 117, 1867–1876. doi: 10.1073/pnas.1912921117
Brammer, H. (2014). Bangladesh’s dynamic coastal regions and sea-level rise. Clim. Risk Manag. 1, 51–62. doi: 10.1016/j.crm.2013.10.001
Bricheno, L. M., Wolf, J., and Islam, S. (2016). Tidal intrusion within a mega delta: An unstructured grid modelling approach. Estuar Coast Shelf Sci 182. doi: 10.1016/j.ecss.2016.09.014
Bricheno, L., and Wolf, J. (2018). Modelling tidal river salinity in coastal Bangladesh. Ecosystem Services for Well-Being in Deltas: Integrated Assessment for Policy Analysis, (London: Cham. Palgrave Macmillan).
Bricheno, L. M., Wolf, J., and Sun, Y. (2021). Saline intrusion in the Ganges–Brahmaputra–Meghna megadelta. Estuar. Coast. Shelf Sci. 252:107246. doi: 10.1016/j.ecss.2021.107246
Caliñski, T., and Harabasz, J. (1974). A dendrite method foe cluster analysis. Commun. Stat. 3, 1–27. doi: 10.1080/03610927408827101
Chaitanya, A. V. S., Durand, F., Mathew, S., Gopalakrishna, V. V., Papa, F., Lengaigne, M., et al. (2015). Observed year-to-year sea surface salinity variability in the Bay of Bengal during the 2009–2014 period. Ocean Dyn. 65, 173–186. doi: 10.1007/s10236-014-0802-x
Chen, J., and Mueller, V. (2018). Coastal climate change, soil salinity and human migration in Bangladesh. Nat. Clim. Change 8, 981–985. doi: 10.1038/s41558-018-0313-8
Cleveland, R. B., Cleveland, W. S., McRae, J. E., and Terpenning, I. (1990). STL: a seasonal-trend decomposition procedure based on Loess (with discussion). J. Off. Stat. 6, 3–73.
Dasgupta, S., Akhter, F., Zahirul, K., Khan, H., Choudhury, S., The, A. N., et al. (2014). River salinity and climate change evidence from coastal Bangladesh. Available at: http://econ.worldbank.org
Dasgupta, S., Hossain, M. M., Huq, M., and Wheeler, D. (2015). Climate change and soil salinity: the case of coastal Bangladesh. Ambio 44, 815–826. doi: 10.1007/s13280-015-0681-5
Dewan, A., Shahid, S., Bhuian, M. H., Hossain, S. M. J., Nashwan, M. S., Chung, E. S., et al. (2022). Developing a high-resolution gridded rainfall product for Bangladesh during 1901–2018. Sci. Data 9:471. doi: 10.1038/s41597-022-01568-z
Feist, S. E., Hoque, M. A., and Ahmed, K. M. (2023). Coastal salinity and water management practices in the Bengal Delta: a critical analysis to inform salinisation risk management strategies in Asian deltas. Earth Syst. Environ. 7, 171–187. doi: 10.1007/s41748-022-00335-9
Goes, B. J. M., Clark, A. K., and Bashar, K. (2021). Water allocation strategies for meeting dry-season water requirements for Ganges Kobadak Irrigation Project in Bangladesh. Int J Water Resour Dev 37, 300–320. doi: 10.1080/07900627.2020.1763265
Goodbred, S. L., and Kuehl, S. A. (1999). Holocene and modern sediment budgets for the Ganges-Brahmaputra river system: evidence for high stand dispersal to flood-plain, shelf, and deep-sea depocenters. Geology 27:559. doi: 10.1130/0091-7613(1999)027<0559:HAMSBF>2.3.CO;2
Goodbred, S. L., and Kuehl, S. A. (2000). The significance of large sediment supply, active tectonism, and eustasy on margin sequence development: late quaternary stratigraphy and evolution of the Ganges-Brahmaputra delta. Sediment. Geol. 133, 227–248. doi: 10.1016/S0037-0738(00)00041-5
Hanebuth, T. J. J., Kudrass, H. R., Zander, A. M., Akhter, H. S., Neumann-Denzau, G., and Zahid, A. (2022). Stepwise, earthquake-driven coastal subsidence in the Ganges–Brahmaputra Delta (Sundarbans) since the eighth century deduced from submerged in situ kiln and mangrove remnants. Nat. Hazards 111, 163–190. doi: 10.1007/s11069-021-05048-2
Hoque, M. A. (2010). Models for managing the deep aquifer in Bangladesh. Available at: http://eprints.ucl.ac.uk/19987/ (Accessed May 4, 2023).
Islam, M. A., Hoque, M. A., Ahmed, K. M., and Butler, A. P. (2019). Impact of climate change and land use on groundwater salinization in southern Bangladesh—implications for other Asian deltas. Environ. Manag. 64, 640–649. doi: 10.1007/s00267-019-01220-4
Javed, A., Lee, B. S., and Rizzo, D. M. (2020). A benchmark study on time series clustering. Mach. Learn. Appl. 1:100001. doi: 10.1016/j.mlwa.2020.100001
Khan, J. R., Awan, N., Archie, R. J., Sultana, N., and Muurlink, O. (2020). The association between drinking water salinity and hypertension in coastal Bangladesh. Glob. Health J. 4, 153–158. doi: 10.1016/j.glohj.2020.11.001
Krivoruchko, K., and Gribov, A. (2019). Evaluation of empirical Bayesian kriging. Spat. Stat. 32:100368. doi: 10.1016/j.spasta.2019.100368
Mahtab, M. H., and Zahid, A. (2018). Coastal surface water suitability analysis for irrigation in Bangladesh. Appl. Water Sci. 8:28. doi: 10.1007/s13201-018-0650-9
McBean, E., and Motiee, H. (2008). Assessment of impact of climate change on water resources: a long term analysis of the Great Lakes of North America. Hydrol. Earth Syst. Sci. 12, 239–255. doi: 10.5194/hess-12-239-2008
Mirza, M. M. Q. (1998). Diversion of the Ganges water at Farakka and its effects on salinity in Bangladesh. Environ. Manag. 22, 711–722. doi: 10.1007/s002679900141
Monirul Qader Mirza, M., and Sarker, M. H. (2004). “Effects on water salinity in Bangladesh” in The Ganges water diversion: environmental effects and implications (Dordrecht: Springer), 81–102.
Mukherjee, A., Fryar, A. E., and Thomas, W. A. (2009). Geologic, geomorphic and hydrologic framework and evolution of the Bengal Basin, India and Bangladesh. J. Asian Earth Sci. 34, 227–244. doi: 10.1016/j.jseaes.2008.05.011
Naser, A. M., Rahman, M., Unicomb, L., Doza, S., Gazi, M. S., Alam, G. R., et al. (2019). Drinking water salinity, urinary macro-mineral excretions, and blood pressure in the southwest coastal population of Bangladesh. J. Am. Heart Assoc. 8:e012007. doi: 10.1161/JAHA.119.012007
Ostrowski, A., Connolly, R. M., and Sievers, M. (2021). Evaluating multiple stressor research in coastal wetlands: a systematic review. Mar. Environ. Res. 164:105239. doi: 10.1016/j.marenvres.2020.105239
Palash, W., Jiang, Y., Akanda, A. S., Small, D. L., Nozari, A., and Islam, S. (2018). A streamflow and water level forecasting model for the Ganges, Brahmaputra, and Meghna rivers with requisite simplicity. J. Hydrometeorol. 19, 201–225. doi: 10.1175/JHM-D-16-0202.1
Paszkowski, A., Goodbred, S., Borgomeo, E., Khan, M. S. A., and Hall, J. W. (2021). Geomorphic change in the Ganges–Brahmaputra–Meghna delta. Nat. Rev. Earth Environ. 2, 763–780. doi: 10.1038/s43017-021-00213-4
Payo, A., Lázár, A. N., Clarke, D., Nicholls, R. J., Bricheno, L., Mashfiqus, S., et al. (2017). Modeling daily soil salinity dynamics in response to agricultural and environmental changes in coastal Bangladesh. Earths Future 5, 495–514. doi: 10.1002/2016EF000530
Pinchoff, J., Shamsudduha, M., Hossain, S. M. I., Shohag, A. A. M., and Warren, C. E. (2019). Spatio-temporal patterns of pre-eclampsia and eclampsia in relation to drinking water salinity at the district level in Bangladesh from 2016 to 2018. Popul. Environ. 41, 235–251. doi: 10.1007/s11111-019-00331-8
Raff, J. L., Goodbred, S. L., Pickering, J. L., Sincavage, R. S., Ayers, J. C., Hossain, M. S., et al. (2023). Sediment delivery to sustain the Ganges-Brahmaputra delta under climate change and anthropogenic impacts. Nat. Commun. 14:2429. doi: 10.1038/s41467-023-38057-9
Rahman, M. M., Penny, G., Mondal, M. S., Zaman, M. H., Kryston, A., Salehin, M., et al. (2019). Salinization in large river deltas: drivers, impacts and socio-hydrological feedbacks. Water Secur. 6:100024. doi: 10.1016/j.wasec.2019.100024
Rahman, M. M., and Rahaman, M. M. (2018). Impacts of Farakka barrage on hydrological flow of Ganges river and environment in Bangladesh. Sustain. Water Resour. Manag. 4, 767–780. doi: 10.1007/s40899-017-0163-y
Rashid, M. B., Mahmud, A., Ahsan, Md. K., Khasru, M. H., and Islam, Md. A. (2013). Drainage Congestion and Its Impact on Environment in the South-Western Coastal Part of Bangladesh. Bangladesh Journal of Geological Society 26, 359–371. Available at: https://www.researchgate.net/publication/301356483_Drainage_Congestion_and_Its_Impact_on_Environment_in_the_South-Western_Coastal_Part_of_Bangladesh (Accessed March 10, 2024).
Rudra, K. (2018). Geography of the physical environment rivers of the Ganga-Brahmaputra-Meghna delta a fluvial account of Bengal. Available at: http://www.springer.com/series/15117
Salehin, M., Chowdhury, M. M. A., Clarke, D., Mondal, S., Nowreen, S., Jahiruddin, M., et al. (2018). “Mechanisms and drivers of soil salinity in coastal Bangladesh” in Ecosystem services for well-being in deltas: integrated assessment for policy analysis. London: Cham. Palgrave Macmillan.
Sarker, M. H., Koudstaal, R., and Alam, M. (2003). Rivers, chars and char dwellers of Bangladesh. International Journal of River Basin Management 1. doi: 10.1080/15715124.2003.9635193
Sen, P. K. (1968). Estimates of the regression coefficient based on Kendall’s tau. J. Am. Stat. Assoc. 63, 1379–1389. doi: 10.1080/01621459.1968.10480934
Shahid, S. (2010). Rainfall variability and the trends of wet and dry periods in Bangladesh. Int. J. Climatol. 30, 2299–2313. doi: 10.1002/joc.2053
Shamsudduha, M., Chandler, R. E., Taylor, R. G., and Ahmed, K. M. (2009). Recent trends in groundwater levels in a highly seasonal hydrological system: the Ganges-Brahmaputra-Meghna Delta. Hydrol. Earth Syst. Sci. 13, 2373–2385. doi: 10.5194/hess-13-2373-2009
Shamsudduha, M., Joseph, G., Haque, S. S., Khan, M. R., Zahid, A., and Ahmed, K. M. U. (2020). Multi-hazard groundwater risks to water supply from shallow depths: challenges to achieving the sustainable development goals in Bangladesh. Expo. Health 12, 657–670. doi: 10.1007/s12403-019-00325-9
Shamsudduha, M., Taylor, R. G., Ahmed, K. M., and Zahid, A. (2011). The impact of intensive groundwater abstraction on recharge to a shallow regional aquifer system: evidence from Bangladesh. Hydrogeol. J. 19, 901–916. doi: 10.1007/s10040-011-0723-4
Shamsudduha, M., Taylor, R. G., Haq, M. I., Nowreen, S., Zahid, A., and Ahmed, K. M. U. (2022). The Bengal water machine: quantified freshwater capture in Bangladesh. Science 377, 1315–1319. doi: 10.1126/science.abm4730
Sherin, V. R., Durand, F., Papa, F., Islam, A. S., Gopalakrishna, V. V., Khaki, M., et al. (2020). Recent salinity intrusion in the Bengal delta: observations and possible causes. Cont. Shelf Res. 202:104142. doi: 10.1016/j.csr.2020.104142
Steckler, M. S., Mondal, D. R., Akhter, S. H., Seeber, L., Feng, L., Gale, J., et al. (2016). Locked and loading megathrust linked to active subduction beneath the Indo-Burman ranges. Nat. Geosci. 9, 615–618. doi: 10.1038/ngeo2760
Steckler, M. S., Oryan, B., Wilson, C. A., Grall, C., Nooner, S. L., Mondal, D. R., et al. (2022). Synthesis of the distribution of subsidence of the lower Ganges-Brahmaputra Delta, Bangladesh. Earth Sci. Rev. 224:103887. doi: 10.1016/J.EARSCIREV.2021.103887
Stekhoven, D. J., and Bühlmann, P. (2012). Missforest-non-parametric missing value imputation for mixed-type data. Bioinformatics 28, 112–118. doi: 10.1093/bioinformatics/btr597
Ubelmann, C., Dibarboure, G., Gaultier, L., Ponte, A., Ardhuin, F., Ballarotta, M., et al. (2021). Reconstructing ocean surface current combining altimetry and future spaceborne doppler data. J. Geophys. Res. Oceans 126. doi: 10.1029/2020JC016560
Uddin, A. M. K., and Kaudstaal, R. (2003). Delineation of coastal zone in Bangladesh, Dhaka. Available at: http://warpo.portal.gov.bd/sites/default/files/files/warpo.portal.gov.bd/page/aa04373f_0ca3_49a5_b77e_5108186638dc/wp005.PDF (Accessed May 4, 2023).
Viessman, W., Lewis Gary, L., and Knapp, J. W. (1989). Introduction to hydrology. 3rd Edn. New York: Harper & Row.
Vineis, P., Chan, Q., and Khan, A. (2011). Climate change impacts on water salinity and health. J. Epidemiol. Glob. Health 1, 5–10. doi: 10.1016/j.jegh.2011.09.001
Wasson, R. J. (2003). A sediment budget for the Ganga-Brahmaputra catchment. Curr. Sci. 84, 1041–1047.Available at: https://www.jstor.org/stable/24107666 (Accessed March 12, 2024).
Water Resources Planning Organization (2001). National Water Management Plan (NWMP), Dhaka. Available at: http://old.warpo.gov.bd/nwmp/nwmp_vol1.pdf (Accessed May 4, 2023).
Wilson, R. (2017). “Impacts of climate change on mangrove ecosystems in the coastal and marine environments of Caribbean Small Island Developing States (SIDS)” in Caribbean climate change report card: science review. London: Commonwealth Marine Economies Programme, UK Government. pp. 60–82. Available at: https://assets.publishing.service.gov.uk/media/5a821123ed915d74e34018be/7._Mangroves_combined.pdf (Accessed February 10, 2024).
Keywords: salinity, surface water, coastal, mega-deltas, global change, river discharge, tropical cyclones, sea level rise
Citation: Haq MI, Shamsudduha M, Zahid A, Ahmed KM, Kamal ASMM and Taylor RG (2024) What drives changes in surface water salinity in coastal Bangladesh? Front. Water. 6:1220540. doi: 10.3389/frwa.2024.1220540
Edited by:
Marc Leblanc, University of Avignon, FranceReviewed by:
Venkatramanan Senapathi, National College, Tiruchirappalli, IndiaLucy Bricheno, University of Southampton, United Kingdom
Copyright © 2024 Haq, Shamsudduha, Zahid, Ahmed, Kamal and Taylor. This is an open-access article distributed under the terms of the Creative Commons Attribution License (CC BY). The use, distribution or reproduction in other forums is permitted, provided the original author(s) and the copyright owner(s) are credited and that the original publication in this journal is cited, in accordance with accepted academic practice. No use, distribution or reproduction is permitted which does not comply with these terms.
*Correspondence: Md Izazul Haq, md.haq.17@ucl.ac.uk