 Kyungdoe Han
 John L. Wilson
- 1Department of Civil and Environmental Engineering, University of Wisconsin-Madison, Madison, WI, United States
- 2Department of Earth and Environmental Science, New Mexico Institute of Mining and Technology, Socorro, NM, United States
The intricate interplay between climate and tectonics profoundly shapes landscapes over time frames surpassing 10 million years. Active tectonic processes and climatic shifts unsettle established drainage systems, instigating fragmentation or amalgamation of watersheds. These activities yield substantial transformation in surface hydrologic connectivity, thereby underlining the profound influence of these tectonic and climatic forces on the evolution of both landscape and hydrology. Such transformations within the hydrological landscape have direct implications for the evolution of aquatic species. As connections among aquatic habitats undergo reconfiguration, they incite shifts in species distribution and adaptive responses. These findings underscore the role of tectonics and climate in not only sculpting the physical landscape but also steering the course of biological evolution within these dynamically changing aquatic ecosystems relying on hydrologic connections. Despite the significance of these interactions, scholarly literature seldom examines alterations in hydrologic connectivity over tectonic, or orogen-scale, timescales. This study aims to bridge this gap, exploring changes in hydrologic connectivity over extended periods by simulating a continental rift system akin to the Rio Grande Rift, USA, subject to various tectonoclimatic scenarios. Multiple rift basins hosting large lakes, brought into existence by active tectonic extension, are further molded by tectonic extension and post-rift climatic changes. The study focuses on phenomena such as interbasin river breakthroughs and knickpoint generation, assembling a time-series of connectivity metrics based on stream network characteristics such as flow rate, flow distance, and captured drainage areas. We anticipate that the insights gleaned from this study will enhance our comprehension of the enduring impact of tectonic and climate processes on hydrologic connectivity and the subsequent evolution of aquatic species.
1 Introduction
Tectonic and climatic forces are key drivers of landscape transformation and changes in surface hydrologic connectivity (SHC), which in turn significantly impact the dispersal of aquatic species and can cause habitat fragmentation and species isolation. Understanding the historical changes in SHC is therefore essential for studying the evolutionary history of aquatic species. This research examines SHC changes over 30 Myrs in a hypothetical, semiarid geological rift system, aiming to provide insights into long-term SHC variations and their implications for the evolution of aquatic species.
The concept of SHC and its derived metrics function as indicators of the degree of interconnectedness within a given hydrologic system (e.g., Fullerton et al., 2010; Bracken et al., 2013). Spanning millions of years, tectonic events such as uplift and faulting, along with surface processes like erosion and sediment transport and deposition, are integral in shaping landscapes. These actions develop topographic relief and govern the trajectory of water and sediment movement (e.g., Whipple, 2009; Willett et al., 2014), resulting in alterations in SHC. In parallel, climatic variations, including shifts in atmospheric temperature and precipitation levels, profoundly influence surface processes. These variations impact soil development, vegetation distribution, erosion rates, and the overall hydrologic cycle. The roles of tectonic and climatic processes in landscape evolution have been substantiated through extensive research. For instance, the work of Molnar and England (1990) provides a prime example of how tectonic uplift and subsidence have altered the topography and drainage patterns of the Tibetan Plateau. The interplay between tectonic and climatic processes has been explored in studies like Whipple and Tucker (1999), which investigates the feedback loop between tectonic uplift, erosion, and climate in the Himalayas.
Understanding how tectonic and climatic forces interact with landscape evolution is essential for reconstructing changes in SHC over time. This study investigates the impact of tectonoclimatic forcings on landscape evolution and SHC changes over 30 Myrs in a hypothetical rift scenario, paralleling the Rio Grande Rift system (Figure 1). The Rio Grande Rift is segmented, forming a series of rift basins with opposite structural asymmetries (van Wijk et al., 2018). The basins were hydrologically disconnected through most of the rift evolution but since the Late Miocene a through-going river (Rio Grande; Figure 1) has gradually connected the basins (Repasch et al., 2017).
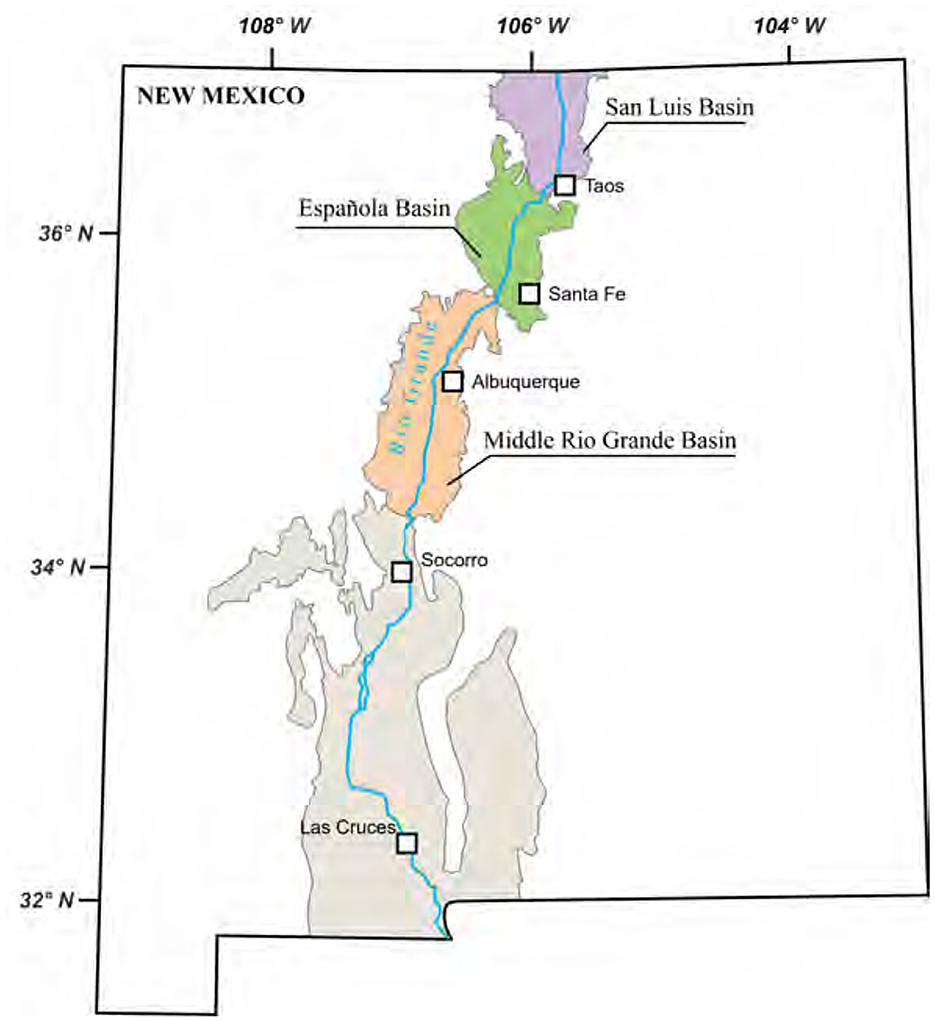
Figure 1. An illustrative map depicting the distinct basins within the Rio Grande Rift system, located in New Mexico, USA. Redrawn and modified after Kellogg et al. (2017).
The complex history of hydrologic changes in the evolving rift system is studied using established landscape evolution principles (Willgoose, 2018) through a well-known computer program. Among its other strengths, landscape evolution modeling has been shown to realistically model hydrologic stream networks (e.g., Rodriguez-Iturbe and Rinaldo, 1997), which is essential to the study of HC. The model domain has an area of 40,000 km2 with 1-km resolution to assess the tectonic, topographic, and hydrologic evolution of the landscape. This study analyzes a series of quasi-steady-state snapshots over a 30-Myr simulation period, focusing on hydrologically persistent and irreversible conditions rather than short-term transient and event-based simulations. This approach provides insights into the extent of hydrologic disconnections and the resultant divergence of aquatic species over geological timescales, facilitating the simulation of long-term processes. The models developed track significant changes in SHC, such as the formation of a through-going river and the reorganization of drainage basins. The model results provide information on surface water flow, erosion of bedrock and sediment, and transport and deposition of sediment, as well as tectonic processes including faulting and crustal block movement.
The rift extension phase accompanies hydrologic fragmentation (Repasch et al., 2017). Key metrics quantify such sudden shifts in hydrologic connections (i.e., fragmentation). The focus is on how SHC changes, driven by tectonics and climate, influence aquatic species evolution by disconnecting and rerouting aquatic pathways between habitats. We outline four steps of a six-step research framework, tectonoclimatic conceptualization, numerical modeling, statistical analysis, and SHC metric development (red dashed box in Figure 2). These steps help understand the initiation and development of SHC and their impact on the evolution of endemic aquatic species (i.e., a species that is native and restricted to a specific area), exemplified by the Rio Grande cutthroat trout (Oncorhynchus clarkii virginalis; Kalb and Caldwell, 2014).
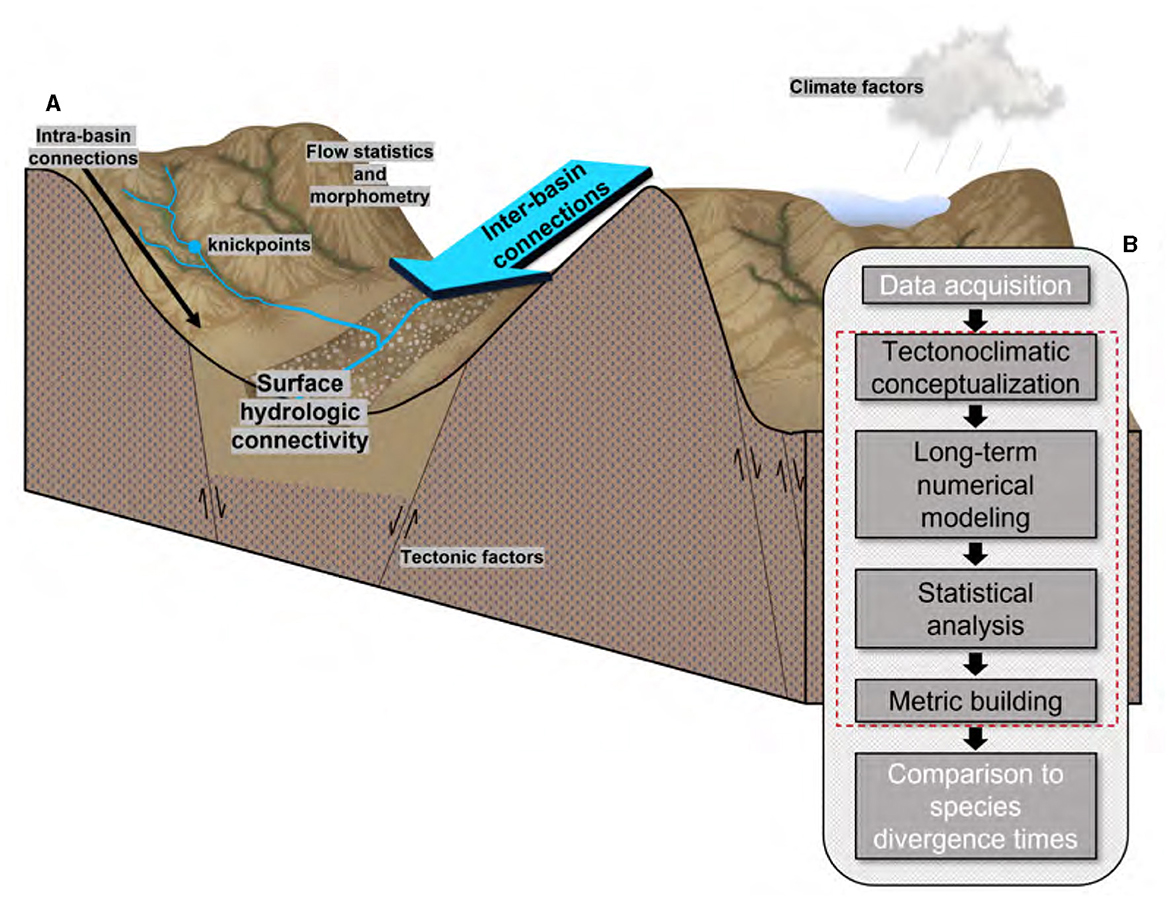
Figure 2. Conceptual model of this study. (A) Factors considered and examples of connectivity metrics examined; (B) a schematic diagram illustrating the sequential steps involved in reconstructing the evolutionary history of aquatic species in response to tectonic and climate forcings.
2 Methodology
2.1 Tectonoclimatic landscape evolution model
To simulate changes in surface hydrologic connectivity (SHC) over time, this study employs the landscape evolution software package TISC (Garcia-Castellanos, 2002; Garcia-Castellanos and Jimenez-Munt, 2015), which models tectonic extension and surface processes like erosion and sediment transport. TISC is a quasi-3D, finite-difference code capable of modeling surface hydrology, tectonic motion of crustal bocks, surface erosion, sediment transport and deposition, and isostasy. TISC effectively addresses long-term tectonic evolution and corresponding landscape development, offering a versatile modeling platform tailored to the objectives of this study. Owing to the scarcity of climate data from the distant past and the requirement for substantial computational resources, several simplistic climate scenarios are devised. First, a range of constant climates with different mean annual precipitation (MAP), representing dry to wet climates are simulated. Second, climate variations in the post-rift period are modeled by progressively decreasing MAP (see Supplementary material S1).
The general configuration of the model domain builds on the landscape-evolution study conducted by Berry et al. (2019) on endorheic to exorheic transition of a rift basin. In this study, the model is extended to two rift basins (Figure 3). The initial topography has a gentle south or southeast slope of 0.8%–1.2% to represent a hypothetical pre-rift state (Figure 4 and Supplementary Figure S2b), with the initial slope oriented from NW to SE at a 1% gradient in the base case scenario (Figure 4A).
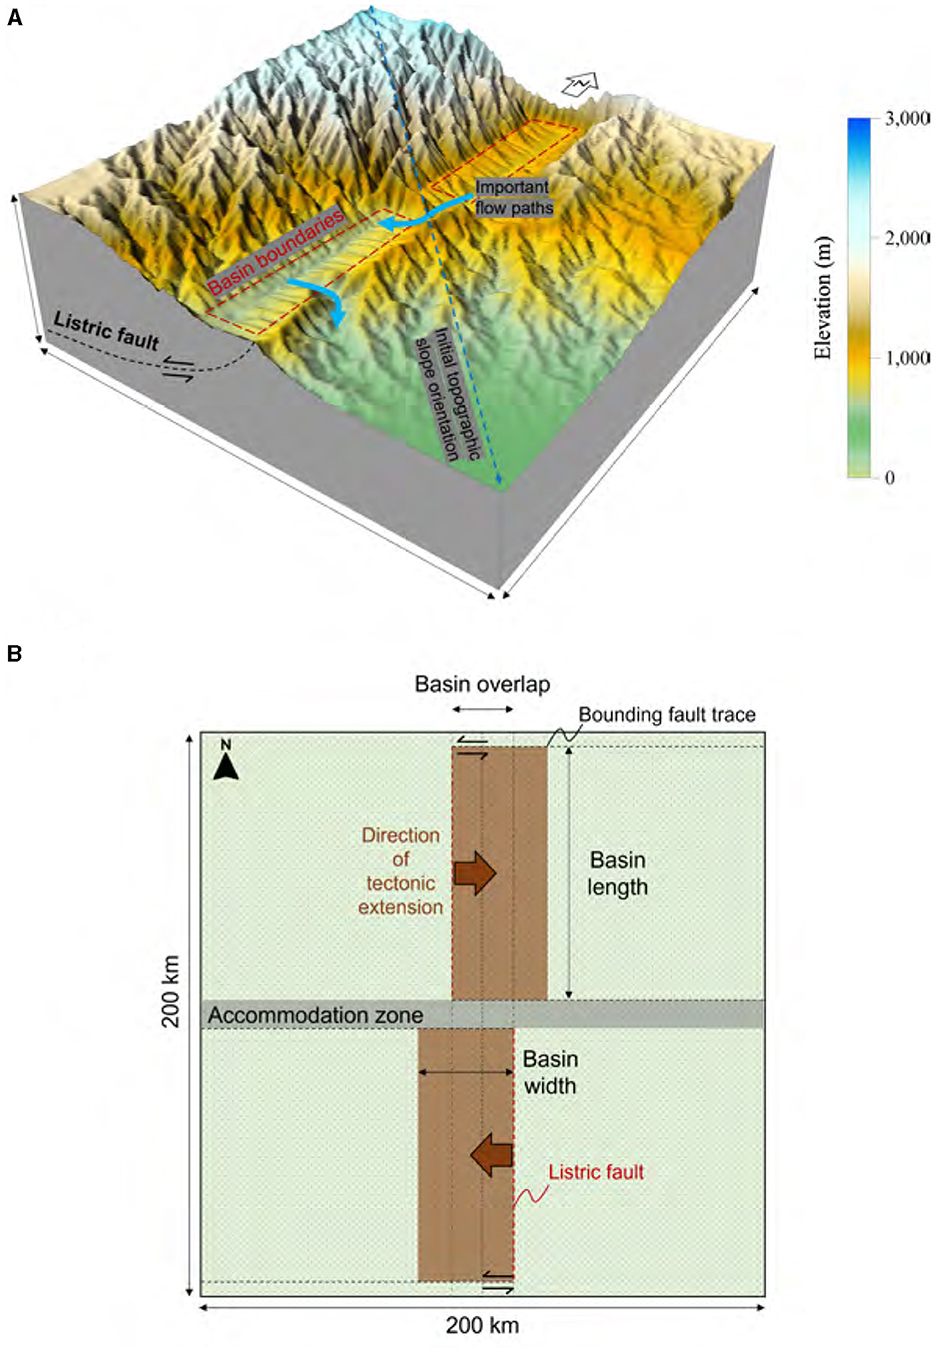
Figure 3. Conceptual model diagrams. (A) A conceptual model diagram of a base-case depicting 10 Myrs after rift initiation. (B) A planimetric view of the model depicting basin positions and opening directions. Each fault block is bounded below and updip by a listric fault, and on sides by strike-slip bounding faults.
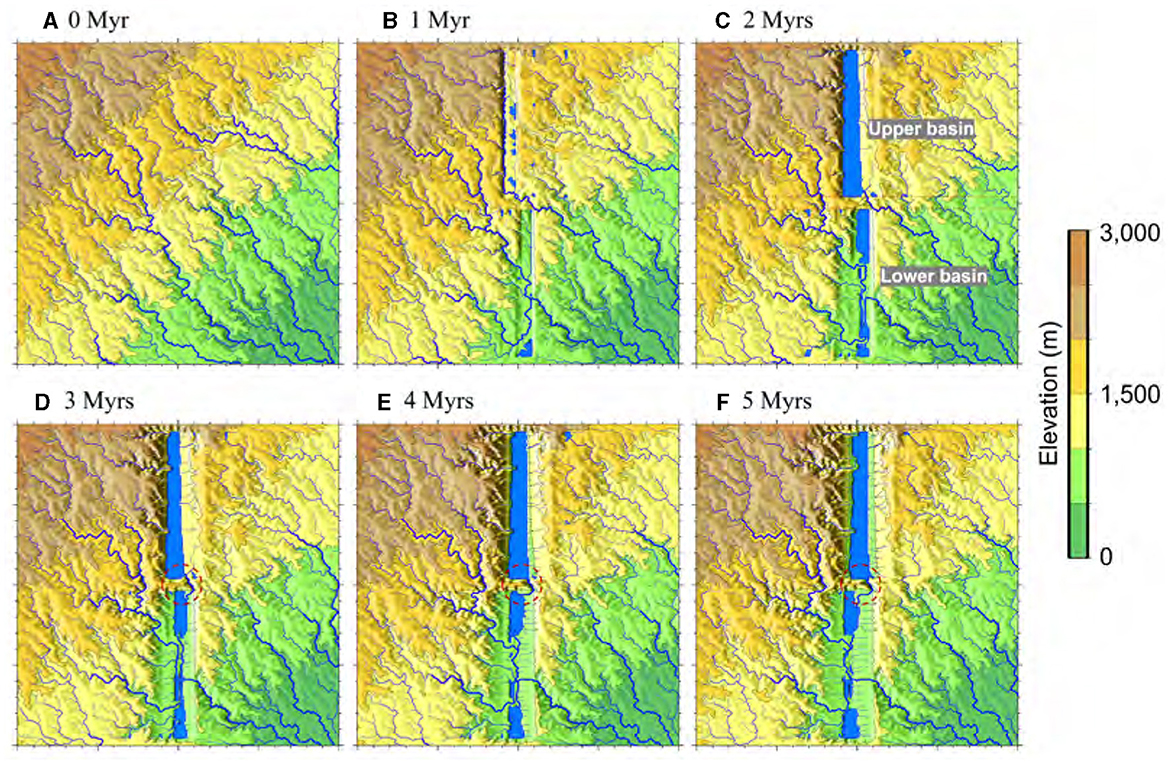
Figure 4. Temporal evolution of drainage patterns over a span of 5 Myrs. (A) Illustrates the initial condition, after 2-Myr spin-up and prior to tectonic extension, marked as 0 Myr. (B–F) Show basin openings at successive 1 Myr steps. The circles denoted by red dashed lines in (D–F) indicate the inter basin surface-drainage breakthrough, IB.
The model domain undergoes an initial spin-up period of 2 Myrs, allowing for the establishment of drainage networks prior to the onset of tectonic activity. This is followed by 15–25 Myrs of rifting, during which two sedimentary basins form. During this interval, syn-rift changes in SHC due to tectonic processes are analyzed. In the subsequent 5 Myrs, changes in connectivity originating from climatic variations are examined. Including the spin-up period, the maximum simulation time is 32 Myrs.
The tectonic timestep for simulating isostasy and crustal block movement is set at 0.5 Myrs, whereas the surface process timestep, which handles surface flow routing, erosion of bedrock and sediment, and sediment transport, is set at 1,000 kyrs. These are typical TISC time steps for the space and time scales of this study. Supplementary materials S1, S2 contain additional information about the model settings (see Supplementary Table S2 for model parameters).
2.2 Construction of rift model and sensitivity cases
A continental rift system is a complex geologic feature that develops due to extensional tectonic forces that cause the lithosphere to stretch and undergo thinning (McKenzie, 1978). These processes give rise to a complex structure characterized by faults, horsts, and grabens, often associated with volcanism (e.g., Corti, 2009). The structure of a rift system can be divided into three principal domains, including the axial, shoulder (e.g., Van Balen et al., 1995), and rift flank (e.g., Masek et al., 1994) domains, each displaying distinct geologic features and vertical motions.
In the model, lakes naturally emerge within rift basins, becoming critical hubs for the interplay between tectonoclimatic forcings. The lakes significantly influence the distribution and cycling of water, nutrients, and energy across their encompassing landscapes (e.g., Downing et al., 2006; Carpenter et al., 2011). The landscape evolution paper by Berry et al. (2019) explores half-graben geometry in a comparable model domain that includes a single rift basin, focusing on the transition from an internal to an external drainage system. Like Berry et al. (2019), we concentrate on analyzing the surface hydrology that arises from tectonic extension (Supplementary material S3). Our primary objective does not lie in the pursuit of producing a precise representation of the tectonic and geological phenomena per se, but rather in extracting pertinent information pertaining to the hydrologic system evolution.
The model domain has an area of 200 × 200 km2, discretized into 1 × 1 km2 cells. Within this area, there are two rift basins that are positioned in an en-echelon pattern (Figure 3B), which is reminiscent of the San Luis Basin in the northern Rio Grande Rift and the Española Basin located further south (Figure 2). The unique positioning of the two rift basins in the model domain gives rise to a landscape that has distinct geological, hydrological, and ecological characteristics compared to other regions. Basin opening, or syn-rift extension of the crust, begins at 0 Myr, following a 2-Myr spin-up period during which a drainage pattern “imprint” forms on the domain surface. The spin-up step is crucial for establishing antecedent drainage patterns. The accommodation zone, the area between two basins, spans a width ranging from 10 to 20 km (Figure 1) and is modeled as a transfer zone. The basin opening rates vary between 1 and 5 mm/year, equivalent to 1–5 km per Myr, depending on the scenario. The opening rates are held constant over time. The opening of the two basins exhibits an alternating asymmetric pattern, with one opening eastward and the other westward. The overlap across the accommodation zone, another sensitivity parameter, varies between 10 and 30 km (Figure 1).
This study presents a base-case scenario, conducting a simulation of rift extension over a duration of 20 Myrs, resulting in a cumulative basin width of 60 km. The tectonic block displacement rate chosen for this scenario is 3 mm/year, and the width of the accommodation zone in the base-case scenario is 10 km. Throughout the simulation period of the base-case, the climate is assumed to remain constant, with mean annual precipitation (MAP) fixed at 1,000 mm/year. To explore the sensitivity of the results, additional models are constructed by individually varying parameters or climate scenarios, as presented in Supplementary Table S1.
2.3 Connectivity metrics
Metrics acquired through an analysis of each cell at discrete 0.5 Myrs intervals, form the cornerstone of the analysis. The metrics are calculated immediately after each timestep is completed, and interpreted through the creation of spatiotemporal visualizations, a selection of which are incorporated within the Supplementary Figures S1–S7. The primary analytical method, however, involves the application of statistical analysis to the data from each time step, resulting in multiple scalar metrics that are tracked over time. This approach uses statistical tools such as moments (e.g., spatial mean), quantiles, and extreme values to derive representative, consolidated values. Several of these metrics inherently require summation across cell values. This approach condenses vast arrays of data into a more manageable form, enabling us to draw meaningful conclusions over an expansive temporal scale.
TISC is an indiscriminate landscape evolution model that treats hillslopes and stream channels together. It computes the volumetric streamflow for each 1-km cell, ensuring every cell contains a measurable quantity of flowing water. The ensuing spatial variability in cell streamflow provides information about SHC. Cells with little streamflow represent areas that are unlikely to sustain aquatic life, in contrast to those with consistently high flow rates. The spatial frequency of these flow rates serves as a window into connectivity, raising a pertinent question: Is flow uniformly distributed across numerous cells, or is it sequestered within the confines of major channels and a select few cells? Insights into these phenomena are glimpsed through the prism of cell flow-rate statistics. A broad suite of streamflow statistics, incorporating measures of variance, skewness, and kurtosis of the surface flow (or volumetric discharge) are analyzed here. Time-series data for these statistical parameters are generated, endowing us with the capacity to probe the temporal dynamics inherent within the surface hydrological system.
Morphometrics are produced for each model snapshot. These include the Terrain Ruggedness Index (TRI; Riley et al., 1999), which quantifies the amount of elevation change between adjacent cells and thus indicates the roughness of the terrain, and the Topographic Wetness Index (TWI; Beven and Kirkby, 1979; Moore et al., 1991; Boehner and Selige, 2006), which is a hydrologic indicator that combines slope and upstream contributing area to predict areas of saturation, among other conditions. Both metrics assess the suitability of the evolving topography (landscape) for aquatic species migration. The TRI reveals the degree of hydrological fragmentation of the domain surface, while the TWI indicates how conducive the surface is to water flow. These metrics play a crucial role in enhancing the understanding of the magnitude of changes occurring at each time step by offering quantified measures of the topographic controls on SHC.
The investigation includes monitoring the dynamics of knickpoints, which represent sudden transitions in the longitudinal profile of streams or rivers. Knickpoints play a crucial role in species migration since these locations with rapid slope change usually prevent aquatic species to migrate upstream (e.g., Rice et al., 2001), and possibly lead to desiccation of downstream habitats (e.g., Larsen et al., 2016). Shifts in location and occurrence of knickpoints are tracked. Knickpoints are pinpointed based on an along-stream slope exceeding 10% and a flow rate above 0.03 m3/s. The slope value factors in the requirements of weak-swimming aquatic species, referencing prior studies that have constructed anthropogenic passages for various aquatic species (Powers and Orsborn, 1985; Behlke et al., 1991; Adams et al., 2000).
Entropy metrics are calculated to capture the timings of abrupt hydrologic changes. In this study, entropy is used to indicate the spatial variability of streamflow across consecutive timesteps. These metrics include joint entropy (JE), conditional entropy (CE), and mutual information (MI). For more details of entropy metrics, see Supplementary material S5.4. Calculations are conducted over intervals of 0.5 Myr (one tectonic timestep), creating a chronologically ordered sequence of entropy values. This sequence illustrates the evolving degree of changes in streamflow distribution over time. Such a time-series offers insights into the spatial organization and reorganization of drainage networks, aiding in various applications like assessing the impact of different factors on the system's dynamics. A higher JE value, in particular, indicates a greater degree of combined spatial variability in the two systems.
Monitoring the progression of entropy metrics helps track the temporal changes in spatial variability in streamflow. High JE values indicate increased spatial variability between consecutive streamflow snapshots, reflecting a complex spatial organization. CE measures informational continuity between timeframes, with high values indicating little carryover and greater spatial variability. MI assesses the reduction in variability achieved by knowing the previous streamflow state, where high MI suggests strong informational correlation and reduced variability. Fluctuations in these metrics over time signal changes in the system's variability, with abrupt shifts indicating rapid changes and gradual variations pointing to a slower evolution. This analysis enables understanding the rate and nature of variability evolution within the system.
In rift systems with distinct terrains like basins, shoulders, and flanks, using region-specific metrics, especially for rift basins, aids in focusing analyses on the unique characteristics and dynamics of these areas.
This study analyzes the contributing area of each rift basin, which delineates the flow into each basin. The continuous spatial translation of portions of the model domain's land surface due to tectonic extension implies that some elements of the land surface exit the model domain at its boundaries (Figure 3B), and the fluvial catchment systems nested within the shifting crustal subdomains adhere to their specified trajectories. Movement of crustal blocks subsequently leads to a portion of watershed being displaced by rift basins or ultimately conveyed beyond the confines of the model domain. Therefore, the metrics account for the movements of two listric faults and the overlying tectonic blocks. To depict these overall changes, most of the metrics encompass the analysis of the entire model domain. The derivation of all metrics is documented in Supplementary material S5.
3 Results
3.1 Co-evolution of overall drainage network with the rift system
The formation of two rift basins (northern and southern) above listric faults incites substantial alterations in surface topography, consequently disrupting the efficient transportation of water to downstream areas (Figure 4). These rift basins serve to segment the pre-existing drainage network into several distinct sections, potentially inhibiting the preservation of their original connectivity through the antecedent drainage (as further discussed later and demonstrated in Figure 4). Basins formed during the syntectonic phase exhibit dimensions of up to 60 km in width (Figure 3B) and 6 km in depth, corresponding to the base of listric faults. Depending on the specific scenario, the sediment stored in each basin can reach depths of up to 6 km, though this is decreased during syntectonic activities as a result of lithospheric, isostatic rebound. Rift flanks form that, dependent on their height and uplift rate, may form the boundaries between adjacent watersheds (Figures 3, 4). In the base-case model, an inherited drainage in the lower basin continues its NW-SE course throughout the rift opening phase.
As a consequence of flow accumulation, lakes are formed within the basins, creating potential intra-basin pathways for aquatic species (refer to Figures 4, 5). The overall SHC across the entire domain is primarily influenced by the size and connectivity of each basin, particularly the connection between the two basin lakes (see Supplementary material S5.3 for more details). In contrast to the study conducted by Berry et al. (2019), rift basins in the base-case are inherently exorheic, meaning they drain water and sediment out of the system (Figure 4). The lower basin is exorheic because its rift flank uplifts are not as pronounced as in the Berry et al. (2019) study. The upper basin is exorheic because it utilizes an inherited drainage to connect the lower basin. When the interbasin river breakthrough (i.e., a river that connects two basins through the accommodation zone; IB) is active, two distinct major watersheds combine into a single system. However, when IB ceases to exist, a significant division occurs, resulting in the separation of the two distinct major watersheds, one for the upper rift basin and another for the lower rift basin.
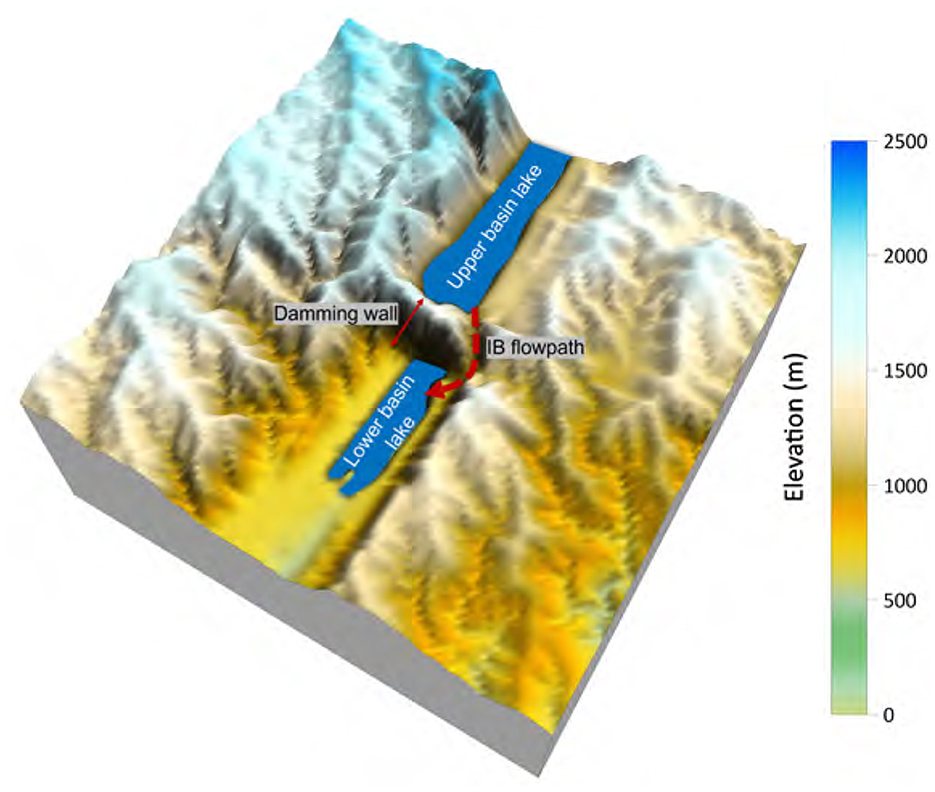
Figure 5. IB flowpath and the shape of the damming wall. The domain in the figure represents 50 × 50 km2 around the IB location, and generated using the snapshot of 3 Myrs after rifting initiation.
The presence of an accommodation zone serves as a barrier, effectively isolating two basins from one another until an IB event occurs (marked by the red dashed lines in Figures 4D–F), resulting in the creation of a pathway between the basins. The damming wall arises due to the strike-slip movement occurring along the boundaries of the two rift basins (Figure 3B). In the base-case scenario, IB occurs at 3 Myrs after rift initiation (Figure 4D), facilitating the overflow of water and sediment into the lower basin. The pathway takes advantage of the initial exorheic (i.e., outflow of water from the basin) drainage route (cf. Figures 4B, C), gradually cutting deeper into the lower basin to form a connecting river (Figures 4D–F, 5). In the model results, it is evident that IB acts as the sole pathway that establishes a connection between the northern (higher elevation) and southern (lower elevation) rift basins.
As the process of rift extension in each basin persists, the depocenter, which represents the primary sediment and water accumulation zone, progressively shifts away from the initial surface trace of the listric fault. As rift basins move farther apart due to extension, the depocenter also shifts (Figure 6). Continuous sedimentation focused on the depocenter causes the basin to overfill, raising the lake stage (not shown visually) and eventually leading to exorheic spillage. Following the cessation of interbasin (IB) flow, sediment and water transport in the northern rift basins are redirected toward the exorheic drain located at the southwestern corner (Figures 6E, F). Due to the blockage of the previous IB flowpath by basement hills in each rift basin, water in the northern basin reverts to its antecedent drainage pattern near its SE corner instead of using the IB path. This leads to the fragmentation and abandonment of the established interbasin connection, lowering the SHC. The depiction of drainage evolution within the rift system through an animation is available in a GitHub repository (https://github.com/hanhydro/Frontiers2023).
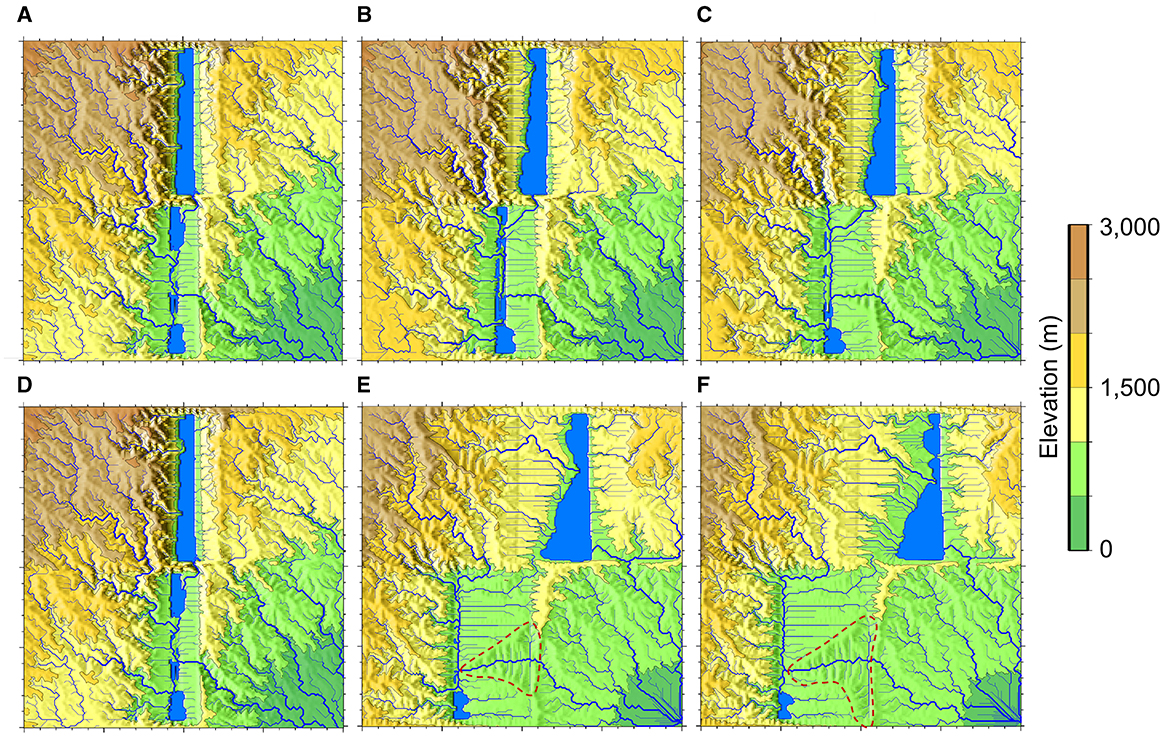
Figure 6. Late stages of rift surface hydrologic evolution. Topography and drainage patterns from (A) 7.5 Myrs; (B) 10 Myrs; (C) 12.5 Myrs; (D) 15 Myrs; (E) 17.5 Ma; (F) 20 Myrs. IB disappears around 17 Myrs [between (D) and (E)].
In the initial few Myrs of rift extension, there is a substantial surge in the number of knickpoints (Figure 7). These primarily form on the rift flanks, as the rift basins rapidly subside and the steep topography of the flanks develop. As the extension continues, these knickpoints gradually dissipate due to a combination of local baselevel changes, as well as erosional and depositional processes (Figures 7D, 8A).
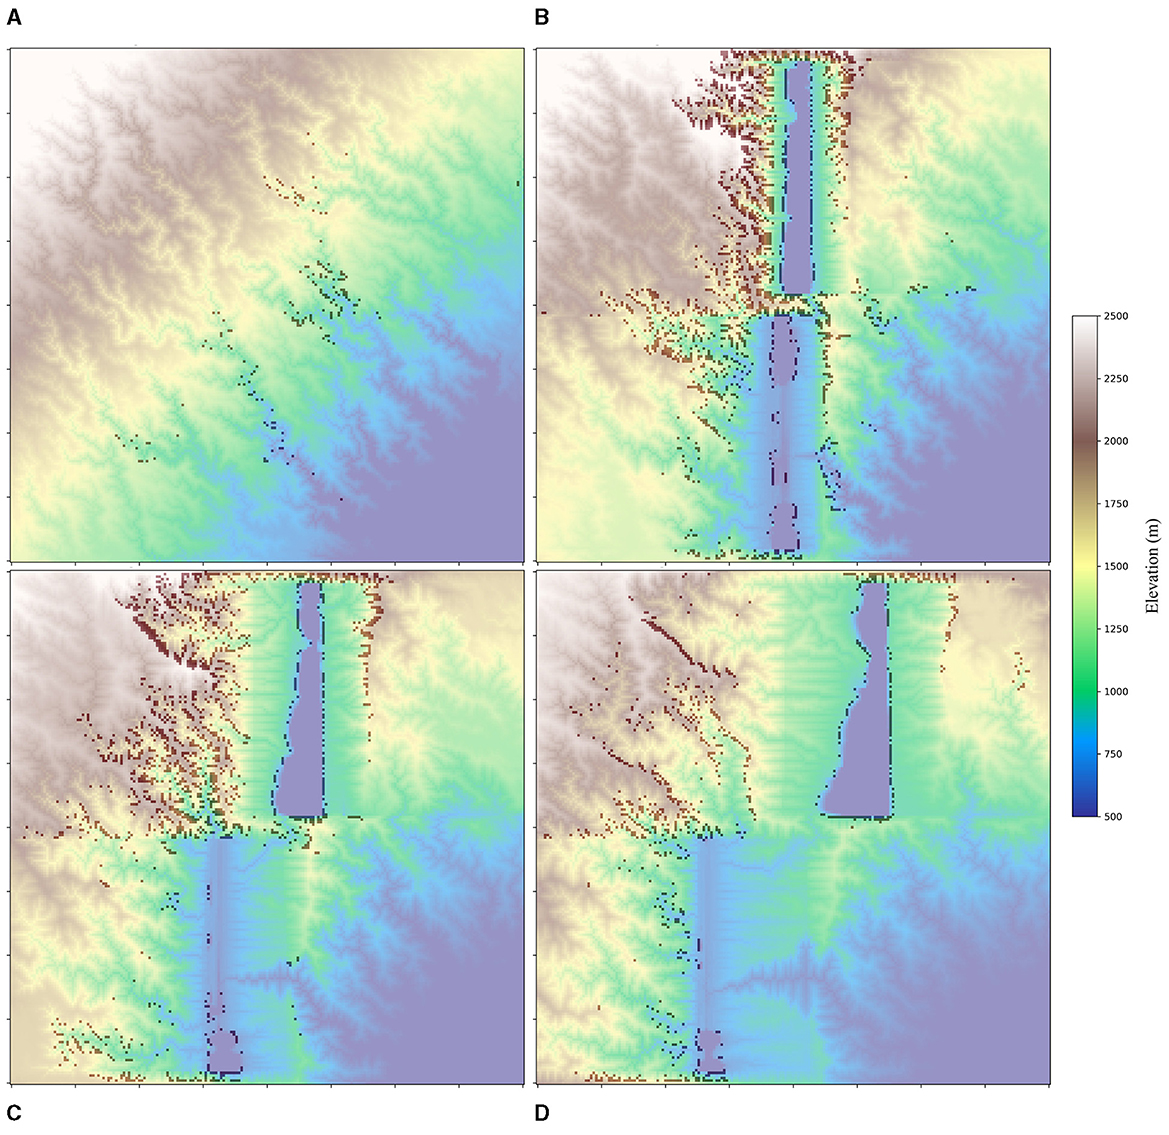
Figure 7. Knickpoints (darker spots) identified from different timesteps. (A) 0 Myr (at the initiation of rift); (B) 5 Myrs; (C) 10 Myrs; (D) 15 Myrs.
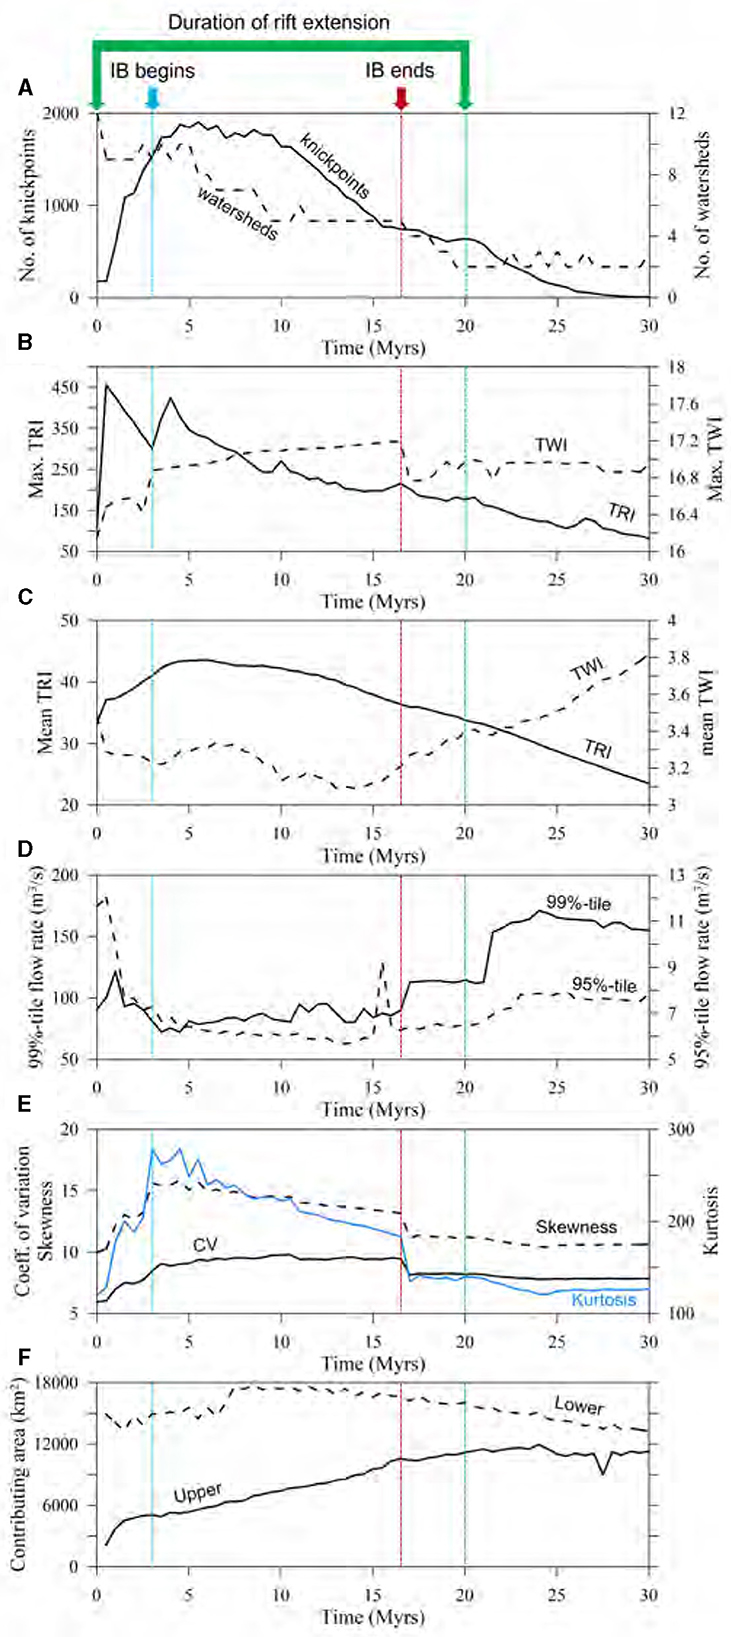
Figure 8. Time series of flow and morphometrics. (A) Changes in number of knickpoints and watersheds during the simulation period; (B) maximum TRI and TWI; (C) mean TRI and TWI; (D) 95 and 99%-tile flow rate; (E) coefficient of variation, skewness, and kurtosis of flow rate; (F) contributing area of each upper and lower rift basin. All metrics are obtained from data over the whole model domain of 200 × 200 km2. 0 Myr refers to the moment of rift initiation. TRI and TWI represent terrain ruggedness index and topographic wetness index, respectively. The plotting interval is 0.5 Myrs.
Over time, the number of watersheds reduces, signaling a reorganization of the flow regime that increasingly centers on rift basins (Figure 8A). This consolidation incorporates the drainage area external to the rift basins, thus transforming the area into rift-basin-centric hydrographic systems (Figures 5–7). As a result, the rivers within the model domain ultimately fall into one of two categories: those that are connected to the rift basins, and those that are not.
3.2 Water discharge statistics and basin-centered metrics
Topography and water discharge at each timestep are analyzed statistically to gain an understanding of rift system evolution (Supplementary material S5). Figure 8 shows various metrics that can serve as connectivity metrics. From the perspective of flow (discharge) statistics, the time-series plots (Figures 8D, E) reveal that the most decisive factor influencing these statistics is the process of rift extension itself, followed by the IB, and subsequently, the cessation of rift extension. The commencement of rift extension triggers a significant increase in the number of knickpoints, attributable to the alteration of the initial landscape and the formation of rift basins (i.e., lowering baselevel; Figure 8A). Subsequently, a gradual decrease in the number of knickpoints is observed over time as the rift-basin depocenters shift and sediment deposition smoothens the topography around the transition zone between the mountains and sedimentary basins (specifically, the abrupt accommodation space delineating the surrounding mountains and rift basins). The presence of knickpoints serves as a potential barrier to functional SHC, particularly impacting the migration and dispersal of aquatic species. Therefore, an increase in the number of knickpoints can be regarded as an indication of the extent of intra-basin fragmentation, which is characterized by lower SHC. This concept has been discussed in various studies (e.g., Pringle, 1997; Muehlbauer and Doyle, 2012; Lyons et al., 2020). The role of knickpoints thus highlights the influence of landscape features on the patterns of water movement and the biological processes they support.
Following the onset of rift extension, which begins after 0 Myr as depicted in Figures 8B, C, there is an observed increase in both Terrain Ruggedness Index (TRI) and Topographic Wetness Index (TWI) until interbasin breakthrough (IB) begins, except the case of mean TWI. This suggests that there is a heightened variation in elevation changes, accompanied by an expansion of water-saturated areas characterized by high flow accumulation. However, simultaneously, there is a decrease in discharge within the downstream regions situated in the Southeast quadrant due to the interception of water by rift basins, which is observed as a decline in the mean TWI from 0 Myr to the occurrence of IB. In the presence of IB, a rising trend in the maximum TWI, coupled with a general decrease in the mean TWI, becomes evident. The pattern observed from 3 to 17 Myrs (Figures 8B, C) indicates the expansion of rift basins, which accumulate more water compared to surrounding areas like rift flanks and external drainage regions. This condition bifurcates the domain into areas of relative wetness (within the rift basins) and dryness (beyond the basin peripheries). Such a shift in hydrologic conditions is largely ascribed to the emergence and growth of rift basins. The basins act as natural water collectors, channeling and holding a large part of the area's water within their boundaries. Consequently, this concentration of water within the basins leads to comparatively drier conditions in the areas beyond their confines, setting the stage for a distinct partition of wet and dry zones across the landscape.
The level of fragmentation in drainage network can be surmised indirectly from the comparison between maximum and mean TWI (Figures 8B, C). An increase in maximum TWI coupled with a decrease in mean TWI suggests the presence of areas accumulating significantly more water relative to others, indicating more fragmentation in the surface flow regime. Upon the disconnection of the IB pathway at 17 Myrs (Figure 6B), an almost monotonous escalation in mean TWI is observed. This augmentation does not appear to be directly tied to the IB's flow distribution effects. Rather, it is attributable to the cumulative impact of sediment accumulation (and the consequent rise in base level) in rift basins, the cessation of IB, and the intensified erosion in the southeastern corner of the model domain. These multifaceted factors contribute to the overall smoothing of the topography and flow distribution, suggesting a reduction in hydrologic fragmentation across the two principal watersheds (Figures 6B, C). Hence, these findings highlight the erosion and deposition with tectonoclimatic forcings in shaping the drainage network's structure and fragmentation level.
Insights gleaned from the 95-th and 99-th percentile flow rate plots indicate that the reorganization of watersheds, triggered by rift extension, markedly disrupts the antecedent surface-flow regime (Figure 8D). The initial impact of this disruption fragments the extensive, continuous flow of rivers into discrete hydrologic units, which are subsequently redistributed into stream fragments oriented toward rift basins. Following the cessation of rifting, these fragments experience increased longitudinal connectivity, resulting in a higher flow rate. An increase in skewness signals that the majority of flow rates are decreasing, while certain locations, such as confluences, experience significantly higher flow rates. This indicates that watersheds are undergoing a process of combination (Figure 8A), showing a decreasing trend in the number of watersheds. An elevated kurtosis, on the other hand, indicates a higher frequency of extreme flow rates-either exceptionally high or low-within the domain, which echoes the implications drawn from the skewness. Furthermore, a heightened coefficient of variation (CV) reveals a substantial degree of variability in the flow rates in comparison to the mean flow rate. This is indicative of a domain characterized by increased topographic roughness. While not explicitly represented in the plots, there was an observed increase in the stream order according to the Strahler system (Strahler, 1957), rising from six (at rift initiation) to eight during rift extension, and then stabilizing at seven post-rifting. The distribution of water discharge and its corresponding statistical characteristics are influenced by the manifestation of IB. As evident in Figure 8E, IB mediates the asymmetry in the flow distribution, fostering a more balanced dispersal of flow across the region. This redistribution consolidates the flow into a rift-centric system characterized by a central, axial river.
The metrics centered around the rift basins, specifically the upper and lower contributing areas, serve as tools in delineating the evolution of stream and watershed capture over time (Figure 8F). As time progresses, there is a steady expansion in the contributing area of the upper basin. Conversely, the contributing area of the lower basin demonstrates modest fluctuations throughout the simulation period. This behavior results from a combination of factors: the initial orientation of the domain slope (northwest-southeast) and the directions in which the rift opens. These factors selectively influence the organization of watershed and stream captures. The time-series trends for the lower contributing area result from the watershed expansion downstream of the lake outlet. As more watersheds and streams are captured by the watershed extending from the southern basin outlet, the contributing area of the southern rift basin decreases (compare the areas enclosed by red dash lines in Figures 5, 6E, F). This lake outlet watershed is not part of the lower rift basin (Figure 6).
The analysis of JE, CE, and MI streamflow-entropy metrics is illustrated in Figure 9. The time-series representation of each entropy value captures the beginning and cessation of rift extension. However, it does not offer insights into the timings of IB as do other flow statistics. Examining the overall shape of each time-series plot (Figure 9), the spatial variability of discharge distribution across the domain undergoes a sudden increase due to the effects of rift extension. Likewise, it experiences a rapid decline once the extension stops (20 Myrs). The smaller peaks in the time-series signify significant stream or watershed capture events between two time steps, amplifying the spatial variability of streamflow of the preceding step.
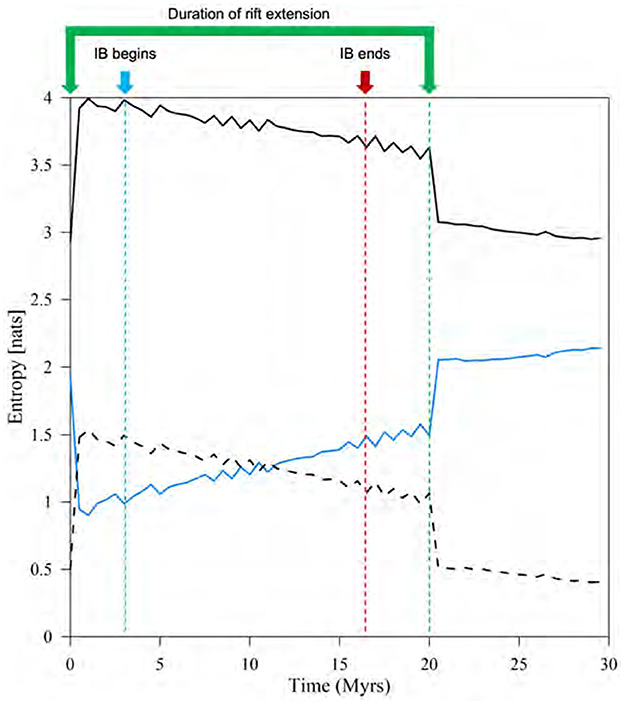
Figure 9. The time series of joint entropy (black solid line), conditional entropy (black dashed line), and mutual information (blue solid line). These metrics were calculated using two consecutive snapshots of water discharge over the entire simulation period.
3.3 Climatic effects
Two different kinds of climate sensitivity analyses were conducted. (1) scenarios using different constant mean annual precipitation (MAP) values throughout the simulation period including the post-rift phase, and (2) cases considering only post-rift climate change dynamics. This study focuses on investigating IB, a key feature in rift systems leading to axial rivers, to structure the results. Across the studied models, the occurrence of IB is primarily influenced by mean annual precipitation, MAP. IB connections fail to develop when the MAP exceeds or equals 1,250 mm/year (Figure 10D). Conversely, decreasing MAP accelerates the onset of IB, taking ~1.5 Myrs for a MAP of 500 mm/year, and around 3 Myrs for MAP values of 750 and 1,000 mm/year (Figure 10). The absence of IB at higher MAP is attributed to the erosion of the riverbed resulting from the initial spillage of exorheic lake water. This spillage prompts further incision of pre-existing stream channels, thus enhancing antecedent pathways rather than facilitating the connection between the two basins. At lower MAP levels, lake water tends to be contained in the basin.
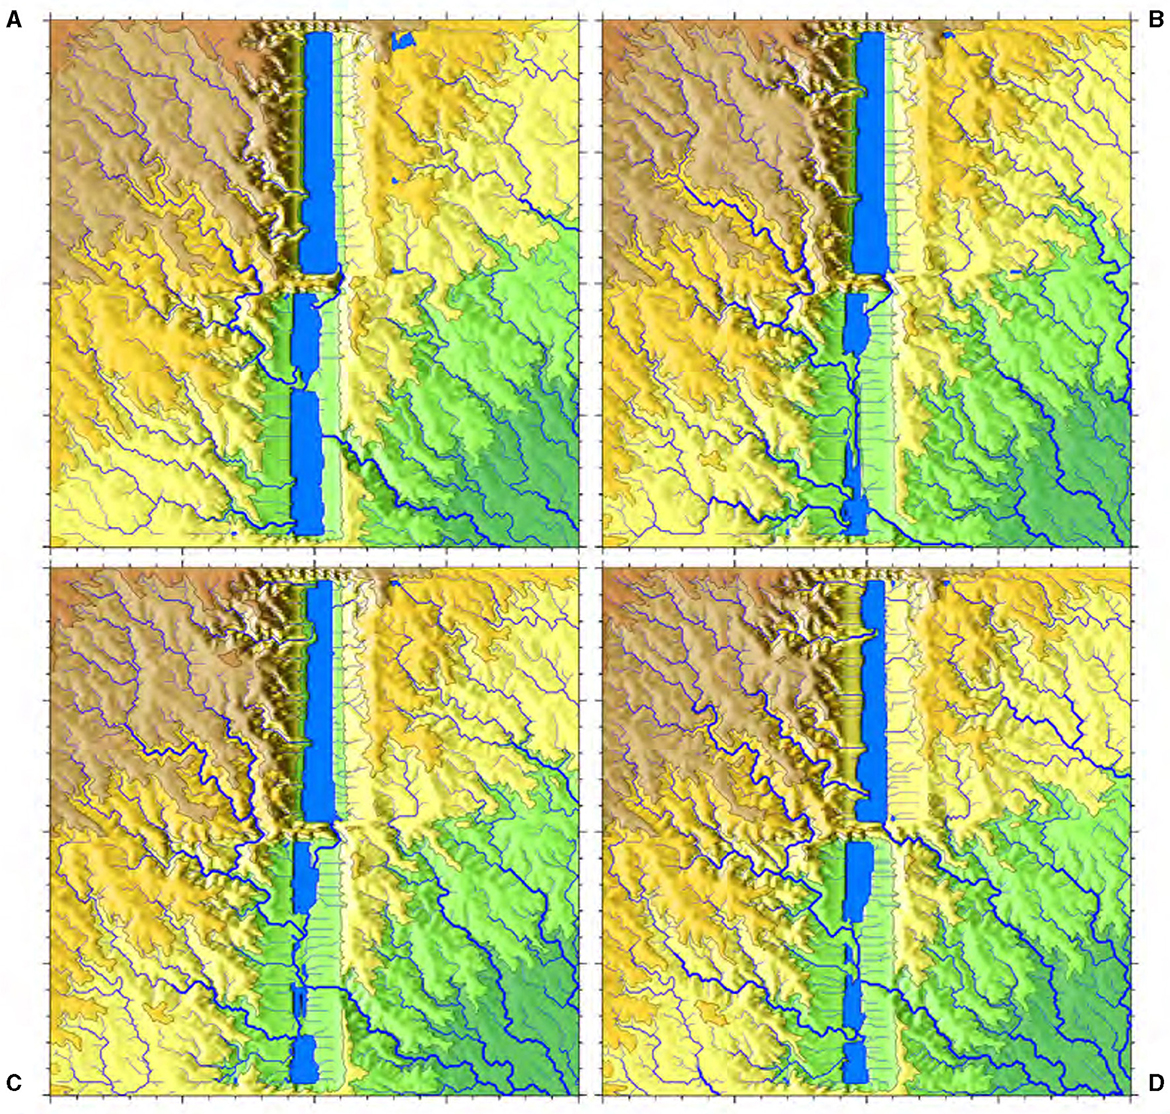
Figure 10. Snapshots illustrating the simulation results during the syn-rift stage at 5 Myrs, under different constant MAP conditions. They display the topography and drainage patterns corresponding to (A) 500 mm/year; (B) 750 mm/year; (C) 1,000 mm/year, which is the base-case scenario; and (D) 1,250 mm/year.
Post-rift climate change scenarios have minimal impact on the overall drainage patterns, as the landscape has already adapted to higher precipitation levels (represented by the black solid line at 1,000 mm/year in Figure 11A). The only notable change observed is in the number of knickpoints (Figure 11B). Knickpoints decrease faster in the cases with faster reduction rate in MAP, indicating less headwater migration of the knickpoints. There were no significant alterations observed in the spatial distribution characteristics of water discharge over time, as indicated by the absence of major changes in flow statistics (not shown). Despite the drying climate conditions associated with decreasing MAP, flow routing and SHC remain relatively stable. This is due to deeper stream incisions under past high mean annual precipitation (1,000 mm/year) and slower erosion and incision under drier climate conditions that cannot change antecedent drainage patterns.
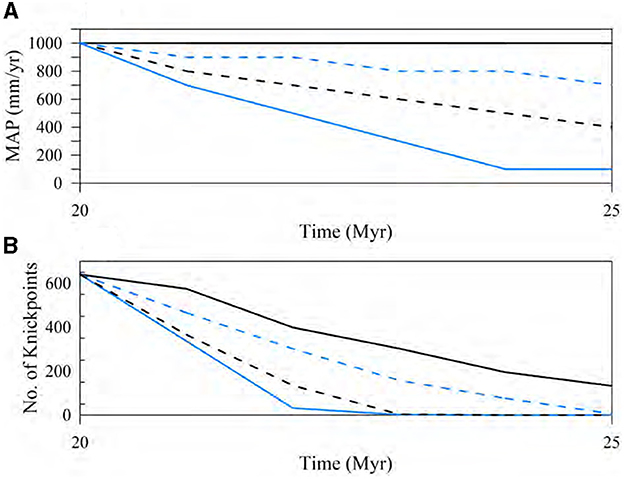
Figure 11. Time series plots depicting the effects of (A) post-rift climate change scenarios with varying decreases in MAP, alongside (B) the corresponding number of knickpoints represented by lines of the same color and style. The black solid lines in each plot represent the base-case without any post-rift climate change. The plotting interval is 0.5 Myrs.
3.4 Effect of initial conditions and physical parameters
Initial conditions and physical parameters, particularly the orientation of the initial slope, play a crucial role in determining the final SHC. Especially, the initial slope significantly influences the drainage pattern, as well as the timing and location of IB and lake overflow (Figures 3, 4). When the slope orientation aligns along a North-South axis (Supplementary Figure S3a; contrasting with the base-case of a Northwest-Southeast orientation), the potential for an IB becomes universal across all cases. The basins are then aligned with natural drainage direction and the accommodation zone (AZ; Figure 3) dam between the basins is more easily eroded, being oriented perpendicular to the slope.
Considering Northwest-Southeast oriented cases, including the base-case scenario, the occurrence of an IB is contingent upon factors such as basin opening rates, the overlap (initial positioning of the basin), and MAP. The extent of basin overlap, as depicted in Figure 3B, primarily influences the timing of the IB event, rather than the actual occurrence of the IB itself. The basin opening rate is the most important factor controlling IB and the routing of water from the upper basin to the lower basin. It dominates the process of erosion and transport by transferring the location of depocenter (i.e., the lowest elevation in each basin), and positions the local baselevel. When the opening rate is high, the depocenter moves away faster and the water in the upper basin is unable to breach the AZ dam, therefore no IB occurs. The duration of basin opening controls the shape of the landscape by designating the maximum area (or width) of rift basins. However, continued extension of crust also translates the depocenter of each basin, resulting as separation of rift basins, disconnecting the pre-existing IB (Figure 6). The magnitude of initial slope also affects overall connectivity (see Supplementary Figure S1 and Supplementary material S4). If the slope is high, rift basins tend to remain disconnected and essentially exorheic, but when the slope is low, rift basins remain endorheic and eventually develop IB. Accommodation widths also control the occurrence of IB, and the models do not exhibit IB with accommodation zone width >15 km (Supplementary Figure S3). Initial drainage imprinting duration (spin-up) seems to have limited impact on syn-rift drainage reorganization, but further investigation with additional test cases is necessary for confirmation.
4 Discussion
4.1 Hydrologic evolution of a rift system
Rift extension promotes the development of integrated and connected drainage patterns, primarily by funneling water into rift basins. These basins serve as focal points for flow accumulation and, in conjunction with interbasin breakthrough (IB), contribute to the formation of a large, connected watershed (Figure 6A). Therefore, SHC increases during rift extension (cf. the drainage patterns of Figures 4A, 6A, 8A). The number of watersheds decrease, and contributing area of both rift basins increase over time.
This process results in both fragmentation and instances of stream or watershed capture. As the rift system extends, it significantly alters drainage networks, leading to a distinct east-west separation in the surface drainage network. The drainage west of the upper basin becomes disconnected from the east (cf. Figures 4A, 6A). A notable disconnection occurs with the longest river, which initially flowed from northwest to southeast (Figure 4A) but later redirected into the lower basin after IB formation. The northwest and southwest quadrants predominantly drain into the lower basin, with the northwest quadrant also partially contributing to the upper basin. Without an IB, the flows in the northwest and southwest quadrants remain separate until converging in the southeast corner.
The formation of an IB is dependent on the overlap of lakes within each basin. This overlap causes spillover of the northern lake, amplifying the stream power on the pre-existing drainage pattern of the accommodation zone (AZ), paving the way for the IB's inception. However, as tectonic extension continues and sediment accumulates in both basins, the depocenters gradually shift apart, increasing the distance between the lakes in each basin. Lake stages significantly influence the occurrence of IB. When a basin has a high rate of opening, the lake stage tends to decrease. As a consequence, each rift basin tends to drain over the rift flanks instead of flowing into other basins, leading to the formation of non-connected basins. In the case of a basin draining outside (i.e., exorheic basin), the lake stage remains below the elevation of the spillover point on AZ where the lake would potentially drain out through IB.
The results indicate that the transition from endorheic to exorheic conditions in each rift basin is controlled by initial conditions and physical parameters. Factors such as antecedent drainage patterns before rift opening and the rate of tectonic extension applied to each basin are key determinants of SHC. Once established, the imprinted drainage patterns persist over time, enduring through IB and significant drainage reorganizations that affect the shrinkage and expansion of contributing areas. Therefore, in terms of understanding the current hydrologic condition of the Rio Grande Rift, perhaps there was an acceptable rate of extension in each individual rift basin that maintained the IBs among basins, along with accommodation zones that were not too wide, thus facilitating the generation of IBs.
4.2 Tectonics vs. climate
The syn-rift hydrologic evolution in this study indicates that the tectonic forcing drives the fragmentation of surface hydrology. Rifting-induced crustal extension reorganizes existing drainage patterns, creating a rift-basin-centered surface flow regime and shaping the landscape, setting the stage for subsequent climate-driven hydrologic changes. The simulation results, barring non-IB cases, show that IB connections form relatively easily under specific conditions, leading to increased SHC across the entire model domain.
In the part of this study focusing solely on post-rift climate changes, the impact of climate on landscape and drainage patterns is less pronounced, primarily affecting the number of knickpoints. The findings suggest that IB connections are primarily driven by tectonic movements, whereas intra-basin hydrologic connections are influenced by post-rift climate changes. The number of knickpoints, impeding upstream species migration, emerges as a crucial factor in explaining intra-basin SHC. However, the rate of reduction in knickpoints doesn't fully capture the spatial redistribution, as they tend to migrate toward headwater areas over time (cf. Figures 7A, D), enhancing SHC in lower elevations but isolating headwater areas.
The study reveals that higher mean annual precipitation (MAP) does not necessarily control connections between rift basins in terms of IB and SHC. Increased MAP can lead to non-connected rift basins due to concentrated exorheic spillage (Figure 10), and post-rift climate changes primarily affect local hydrologic connections, particularly in headwater areas (Figure 11). Elevation-dependent precipitation, which varies both spatially and temporally, was not included in the study. The inclusion of time-varying climate conditions is expected to further disconnect intra- and inter-basin flow paths due to spatial precipitation differentiation, leading to increased watershed fragmentation.
4.3 Connectivity and aquatic species evolution
The major driver in aquatic species evolution is geographical separation or isolation (e.g., Rüber et al., 1999; Burridge et al., 2008). The separation processes occur through the loss of hydrologic connectivity, as aquatic species are unable to move freely in the absence of water and its flow. The presence of knickpoints elucidates the extent of vertical separation within the surface hydrologic system, specifically the connection between mountain watersheds and downstream rift basins (intra-basin), and vice versa. A higher abundance of knickpoints poses greater challenges for the upstream migration of aquatic species (e.g., May et al., 2017). The simulated knickpoints reach their maximum number ~5 Myrs after the initiation of rift extension, followed by a gradual decline.
Based on the time-series for various metrics (e.g., Figure 8), it becomes evident that the initial millions of years of tectonic activity play a crucial role in geographical separation. This is supported by the fact that post-rift and syn-rift climate changes have minimal impact on the metrics that reveal SHC. Therefore, to address the question of when species evolution is most impacted by climate and tectonics, the early stage of tectonic evolution should be the focal point. However, it is important to acknowledge a potential bias in this analysis, as the majority of species of interest found in the present day have evolved relatively recently, long after the most active period for speciation suggested by the SHC metrics. Even if high SHC was established during the early stages of rift extension, there is a suspicion that later climate change played a significant role in driving the majority of surviving and observable endemism (i.e., the ecological state of a species being unique to a geographic location).
The topographic characteristics of rift basins prevent free migration of aquatic species upstream due to increase in knickpoints. Due to these and other topographic barriers, once they are confined within rift basins it becomes difficult for water and aquatics species to escape due to the limited availability of exorheic spillage locations. A component of SHC that changes proportional to the rift opening is intra-basin watershed connections. When extension takes longer (wider basins), surface processes on the rift flanks are promoted, resulting in a high degree of knickpoint migration and smoothing.
This study highlights key temporal and spatial points for examining SHC in continuously changing landscapes. For instance, the location of knickpoints can signal where significant hydrologic disconnections occurred, and the onset and cessation of IB can reveal the timings of abrupt connections and disconnections that impacted species migration. The results can be applied to estimate species divergence times or to make comparisons with existing species cladograms, thereby helping to elucidate the history of aquatic species evolution. This research paves the way for more advanced models of SHC aimed at helping to determine the degree to which SHC controls the divergence timings of aquatic species.
4.4 In search of comprehensive SHC metrics
Figures 8, 9 demonstrate how scalar metrics respond to 30 Myrs of hypothetical rift evolution, highlighting the response of the system to rift opening. The integration of watersheds into a unified hydrologic system through IB enhances domain-wide SHC, potentially aiding aquatic species migration. Metrics indicating the beginning and end of IB are particularly vital. Additionally, knickpoints are effective indicators of functional SHC that facilitate species movement (e.g., Kollaus and Bonner, 2012; Ruppel et al., 2020). Many metrics, sensitive to the initiation and cessation of rift extension, watershed or stream capture, and IB, are useful in reconstructing paleo-hydrologic histories. Thus, the number of watersheds, knickpoints, Terrain Ruggedness Index (TRI), Topographic Wetness Index (TWI), entropy, and flow statistics are all valuable metrics for assessing SHC.
The selected application of these metrics is suggested, depending on specific objectives. For instance, to monitor overall hydrologic system changes, the number of watersheds, TRI, and TWI emerge as appropriate metrics. If the goal is to understand intra-basin SHC alterations, employing contributing area metrics proves beneficial. To elucidate how global drainage patterns reconfigure due to external forces, scrutinizing flow rate statistics is recommended (Figure 8D). And to account for aquatic species migration, utilizing the number and spatial distribution of knickpoints as measures of SHC is appropriate. This approach involves assessing the rule-based longitudinal connectivity of whether a flowpath is passable or not, as discussed in previous studies (Cote et al., 2009; Jaeger et al., 2014).
While domain-scale metrics provide insights into SHC changes, their ability to offer clear interpretations can be limited. For example, during periods with IB, models show increased SHC, yet this is not accurately reflected in the number of basins due to the inclusion of non-rift-basin watersheds (Figure 8). This is because these metrics represent hydrologic changes across the entire model domain, leading to high SHC values even if actual inter-basin connectivity is not well represented. Discrepancies arise when comparing maximum connected river lengths (i.e., the longest reach in the domain) in scenarios with and without IB; higher lengths are observed in scenarios where two watersheds are separated (859 km) compared to connected rift basins with IB (732 km), though this is not visually depicted (Figures 10C, D).
The autocorrelation inherent in flow data, such as flow accumulation downstream and bifurcation and confluence, complicates many statistical analyses that typically require independent observations. Comparing flow distributions over time indicates hydrologic changes due to tectonic and climatic shifts. Observing higher flow rate percentiles (95th and 99th) highlights areas of extreme discharge important for species migration and drainage reorganization. An increase in these percentiles over time indicates a trend toward more extreme flows due to more integrated watersheds, with water accumulating in specific areas. Conversely, a decrease suggests less spatial variability in flow and a greater number of non-connected watersheds.
There are a number of rift-related processes and conditions that this study does not address. For example, one is that real-world rift basins can undergo sequential extensions, for example, with the upper basin opening first and the second basin opening at a later time. These processes and conditions are left to future investigators.
5 Conclusions and extensions
In this study, a conceptual framework outlining the sequence of hydrologic evolution within a rift system is proposed. The sequence can be broadly summarized in two steps: (1) Tectonic forces reorganize watersheds, converging multiple basins into a rift-centric hydrologic system; (2) In response to post-rift climate change, specifically aridification, the size and extent of these drainage patterns significantly change. The results highlight the backdrop that tectonics set for geographic separation, further shaped by climate change. The sensitivity analysis on parameters like basin opening rates and mean annual precipitation showcases that the formation of an interbasin river over the accommodation zone, effectively reestablishing past hydrologic connectivity, requires specific conditions. Also, the initial slope directions and parameters such as rift opening rates significantly influence the timing, location, and even the possibility of river breakthroughs.
The suite of SHC metrics in this study, including flow statistics and morphometrics, shed light on changes in surface hydrologic connectivity (SHC) and the evolution of aquatic species. Rifting-induced watershed fragmentation significantly alters SHC. The calculation of SHC through various flow metrics show that it is strongly influenced by the formation of interbasin rivers and the overall topographic profile. Therefore, peaks and troughs in the time-series of metrics highlight key moments impacting regional hydrologic connections, potentially leading to the fragmentation of aquatic habitats and the isolation of species. By comparing these timings and the spatial distribution of flow barriers (knickpoints) against reconstructed species divergence timelines, it is possible to determine when and where evolutionary changes occurred, and perhaps what caused them.
While all the SHC metrics effectively signal hydrologic alterations within the system, they spotlight slightly different facets of the watersheds and connectivity. For a comprehensive understanding, it is recommended that future research to include additional local and site-specific metrics. More importantly, the selection of metrics should align with the specific objectives of the study to ensure a nuanced and accurate interpretation of hydrologic changes. Also, future studies should zero in on selected locations (cells) within the model domain, exploring how well these sites connect with their upstream and downstream areas using cell-by-cell and basin-by-basin metrics.
Data availability statement
The datasets presented in this study can be found in online repositories. The names of the repository/repositories and accession number(s) can be found at: https://github.com/hanhydro/Frontiers2023.
Author contributions
KH: Conceptualization, Data curation, Formal analysis, Investigation, Methodology, Software, Supervision, Validation, Visualization, Writing – original draft, Writing – review & editing. JW: Conceptualization, Funding acquisition, Investigation, Methodology, Project administration, Resources, Validation, Writing – original draft, Writing – review & editing.
Funding
The author(s) declare that financial support was received for the research, authorship, and/or publication of this article. This research has been supported by NSF Grant EAR-1516680, Collaborative Research: Tectonic and climatic forcing of hydrological systems in the southern Great Basin: Implications for ancient and future aquatic system resilience.
Acknowledgments
The authors would like to express their sincere appreciation to the editor and the reviewers for their valuable input and feedback. Special thanks are also extended to Fred Phillips, Jeff Knott, Angela Jayko, Marty Frisbee, and Jolante van Wijk for their contributions and support throughout the study.
Conflict of interest
The authors declare that the research was conducted in the absence of any commercial or financial relationships that could be construed as a potential conflict of interest.
Publisher's note
All claims expressed in this article are solely those of the authors and do not necessarily represent those of their affiliated organizations, or those of the publisher, the editors and the reviewers. Any product that may be evaluated in this article, or claim that may be made by its manufacturer, is not guaranteed or endorsed by the publisher.
Supplementary material
The Supplementary Material for this article can be found online at: https://www.frontiersin.org/articles/10.3389/frwa.2024.1255883/full#supplementary-material
References
Adams, S. B., Frissell, C. A., and Rieman, B. E. (2000). Movements of nonnative brook trout in relation to stream channel slope. Trans. Am. Fish. Soc. 129, 623–638. doi: 10.1577/1548-8659(2000)129<0623:MONBTI>2.3.CO;2
Behlke, C. E., Kane, D. L., McLean, R. F., and Travis, M. D. (1993). Fundamentals of Culvert Design for Passage of Weak-Swimming Fish. Alaska Department of Transportation and Public Facilities, Report FH WA-AK-RD-90-10.
Berry, M., Van Wijk, J., Cadol, D., Emry, E., and Garcia-Castellanos, D. (2019). Endorheic-exorheic transitions of the Rio Grande and East African rifts. Geochem. Geophys. Geosyst. 20, 3705–3729. doi: 10.1029/2018GC008176
Beven, K. J., and Kirkby, M. J. (1979). A physically based, variable contributing area model of basin hydrology/un modèle à base physique de zone d'appel variable de l'hydrologie du bassin versant. Hydrol. Sci. J. 24, 43–69. doi: 10.1080/02626667909491834
Boehner, J., and Selige, T. (2006). “Spatial prediction of soil attributes using terrain analysis and climate regionalization,” in SAGA - Analysis and Modelling Applications, eds J. Boehner, K. R. McCloy, and J. Strobl (Goettingen: Goettinger Geographische Abhandlungen), 13–28.
Bracken, L. J., Wainwright, J., Ali, G., Tetzlaff, D., Smith, M., Reaney, S., et al. (2013). Concepts of hydrological connectivity: research approaches, pathways and future agendas. Earth-Sci. Rev. 119, 17–34. doi: 10.1016/j.earscirev.2013.02.001
Burridge, C. P., Craw, D., Fletcher, D., and Waters, J. M. (2008). Geological dates and molecular rates: fish DNA sheds light on time dependency. Mol. Biol. Evol. 25, 624–633. doi: 10.1093/molbev/msm271
Carpenter, S. R., Cole, J. J., Pace, M. L., Batt, R., Brock, W. A., Cline, T., et al. (2011). Early warnings of regime shifts: a whole-ecosystem experiment. Science 332, 1079–1082. doi: 10.1126/science.1203672
Corti, G. (2009). Continental rift evolution: from rift initiation to incipient break-up in the main Ethiopian rift, East Africa. Earth-Sci. Rev. 96, 1–53. doi: 10.1016/j.earscirev.2009.06.005
Cote, D., Kehler, D. G., Bourne, C., and Wiersma, Y. F. (2009). A new measure of longitudinal connectivity for stream networks. Landsc. Ecol. 24, 101–113. doi: 10.1007/s10980-008-9283-y
Downing, J. A., Prairie, Y., Cole, J., Duarte, C., Tranvik, L., Striegl, R. G., et al. (2006). The global abundance and size distribution of lakes, ponds, and impoundments. Limnol. Oceanogr. 51, 2388–2397. doi: 10.4319/lo.2006.51.5.2388
Fullerton, A. H., Burnett, K. M., Steel, E. A., Flitcroft, R. L., Pess, G. R., Feist, B. E., et al. (2010). Hydrological connectivity for riverine fish: measurement challenges and research opportunities. Freshw. Biol. 55, 2215–2237. doi: 10.1111/j.1365-2427.2010.02448.x
Garcia-Castellanos, D. (2002). Interplay between lithospheric flexure and river transport in foreland basins. Basin Res. 14, 89–104. doi: 10.1046/j.1365-2117.2002.00174.x
Garcia-Castellanos, D., and Jimenez-Munt, I. (2015). Topographic evolution and climate aridification during continental collision: insights from computer simulations. PLoS ONE 10:e0132252. doi: 10.1371/journal.pone.0132252
Jaeger, K. L., Olden, J. D., and Pelland, N. A. (2014). Climate change poised to threaten hydrologic connectivity and endemic fishes in dryland streams. Proc. Natl. Acad. Sci. 111, 13894–13899. doi: 10.1073/pnas.1320890111
Kalb, B. W., and Caldwell, C. A. (2014). Restoration of Rio Grande Cutthroat Trout Oncorhynchus clarkii virginalis to the Mescalero Apache Reservation. Technical report. Falls Church, VA: US Fish and Wildlife Service.
Kellogg, K. S., Shroba, R. R., Ruleman, C. A., Bohannon, R. G., McIntosh, W. C., Premo, W. R., et al. (2017). Geologic Map of the Upper Arkansas River Valley Region, North-Central Colorado. Technical report, USGS Scientific Investigations Map 3382. Denver, CO: US Geological Survey. doi: 10.3133/sim3382
Kollaus, K. A., and Bonner, T. H. (2012). Habitat associations of a semi-arid fish community in a karst spring-fed stream. J. Arid Environ. 76, 72–79. doi: 10.1016/j.jaridenv.2011.08.013
Larsen, A., May, J.-H., Moss, P., and Hacker, J. (2016). Could alluvial knickpoint retreat rather than fire drive the loss of alluvial wet monsoon forest, tropical northern Australia? Earth Surf. Process. Landf. 41, 1583–1594. doi: 10.1002/esp.3933
Lyons, N. J., Val, P., Albert, J. S., Willenbring, J. K., and Gasparini, N. M. (2020). Topographic controls on divide migration, stream capture, and diversification in riverine life. Earth Surf. Dyn. 8, 893–912. doi: 10.5194/esurf-8-893-2020
Masek, J. G., Isacks, B. L., Fielding, E. J., and Browaeys, J. (1994). Rift flank uplift in Tibet: evidence for a viscous lower crust. Tectonics 13, 659–667. doi: 10.1029/94TC00452
May, C., Roering, J., Snow, K., Griswold, K., and Gresswell, R. (2017). The waterfall paradox: how knickpoints disconnect hillslope and channel processes, isolating salmonid populations in ideal habitats. Geomorphology 277, 228–236. doi: 10.1016/j.geomorph.2016.03.029
McKenzie, D. (1978). Some remarks on the development of sedimentary basins. Earth Planet. Sci. Lett. 40, 25–32. doi: 10.1016/0012-821X(78)90071-7
Molnar, P., and England, P. (1990). Late cenozoic uplift of mountain ranges and global climate change: chicken or egg? Nature 346, 29–34. doi: 10.1038/346029a0
Moore, I. D., Grayson, R., and Ladson, A. (1991). Digital terrain modelling: a review of hydrological, geomorphological, and biological applications. Hydrol. Processes 5, 3–30. doi: 10.1002/hyp.3360050103
Muehlbauer, J. D., and Doyle, M. W. (2012). Knickpoint effects on macroinvertebrates, sediment, and discharge in urban and forested streams: urbanization outweighs microscale habitat heterogeneity. Freshw. Sci. 31, 282–295. doi: 10.1899/11-010.1
Powers, P. D., and Orsborn, J. F. (1985). New Concepts In Fish Ladder Design: Analysis of Barriers to Upstream Fish Migration, Volume IV of IV, Investigation of the Physical and Biological Conditions Affecting Fish Passage Success at Culverts and Waterfalls, 1982-1984 Final Report. Technical report. Pullman, WA: Washington State University, Albrook Hydraulics Laboratory. doi: 10.2172/917018
Pringle, C. M. (1997). Exploring how disturbance is transmitted upstream: going against the flow. J. N. Am. Benthol. Soc. 16, 425–438. doi: 10.2307/1468028
Repasch, M., Karlstrom, K., Heizler, M., and Pecha, M. (2017). Birth and evolution of the Rio Grande fluvial system in the past 8 ma: progressive downward integration and the influence of tectonics, volcanism, and climate. Earth-Sci. Rev. 168, 113–164. doi: 10.1016/j.earscirev.2017.03.003
Rice, S. P., Greenwood, M. T., and Joyce, C. (2001). Tributaries, sediment sources, and the longitudinal organisation of macroinvertebrate fauna along river systems. Can. J. Fish. Aquat. Sci. 58, 824–840. doi: 10.1139/f01-022
Riley, S. J., De Gloria, S. D., and Elliot, R. (1999). Terrain ruggedness index that quantifies topographic heterogeneity. Int. J. Sci. 5, 23–27.
Rodriguez-Iturbe, I., and Rinaldo, A. (1997). Fractal River Basins: Chance and Self-Organization. Cambridge, MA: Cambridge University Press. doi: 10.1063/1.882305
Rüber, L., Verheyen, E., and Meyer, A. (1999). Replicated evolution of trophic specializations in an endemic cichlid fish lineage from Lake Tanganyika. Proc. Natl. Acad. Sci. 96, 10230–10235. doi: 10.1073/pnas.96.18.10230
Ruppel, D. S., Sotola, V. A., Craig, C. A., Martin, N. H., and Bonner, T. H. (2020). Assessing functions of movement in a great plains endemic fish. Environ. Biol. Fishes 103, 795–814. doi: 10.1007/s10641-020-00983-8
Strahler, A. N. (1957). Quantitative analysis of watershed geomorphology. Eos Trans. Am. Geophys. Union 38, 913–920. doi: 10.1029/TR038i006p00913
Van Balen, R., Van der Beek, P., and Cloetingh, S. (1995). The effect of rift shoulder erosion on stratal patterns at passive margins: implications for sequence stratigraphy. Earth Planet. Sci. Lett. 134, 527–544. doi: 10.1016/0012-821X(95)98955-L
van Wijk, J., Koning, D., Axen, G., Coblentz, D., Gragg, E., Sion, B., et al. (2018). Tectonic subsidence, geoid analysis, and the Miocene-Pliocene unconformity in the Rio Grande rift, southwestern united states: implications for mantle upwelling as a driving force for rift opening. Geosphere 14, 684–709. doi: 10.1130/GES01522.1
Whipple, K. X. (2009). The influence of climate on the tectonic evolution of mountain belts. Nat. Geosci. 2, 97–104. doi: 10.1038/ngeo413
Whipple, K. X., and Tucker, G. E. (1999). Dynamics of the stream-power river incision model: implications for height limits of mountain ranges, landscape response timescales, and research needs. J. Geophys. Res. Solid Earth 104, 17661–17674. doi: 10.1029/1999JB900120
Willett, S. D., McCoy, S. W., Perron, J. T., Goren, L., and Chen, C.-Y. (2014). Dynamic reorganization of river basins. Science 343:1248765. doi: 10.1126/science.1248765
Keywords: surface hydrologic connectivity, landscape evolution, tectonics, climate change, aquatic species evolution
Citation: Han K and Wilson JL (2024) Deciphering the interplay between tectonic and climatic forces on hydrologic connectivity in the evolving landscapes. Front. Water 6:1255883. doi: 10.3389/frwa.2024.1255883
Received: 10 July 2023; Accepted: 05 March 2024;
Published: 15 March 2024.
Edited by:
Dipankar Dwivedi, Berkeley Lab (DOE), United StatesReviewed by:
Allen Hunt, Wright State University, United StatesBoris Faybishenko, Berkeley Lab (DOE), United States
Copyright © 2024 Han and Wilson. This is an open-access article distributed under the terms of the Creative Commons Attribution License (CC BY). The use, distribution or reproduction in other forums is permitted, provided the original author(s) and the copyright owner(s) are credited and that the original publication in this journal is cited, in accordance with accepted academic practice. No use, distribution or reproduction is permitted which does not comply with these terms.
*Correspondence: Kyungdoe Han, doe.han@wisc.edu