 Elizabeth Bartuska*
 R. Edward Beighley
- Department of Civil and Environmental Engineering, Northeastern University, Boston, MA, United States
The Global Precipitation Measurement (GPM) mission provides near-real time precipitation estimates that can be used for monitoring water supply infrastructure. To better understand the potential use of GPM data products for use in relevant applications, this study examines the performance of the Integrated Multi-satellitE Retrievals for GPM (IMERG) precipitation products throughout North Carolina to capture rainfall events. Event characteristics derived from IMERG precipitation products: early (4 h latency), late (14 h latency), and final (3.5 month latency) are compared to characteristics derived from gauges (N = 282) for the period 2000–2021. Results show that the IMERG data products identify events reasonably well (mean event errors of 6.0, 6.8, and 1.7 mm for early, late, and final products; probability of detection: 0.83, 0.83, 0.86; false alarm ratio: 0.20, 0.18, 0.18, respectively). While the final product performs best, the early and late products perform similarly. While additional research is needed to better understand factors leading to under- and over-estimates of event magnitudes, the findings from this study support the potential use of early/late IMERG data products in water supply monitoring or flood warning systems, where rapid estimates of event precipitation characteristics are needed.
1 Introduction
Reliable access to an adequate supply of safe drinking water is essential for human health (Meehan et al., 2020) yet many in the United States, and even more globally, lack the infrastructure needed to provide this vital resource. In the U.S., there are nearly 50 million residents reliant on unregulated private wells, which do not have the same level of protection from drinking water hazards as those served by regulated municipal water (Fox et al., 2016). This is especially problematic after flooding events where surface water pathways lead to increased rates of well water contamination (Morris and Levin, 1994; Rose et al., 2001; Dieter et al., 2018; Dai et al., 2019; Pieper et al., 2021). For example, following Hurricane Harvey wells located in flooded areas throughout North Carolina were 2–3 times more likely to test positive for total coliform and E. coli (Pieper et al., 2021).
To enable a suite of precipitation related applications (e.g., flood warning, crop management, public health linked to drinking contaminated well water), near-real time monitoring systems are needed to alert the public of the potential risks resulting from surface flooding and activation of shallow subsurface flowpaths. While remotely sensed observations of surface reflectance and/or radar backscatter have been widely used to map flood inundation (DeVries et al., 2020), surface water flooding is only one potential driver of well water contamination (i.e., shallow subsurface runoff pathways near flooding boundaries can also transport contaminants). In addition, there are challenges associated with flood mapping approaches for household- to neighborhood-scale applicability due to spatial resolution, cloud contamination, revisit date/time, data latency, and supplemental data processing time. To overcome these challenges and integrate a broader set of contamination processes and pathways, precipitation data products may have the potential to provide information needed to identify and characterize private wells susceptible to rainfall-induced contamination. Central to the applicability of using the precipitation data in this context is data availability, latency, and accuracy.
Ground-based precipitation gauges have widespread use and are generally accepted as accurate measurements of rainfall (Tian et al., 2021). In general, precipitation gauge data undergo automated quality assurance procedures, including standard homogeneity tests to flag potential errors in the gauge time series data (Alexandersson, 1986; You and Hubbard, 2006; Menne et al., 2012). While the exact number of precipitation gauges worldwide is unknown due to the fact that many are not available for public use, data latency and spatial coverage are generally challenges for near-real-time applications (Kidd et al., 2017). Gauge data provide point measurements and include uncertainty resulting from evaporation, splash, and wind effects (Li et al., 2020). Finally, the spatial–temporal variability of precipitation and limited number of available gauges can be a significant challenge in many applications. Only 1.6% of Earth’s surface land is within 10 km of a gauge; 5.9% is within 25 km (Kidd et al., 2017).
To overcome the spatial limitation of gauge observations, remote sensing can be used to provide near-real-time estimates of precipitation. In general, remote sensing approaches are based on visible, infrared, and microwave sensors (Kuligowski et al., 2016). The visible and infrared (VIS/IR) methods use cloud top temperature and an indirect relationship between cloud top temperature and the rate of precipitation (Kidd and Levizzani, 2019; Xu et al., 2022). Passive microwave (PMW) methods use microwave (MW) scattering, which has a direct relationship with accumulation of rain and ice particles and rate of precipitation, providing less uncertainty in estimations (Pradhan et al., 2022). However, estimates from these methods can have large uncertainties due to the indirect relationships for VIS/IR and sampling resolution of PMW satellites (Ning et al., 2016).
NASA’s Tropical Rainfall Measuring Mission (TRMM) began in 1997 with a core satellite containing both passive VIS/IR (five bands from 0.63 to 12 μm) and MW (five frequencies from 10.65 to 85.5 GHz) sensors and an active precipitation radar (Ku-band at 13.8 GHz). The TRMM Multi-satellite Precipitation Analysis (TMPA) product using averaged passive microwave precipitation observations and are then combined with IR precipitation rates to estimate near-global (±50° latitude) precipitation every 3 h in near-real time, which is available 9 h after the event (Huffman et al., 2007; Vergara et al., 2014). The TRMM satellite operated until 2014, when it was replaced by NASA’s Global Precipitation Measurement Mission’s core satellite (Prakash et al., 2015). GPM improved TRMM’s spatial and temporal resolution and included more specialized sensors: a Dual-Frequency Precipitation Radar (DPR) and Microwave Imager (GMI) (Draper et al., 2015b). The DPR utilizes a Ku-band at 13.6 GHz and a Ka-band at 35.5 GHz, and the GMI uses a frequency at 10.65 to 183.31 GHz (Draper et al., 2015a; Wentz and Draper, 2016; Liao and Meneghini, 2022). The spatial coverage ranges from 65°N and 65°S (Huffman et al., 2019; Wang K. et al., 2021). The GPM mission is comprised of one core satellite and 10 partner satellites (Shi et al., 2020) which are used in the Integrated Multi-satellitE Retrievals for GPM (IMERG) algorithm to produce data products having a spatial resolution of 0.1° by 0.1° and temporal resolution of 30 min (Chen et al., 2019; Huffman et al., 2019; Wang N. et al., 2021). The GPM core satellite serves as the reference satellite, with other satellites in the constellation provide additional microwave emission and scattering signatures to supplement the core satellite observations (Hou et al., 2014; Skofronick-Jackson et al., 2017).
The IMERG algorithm for estimating precipitation utilizes GPM and partner satellite data to produce three data products – the “Early” (IMERG-E) multi-satellite product, available in approximately 4 h following the time of observation; the “Late” (IMERG-L) multi-satellite product available in approximately 14 h; and the “Final” (IMERG-F) satellite-gauge product, available in approximately 3.5 months (Shi et al., 2020). The variance in latency for the early and late dataset is due to the forward time span for data collection after the time of observation, while the final product is calibrated with ground gauges to account for monthly bias (Huffman et al., 2019).
In terms of performance, (Li et al., 2020; Tian et al., 2021) IMERG generally overestimates precipitation when compared to gauges for low intensity precipitation (Tan et al., 2016; Omranian et al., 2018; Chen et al., 2019; Shi et al., 2020). In contrast, IMERG tends to underestimate high intensity precipitation (Milewski et al., 2015; Sun et al., 2018; Tian et al., 2021; Derin et al., 2022). Of the three data products, IMERG-F is accepted as having the least amount of error (Shi et al., 2020; Derin et al., 2021b). Sungmin et al. (2017) compared IMERG V03 to a gridded gauge-based rainfall data product in Austria and found all three IMERG products have the highest accuracy in estimating rain rates between 0.3 to 3.0 mm/30 min. The study also found that IMERG-E and IMERG-L have similar statistics compared to gauge products, with IMERG-F having a lower mean absolute error (MAE) and root mean square error (RMSE). In general, areas prone to high-intensity rainfall have less agreement between IMERG and gauge precipitations (Wang K. et al., 2021; Hartke et al., 2023). Additional factors impacting remotely sensed precipitation include large-scale (e.g., ENSO) to local-scale climate conditions (Savtchenko et al., 2015; Cui et al., 2020) and ground elevation (O and Kirstetter, 2018; Lober et al., 2023), which generally impact atmospheric moisture content as well as land surface, atmosphere, and cloud top temperatures.
While specific studies of GPM IMERG performance in North Carolina are limited, several studies, mostly focused on larger regions (e.g., CONUS), provide insights relevant to North Carolina. For example, Li et al. (2022) found a slight tendency to underestimate near the coastline for large precipitation events along the US. O and Kirstetter (2018) found that orographic precipitation in mountainous regions of the US contributes to a negative bias in IMERG precipitation products. This underestimation bias due to orographic lifting was also observed in North Carolina for IMERG estimates from Hurricane Florence in September 2018 (Petersen et al., 2020). However, Cui et al. (2020) found that, over CONUS, IMERG precipitation products tend to produce more false alarms (i.e., precipitation within pixels when no precipitation actually occurred) when observing mesoscale convective systems. In terms of precipitation sources within the IMERG product, Derin et al. (2021a) found the PMW-based precipitation estimates compared to ground-based radar estimates are biased high for smaller rainfall rates and biased low for higher rainfall rates. Thus, in North Carolina, the performance of IMERG products may be impacted in the coastal and mountainous regions as well as when estimating precipitation for mesoscale convective systems.
In this study, the IMERG data products are used to determine event rainfall characteristics throughout North Carolina (NC) for the period June 2000 to December 2021. Two precipitation quantities are used in this study: (i) local (i.e., area-averaged based on IMERG pixel values over a given catchment), and (ii) watershed (i.e., area-averaged of pixel values over the local catchment and all of its upstream catchments). The local-scale is used to compare IMERG to gauge measurements, and the watershed-scale is used to analyze local versus riverine based flooding potential. Events of varying durations (maximum of 3–5 days) are investigated. The event estimates from the IMERG products are compared to gauge measurements using data from 282 gauges. The intent of this study is to show that the low latency (early and late) IMERG data products can be used to accurately identify rainfall events leading to likely flooding and potential contamination of private wells; key water supply infrastructure throughout the U.S. and NC. Performance of the low latency data products are highlighted as they are needed for potential response focused applications following precipitation events that likely lead to flooding.
2 Methods
2.1 Study region
North Carolina, located along the eastern United States, has a diverse geographic landscape. The state is comprised of a coastal plain in the east, a mountainous region in the west, and the Piedmont plateau in between. A majority of watersheds in the state drain into the Atlantic Ocean, with a portion of the western side of the state draining to the Mississippi River Basin. This study region is comprised of 6,536 river reaches and associated catchments draining into and out of North Carolina (Figure 1). Here, the elevation derived global river network system MERIT Hydro is used (Lin et al., 2019; Yamazaki et al., 2019). To derive the catchments, a threshold area of 25 km2 was utilized (Lin et al., 2019). The median land area of the resulting catchments is 37 km2, which is smaller than the GPM IMERG data pixels (~100 km2). The river network is used to determine two precipitation quantities: (i) local (i.e., area-averaged based on IMERG pixel values over a given catchment), and (ii) watershed (i.e., area-averaged of pixel values over the local catchment and all of its upstream catchments). Given the resolution of catchments used here, most catchments are covered with only one IMERG pixel (i.e., limited impact of spatial scaling between catchments and data pixels).
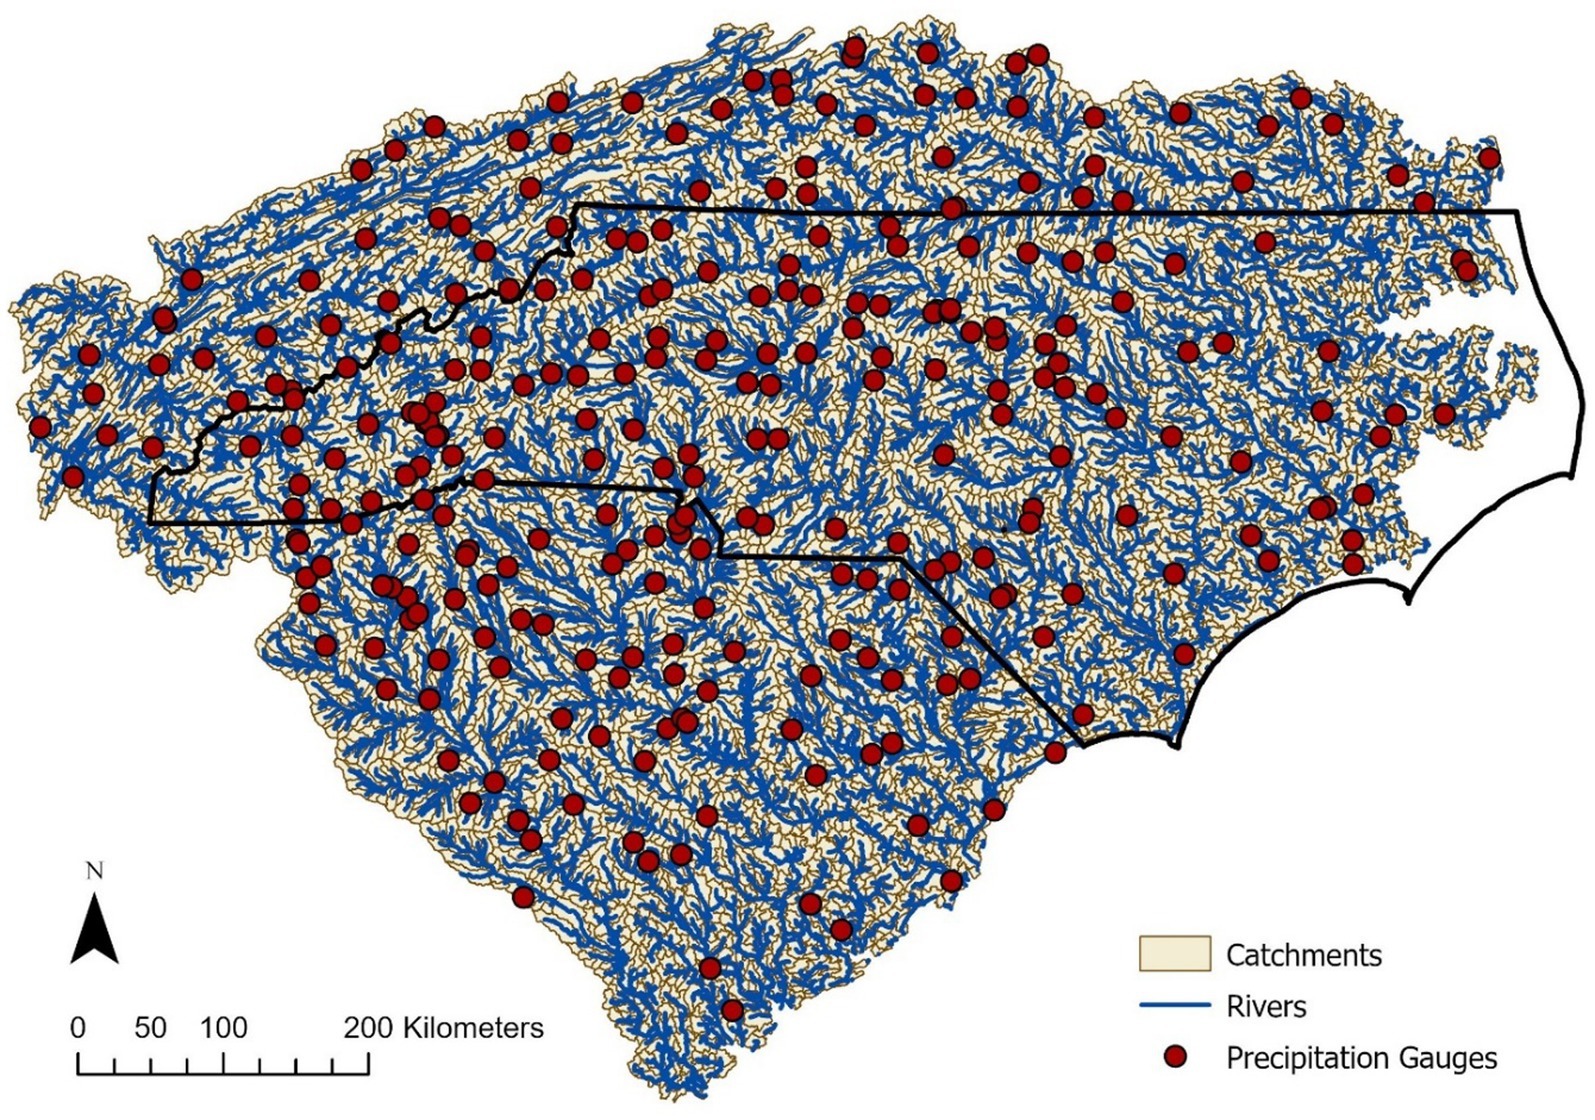
Figure 1. Study region encompassing North Carolina and associated drainage systems in neighboring states defined by MERIT Hydro rivers and catchments; 282 precipitation gauges used in this study shown in red.
2.2 Data sets
The GPM IMERG precipitation Level 3 data product (version 06) was obtained for the period June 2000 through December 2021. The data were spatially averaged over the MERIT Hydro catchment boundaries in the study region (Figure 1) to determine the local and watershed precipitation time series for each catchment. Gauge precipitation data were obtained from NOAA’s Global Historical Climate Network for the same time period. The IMERG precipitation values for catchments containing a gauge were compared to the corresponding gauge values. There are 272 catchments in the study region that contain at least one precipitation gauge, there are 6,264 catchments that do not contain a gauge. No additional spatial scaling was used to account for differences in point and gridded precipitation. Data for 282 ground precipitation gauges located in the study region having data for at least 75% of the study period were obtained (Figure 1). Note that, 139 of the gauges have a temporal coverage greater than 98% of the study period. In total, the gauges provided data for an average of 93% of the period of interest. The initial number of gauges obtained from NOAA’s Global Historical Climate Network for the study region was 328, which was reduced to 311 after removing duplicate locations. Note, the duplicate gauges, which had the same gauge ID, had slightly different periods of records. The duplicate gauge with the most data was retained. Next, the mean precipitation from each gauge was compared to its nearest gauge. There were 49 gauges with differences greater than ±25%; the range in differences was −58 to 56%. After considering the distance between gauges, difference in elevation, and precipitation from additional nearby gauges, 29 gauges were removed. In general, the removed gauges had significantly higher precipitation values that could not be explained based on differences in elevation. The final number of gauges used for the analysis is 282.
Additionally, watershed averaged precipitation values were determined for each catchment. The watershed averaged values are not compared to gauge values, but rather, used to compare local and watershed averaged values from GPM. The intent of this comparison is to identify locations at risk of potential flooding due to both local (i.e., catchment) or upstream (watershed averaged) precipitation events.
To assess potential impacts of ENSO conditions (Savtchenko et al., 2015) and site elevation (Lober et al., 2023) on GPM IMERG event precipitation estimates, two additional datasets were used: (i) bimonthly values of the multivariate ENSO Index Version 2 (Wolter and Timlin, 2011), and (ii) the MERIT Digital Elevation Model (DEM) with a spatial resolution of 3 arc seconds by 3 arc seconds (i.e., roughly 90 m by 90 m) (Yamazaki et al., 2017).
2.3 Event processing
Daily precipitation observations from both the local and watershed scale datasets were transformed into 3-day and 5-day precipitation accumulations, determined by summing the precipitation of a given day plus 2 or 4 days following the date of observation (e.g., 3-day accumulation is the sum of a given day, day +1, day +2 values). Using x-day accumulation time series, an event (date and magnitude) is identified based on three criteria: (i) the date of maximum precipitation within a time window of x-1 days before and after a given day, (ii) if two consecutive days have the same x-day accumulation value, the last day is considered the date of the event, and (iii) the event magnitude is greater than 10 mm. For example, for the 5-day precipitation events the centered time window examined observations 4 days before and 4 days after, along with the day of observation. For the 5-day precipitation events, 4 days before and after were compared to the magnitude occurring on a given day. Figure 2 shows examples of both 3- and 5- day precipitation accumulations for IMERG-F with the associated 3-day and 5-day event dates highlighted. Note, the 3-day and 5-day accumulations are used to account for larger, multi-day precipitation events likely to lead to flooding. If a large 1-day or 2-day event occurs, it will be represented in both the 3- and 5-day event series. However, if an x + 1 day event occurs, the above approach will not yield the total event magnitude. It is also possible that 5-day events include multiple 1- or 2-day events (Figure 2). While the logic used here is not exact, the approach is used on all datasets to provide consistent comparisons between IMERG and gauge event values.
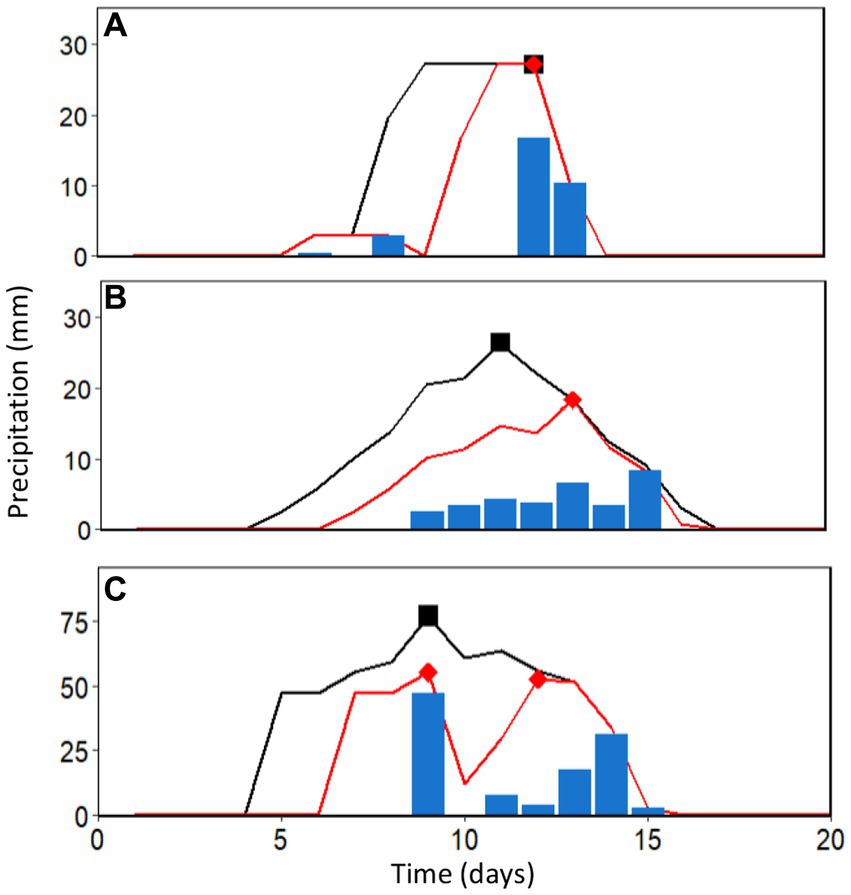
Figure 2. Time series demonstrating different scenarios for 3- and 5-day precipitation events. Daily precipitation is shown as blue bars; the black line shows the 5-day P accumulation time series, and the black square represents an identified 5-day event. The red line shows the 3-day P accumulation time series, and the red diamond represents an identified 3-day event: (A) 3- and 5- day event dates and magnitudes are equal, (B) multi-day precipitation series, with 5-day event larger than the 3-day event, and (C) 3-day P series results in two separate events, while the 5-day P identifies only a single event.
While the IMERG data products provide continuous time series data over the study period, ground gauges do not always have similar continuous data series. Thus, when creating the x-day accumulation series for the gauge data, the gauge must have x number of continuous days of observations following a given date to determine an accumulation for that date. To assess the IMERG events, each IMERG event was matched to a gauge event (i.e., gauge events were considered as the truth dataset). For each identified gauge event, the closest IMERG event to the gauge event within an x-day time window centered around the gauge event date was considered as being a matched event. A time window of x-1 was selected to minimize errors resulting from matching events between datasets. A larger time window would increase the likelihood of multiple satellite events matching a single gauge event, and a smaller time window could result in events not being matched due to small changes in the accumulation of precipitation causing the maximum accumulation date to move by +/− a few days. Mismatches of events are not likely to occur due to the fact that the x-1 day time window for matching events is the same window for defining the date of an event from the x-day precipitation accumulation series. However, an IMERG event may be matched to two events in the rare occurrence that there is an IMERG event that falls within the x-1 day time window of two gauge events, and there are no other events closer to the dates of the gauge events. The event magnitudes were then compared. Due to gauges having incomplete time periods of observation, only the dates in which the gauge had observations were used in the analysis.
The events for the precipitation gauges and the local IMERG precipitation events within a river catchment containing a gauge were then separated based upon their respective percentiles and gauge observation percentiles in each catchment. Each event was sorted into four groups: events less than the 25th percentile magnitude, events between the 25th and 50th percentiles, events between the 50th to the 75th percentile, and events greater than the 75th percentile magnitude.
2.4 Performance metrics
In this study, GPM precipitation values within the catchment containing the gauge location are compared to gauge values. No additional spatial scaling is used to account for differences in point and gridded precipitation. The metrics utilized for comparing GPM to gauge observations include mean error (ME), mean absolute error (MAE), relative mean error (RME), relative mean absolute error (RMAE), mean bias factor (MBF), relative bias (RBias), root mean square error (RMSE), probability of detection (POD), and false alarm ratio (FAR). The equations used to determine these metrics are shown in Table 1.
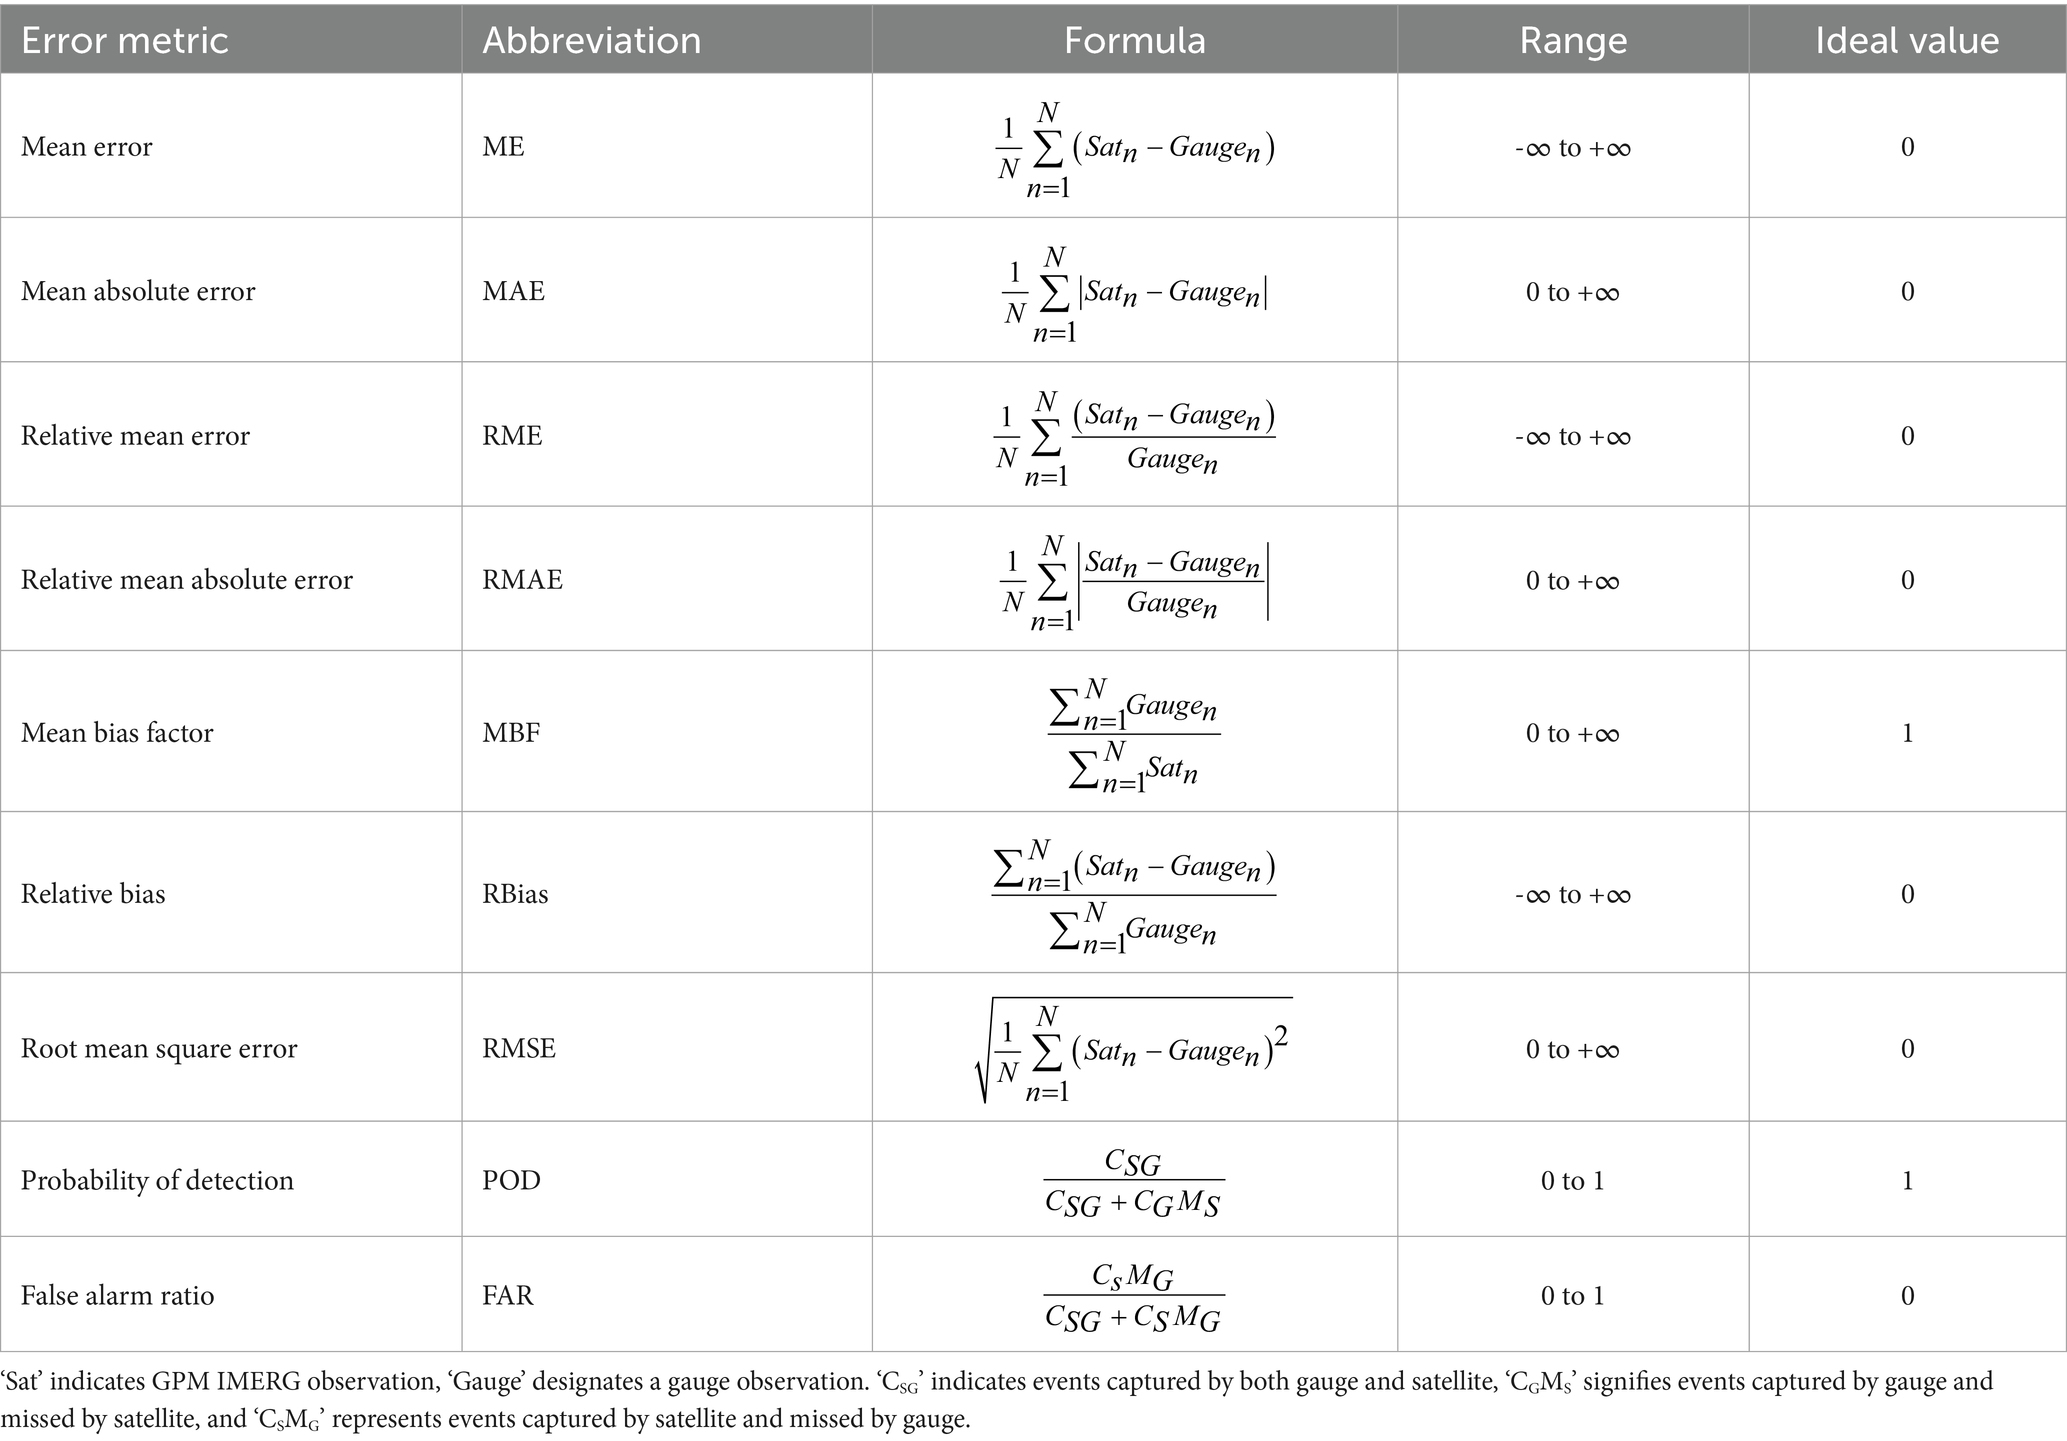
Table 1. Error statistics equations and abbreviations used in analysis.
3 Results and discussion
3.1 Precipitation summary
Summary statistics for the IMERG precipitation products (early, late, and final) were determined for the study period June 2000 to December 2021. Figure 3 shows the spatial distribution of mean daily precipitation for each product. The mean daily local precipitation over the study area during the study period was 3.68 mm/day for IMERG-F, 4.01 mm/day for IMERG-L, and 4.04 mm/day for IMERG-E. The early, late, and final precipitation data have similar trends across the study region, with large magnitudes along the eastern coast and the western mountains. The central Piedmont receives the least precipitation. Early and late have similar magnitudes of daily precipitation, while the final dataset slows less rainfall due to the bias correction process. This is most obvious in the western side of the study region. While the gauge data are not 100% complete as compared the IMERG, the mean daily precipitation for the gauges is 3.37 mm/day, similar to the IMERG data (Figure 3), but generally suggests IMERG over-estimates precipitation. This is consistent with Shi et al. (2020), performed in a similar latitude and maximum elevation, where early and late estimates are biased high with the final product adjusted lower to better match the gauge data.
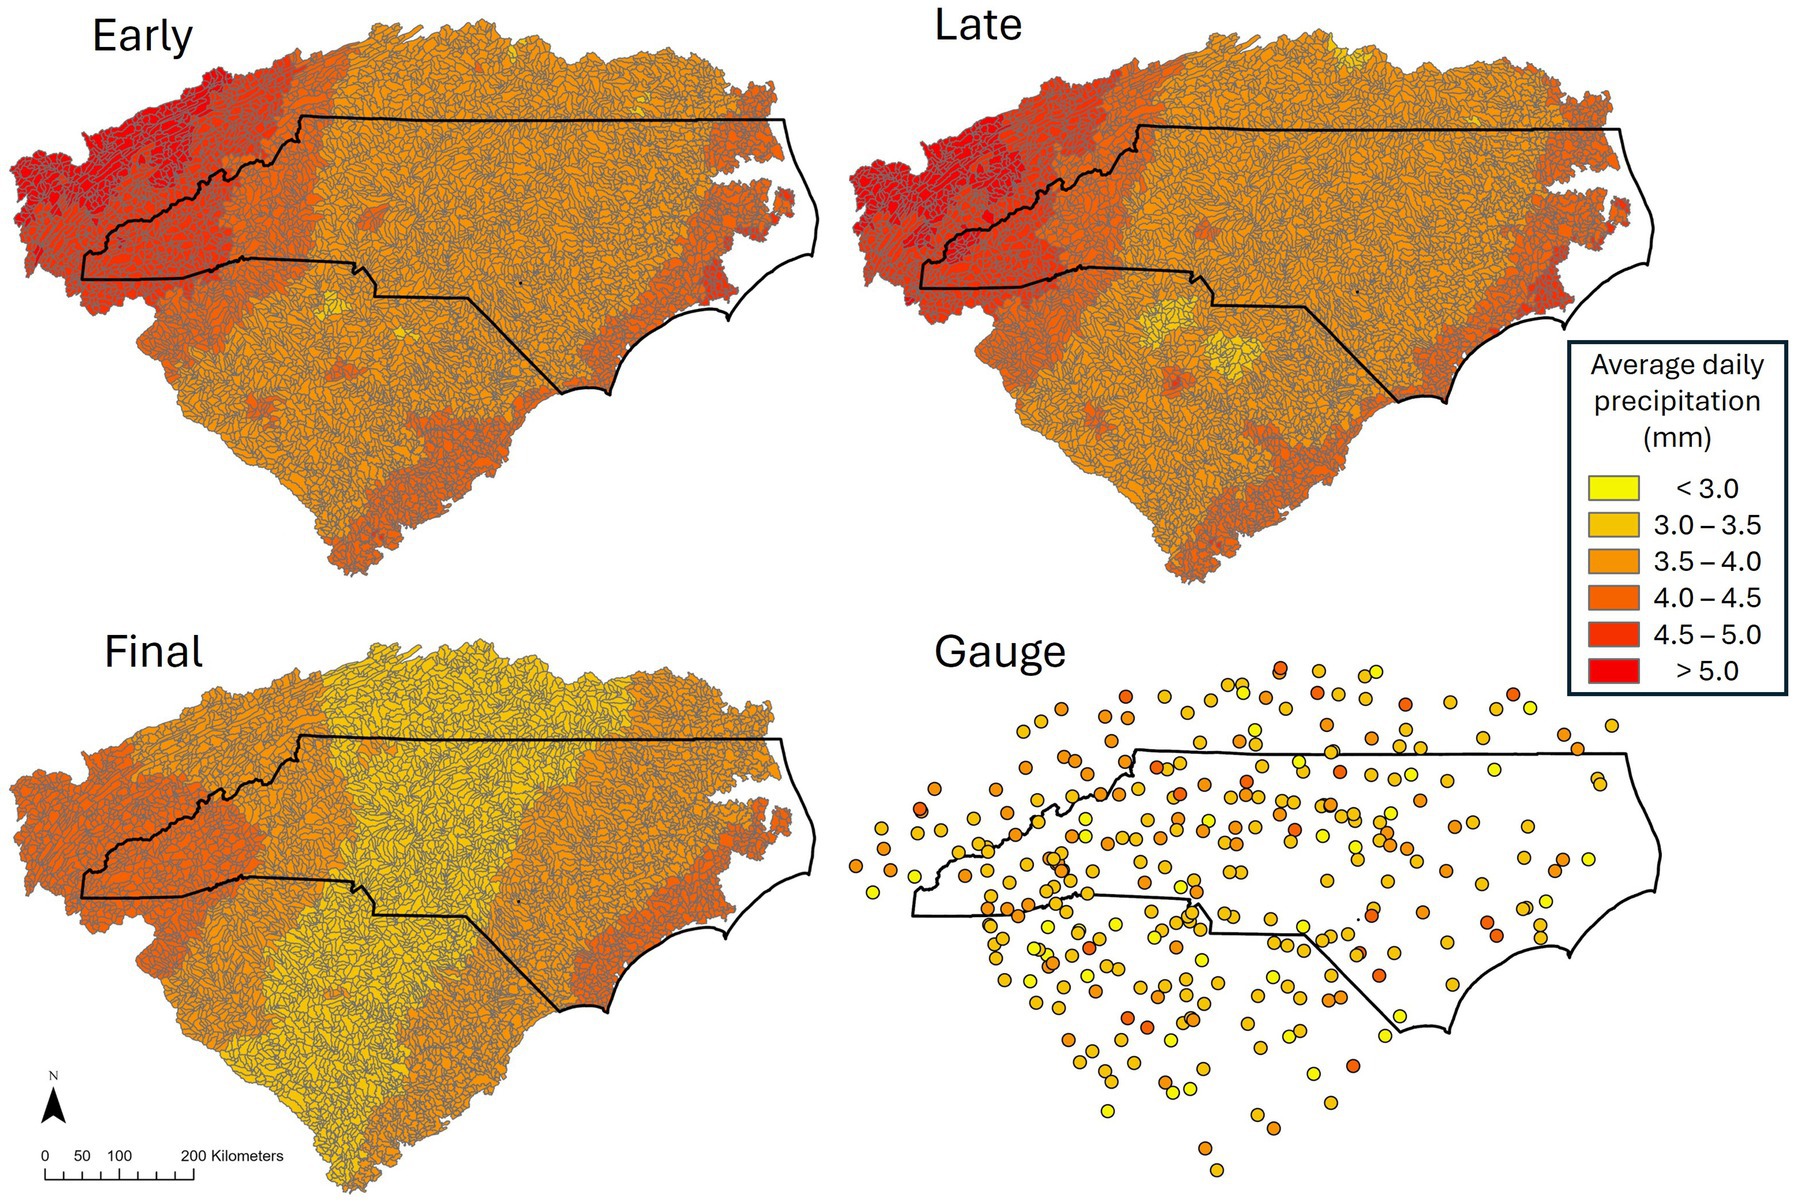
Figure 3. Mean daily precipitation (mm/day) for the GPM IMERG early, late, final, and ground gauge datasets for the period June 2000 to December 2021.
3.2 Precipitation events
The individual events obtained from each IMERG data product were matched to gauge events. For catchments with multiple gauges, the catchment values were compared to each gauge within the catchment. In total, events from 282 ground gauges were matched to the IMERG products. The mean number of events and event magnitudes for the gauge network was 606 and 34.2 mm for the 3-day event and 474 and 42.4 mm for the 5-day event series. However, it is important to note that gauge data record is only on average 93% complete, which has some impact on the above statistics.
In terms of temporal event characteristics, Figure 4 shows the distribution of event magnitudes for each month of the year. The month having the largest events for the gauges and IMERG-F is, on average, September. However, IMERG-E and -L show larger events occurring in winter months (December–March). This finding is consistent with Arshad et al., 2021, which was focused on Pakistan for the period 2004 to 2018 and found that IMERG-E and -L overestimated precipitation in the winter months when compared to ground gauges. Additional research is needed to identify conditions leading to these overestimates. For example, in this study, Jan results for -E/−L are more similar to the gauge values as compared to the other winter months (December, February, and March). There is an underestimation in the summer months (June, July, August, and September). Note that, the early and late datasets are rapidly released (4- to 14-h) making them ideal for identifying locations where precipitation induced flooding may impact well water quality. Thus, much of the results discussion is focused on these data products.
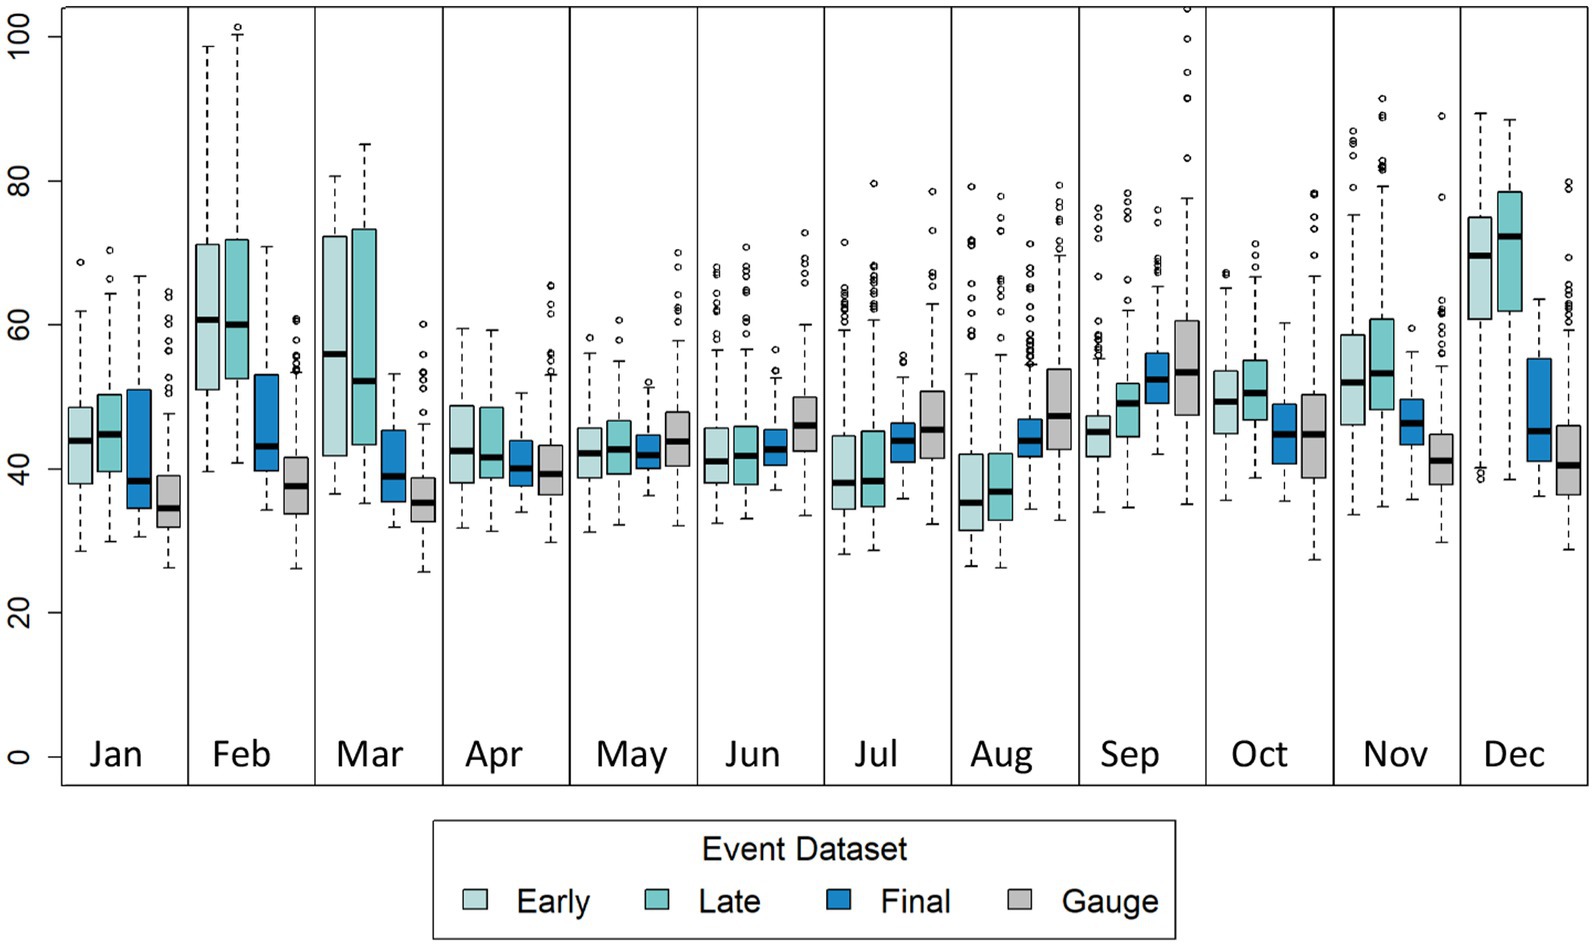
Figure 4. Mean monthly event magnitudes (mm) for GPM IMERG early, late, and final data products in catchments containing gauges that have at least 95% coverage over the study period (n = 219).
Prior to matching events, the 3-day events series had an average of 680 events with an average magnitude of 34.6 mm for IMERG-F, 673 events with an average magnitude of 38.4 mm for IMERG-L, and 690 events at 37.2 mm for IMERG-E. The 5-day events series had an average of 529 events with an average magnitude of 42.0 mm for IMERG-F, 521 events with an average magnitude of 46.8 mm for IMERG-L, and 530 events at 45.7 mm for IMERG-E. After matching events to the available gauge data, the 3-day events series had an average of 483 events with an average magnitude of 38.5 mm for IMERG-F, 474 events with an average magnitude of 43.2 mm for IMERG-L, and 418 events at 42.6 mm for IMERG-E. The matched 5-day events series had an average of 401 events with an average magnitude of 47.0 mm for IMERG-F, 395 events with an average magnitude of 52.2 mm for IMERG-L, and 394 events at 51.4 mm for IMERG-E.
For the 3-day events, the matching process eliminated roughly 200 IMERG events. For the 5-day events, the matching process eliminated fewer events; roughly 100 IMERG events. The dataset with the highest degree of matching for both the 3- and 5-day events is IMERG-F. The average magnitude of the events increases when the events are matched, indicating there is higher agreement between gauge and satellite during higher precipitation events. Table 2 shows a comparison of daily precipitation and 5-day event error metrics between the early, late, and final datasets and ground precipitation gauges.
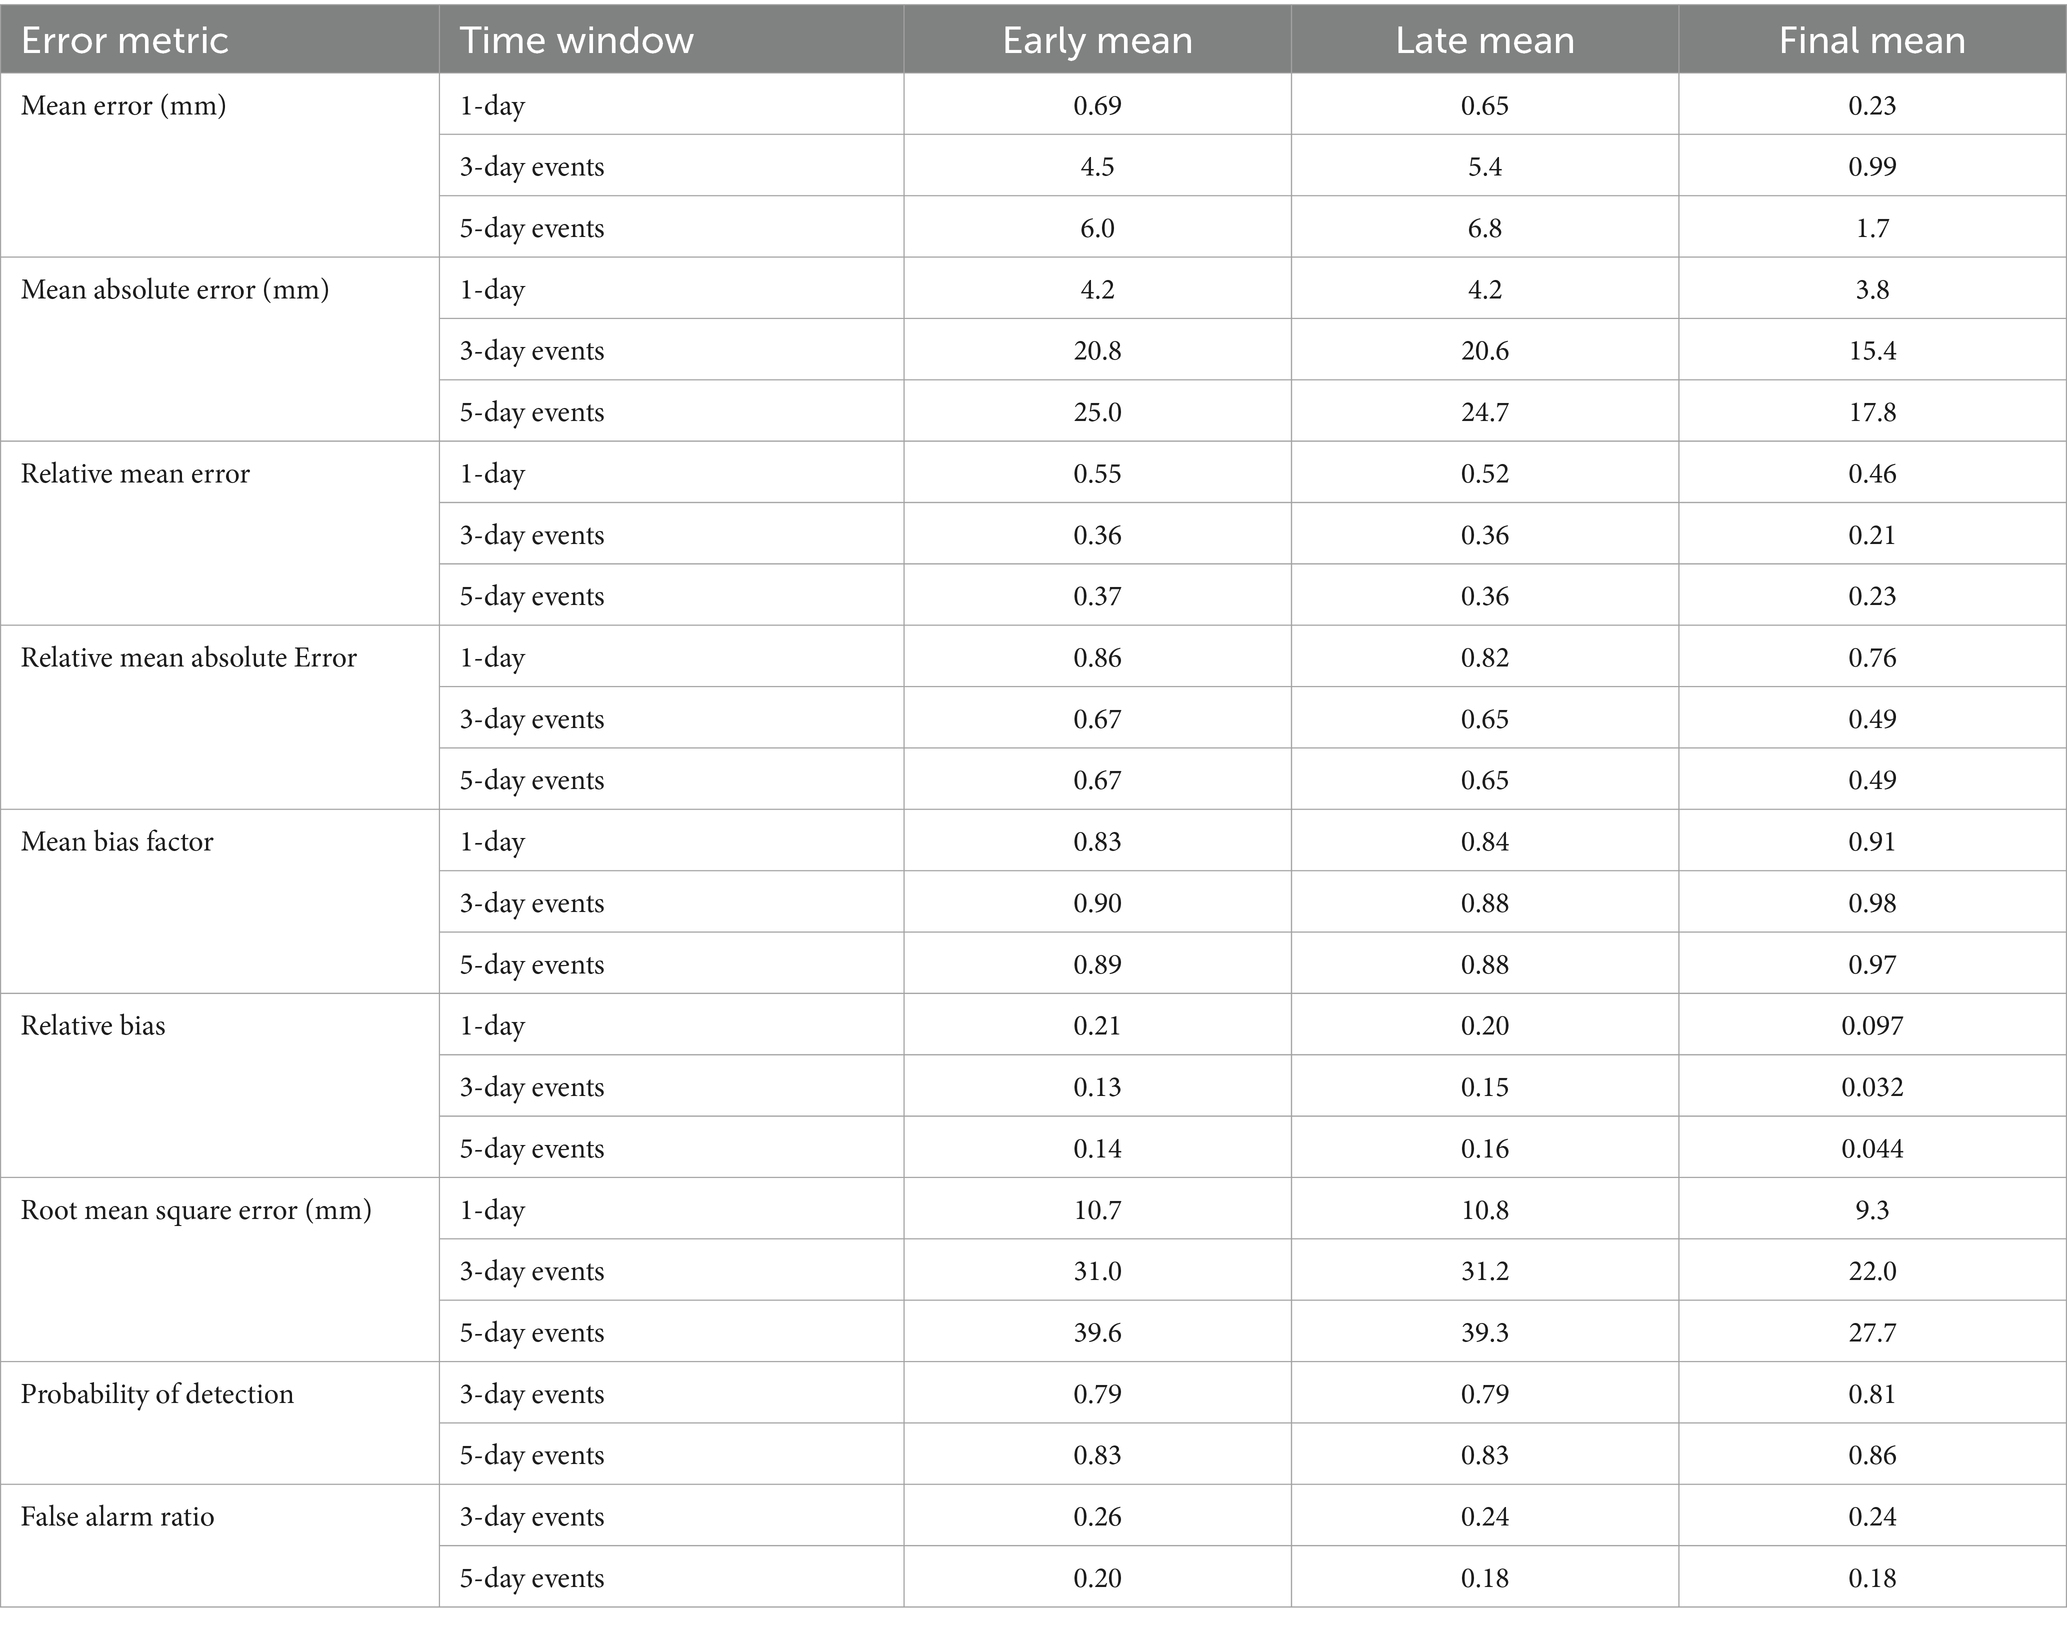
Table 2. Performance statistics for daily data observation, 3-day events, and 5-day events between IMERG-E, −L, and -F and gauge precipitation.
Both the daily and events have, on average, a positive ME, RME, and RBias, indicating that the IMERG values have larger magnitudes as compared to the gauges for both daily and event observations. While the metrics that are in units of mm cannot be compared to directly (i.e., daily vs. x-day events), the metrics that are normalized, such as RME, RMAE, and RBias, show that the events tend to have better agreement as compared to the daily observations. Building on findings in Curtis et al. (2007), Savtchenko et al. (2015), and Wang and Asefa (2017), relationships between ENSO conditions and event errors were investigated. Specifically, the event precipitation errors for the E, L, and F data products, at select gauge locations distributed throughout the region, were compared to the Multivariate El Niño Southern Oscillation Index Version 2. The results show that correlation values are generally in the range of −0.07 to 0.07. While ENSO conditions impact regional climate (e.g., temperatures, atmospheric moisture content, and precipitation patterns), we did not find an appreciable impact on GPM IMERG performance in this study. Additional research will further explore potential impacts of ENSO conditions focusing on event magnitudes and time of year.
The results from this study are similar to other studies. For example, Omranian and Sharif (2018) used 275 precipitation gauges and the 0.1° by 0.1° resolution IMERG-F data product to examine the month of May 2015 in Texas, which saw multiple extreme precipitation events within a short time period. For all of the precipitation events, the study found a daily average RMSE of 10.6 mm/day, and MBF of 1.07. Our study, when comparing 5-day events for gauges and IMERG-F found an RMSE of 27.7 mm per 5-day event, and an MBF of 0.97. The two studies show similar MBF values, while the difference in RMSE values are logical due to differences in precipitation magnitudes. The study by Omranian and Sharif (2018) found a POD of 0.85 and FAR of 0.16 for all precipitation events within the month, which overall agrees with our POD of 0.86 and FAR of 0.18.
Similarly, Shi et al. (2020) compared GPM IMERG and a global satellite mapping of precipitation (GSMaP) gauge-based precipitation product in the Yellow River region of China over the period January 2014 to December 2018. They found a daily POD of 0.77, 0.74, and 0.80 and a daily FAR of 0.25, 0.22, and 0.26 for early, late, and final, respectively. When compared to our results, it is evident that classifying precipitation by multiple-day accumulated events rather than daily observations yields a higher POD and a lower FAR.
Comparing both 3-day and 5-day events, Figure 5 shows that the 3-day events had smaller magnitudes for both the gauge and IMERG data but more events. The difference is likely due to (i) multiple events grouped into the 5-day event series, and (ii) several larger events not fully captured by the 3-day series (e.g., Hurricane Florence in September 2018). Figure 2 shows examples of both cases. The 5-day events, generally, have a higher ME, MAE, and RMSE, but have a similar RME, RMAE, and RBias. Examining the 5-day POD shows an average of 0.83, 0.83, and 0.86 for early, late and final, respectively, while the 3-day mean POD for early, late, and final is 0.79, 0.79, and 0.81. The FAR for the 5-day early, late, and final is 0.20, 0.18, and 0.18, while the 3-day FAR are 0.26, 0.24, and 0.24. In general, the high probability of detection indicates good agreement between gauge and IMERG observations. The general trends are also expected, with IMERG-F performing slightly better and IMERG-E and -L.
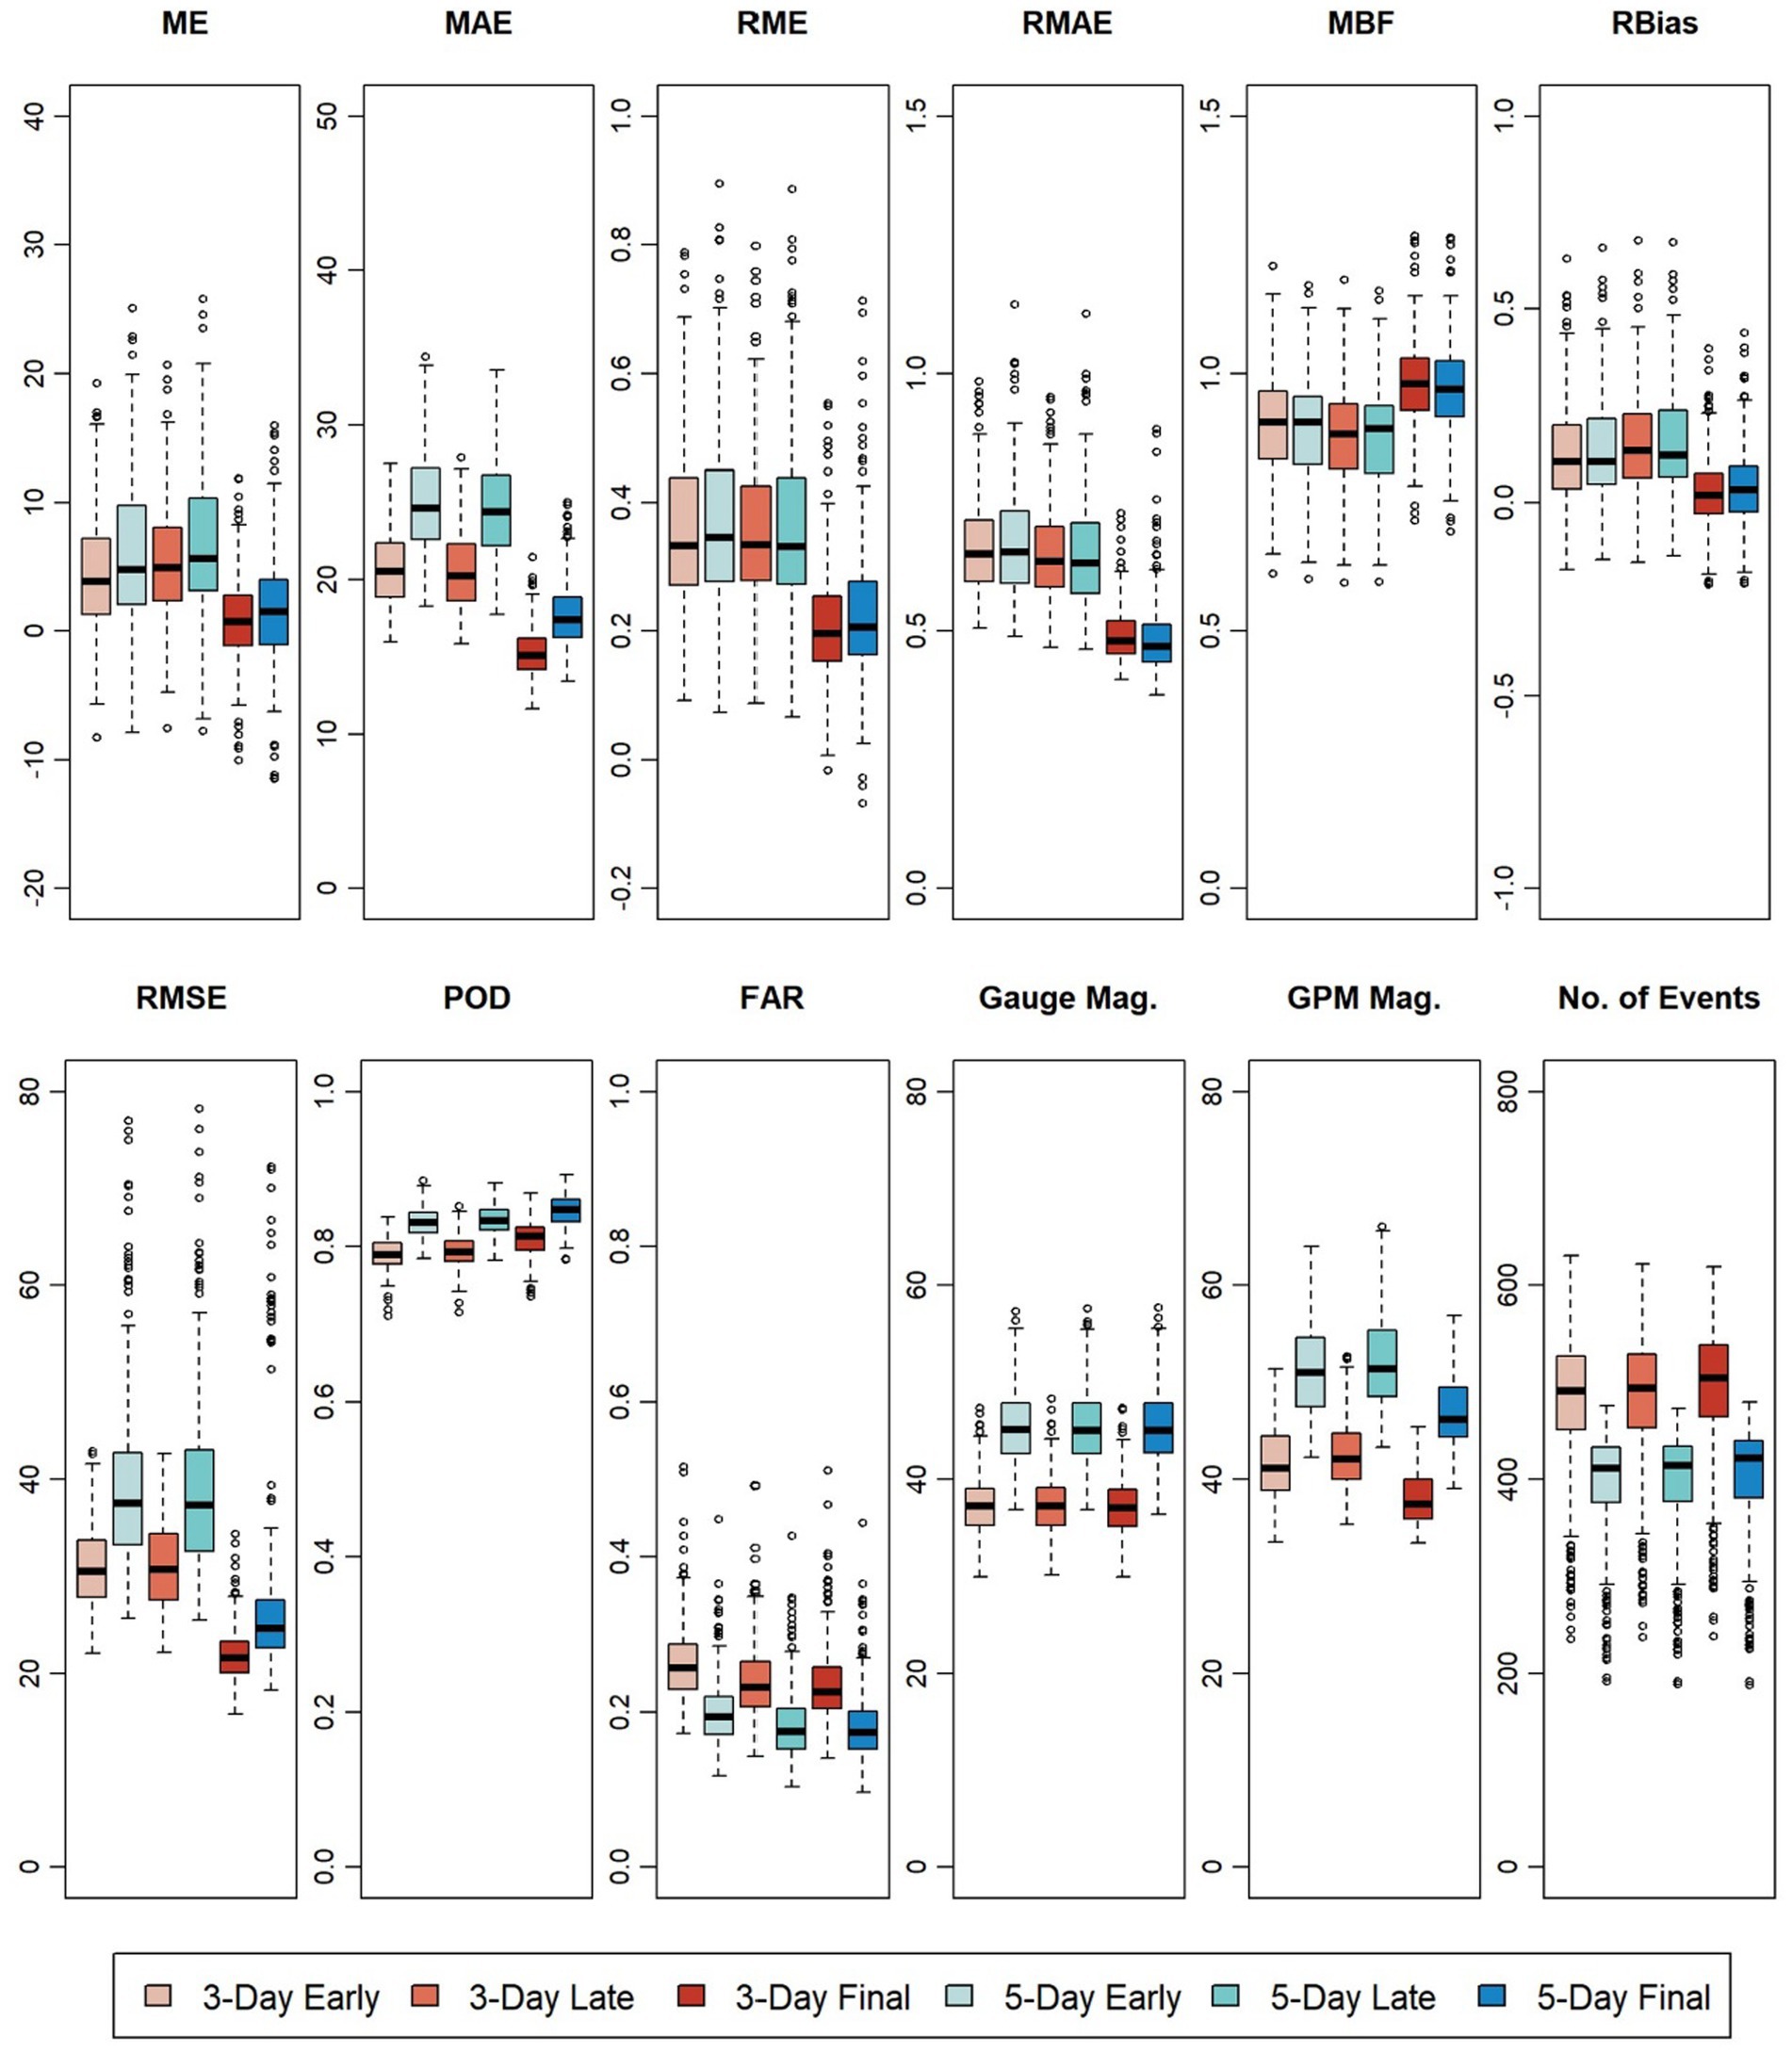
Figure 5. Comparison of 3-day events and 5-day events for early, late, and final GPM IMERG precipitation for mean error (mm), mean absolute error (mm), relative mean error, root mean square error (mm), relative bias, probability of detection, false alarm ratio, average gauge event magnitude, average satellite event magnitude, and number of events matched between gauge and satellite observations.
3.3 Separating events by percentiles
The GPM IMERG events (number and magnitudes) within selected percentile ranges for the 5-day events are shown in Figure 6. Note that, in this analysis, all events are included; not only matched events. Thus, the number of events for the IMERG products tends to be larger. In terms of number or size of events, there does not appear to be any trend related to percentile groups. Gauge observations had much more variability as compared to the IMERG estimates because IMERG averages out spatial variability within its 0.1° x 0.1° pixels as compared to point observations at gauge locations. In general, events higher than the 75th percentile were biased higher for the early and late datasets as compared to final.
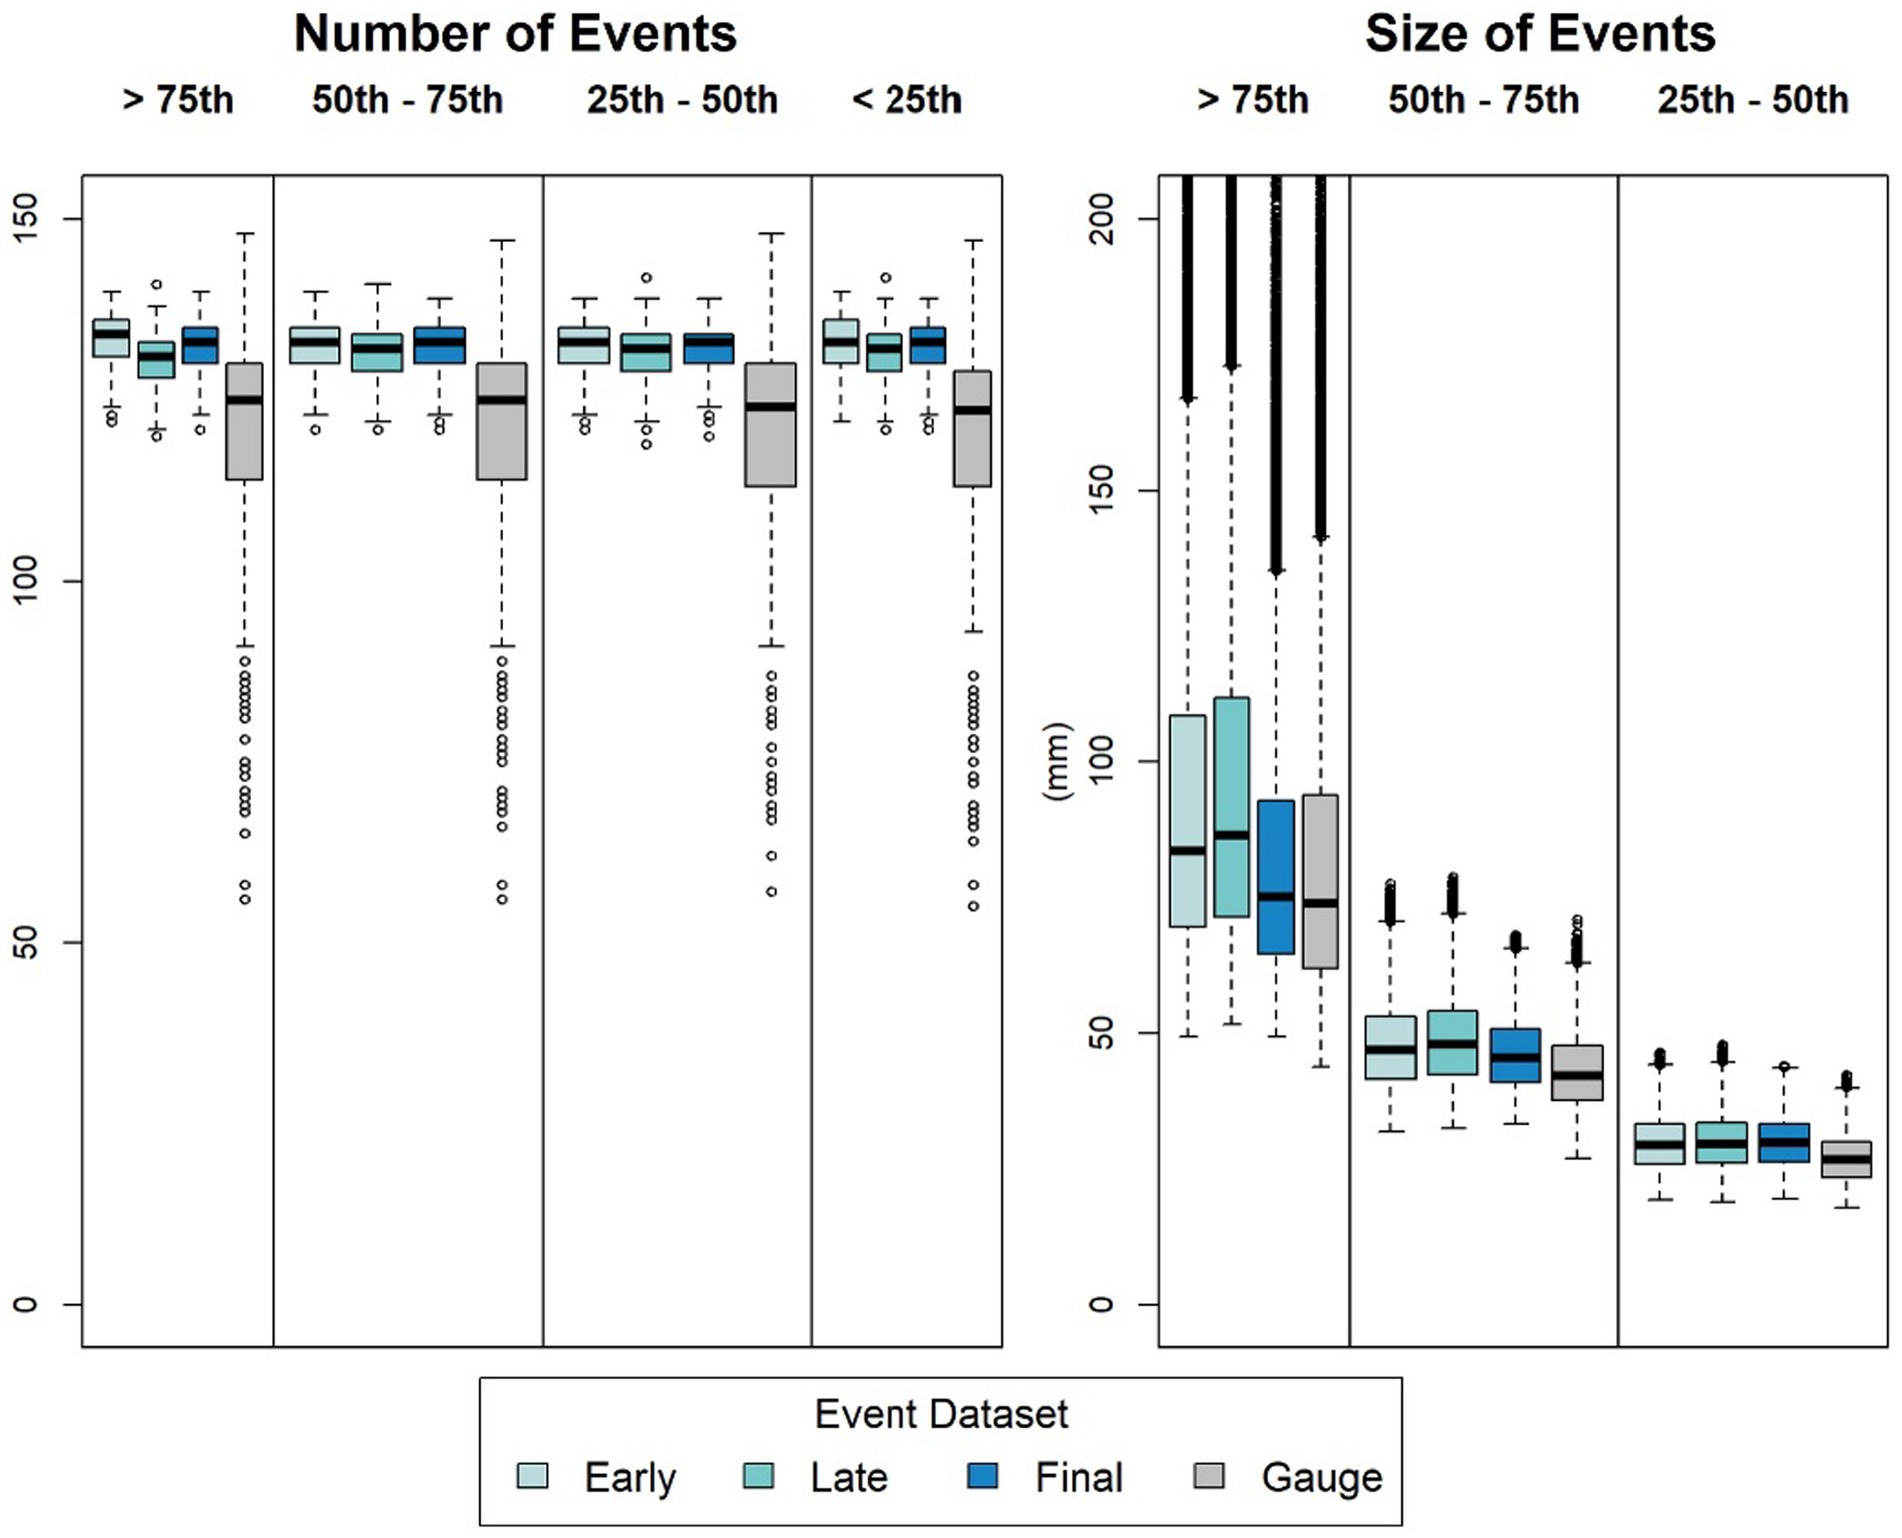
Figure 6. Number of 5-day events that fall within percentile groups based on the magnitudes of each dataset and the magnitudes (mm) of the events within the percentiles of each river catchment or gauge.
Events greater than the 75th percentile have the highest variance in terms of the size of events. The largest size of a 5-day event greater than the 75th percentile for IMERG-E was 694.7 mm, IMERG-L was 825.3 mm, IMERG-F was 486.5 mm, and gauge was 608.0 mm. IMERG-E and IMERG-L have the highest mean event magnitudes occurring to the western side of the mountains, while the largest gauge events tend to occur in the mountains. IMERG-F has smaller mean event magnitudes, and the largest of these events are located along the southern coastal portion of NC and southwest of the mountains (Figure 7). While not included in this analysis, future research will explore relationships between gauge elevation and event characteristics, which may help explain the results shown for the early and late products in the western portion of the study region.
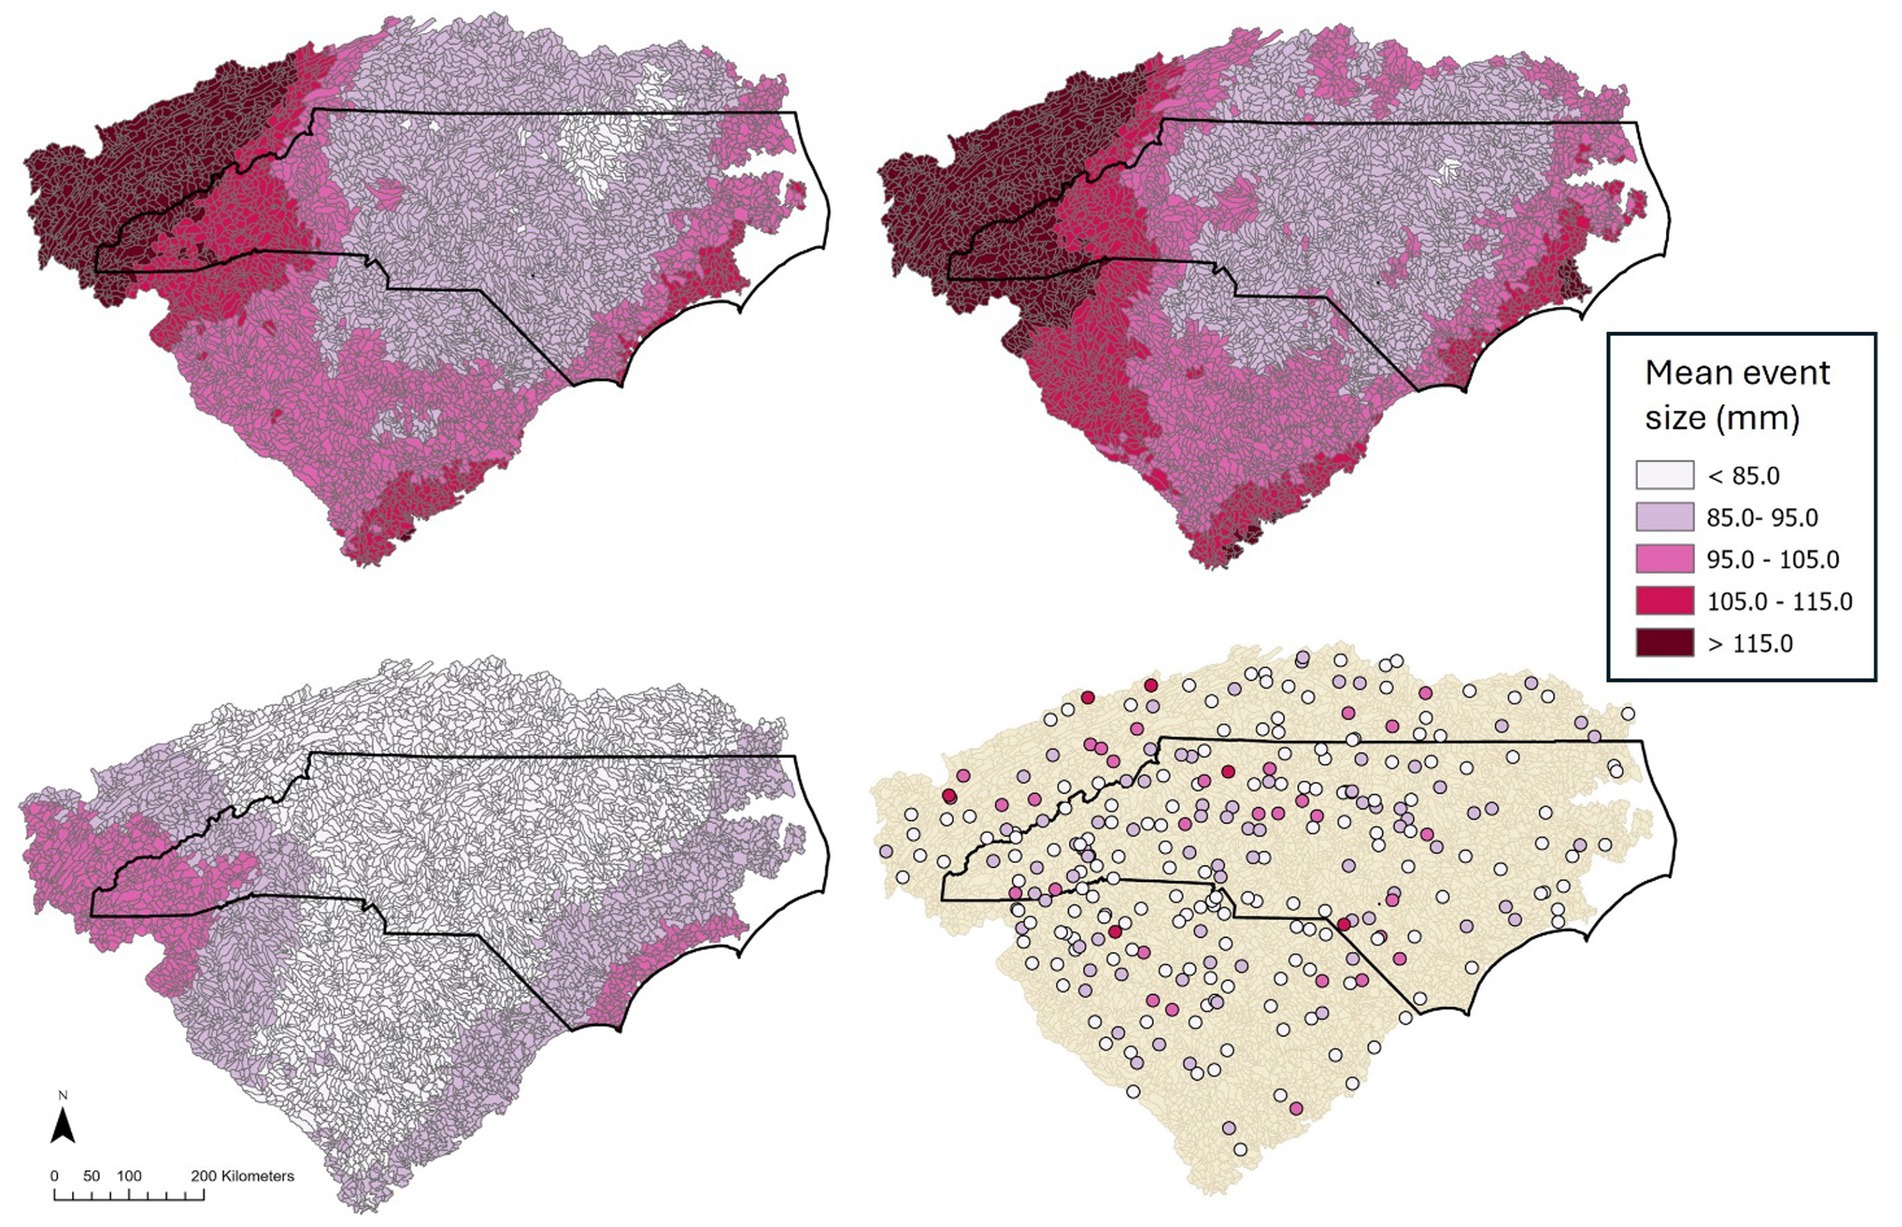
Figure 7. Mean event size (mm) for events greater than the 75th percentile of each respective catchment or gauge for (A) early, (B) late, (C) final, and (D) gauge events.
The error metrics for these four datasets binned within four percentile groups are shown in Figure 8. The events larger than the 75th percentile had the greatest variability in errors for ME, MAE, MBF, RBias, and RMSE. This implies that events with larger amounts of precipitation are more likely to have larger differences in ground gauge and satellite derived precipitations. For the RMAE, observations less than the 25th percentile had the largest variability in error, while events greater than the 75th percentile had the smallest variability in error. Events greater than the 75th percentile primarily possessed a relative bias less than 0, which indicates a bias toward the gauge. Events less than the 75th percentile has a positive bias, which means that the satellite events were observed to be greater than that of the gauge. Events in higher percentile groups had better POD and FAR. Thus, while events with larger precipitation totals tend to have larger errors, they are more likely to have agreement in terms of detecting actual events. These findings are consistent with previous studies that show larger errors for larger events. The results are also consistent with additional processing for the IMERG-F product to reduce bias. However, there does not appear to be much difference between early and late. In some cases, early is slightly better. While not performed in this study, future research will explore methods to combine values from the early and late products to investigate any potential benefits gained by considering both products.
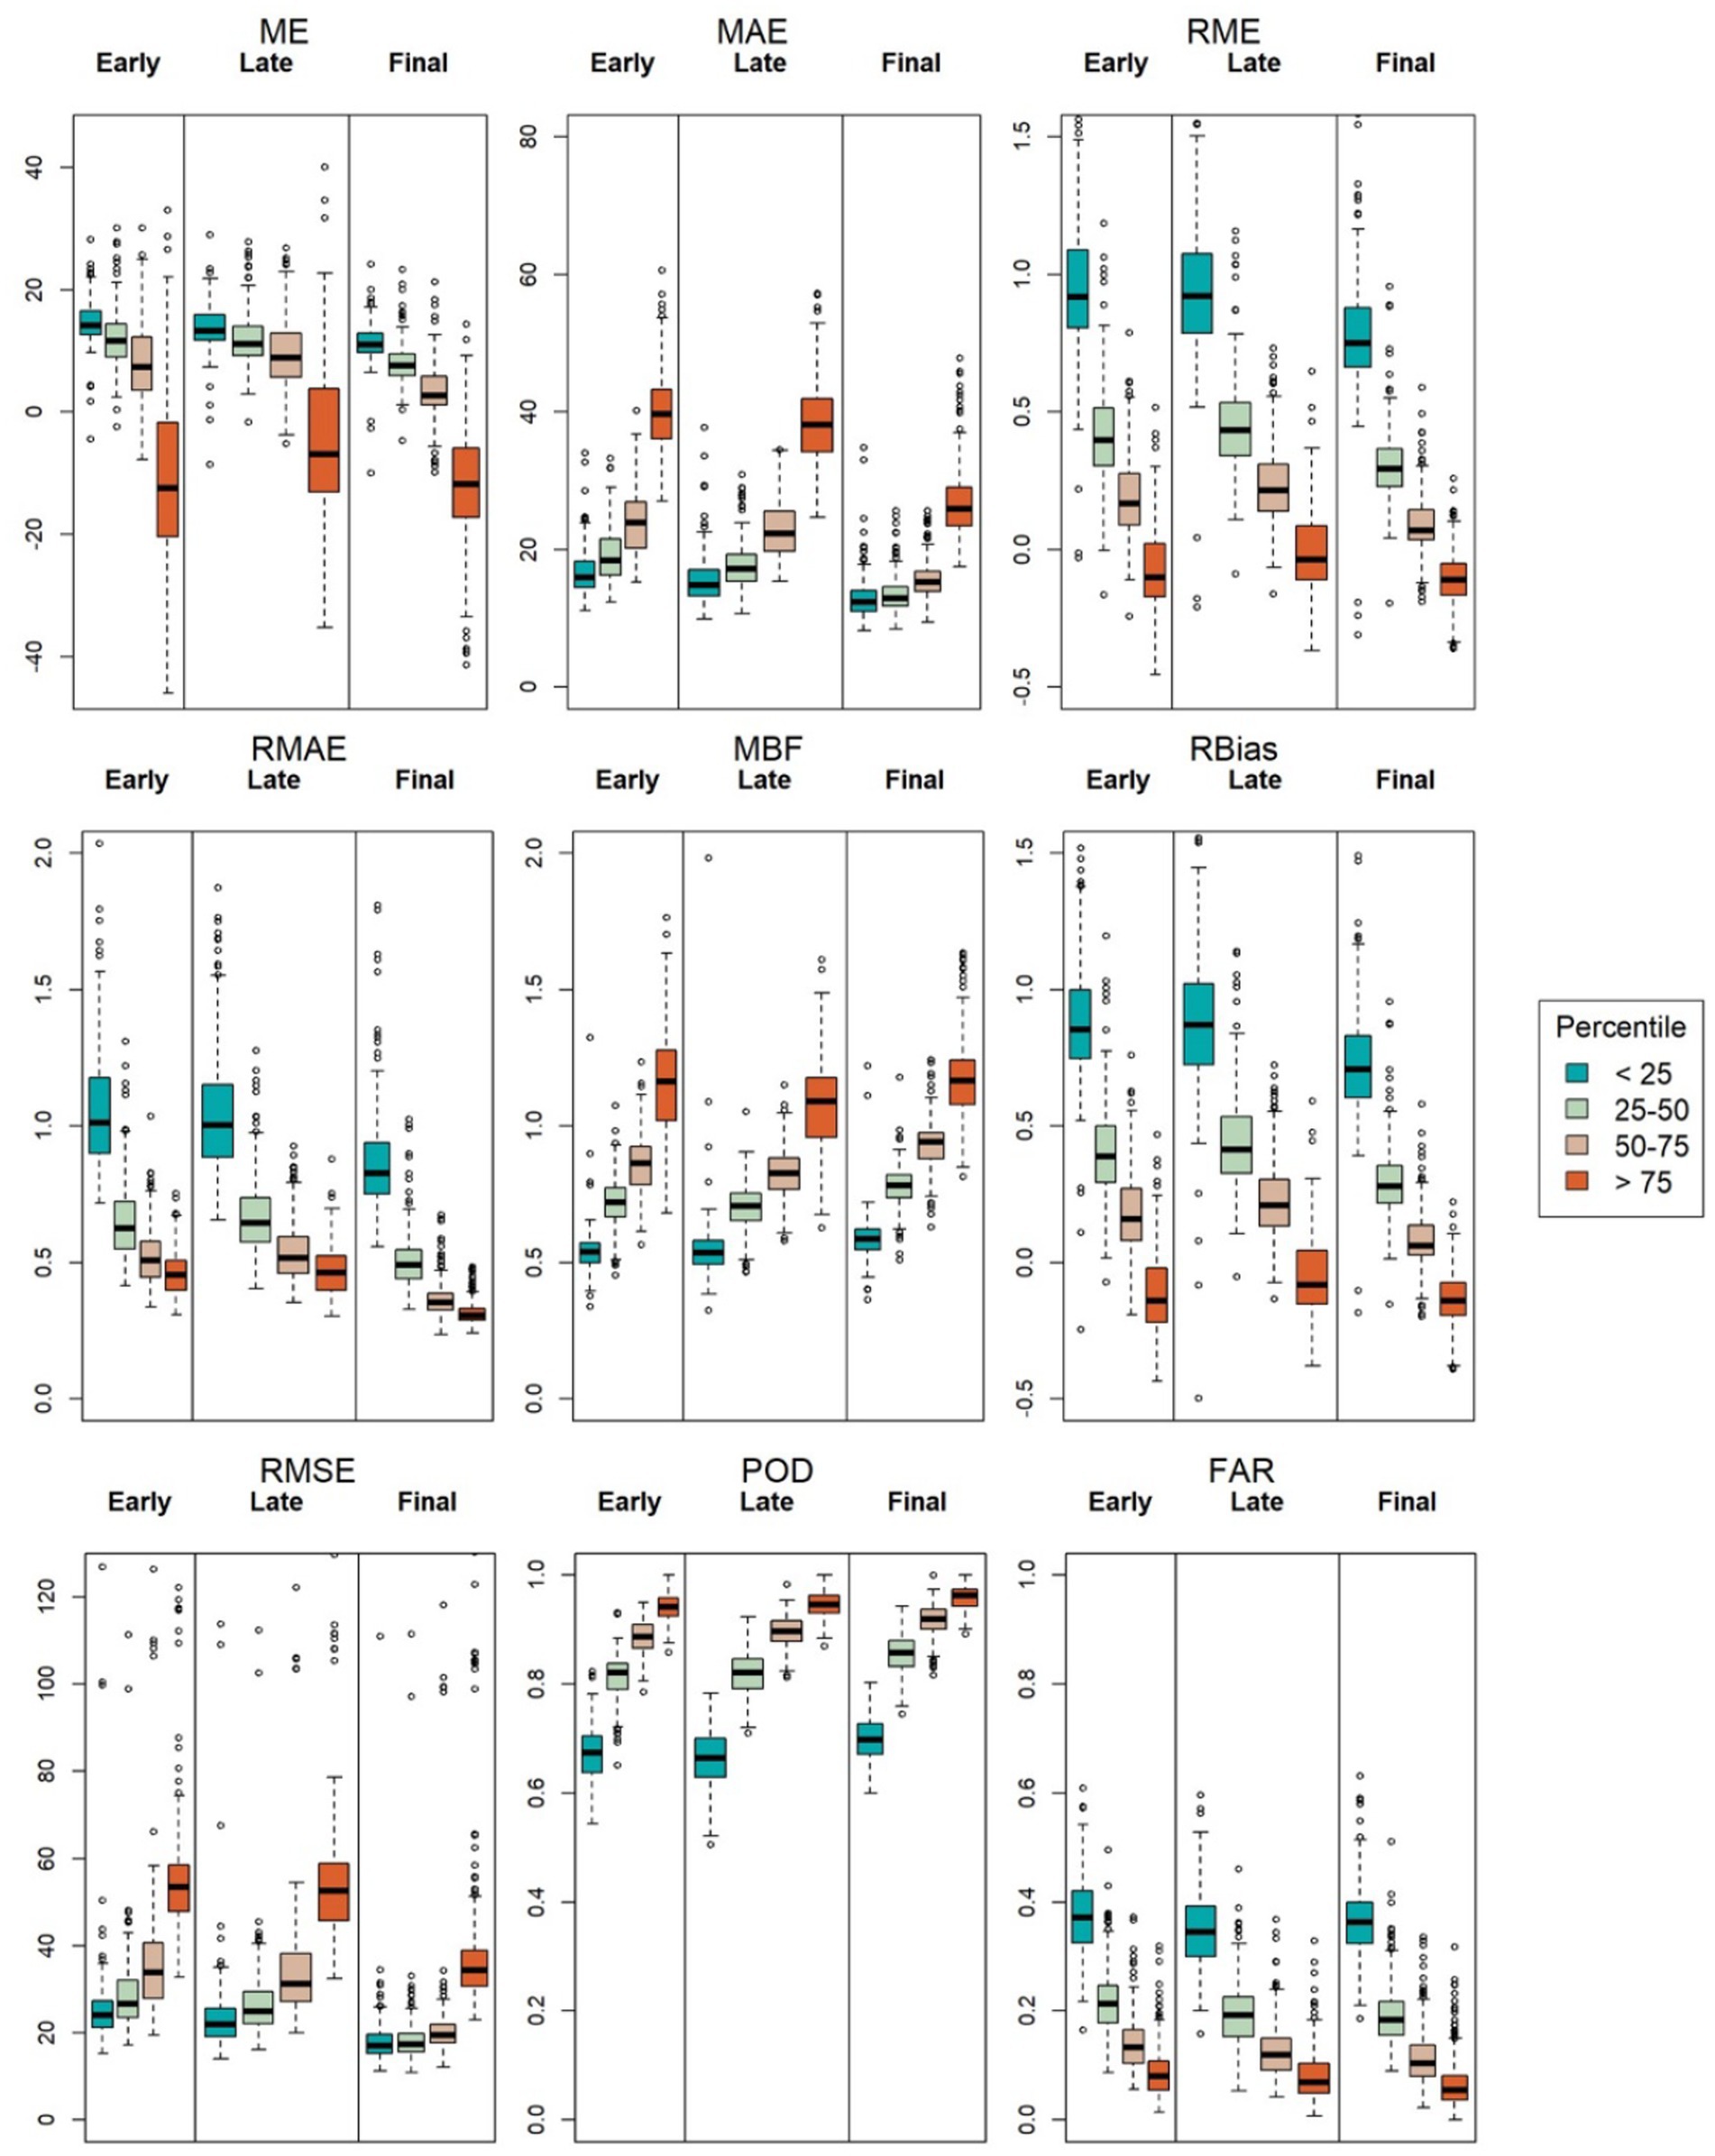
Figure 8. ME, MAE, RME, RMAE, RMSE, RBias, POD, FAR between gauges and IMERG 5-day events, separated by the 75th, 50th, and 25th precipitation gauge percentiles for each catchment.
3.4 Spatial distribution of gauge errors
North Carolina has various geographic attributes that can influence the bias of remote sensing precipitation measurements. The spatial distributions of the POD, FAR, ME, and RBias are shown in Figure 9. Most gauges in the study area have a POD between 0.80 and 0.85, a FAR between 0.15 and 0.20, a ME between −5.0 and 5.0 mm, and an RBias between −0.1 and 0.1; all of which are promising for potentially identify locations subjected to rainfall events. The mountainous regions in the western portion of NC tend to show the worst performance, which is consistent with previous studies (Sharifi et al., 2016). A correlation analysis between ground elevation at the gauge locations and mean error values was performed. Elevation was most correlated with FAR of the E, L, and F events (R values of −0.07, −0.10, and −0.08, respectively) and was least correlated with RBias (R values of 0.008, 0.012, and 0.002, respectively). For both FAR and POD, the correlation values are negative implying that as elevation increases POD and FAR decrease, suggesting that at higher elevations IMERG is less lightly to indicate a false event but more likely to miss an actual event. In other words, at higher elevations, IMERG detects fewer events in general (less false and less true events). Overall, the correlation values for the various error metrics were similar for the three IMERG products. With respect to gauge and satellite biases, GPM IMERG is found to be more variable in mountainous regions. This means that gauges within a relatively close distance may have one gauge with a positive bias and the other with a negative bias. For some gauges, underestimations come from PMW sensors missing orographic clouds without ice particles that produce rain, while an overestimation from PMW sensors is a result of cold and icy surfaces (i.e., the tops of mountains) being classified as rain clouds (Derin and Yilmaz, 2014; Lu et al., 2021). While no clear relationships between gauge elevations and event error metrics were found in this study, further analysis is needed to investigate potential relationships between gauge elevation, event error metrics, and precipitation sources used in the IMERG products (i.e., PMW vs. IR). As noted above, IMERG has a tendency toward not seeing events at higher elevations (negative correlation with POD and FAR and elevation), which could be a result of PMW errors due to clouds formed by orographic lifting, resulting in precipitation underestimation (Derin et al., 2021a). In general, RBias results suggest that satellite estimates tend to be similar (−0.1 to 0.1) or larger (>0.1) than gauge estimates. In the western edges of the mountainous region, RBias tends to be more consistently >0.1, which could be a result of rain shadow effects not captured by IMERG. However, gauge error metrics such as RBias can also be influenced by the incompleteness of gauge temporal coverage. While 75% completeness was used to subset gauges for event analysis, incomplete data records at the daily scale could mask sub-daily gaps in data, which could lead to underestimated daily totals. Additionally, missing days could impact event totals for multiday events or lead to missing events entirely. When comparing results between nearby gauges, these impacts could be exacerbated by the magnitudes of events missed by each gauge. For example, if one gauge misses a large event and another misses a small event, this will affect the overall average bias of the gauges differently.
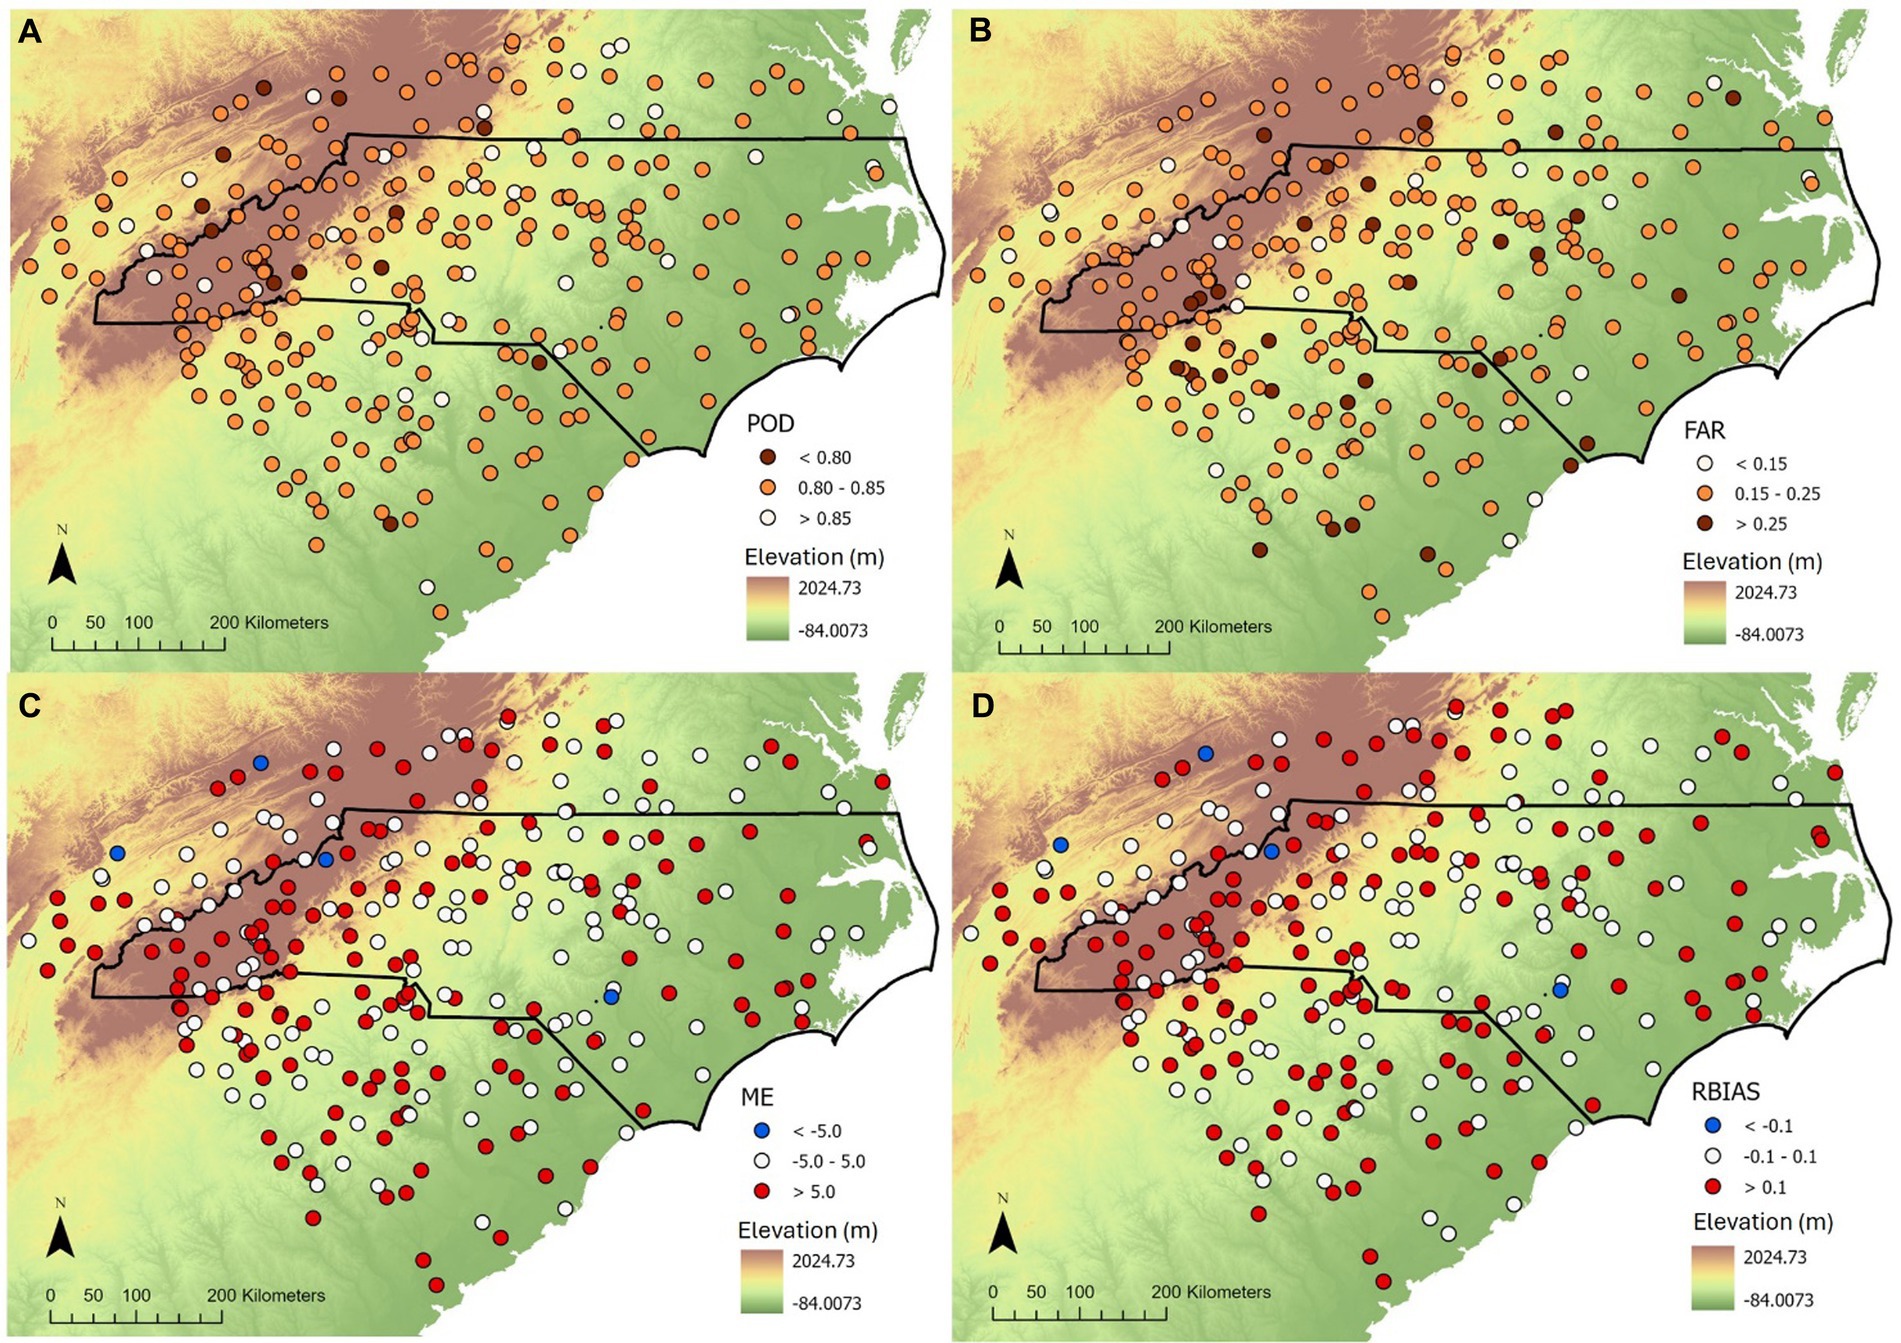
Figure 9. Mean POD (A), mean FAR (B), mean ME (mm) (C), and mean RBias (D) between 282 precipitation gauges and IMERG- E estimates for the 5-day events and elevation (meters).
3.5 Hurricane Florence
Hurricane Florence was one of the most significant precipitation events in North Carolina in recent years, making landfall in North Carolina on September 14, 2018, and continuing until September 17, 2018 (Kunkel and Champion, 2019). The hurricane’s high amount of precipitation resulted in widespread flooding, well inundation, and contamination problems. Note that 108 gauges did not have continuous data or did not identify an event and therefore were not utilized in the examination of this event. For this event, shown in Figure 10, a larger number of gauge locations show lower or more negative ME and RBias as compared to results for the full study period shown in Figure 9. Additionally, biases during this event were more extreme, and fewer gauges were in the moderate range of −5.0 to 5.0 (mm) for ME and −0.1 to 0.1 for RBias. In general, IMERG-E tends to underestimate the event magnitudes but the average ME and RBias of −59.4 and −0.30, respectively, are reasonable given the magnitude of the event.
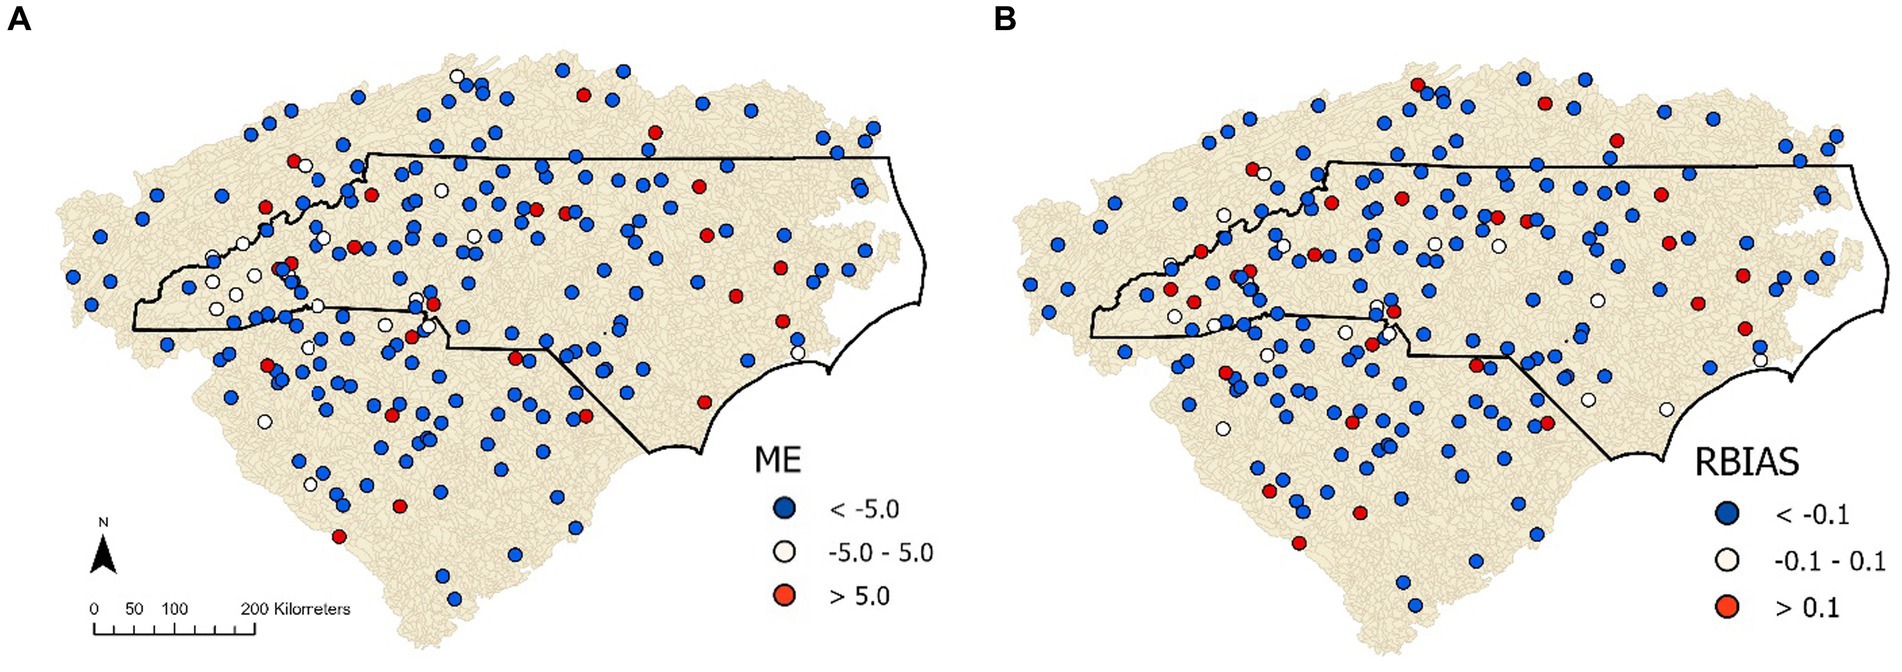
Figure 10. Event error metrics of (A) ME and (B) RBias for identified events between Sept. 14-17th, 2018 from IMERG-E and gauge data (n = 220) during Hurricane Florence.
3.6 Localized and watershed-scale precipitation
Prior analysis in this study was performed utilizing local catchment precipitation and comparing those values to the ground precipitation gauges. Here, we compare local precipitation to watershed-averaged precipitation to determine how often watershed-averaged precipitation exceeds the local precipitation (Figure 11). In the context of developing a precipitation-based index to identify well locations at risk of surface flooding induced contamination, both local and upstream precipitation may be important (i.e., riverine flooding due to precipitation occurring in upstream catchments). For the 5-day event series developed here, 3,391 catchments were headwater regions (i.e., local and watershed-averaged values are identical). For the remaining 3,145 catchments, the event data shows that watershed-average precipitation was larger than the local precipitation in roughly 40% of the events. As shown in Figure 11, the catchments where watershed values are larger than local values are along the larger rivers, which is likely a result of mountainous elevations receiving higher precipitation, which flows into river basins located in the Piedmont plateau. In future research, both local and watershed averaged precipitation will be compared to river stage and discharge data and well water sample data (i.e., presence/absence of known contaminants) to develop an index value for the likelihood of flooding and well water contamination.
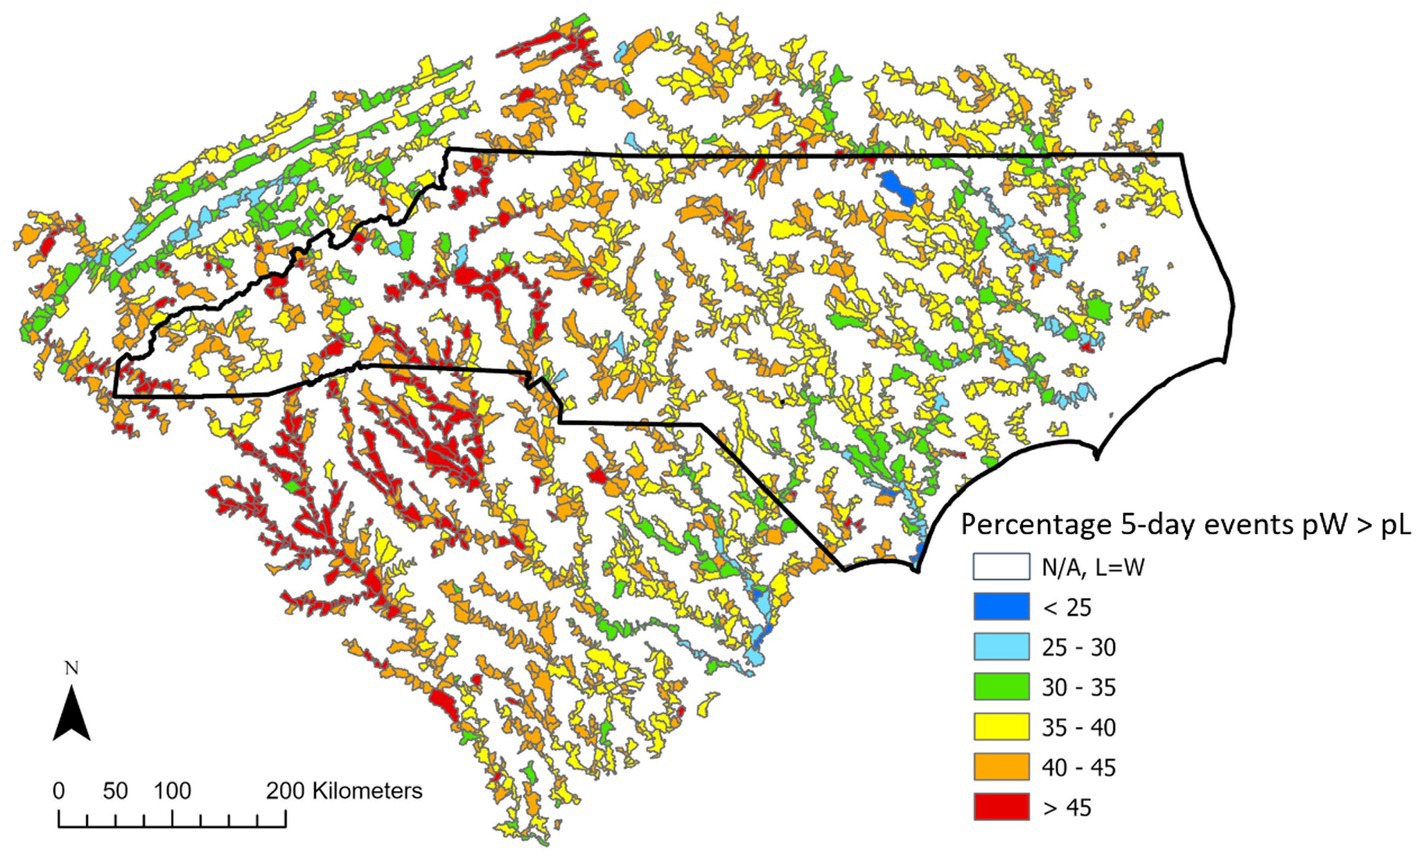
Figure 11. Percentage of 5-day events for the IMERG-F data product where watershed averaged precipitation is larger than local catchment precipitation.
4 Conclusion
This study compares GPM IMERG early, late, and final precipitation products to ground gauges (N = 282) for the period 2000–2021 throughout North Carolina. The study is primarily focused on IMERG performance for individual events with the potential to result in flooding and contaminant transport to drinking water wells. Given the latency of the IMERG products, performance for the early (4 h) and late (14 h) datasets are highlighted, as these products are available shortly after an event occurs and can be used in applications intended to identify locations at risk of potential flooding and well water contamination.
In general, results from this study are consistent with other studies in that the early and late products tend to overpredict precipitation with the final product being less biased (i.e., mean event errors of 6.0, 6.8, and 1.7 mm for early, late and final products, respectively) and performance for larger precipitation events, such as those greater than the 75th percentile, tends to be worse than for smaller events. Despite bias in larger events, the IMERG products tend to have good probability of detection (0.83, 0.83, and 0.86 for early, late, and final products, respectively), indicating that while the larger events may be biased, they are detected. In the context of identifying potential well locations possibly impacted by flooding, bias for large events may not be as critical as detection. Additionally, IMERG-E and IMERG-F show large overestimates in event precipitation during the winter months of December, January, February, and March. While this is consistent with other studies, it appears the Jan results are less biased high as compared to the other 3 months. Additional research is needed to better understand the performance during the winter period. In terms of the spatial distribution of performance, IMERG-E and IMERG-F show noticeably more high bias in the mountainous regions in the western portion of the study area. Future research will investigate performance and gauge elevation to potentially identify reasons for this spatial pattern.
With respect to the inundation of private drinking wells, accurate information related to flooding potential is needed to determine the location of potentially impacted wells. Given the reasonable agreement between all three GPM IMERG datasets and the ground-based precipitation gauges throughout NC, this study supports the development of applications using the early and late IMERG data products to identify locations that received appreciable event rainfall in near real-time. Future research will explore relationships linking event characteristics to well water contamination likelihood to assist state and local health departments and well users to identify well locations potentially impacted from flooding events.
Data availability statement
The datasets presented in this study can be found in online repositories. The names of the repository/repositories and accession number(s) can be found below: Bartuska, E. (2023). Quantifying rainfall event characteristics throughout North Carolina, HydroShare, http://www.hydroshare.org/resource/c1294045dfc749a49de91ac276d12294.
Author contributions
EB: Conceptualization, Data curation, Formal analysis, Methodology, Writing – original draft. RB: Conceptualization, Funding acquisition, Methodology, Project administration, Writing – review & editing.
Funding
The author(s) declare financial support was received for the research, authorship, and/or publication of this article. This research was funded by a NASA Precipitation Measurement Mission Science Team Project (Grant No. 80NSSC22K0606).
Acknowledgments
The authors wish to thank Dr. Kelsey J. Pieper of Northeastern University and Dr. C. Nathan Jones of the University of Alabama for their guidance in conceptualizing, funding acquisition, and project administration related to this work.
Conflict of interest
The authors declare that the research was conducted in the absence of any commercial or financial relationships that could be construed as a potential conflict of interest.
Publisher’s note
All claims expressed in this article are solely those of the authors and do not necessarily represent those of their affiliated organizations, or those of the publisher, the editors and the reviewers. Any product that may be evaluated in this article, or claim that may be made by its manufacturer, is not guaranteed or endorsed by the publisher.
References
Alexandersson, H. (1986). A homogeneity test applied to precipitation data. J. Climatol. 6, 661–675. doi: 10.1002/joc.3370060607
Arshad, M., Ma, X., Yin, J., Ullah, W., Ali, G., Ullah, S., et al. (2021). Evaluation of GPM-IMERG and TRMM-3B42 precipitation products over Pakistan. Atmos. Res. 249:105341. doi: 10.1016/j.atmosres.2020.105341
Chen, M., Nabih, S., Brauer, N. S., Gao, S., Gourley, J. J., Hong, Z., et al. (2019). Can remote sensing technologies capture the extreme precipitation event and its cascading hydrological response? A case study of hurricane Harvey using EF5 modeling framework. Remote Sens. 12:445. doi: 10.3390/rs12030445
Cui, W., Dong, X., Xi, B., Feng, Z. H. E., and Fan, J. (2020). Can the GPM IMERG final product accurately represent MCSs’ precipitation characteristics over the central and eastern United States? J. Hydrometeorol. 21, 39–57. doi: 10.1175/JHM-D-19-0123.1
Curtis, S., Salahuddin, A., Adler, R. F., Huffman, G. J., Gu, G., and Hong, Y. (2007). Precipitation extremes estimated by GPCP and TRMM: ENSO relationships. J. Hydrometeorol. 8, 678–689. doi: 10.1175/JHM601.1
Dai, D., Rhoads, W. J., Katner, A., Strom, L., Edwards, M. A., Pruden, A., et al. (2019). Molecular survey of Legionella and Naegleria fowleri in private well water and premise plumbing following the 2016 Louisiana flood. Environ. Sci.: Water Res. Technol 5, 1464–1477. doi: 10.1039/c9ew00109c
Derin, Y., Bhuiyan, M. A. E., Anagnostou, E., Kalogiros, J., and Anagnostou, M. N. (2021a). Modeling level 2 passive microwave precipitation retrieval error over complex terrain using a non-parametric statistical technique. IEEE Trans. Geosci. Remote Sens. 59, 9021–9032. doi: 10.1109/TGRS.2020.3038343
Derin, Y., Kirstetter, P.-E., Brauer, N., Gourley, J. J., and Wang, J. (2022). Evaluation of IMERG satellite precipitation over the land–Coast–Ocean continuum. Part II: Quantification. J. Hydrometeorol. 23, 1297–1314. doi: 10.1175/JHM-D-21-0234.1
Derin, Y., Kirstetter, P.-E., and Gourley, J. J. (2021b). Evaluation of IMERG satellite precipitation over the land-coast-ocean continuum – part I: detection. J. Hydrometeorol. 22, 2843–2859. doi: 10.1175/JHM-D-21-0058.1
Derin, Y., and Yilmaz, K. K. (2014). Evaluation of multiple satellite-based precipitation products over complex topography. J. Hydrometeorol. 15, 1498–1516. doi: 10.1175/JHM-D-13-0191.1
DeVries, B., Huang, C., Armston, J., Huang, W., Jones, J. W., and Lang, M. W. (2020). Rapid and robust monitoring of flood events using Sentinel-1 and Landsat data on the Google Earth engine. Remote Sens. Environ. 240:111664. doi: 10.1016/j.rse.2020.111664
Dieter, C. A., Linsey, K. S., Caldwell, R. R., Harris, M. A., Ivahnenko, T. I., Lovelace, J. K., et al. (2018). Water Availability and Use Science Program Estimated Use of Water in the United States in 2015 (ver 2.0). U.S Geological Survey Data Release. doi: 10.5066/F7TB15V5
Draper, D. W., Newell, D. A., Mckague, D. S., and Piepmeier, J. R. (2015a). Assessing calibration stability using the global precipitation measurement (GPM) microwave imager (GMI) noise diodes. IEEE J. Sel. Top. Appl. Earth Obs. Remote Sens. 8, 4239–4247. doi: 10.1109/JSTARS.2015.2406661
Draper, D. W., Newell, D. A., Wentz, F. J., Krimchansky, S., and Skofronick-Jackson, G. M. (2015b). The global precipitation measurement (GPM) microwave imager (GMI): instrument overview and early on-orbit performance. IEEE J. Sel. Top. Appl. Earth Obs. Remote Sens. 8, 3452–3462. doi: 10.1109/JSTARS.2015.2403303
Fox, M. A., Nachman, K. E., Anderson, B., Lam, J., and Resnick, B. (2016). Meeting the public health challenge of protecting private wells: proceedings and recommendations from an expert panel workshop. Sci. Total Environ. 554-555, 113–118. doi: 10.1016/J.SCITOTENV.2016.02.128
Hartke, S. H., Wright, D. B., Quintero, F., and Falck, A. S. (2023). Incorporating IMERG satellite precipitation uncertainty into seasonal and peak streamflow predictions using the hillslope link hydrological model. J. Hydrol. X 18:100148. doi: 10.1016/j.hydroa.2023.100148
Hou, A. Y., Kakar, R. K., Neeck, S., Azarbarzin, A. A., Kummerow, C. D., Kojima, M., et al. (2014). The global precipitation measurement mission. Bull. Am. Meteorol. Soc. 95, 701–722. doi: 10.1175/BAMS-D-13-00164.1
Huffman, G. J., Adler, R. F., Bolvin, D. T., Gu, G., Nelkin, E. J., Bowman, K. P., et al. (2007). The TRMM multisatellite precipitation analysis (TMPA): quasi-global, multiyear, combined-sensor precipitation estimates at fine scales. J. Hydrometeorol. 8, 38–55. doi: 10.1175/JHM560.1
Huffman, G. J., Bolvin, D. T., Braithwaite, D., Hsu, K., Joyce, R., Kidd, C., et al. (2019). NASA global precipitation measurement (GPM) integrated multi-satellite retrievals for GPM (IMERG) prepared for: global precipitation measurement (GPM) National Aeronautics and Space Administration (NASA). Available at: https://pmm.nasa.gov/sites/default/files/imce/times_allsat.jpg
Kidd, C., Becker, A., Huffman, G. J., Muller, C. L., Joe, P., Skofronick-Jackson, G., et al. (2017). So, how much of the Earth’s surface is covered by rain gauges? Bull. Am. Meteorol. Soc. 98, 69–78. doi: 10.1175/BAMS-D-14-00283.1
Kidd, C., and Levizzani, V. (2019). Quantitative precipitation estimation from satellite observations. In Extreme Hydroclimatic Events and Multivariate Hazards in a Changing Environment: A Remote Sensing Approach. Elsevier. Elsevier. doi: 10.1016/B978-0-12-814899-0.00001-8
Kuligowski, R. J., Li, Y., Hao, Y., and Zhang, Y. (2016). Improvements to the GOES-R rainfall rate algorithm. J. Hydrometeorol. 17, 1693–1704. doi: 10.1175/JHM-D-15-0186.1
Kunkel, K. E., and Champion, S. M. (2019). An assessment of rainfall from hurricanes Harvey and Florence relative to other extremely wet storms in the United States. Geophys. Res. Lett. 46, 13500–13506. doi: 10.1029/2019GL085034
Li, Z., Chen, M., Gao, S., Hong, Z., Tang, G., Wen, Y., et al. (2020). Cross-examination of similarity, difference and deficiency of gauge, radar and satellite precipitation measuring uncertainties for extreme events using conventional metrics and multiplicative triple collocation. Remote Sens. 12:1258. doi: 10.3390/rs12081258
Li, Z., Tang, G., Kirstetter, P., Gao, S., Li, J.-L. F., Wen, Y., et al. (2022). Evaluation of GPM IMERG and its constellations in extreme events over the conterminous United States. J. Hydrol. 606:127357. doi: 10.1016/j.jhydrol.2021.127357
Liao, L., and Meneghini, R. (2022). GPM DPR retrievals: algorithm, evaluation, and validation. Remote Sens. 14:843. doi: 10.3390/RS14040843
Lin, P., Pan, M., Beck, H. E., Yang, Y., Yamazaki, D., Frasson, R., et al. (2019). Global reconstruction of Naturalized River flows at 2.94 million reaches. Water Resour. Res. 55, 6499–6516. doi: 10.1029/2019WR025287
Lober, C., Fayne, J., Hashemi, H., and Smith, L. C. (2023). Bias correction of 20 years of IMERG satellite precipitation data over Canada and Alaska. J. Hydrol. Reg. Stud. 47:101386. doi: 10.1016/j.ejrh.2023.101386
Lu, C., Ye, J., Fang, G., Huang, X., and Yan, M. (2021). Assessment of GPM IMERG satellite precipitation estimation under complex climatic and topographic conditions. Atmos. 12:780. doi: 10.3390/atmos12060780
Meehan, K., Jepson, W., Harris, L. M., Wutich, A., Beresford, M., Fencl, A., et al. (2020). Exposing the myths of household water insecurity in the global north: a critical review. Wiley Interdiscip. Rev. Water 7:e1486. doi: 10.1002/WAT2.1486
Menne, M. J., Durre, I., Vose, R. S., Gleason, B. E., and Houston, T. G. (2012). An overview of the global historical climatology network-daily database. J. Atmos. Ocean. Technol. 29, 897–910. doi: 10.1175/JTECH-D-11-00103.1
Milewski, A., Elkadiri, R., and Durham, M. (2015). Assessment and comparison of TMPA satellite precipitation products in varying climatic and topographic regimes in Morocco. Remote Sens. 7, 5697–5717. doi: 10.3390/RS70505697
Morris, R. D., and Levin, R. (1994). Assessing and managing health risks from drinking water contamination: approaches and applications. In Assessing and Managing Health Risks from Drinking Water Contamination: Approaches and Applications (Proceedings of the Rome Symposium, September 1994), 233, 75–88.
Ning, S., Wang, J., Jin, J., and Ishidaira, H. (2016). Assessment of the latest GPM-era high-resolution satellite precipitation products by comparison with observation gauge data over the Chinese mainland. Water 8:481. doi: 10.3390/w8110481
O, S., and Kirstetter, P.-E. (2018). Evaluation of diurnal variation of GPM IMERG-derived summer precipitation over the contiguous US using MRMS data. Q. J. R. Meteorol. Soc. 144, 270–281. doi: 10.1002/qj.3218
Omranian, E., and Sharif, H. O. (2018). Evaluation of the global precipitation measurement (GPM) satellite rainfall products over the lower Colorado River basin, Texas. JAWRA J. Amer. Water Res. Assoc. 54, 882–898. doi: 10.1111/1752-1688.12610
Omranian, E., Sharif, H. O., and Tavakoly, A. A. (2018). How well can global precipitation measurement (GPM) capture hurricanes? Case study: hurricane Harvey. Remote Sens. 10:1150. doi: 10.3390/rs10071150
Petersen, W. A., Kirstetter, P.-E., Wang, J., Wolff, D. B., and Tokay, A. (2020). The GPM Ground Validation Program. In Satellite Precipitation Measurement (Vol. 2, pp, Springer. 471–502. doi: 10.1007/978-3-030-35798-6_2
Pieper, K. J., Jones, C. N., Rhoads, W. J., Rome, M., Gholson, D. M., Katner, A., et al. (2021). Microbial contamination of drinking water supplied by Private Wells after hurricane Harvey. Environ. Sci. Technol. 55, 8382–8392. doi: 10.1021/acs.est.0c07869
Pradhan, R. K., Markonis, Y., Vargas Godoy, M. R., Villalba-Pradas, A., Andreadis, K. M., Nikolopoulos, E. I., et al. (2022). Review of GPM IMERG performance: a global perspective. Remote Sens. Environ. 268:112754. doi: 10.1016/J.RSE.2021.112754
Prakash, S., Mitra, A. K., Pai, D. S., and Aghakouchak, A. (2015). From TRMM to GPM: how well can heavy rainfall be detected from space? Adv. Water Resour. 88, 1–7. doi: 10.1016/j.advwatres.2015.11.008
Rose, J. B., Epstein, P. R., Lipp, E. K., Sherman, B. H., Bernard, S. M., and Patz, J. A. (2001). Climate variability and change in the United States: potential impacts on water- and foodborne diseases caused by microbiologic agents. Environ. Health Perspect. 109, 211–221. doi: 10.2307/3435011
Savtchenko, A. K., Huffman, G., and Vollmer, B. (2015). Assessment of precipitation anomalies in California using TRMM and MERRA data. J. Geophys. Res. Atmos. 120, 8206–8215. doi: 10.1002/2015JD023573
Sharifi, E., Steinacker, R., and Saghafian, B. (2016). Assessment of GPM-IMERG and other precipitation products against gauge data under different topographic and climatic conditions in Iran: preliminary results. Remote Sens. 8:135. doi: 10.3390/rs8020135
Shi, J., Yuan, F., Shi, C., Zhao, C., Zhang, L., Ren, L., et al. (2020). Statistical evaluation of the latest GPM-era IMERG and GSMaP satellite precipitation products in the Yellow River source region. Water 12:1006. doi: 10.3390/w12041006
Skofronick-Jackson, G., Petersen, W. A., Berg, W., Kidd, C., Stocker, E. F., Kakar, R., et al. (2017). The global precipitation measurement (GPM) Mission for science and society. Bull. Am. Meteorol. Soc. 98, 1679–1695. doi: 10.1175/BAMS-D-15-00306.1
Sun, W., Sun, Y., Li, X., Wang, T., Wang, Y., Qiu, Q., et al. (2018). Evaluation and correction of GPM IMERG precipitation products over the capital circle in northeast China at multiple spatiotemporal scales. Adv. Meteorol. 1, 1–14. doi: 10.1155/2018/4714173
Sungmin, O., Foelsche, U., Kirchengast, G., Fuchsberger, J., Tan, J., and Petersen, W. A. (2017). Evaluation of GPM IMERG early, late, and final rainfall estimates using WegenerNet gauge data in southeastern Austria. Hydrol. Earth Syst. Sci. 21, 6559–6572. doi: 10.5194/hess-21-6559-2017
Tan, J., Petersen, W. A., and Tokay, A. (2016). A novel approach to identify sources of errors in IMERG for GPM ground validation. J. Hydrometeorol. 17, 2477–2491. doi: 10.1175/JHM-D-16-0079.1
Tian, B., Chen, H., Wang, J., and Xu, C. Y. (2021). Accuracy assessment and error cause analysis of GPM (V06) in Xiangjiang river catchment. Hydrol. Res. 52, 1048–1065. doi: 10.2166/NH.2021.188
Vergara, H., Hong, Y., Gourley, J. J., Anagnostou, E. N., Maggioni, V., Stampoulis, D., et al. (2014). Effects of resolution of satellite-based rainfall estimates on hydrologic modeling skill at different scales. J. Hydrometeorol. 15, 593–613. doi: 10.1175/JHM-D-12-0113.1
Wang, H., and Asefa, T. (2017). Impact of different types of ENSO conditions on seasonal precipitation and streamflow in the southeastern United States. Int. J. Climatol. 38, 1438–1451. doi: 10.1002/joc.5257
Wang, K., Kong, L., Yang, Z., Singh, P., Guo, F., Xu, Y., et al. (2021). GPM annual and daily precipitation data for real-time short-term nowcasting: a pilot study for a way forward in data assimilation. Water 13:1422. doi: 10.3390/W13101422/S1
Wang, N., Lombardo, L., Gariano, S. L., Cheng, W., Liu, C., Xiong, J., et al. (2021). Using satellite rainfall products to assess the triggering conditions for hydro-morphological processes in different geomorphological settings in China. Int. J. Appl. Earth Obs. Geoinf. 102:102350. doi: 10.1016/J.JAG.2021.102350
Wentz, F. J., and Draper, D. (2016). On-orbit absolute calibration of the global precipitation measurement microwave imager. J. Atmos. Ocean. Technol. 33, 1393–1412. doi: 10.1175/JTECH-D-15-0212.1
Wolter, K., and Timlin, M. S. (2011). El Niño/southern oscillation behaviour since 1871 as diagnosed in an extended multivariate ENSO index (MEI.Ext). Int. J. Climatol. 31, 1074–1087. doi: 10.1002/joc.2336
Xu, Y., Arevalo, J., Ouyed, A., and Zeng, X. (2022). Precipitation over the U.S. coastal land/water using gauge-corrected multi-radar/multi-sensor system and three satellite products. Remote Sens. 14:4557. doi: 10.3390/rs14184557
Yamazaki, D., Ikeshima, D., Sosa, J., Bates, P. D., Allen, G. H., and Pavelsky, T. M. (2019). MERIT hydro: a high-resolution global hydrography map based on latest topography dataset. Water Resour. Res. 55, 5053–5073. doi: 10.1029/2019WR024873
Yamazaki, D., Ikeshima, D., Tawatari, R., Yamaguchi, T., O’Loughlin, F., Neal, J. C., et al. (2017). A high-accuracy map of global terrain elevations. Geophys. Res. Lett. 44, 5844–5853. doi: 10.1002/2017GL072874
Keywords: precipitation, global precipitation measurement (GPM), remote sensing, rain gauges, precipitation events
Citation: Bartuska E and Beighley RE (2024) Assessing precipitation event characteristics throughout North Carolina derived from GPM IMERG data products. Front. Water. 6:1296586. doi: 10.3389/frwa.2024.1296586
Edited by:
Nishant Yadav, Microsoft, United StatesReviewed by:
Elena Ridolfi, Sapienza University of Rome, ItalyJeffrey McCollum, FM Global Research, United States
Copyright © 2024 Bartuska and Beighley. This is an open-access article distributed under the terms of the Creative Commons Attribution License (CC BY). The use, distribution or reproduction in other forums is permitted, provided the original author(s) and the copyright owner(s) are credited and that the original publication in this journal is cited, in accordance with accepted academic practice. No use, distribution or reproduction is permitted which does not comply with these terms.
*Correspondence: Elizabeth Bartuska, Bartuska.e@northeastern.edu