 Heiko Apel
 Jakob Benisch2
 Björn Helm
 Bruno Merz
- 1GFZ German Research Centre for Geoscience, Section Hydrology, Potsdam, Germany
- 2Institute of Urban and Industrial Water Management, Chair of Urban Water Management, Technical University of Dresden, Dresden, Germany
- 3Institute for Environmental Sciences and Geography, University of Potsdam, Potsdam, Germany
Introduction: Urban pluvial flooding is a growing concern worldwide as consequence of rising urban population and climate change induced increases in heavy rainfall. Easy-to-implement and fast simulation tools are needed to cope with this challenge.
Methods: This study describes the development of the parsimonious, GPU-accelerated hydraulic model RIM2D for urban pluvial flood simulations. This is achieved by considering the built-up urban area as flow obstacles, and by introducing capacity-based approaches to consider urban drainage by infiltration on pervious surfaces and sewer drainage from roofs and sealed surfaces. The model performance was analyzed by simulating 8 heavy rainfall events in a test area in the city of Dresden, Germany. For these events detailed discharge measurements of sewer discharge are available, providing a unique dataset for evaluating the sewer drainage simulation, which is of high importance for realistic pluvial inundation simulations in urban areas.
Results and discussion: We show that the model simulates the temporal dynamics of the sewer discharge and the sewer volume within acceptable ranges. Moreover, the erratic variation of the simulated to measured sewer discharge suggests that the deviations from the measurements are caused by the precipitation input rather than the model simplifications. We conclude that RIM2D is a valid tool for urban inundation simulation. Its short simulation runtimes allow probabilistic flood risk assessments and operational flood forecasts.
1 Introduction
Urban flash floods caused by heavy precipitation pose an increasing threat to cities world-wide due to the increasing intensity and frequency of convective rainfall caused by a warming atmosphere (Bürger et al., 2019; Rädler et al., 2019; Rudd et al., 2020; Pham et al., 2021; Rözer et al., 2021). Next to the direct impact on buildings, environment and people, also indirect consequences caused by interrupted economic activities or infrastructure services create large and increasing damages, even beyond the directly affected municipalities (Kotz et al., 2022). Increasing population exposure to floods has also been documented (Tellman et al., 2021). Thus, flood risk management plans adapted to the current flood risk but also capable of managing future risks are of high importance. These plans necessarily need model-based pluvial flood risk simulations in order to plan and implement appropriate and cost-effective flood risk management strategies.
In an urban environment these simulations require a high spatiotemporal model setup and simulation resolution in order to implement detailed, even block-specific management solutions. In addition, urban drainage has to be considered in the modeling in order to represent urban inundation realistically. Urban drainage encompasses the effect of infiltration on pervious surfaces as well as the drainage by the sewer system (Martins et al., 2018; Palla et al., 2018; Archer et al., 2020; Ress et al., 2020). Next to obtaining realistic urban inundation simulations, the consideration of drainage is also important for the assessment of the effectiveness and climate resilience of the sewer system to reduce pluvial flood hazard. Classical urban drainage models typically require a large amount of input data (e.g., information on the sewer system in terms of pipe network and pipe dimensions, number of locations and inlets and manholes), a high degree of modeling expertise to digest this information in the model setup resulting in long times for setting up the model, and long simulation runtimes, which are often longer than the event simulated (Martins et al., 2018; Lee and An, 2019; Dong et al., 2022; Karmakar et al., 2022). Therefore, many cities, particularly the smaller ones, cannot perform this task (Reyes-Silva et al., 2023). If these tasks are outsourced, the required time and financial resources are considerable.
Another important issue with increasing storm intensity and frequency (Berg et al., 2013; Bürger et al., 2019; Papalexiou and Montanari, 2019; Ali et al., 2021) is the severity of the resulting floods. Recent events, e.g., the flood in 2021 in Western Europe that resulted in 191 fatalities in Germany alone (Ludwig et al., 2022; Mohr et al., 2022), have shown that existing flood forecasting and warning systems are not sufficient for a timely and targeted flood warning and appropriate flood disaster management actions (Thieken et al., 2023). Impact forecasting provides more actionable information compared to current forecasts, which are limited to discharge or stage hydrographs at gauges, or simply flood warnings because of an expected heavy rainfall (Merz et al., 2020). Impact forecasts, in contrast, produce spatially explicit information where inundations, and possibly damages, are expected. The core of flood impact forecasting is a simulation of the actual flooding by flood simulation models. Spatially explicit information of flood depths, extent, and flow velocities provide a basis for the impact assessment. Impacts include of drowning or economic losses (Apel et al., 2022), and even the effect of prevention measures (Novoa et al., 2023) can be derived. These simulation models, however, have to be sufficiently fast and accurate to provide enough actionable lead time.
For this purpose the GPU-accelerated 2D hydraulic simulation model RIM2D (“Rapid Inundation Model 2D”) has been developed. Apel et al. (2022) have shown that RIM2D is suitable for operational flood forecasting, taking the disastrous flood of 2021 along the river Ahr in Western Germany as an example. The purpose of this study is the description of the features of RIM2D for simulating urban pluvial floods caused by heavy rainfall and to test RIM2D’s performance against actual measured sewer discharge data and simulations with a detailed SWMM urban drainage and inundation model. Through this we demonstrate the validity of the underlying assumptions and methods for simulating urban drainage and inundation with RIM2D and demonstrate its use for operational flood forecast and probabilistic risk assessments.
2 Materials and methods
2.1 RIM2D model
RIM2D is a 2D raster-based finite-difference numerical hydrodynamic model solving a simplified version of the shallow water equation as described in Bates et al. (2010). In this approach the convective acceleration term is neglected, which enables faster simulation of non-critical water flow, as usually encountered in floodplain hydraulics. This approximation of the full Shallow Water Equations is termed local inertia approximation (LIA). RIM2D also includes the numerical diffusion scheme proposed by de Almeida and Bates (2013) to improve the model stability under critical flow conditions and at high grid resolutions (low grid cells sizes). This scheme is especially important for urban flood simulation, where grid cell sizes have to be small in order to simulate the flow in a build-up environment realistically. Additional stability has been implemented by an automatic increase of numerical diffusion and reduction of the adaptive computational time step in case of unstable numerical solution, i.e., oscillating water surface profiles with negative water depths, in combination with a rollback of the unstable time step simulation. RIM2D has been successfully tested simulating the devastating flood in the Ahr valley in 2021 (Apel et al., 2022). Wang et al. (2021) have also shown that LIA is appropriate for urban flood simulation using a finite volume numerical implementation.
In order to avoid the computational burden of explicit sewer network simulations (Bertsch et al., 2017), a capacity-based approach has been implemented to represent the drainage of the sewer system on urban flooding (Kaspersen et al., 2017). This approach does not simulate the sewer system explicitly with all the pipe network and inlets, but rather the effect of the sewer system by reducing the rainfall according to the drainage capacity of the sewer system. This means that the rainfall is reduced to rainfall effectively causing for urban inundation. This happens before excess surface water is routed in the model. This approach drastically reduces simulation runtimes, but comes at the cost of neglecting sewer dynamics including inundation caused by overloaded sewers. Within the model, the effect of the sewer system is considered on areas with sealed surfaces. The same approach is used for infiltration on non-sealed surfaces to account for the effect of rainfall infiltration on flooding. Furthermore, drainage from roofs is considered. For simplicity, an unlimited capacity for roof drainage is assumed in order to avoid the redistribution of drainage excess to the surrounding grid cells. The roof drainage is applied to grid cells indicating building footprints, the sewer drainage on grid cells indicating sealed surfaces, and the drainage capacity to grid cells indicating non-sealed areas. A single grid cell can hold a fraction of sealed and non-sealed surfaces, as well as account for simple binary differentiation (fully sealed or fully non-sealed). RIM2D also offers the option to account for spatially distributed sewer system capacities and infiltration rates. This becomes important for larger, heterogeneous simulation domains. Flow in urban areas is routed around the building footprints, thus allowing for realistic dynamic flow simulation in a built-up environment. With this model design, all urban drainage and flow effects can be considered, which is a prerequisite of realistic simulation of urban flooding.
The computational kernel of RIM2D is coded in CUDA FORTRAN, which allows massive parallelization on CUDA-enabled NVIDIA Graphical Processor Units (GPU). For the presented study a NVIDIA TESLA P100 GPU was used.
2.2 Model setup
RIM2D is a parsimonious model requiring only three data sets for a basic model setup:
• A digital elevation model (DEM)
• A building cadaster (building footprints)
• A land use map, and/or a map of sealed surfaces
The model input raster data sets can be either in ESRI ASCII raster or in NetCDF format. For buildings and land use open source data sets are widely available, e.g., Open Street Maps (OSM) for buildings, and the CORINE land use data set. DEMs of appropriate resolutions for urban flood modeling (≤ 5 m) are often also publicly available in the EU or the United States. From these data sets the following mandatory model inputs can be derived:
• Digital terrain model (DTM) for flood routing
• Building footprints raster
• Roughness raster (Manning’s n)
• Sealed surface raster
• Non-sealed surface raster
The building raster indicate the footprints of the buildings and is used for calculating roof drainage. The building footprints need to be imprinted into the DEM by setting DEM raster cells covered by the building footprints to the nodata value of the DEM raster. Since all nodata cells in the DEM are excluded from the hydraulic simulation, flow is routed around the buildings.
The hydraulic roughness can be derived from the land use map using standard literature values. Alternatively, the roughness raster can be obtained from detailed surface sealing maps, if the modeling domain covers urban areas without larger forest patches. The sealed and non-sealed surface rasters can also be derived from the land use information. A simple classification in 0 and 1 is sufficient, but also fractions of surface sealing / non-sealing can be specified, if additional information is available.
The infiltration and sewer capacities are defined as parameters in mm/h. This can be a uniform value for the whole modeling domain. These capacities are multiplied with the sealed and non-sealed grid cell values, respectively, to compute the drainage from each individual cell. This approach enables also the definition of spatially varying capacities. In this case the sealed and non-sealed surface rasters should hold the distributed capacities, and the sewer and infiltration capacity parameters must be set to 1 to obtain the distributed capacities for each grid cell. Spatially distributed sewer and infiltration capacities might be appropriate for larger simulation domains, e.g., larger cities, where soil properties and sewer system capacities vary over the domain.
During the simulation water volume on the surface of each grid cell is reduced by the capacities in each time step. In this way the effect of the urban drainage on flooding can be simulated, whereas the simulated drainage is instantaneous. Flow concentration on the surface and the travel time to the next sewer inlet is not explicitly accounted for. In order to approximate the time delay for the activation of the sewer system, but also to consider the effect that not all rainfall on sealed surfaces is drained because it ponds on the surface and does not reach the sewer inlets, a threshold specifying the minimum ponding water for the activation of the drainage can be set. Below this threshold sewer drainage is zero. In this way the runoff concentration and flow to the sewer inlets over sealed surfaces can be approximately simulated, as well as the realistic representation of puddles and thin water films on sealed surfaces because of the surface micro-topography. The water volume subtracted from the sealed (sewer), non-sealed (infiltration) surfaces and roofs is summed up and written as model output, providing a time series of summed drainage from these three sources.
2.3 Boundary conditions
In RIM2D both fluvial and pluvial boundaries can be defined. Fluvial boundaries are defined as water level time series, and can be set for any grid cell. Typically, this is the inflow of a river into the domain, or a river bank which is overtopped. Water levels are used, because the river channel bathymetry is typically not fully mapped in the DEM. By using water levels no inflow volume error is artificially introduced by the missing river bathymetry compared to using discharge. Apel et al. (2022) have shown that this simplification yields realistic simulation results in the overbank inundation areas, which is of primary interest in flood simulations.
Pluvial boundaries, i.e., the rainfall input, are defined as a sequence of spatially distributed rainfall rasters in the same resolution and dimension as the DEM. The unit of the rainfall is mm per time step of rainfall input. The time step of the rainfall input, i.e., between the individual rainfall grids, can be any value that is an integer multiplier of the model computational time step. The source of the rainfall data could be radar rainfall observations, but also interpolated station data or rain forecasts.
Both fluvial and pluvial boundaries can be defined for a simulation, thus allowing a combined fluvial-pluvial flood simulation, as demonstrated with an earlier version of RIM2D in Apel et al. (2015). For all cells at the border of the model, for which no boundary conditions are specified, free flow over the boundaries is assumed, i.e., the domain is open. This is achieved by setting the water surface slope of the boundary cells to the same value as the neighboring cell inside the domain.
2.4 Test site, data, and model parameterization
2.4.1 Test site Lockwitzbach, Dresden
For testing the urban inundation modeling with RIM2D the Lockwitzbach catchment in the city of Dresden, Germany, was selected. The model domain covers an area of 25.9 km2 (Figure 1). The area is partially drained by the Lockwitzbach creek. The catchment of the Lockwitzbach within the city limits of Dresden covers about 50% of the model domain. The sewer network of the catchment, however, extends beyond the surface catchment (Figure 1). The combination of the surface and the “sewer” catchment defines the area, for which the hydraulic modeling is performed. Grid cells outside the domain are defined as nodata and excluded from the simulation.
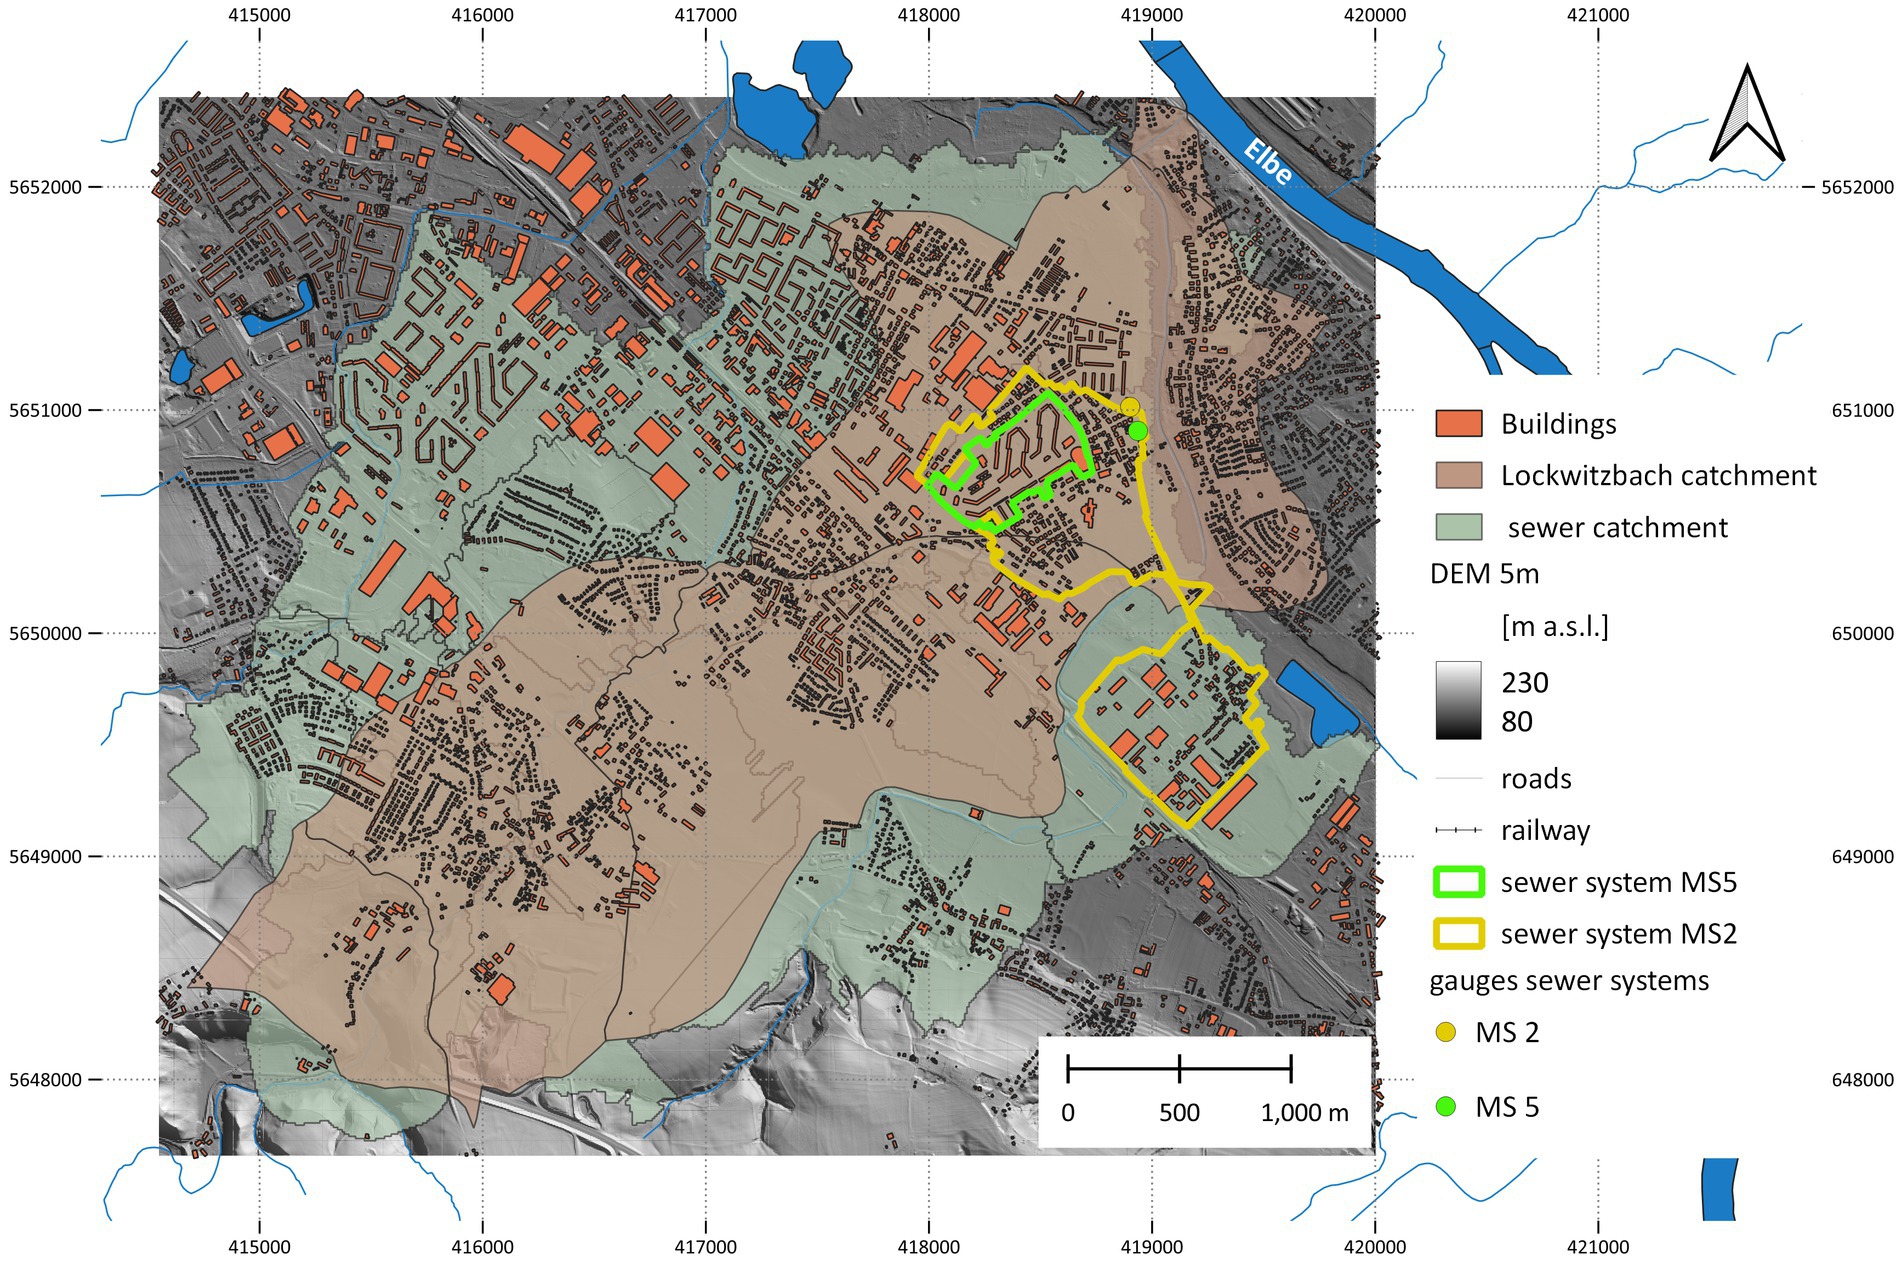
Figure 1. Overview of the study test are “Lockwitzbach catchment” in Dresden, Germany (coordinates in UTM zone 33 N). [m a.s.l. = meter above sea level].
The resolution of the DEM for the simulations was set to 5 m, as a compromise between required spatial detail for urban inundation simulation and computational demand. At this resolution most of the prominent urban features, i.e., buildings, roads, railway tracks and small-scale topography, and hydraulic structures like dikes and sluice gates are still suitably represented. This resulted in a grid with 1094*948 = 1,037,112 cells. The 5 m DEM was resampled from an open source DEM with 2 m resolution provided by the German Federal State of Saxony.1 Resampling the 5 m DEM from a finer resolution provides more control on the representation of important hydraulic features to be retained in the 5 m model, thus this approach was followed instead of using an already existing 5 m DEM. Moreover, with 5 m resolution model runtimes remain low and the model can be used in flood forecasts and probabilistic risk assessments, which was the main criteria for selecting this resolution. Another aspect is the prospect that the whole city area of Dresden (620 km2) should be modeled in the near future. For this scale finer resolutions than 5 m are still very challenging, even with fast models like RIM2D.
Another aspect for this choice is the limited information gain by higher resolution for flood forecasting. We argue that with finer resolution the information gained in terms of spatial precision as a basis for decisions in disaster management is limited in relation to the cost of longer model runtimes.
For the city of Dresden, a detailed map of sealed surface fraction is available from the Federal State of Saxony.2 This map was rasterized to the same resolution and extent as the model DEM, showing the fraction of surface sealing (Figure 2, left). The raster of the non-sealed surface was constructed by calculating 1 minus fraction of surface sealing. Because of the existence of a detailed surface sealing map, the surface roughness was in this test case not derived from land use information, but according to the surface sealing fraction. A Manning’s roughness value of 0.015 was assumed for 100% surface sealing, assuming a surface cover of concrete or tarmac. For 100% non-sealed surface areas a roughness value of 0.035, representing grassland or shrubland, was assumed. Forested areas with higher roughness do not exist in the model domain. For surface sealing between 0 and 100% the roughness was linearly interpolated between these values (Figure 2, right).
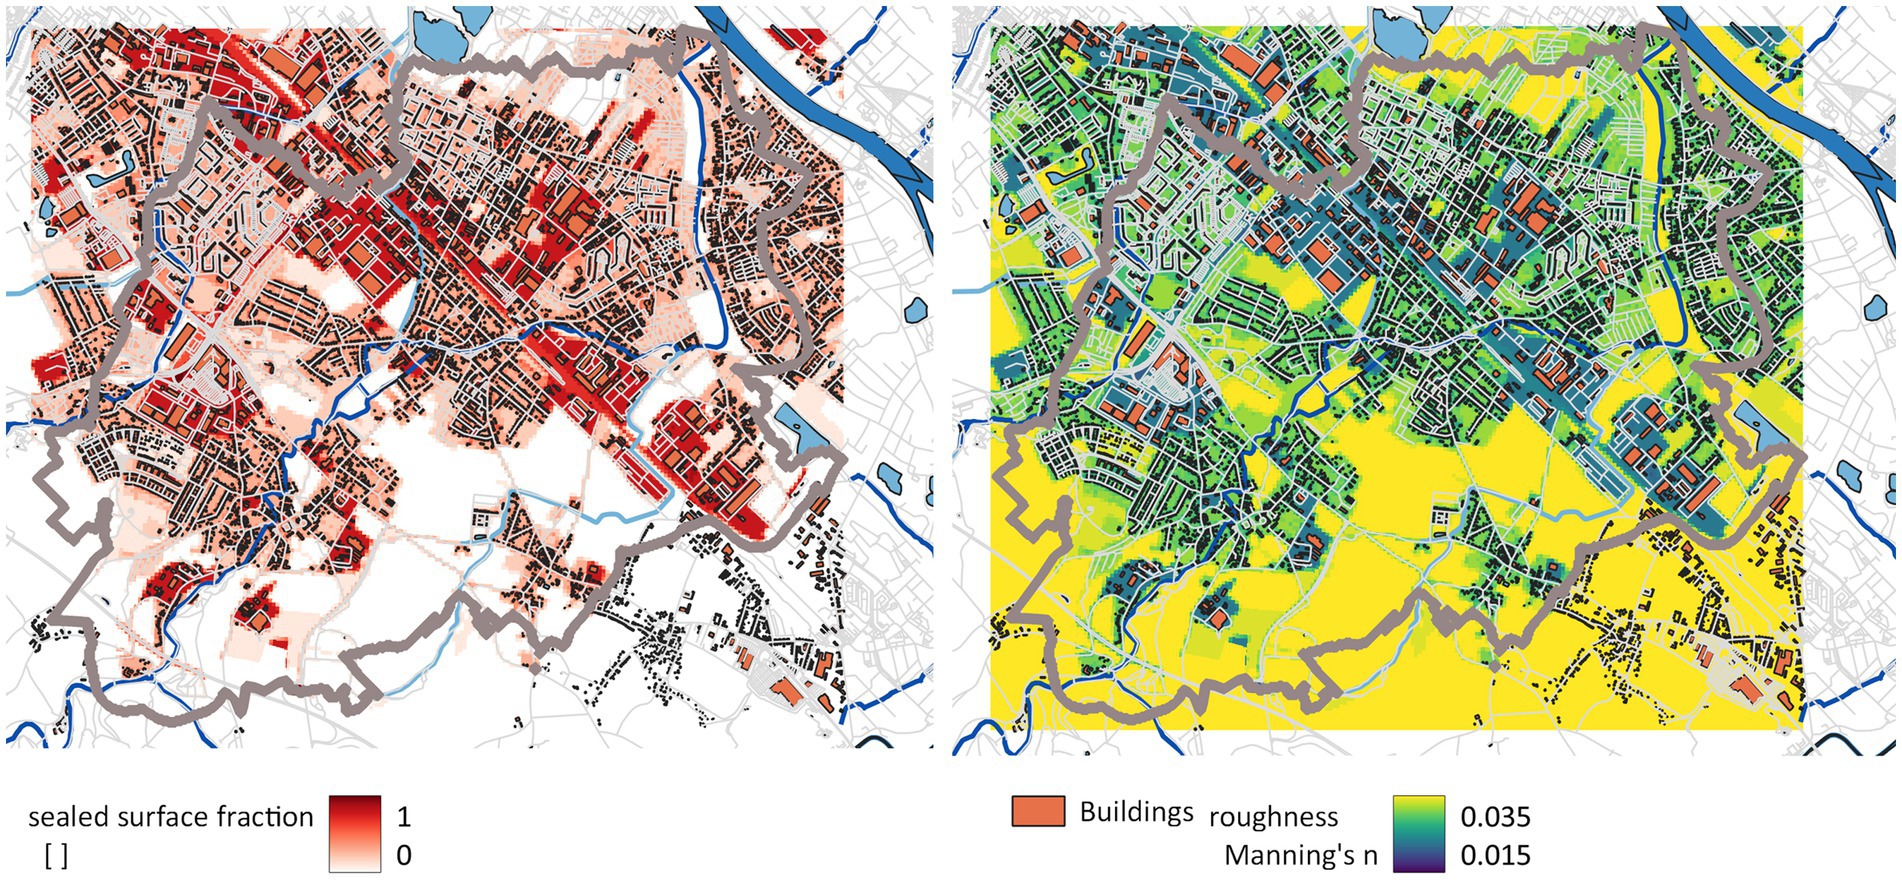
Figure 2. Fraction of sealed surfaces (left) in the simulation domain and Manning’s roughness (right) used in the simulations, both based on a detailed mapping of sealed surface fraction by the Federal State of Saxony, Germany.
2.4.2 Dresden urban observatory
The Urban Observatory Dresden monitors the impact of urban areas and urban drainage on Lockwitzbach creek. It consists of monitoring stations within the stream and in several sub-networks of the sewer systems (Benisch et al., 2017). The monitoring data has been previously used for the calibration of rainfall-runoff and urban pluvial flood modeling (Wagner et al., 2019; Reyes-Silva et al., 2023). The area consists of both combined and separate sewer systems. In this study, we included flow data of one combined sewer network (MS 2) with 1.3 km2 connected area and one separate sewer network (MS 5) with 0.21 km2 connected area (Figure 1). Flow rates were measured in one-minute resolution at the outlet (MS5) or upstream of the combined sewer overflow structure (MS2) with Ultrasonic-Cross correlation sensors (NIVUS POA). Rainfall was recorded with a tipping bucket gauge (NIVUS RM20) in one-minute resolution. All measured data were subsequently aggregated to 5 min resolution.
2.4.3 Precipitation data
For the pluvial flood modeling, we used the reprocessed rainfall radar data (“RADOLAN”) of the German Weather Service (DWD). RADOLAN is an operational open source product of the DWD, available at the Climate Data Center (CDC) of the DWD3. The reprocessed RADOLAN data is available in 5 min time intervals covering the whole of Germany at a spatial resolution of 1,000 × 1,000 m. This resolution, particularly the temporal resolution, is generally sufficient for modeling the inundation caused by spatially limited and short term, convective rainfall events. The data for the 8 events recorded in the sewer system monitoring (Table 1) was re-projected to the same reference system as the DEM, resampled to 5 m spatial resolution and clipped to the extent of the model domain. The resampled series of rainfall maps for the events served as pluvial boundary conditions for the simulations. For the interpretation of the results it has to be noted that the spatial resolution of RADOLAN is still relatively coarse compared to the spatial extent of the sewer subsystems of less than 1 km2. Moreover, the sewer subsystem MS5 is located at an intersection node of 4 RADOLAN cells (Figure 3), which might cause the simulation results to be sensitive to the interpolation of RADOLAN measurements to a regular raster. RADOLAN data is known to contain errors for heavy convective precipitation events (Schleiss et al., 2020; Saadi et al., 2023). This fact needs to be considered for the evaluation and discussion of the simulation results.
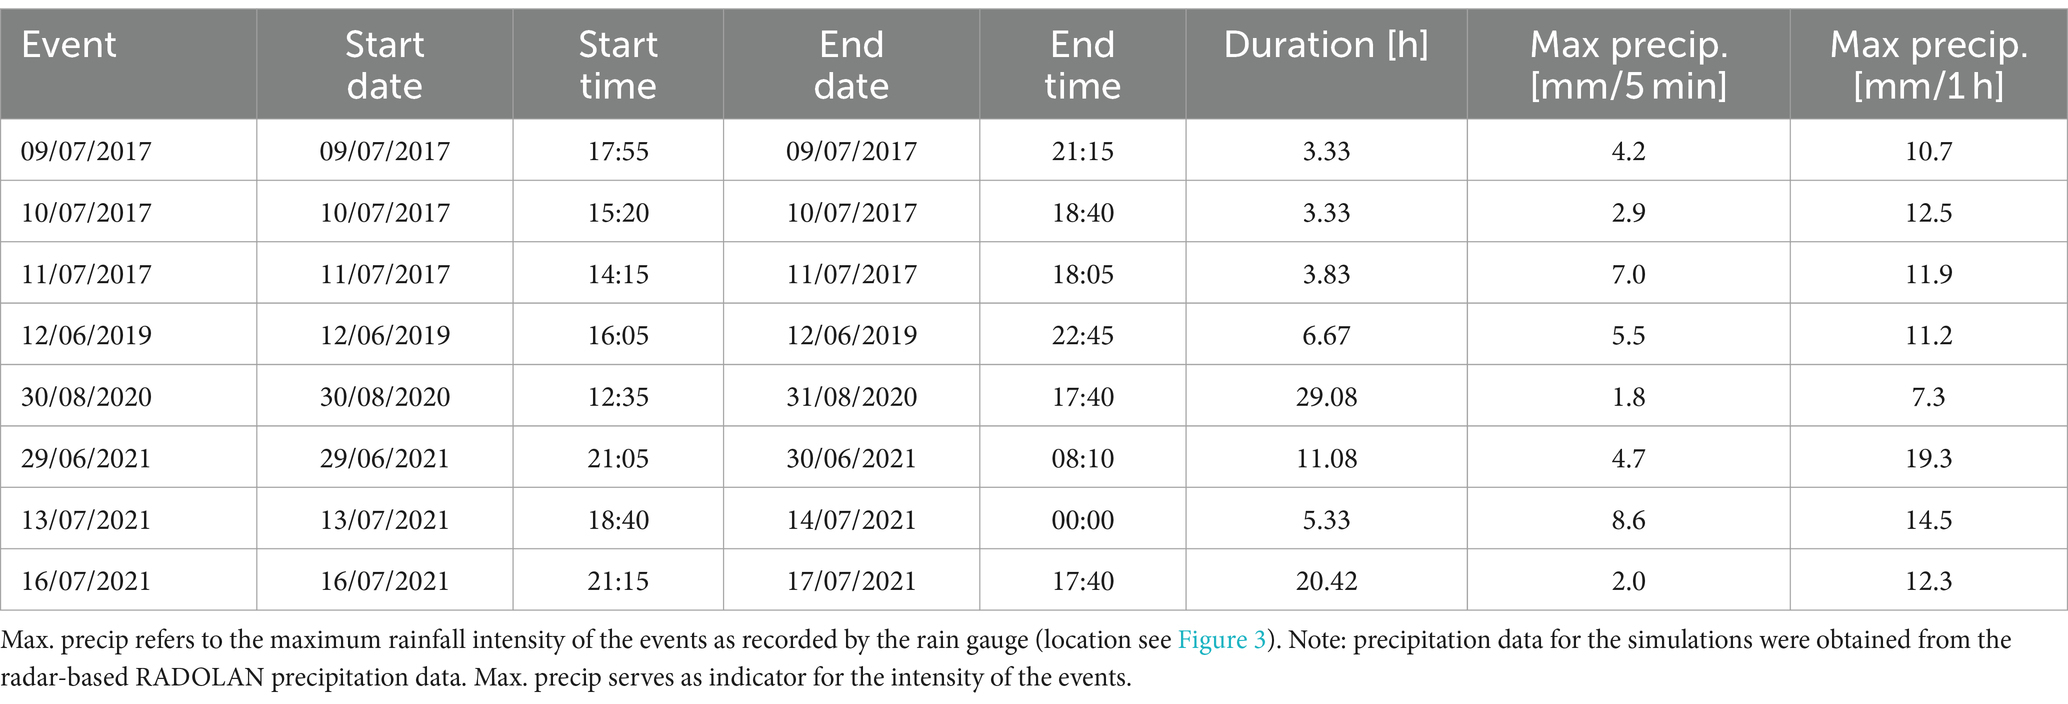
Table 1. Rain storms simulated by RIM2D for model validation.
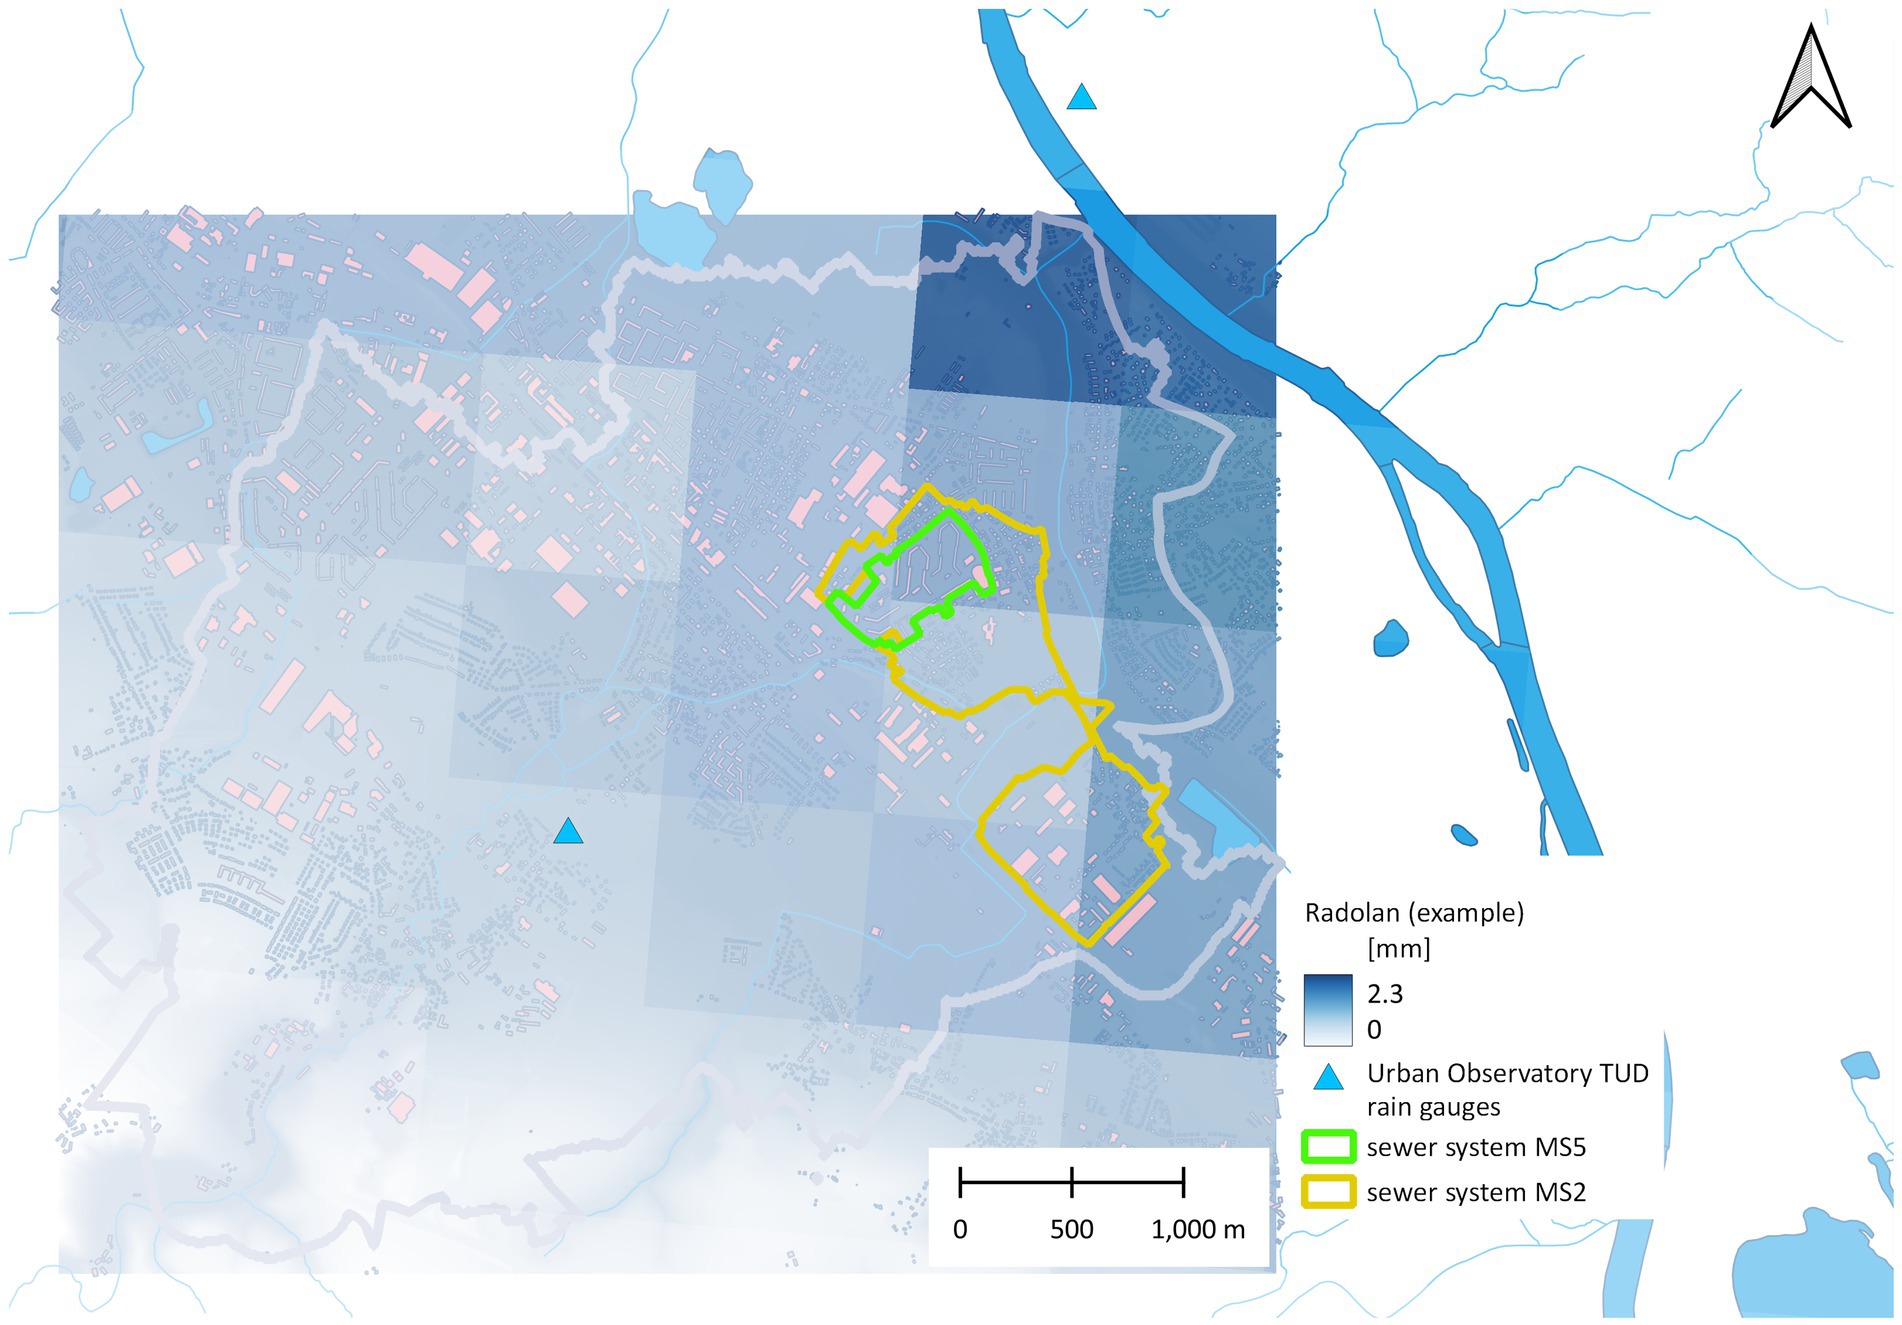
Figure 3. Illustration of the spatial resolution of the RADOLAN rainfall product and the location of the sewer subsystems in the Lockwitzbach catchment relative to the RADOLAN cells.
2.4.4 Parameterization of infiltration and urban drainage
The parameterization of the sewer drainage and infiltration is crucial, because both have a considerable effect on surface inundation for most rainfall events. Only for extreme precipitation events that largely exceed infiltration capacities and the design values of the drainage system the neglection of the drainage can be justified. For the test case, spatial uniform capacities were used as a first approximation of the real drainage capacities. A uniform infiltration capacity was estimated at 10 mm/h4, based on the dominant soil types in the test area, clay loam and loam.
The estimation of sewer capacity is based on the German guideline for hydraulic design of sewer systems [English version DWA-A 118E (DWA, 2006)]. The guideline provides a consistent approach for simplified design of drainage pipes according to the rational method. The approach scales the peak discharge coefficient according to surface slope, imperviousness and rainfall intensity. Surface slope and imperviousness further determine the minimal relevant storm duration while land use type defines the relevant return period. The German Weather Service DWD provides reference design storm intensities in the raster product KOSTRA (Junghänel et al., 2017) with a spatial resolution of 8.5 km. The combination of peak discharge, storm duration and return period enables a spatially continuous estimation of the required hydraulic uptake capacity. We estimated sewer capacities in a range of 20 mm/h – 25 mm/h based on a return period of storms of T = 2 years and a duration of 15 min. The return period of 2 years is the design standard of the existing sewer system in the study area. Model runs were then performed with fixed capacities of either 20 mm/h or 25 mm/h.
Furthermore, two thresholds (2 mm and 5 mm) for the activation of the sewer system were defined to test the sensitivity of the simulation results. The two sewer capacities and thresholds result in 4 simulations per event (Table 2). The infiltration rate was kept constant because of the low impact on the sewer discharge simulation and the missing validation data for surface inundation, for which the infiltration has a larger impact.
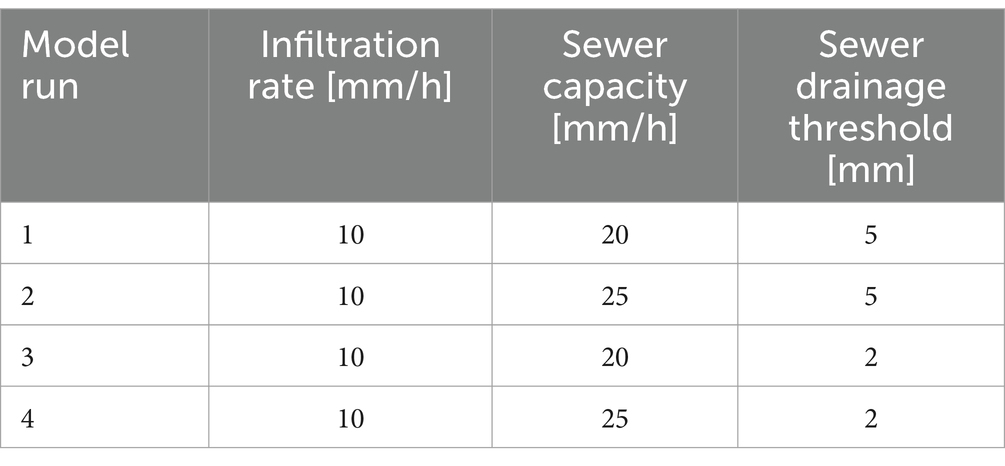
Table 2. Model parameter combinations used for model validation.
2.5 Model validation and plausibility test
For the validation of the sewer system simulation, 8 rainstorms causing stormwater sewer discharge were simulated with RIM2D and quantitatively compared to the recorded sewer discharge. Table 1 lists the event dates, durations, and the maximum rainfall as recorded by a rain gauge located in the Lockwitzbach catchment. This event set encompasses very short and high intensity events as well as longer duration events with moderate rainfall intensities. These events were simulated using the RADOLAN rainfall as input. The simulated total sewer drainage, which is the sum of drainage from sealed surfaces and roofs in RIM2D, was compared with the measured sewer discharge at the two sewer subsystems (MS2 and MS5).
Sewer flow and surcharge are commonly modeled with combined rainfall-runoff generation and hydrodynamic flow routing. The United States Environmental Protection Agencies’ Storm Water Management Model (SWMM) is a widely used, open-source software for this task (Rossman, 2015). A SWMM was developed for the test site (Wagner et al., 2019) and coupled with a 2-D diffusive surface flow propagation algorithm (Reyes-Silva et al., 2023). In the SWMM study a distributed representation of 8,100 sub-areas in MS2 catchment and 705 sub-areas in MS5 catchments, representing different land cover and building parcels provided the reference. The coupled model was calibrated in a multi-variant multi-event approach, in which parameters for runoff generation and flow concentration were calibrated for the different land cover types.
RIM2D simulations are compared to measured sewer discharge for all events concluded in Table 1 as well as simulations with SWMM for the events of 09/07/2017 and 11/07/2017. For the events in Table 1 no information on surface inundation was available, neither quantitative nor qualitative. Detailed mappings of urban inundation in Dresden after the pluvial events do not exist. This is unfortunately the case for most urban pluvial floods world-wide, because of the short duration of the events and the technical problems of mapping inundation in a built-up environment by remote sensing. However, for the Lockwitzbach catchment one incident of pluvial flooding was recorded by the fire fighters for an event in 2014-05-27, i.e., prior to the establishment of the urban observatory of TU Dresden. In this event the flooding of the basement of a building was recorded. Therefore, this event was also simulated with the described setup and the RADOLAN data as input. The resulting surface inundation was compared to the reported basement flooding, in order to validate if the simulation captured this incident.
3 Results and discussion
3.1 Surface inundation
Figure 4 shows the simulated maximum inundation depths exemplarily for the two events with the highest and lowest rainfall intensities. For a better identification, the view is zoomed to the area immediately surrounding the sewer sub-systems. For both events the maximum inundation depths are mostly below 1 cm, except for the event 2021-07-13, where a small area outside the built-up area is inundated. This is a natural depression where water is accumulating. Thus, these events did not cause noticeable surface inundation and damage, and the bulk of the precipitation was either drained by the sewer system or infiltrated. This is confirmed by the lack of any reports of inundation in the built area, and further supported by the maximum precipitation within 1 h listed in Table 1, which are all below the sewer capacity estimated for the Lockwitzbach area (Table 2).
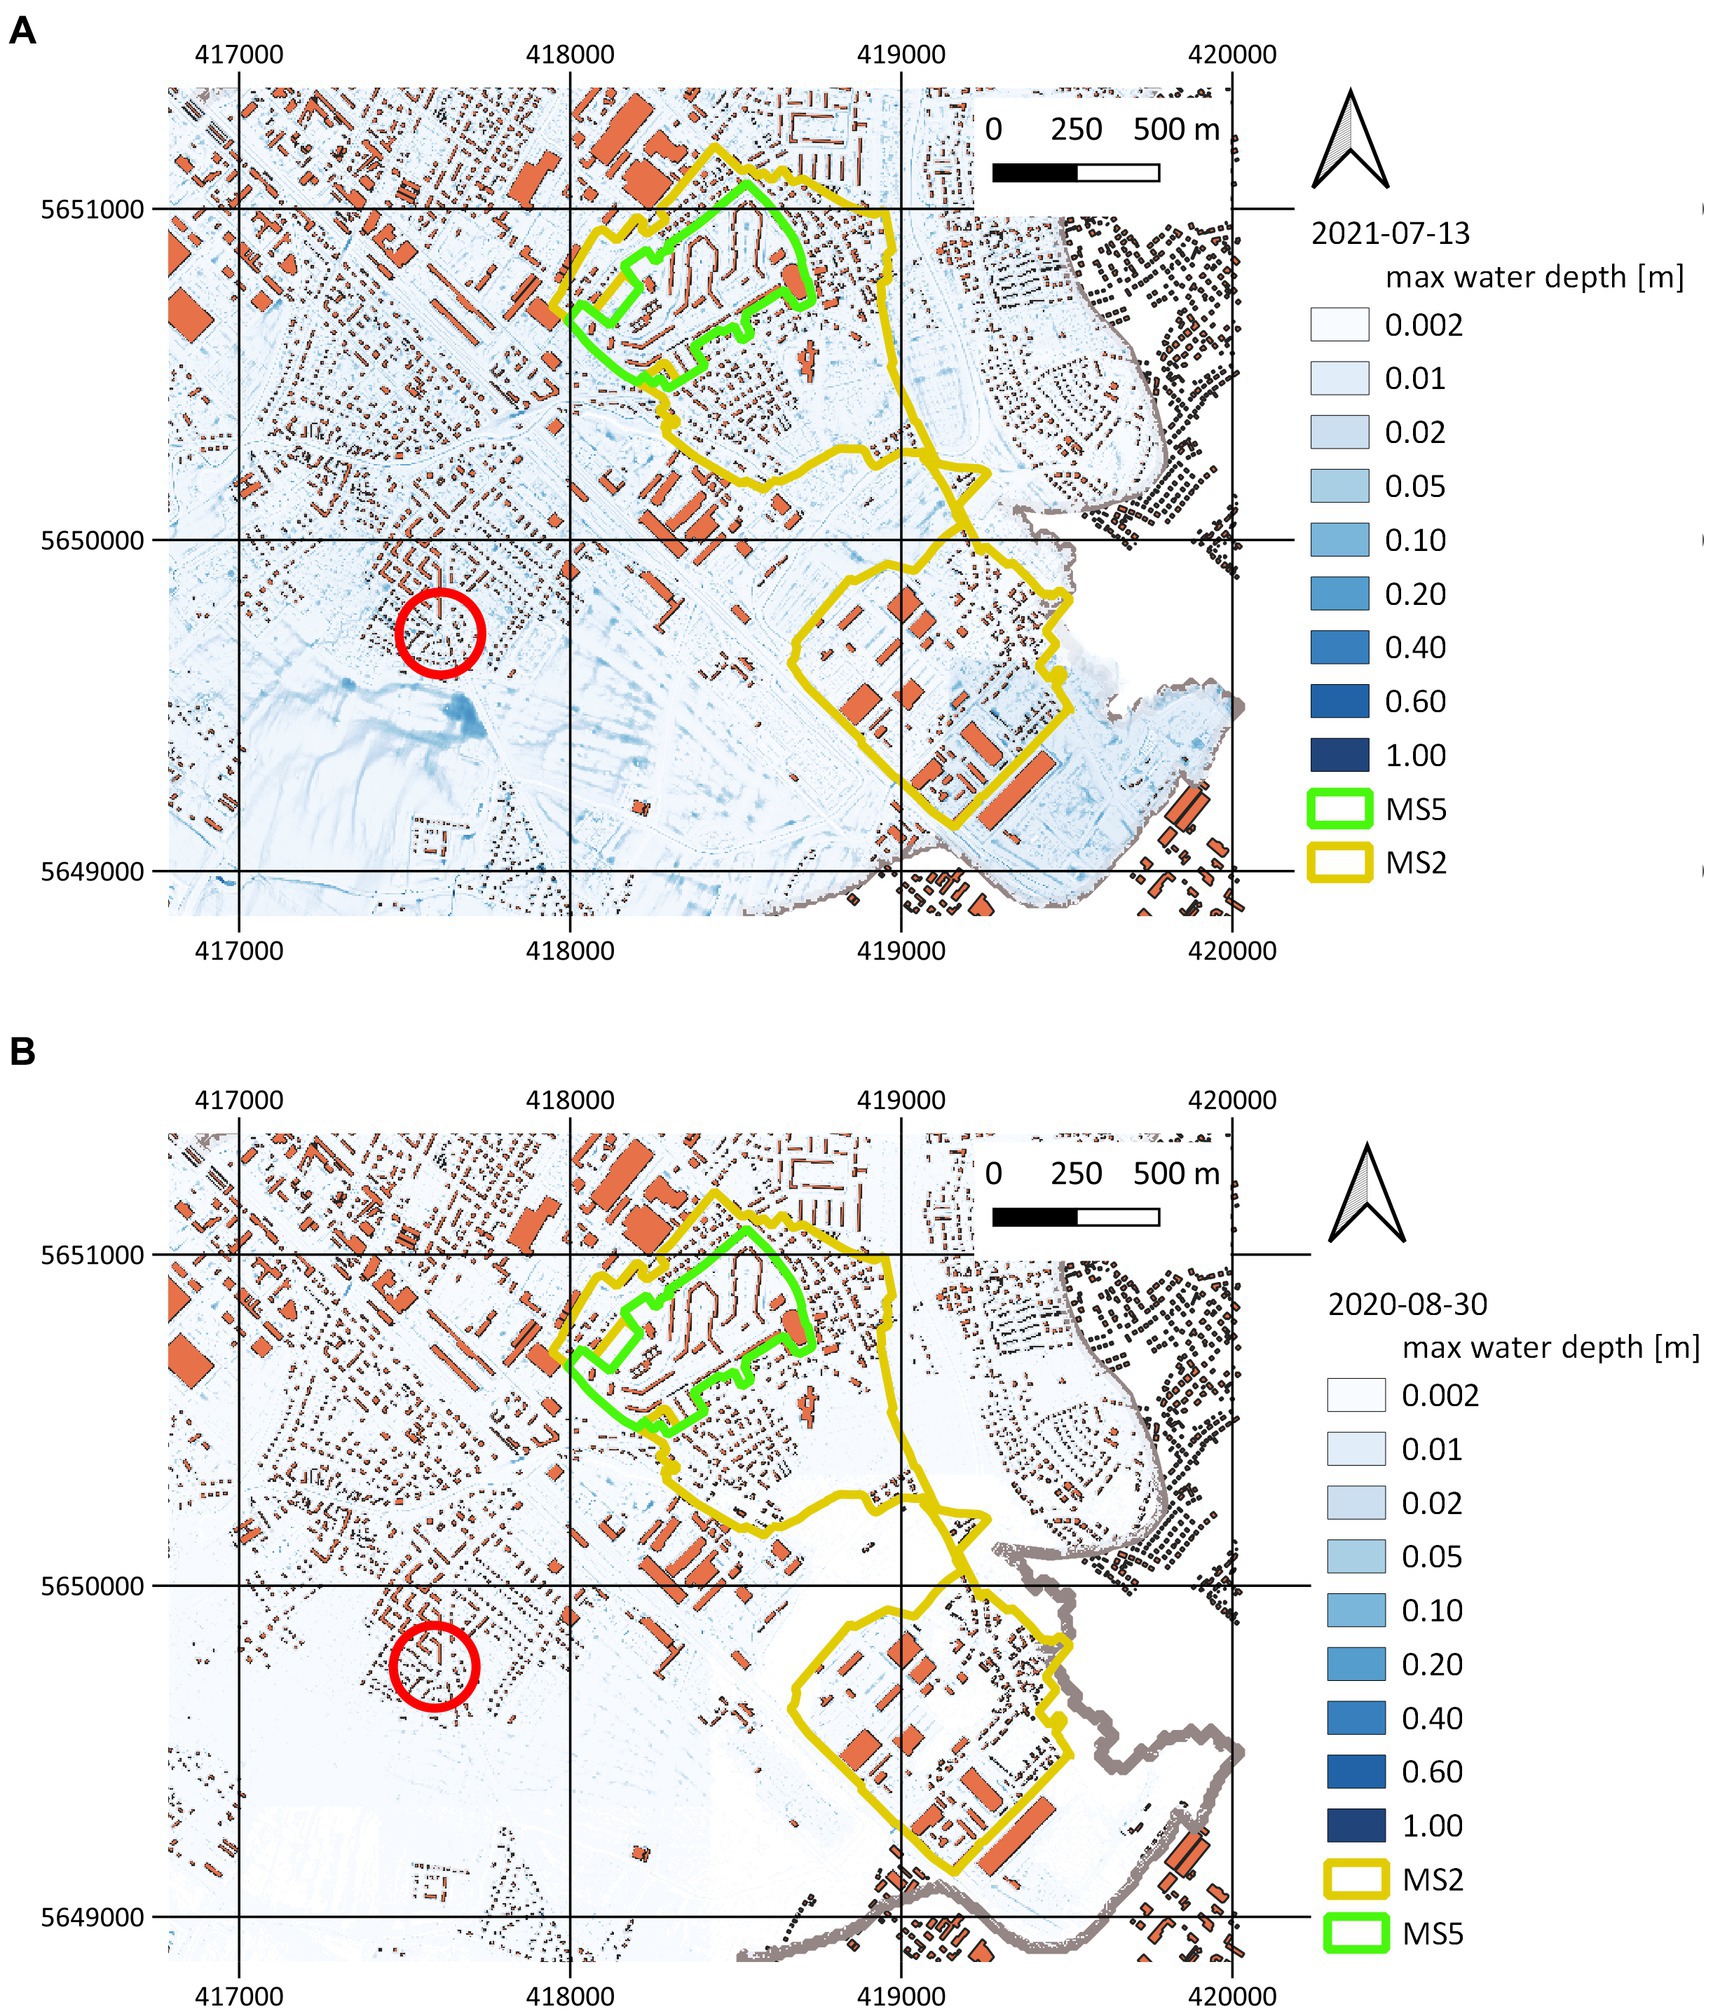
Figure 4. Simulated maximum inundation depths for events with the highest (2021-07-13, A) and lowest (2020-08-30, B) rainfall intensities zoomed into the area of the sewer sub-systems MS2 and MS5. The red circles indicate the location of the surface inundation plausibility test shown in Figure 5.
Due to the lack of simulated and reported inundation of the built-up area for the selected events, a validation of the surface inundation modeling cannot be performed with the event set. However, the simulation of the event in 2014-05-27 resulted in a significant inundation around the location where the basement of a house was inundated (Veilchenstraße 2, Figure 5). This provides qualitative evidence of the plausibility of the surface inundation simulation of RIM2D, supporting the conclusions on the validity of RIM2D simulations in Apel et al. (2022). In this a validation of RIM2D of fluvial floods was performed. Based on the results in Apel et al. (2022) and this study it can be inferred that the surface inundation simulations with RIM2D are valid, as long as the volume and intensity of the precipitation input and the ponding water on the surface are reasonable. The latter aspect is achieved by the implemented urban drainage approach in RIM2D outlined in section 2.2 and the results presented in 3.2.
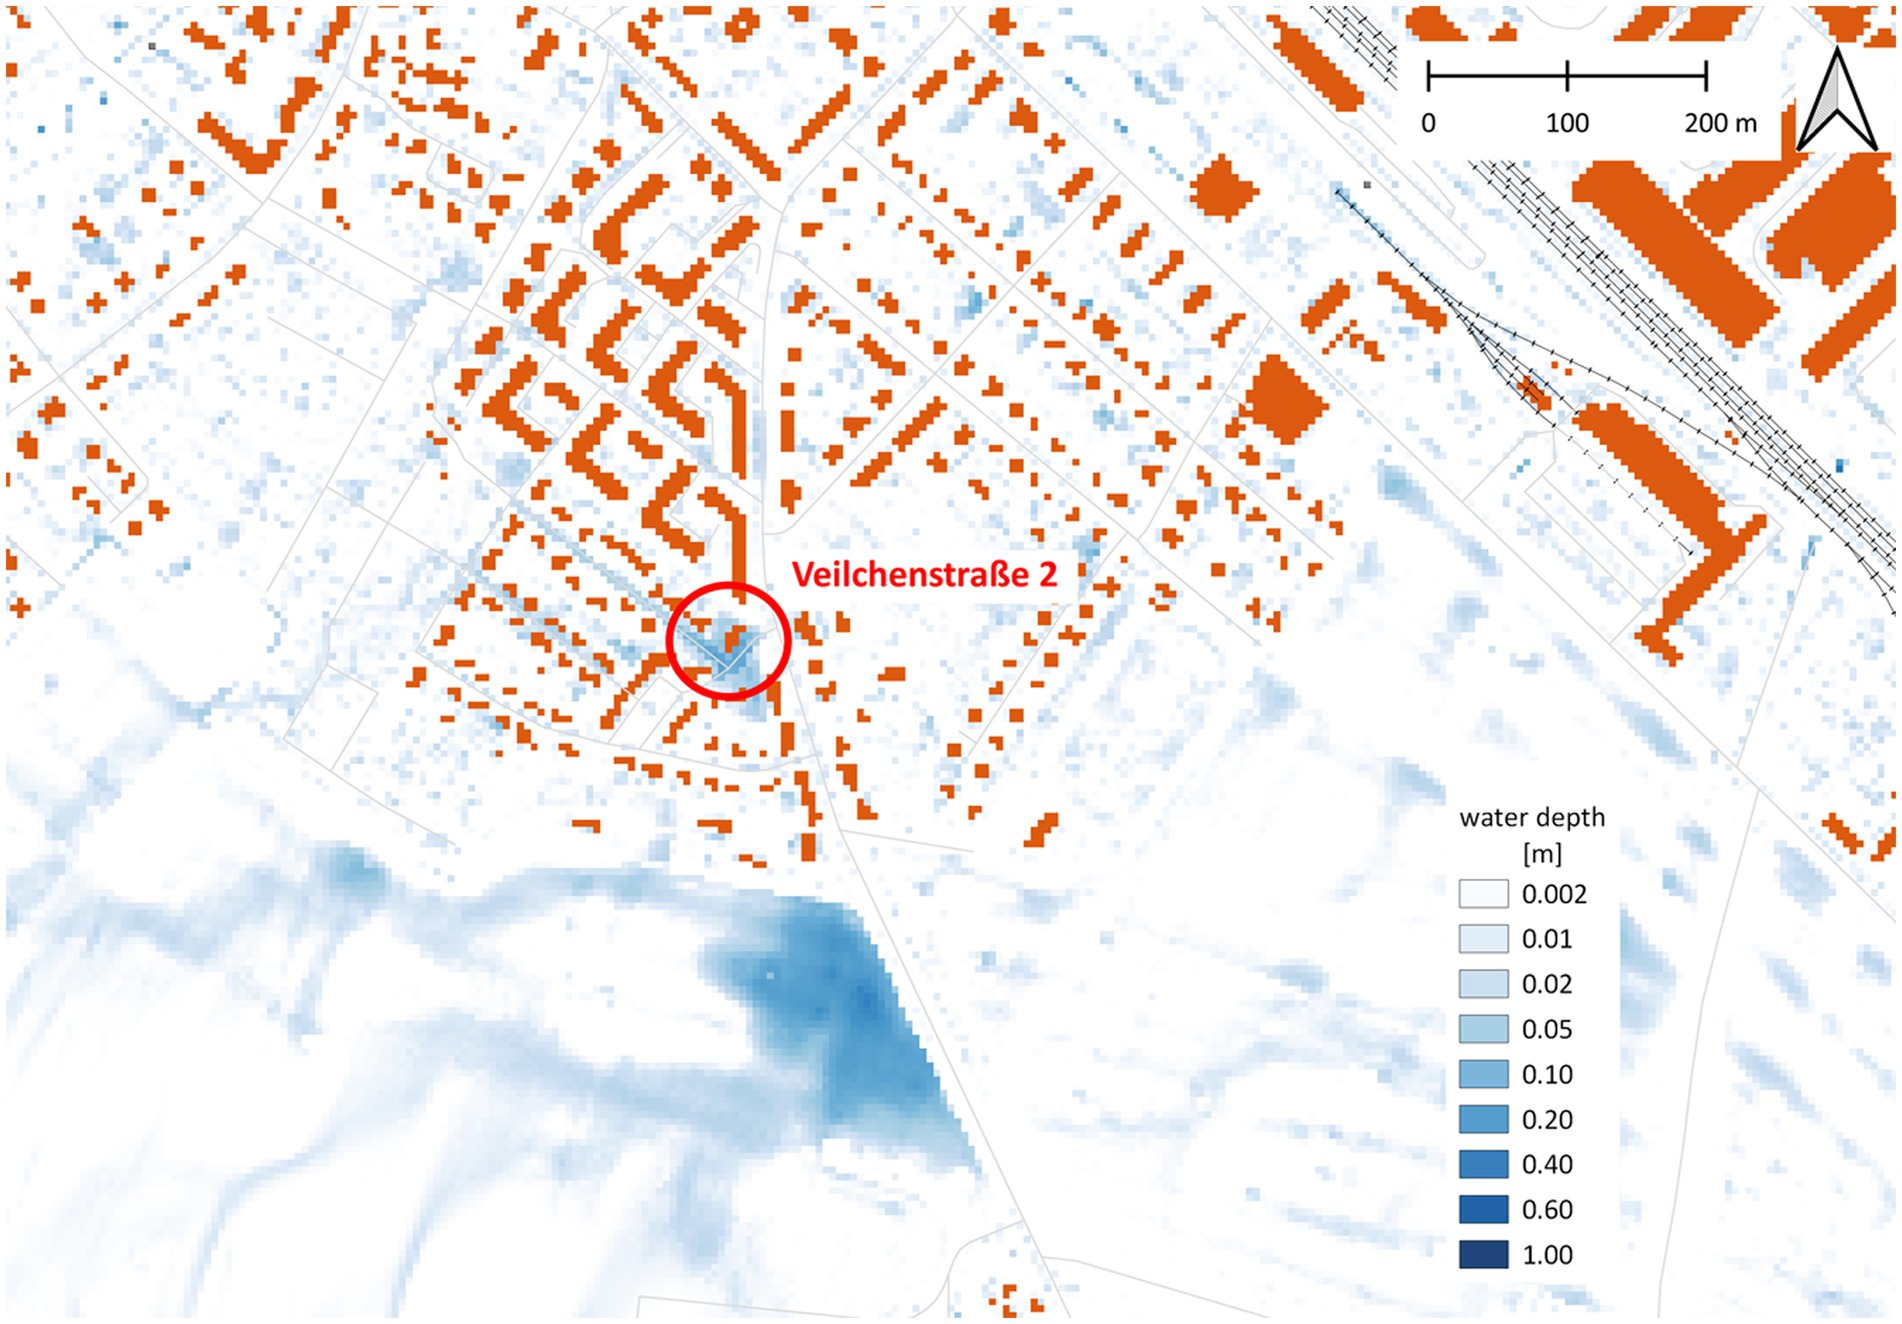
Figure 5. Simulated maximum water depths for the event 2014-05-27 and the reported basement flooding at Veilchenstraße 2 (red circle).
3.2 Sewer discharge
Figure 6 shows the comparison of the measured discharge in the sewer sub-systems and the simulation results exemplarily with sewer capacity of 20 mm/h and sewer drainage activation threshold of 5 mm (run 1, Table 2). Overall, the simulated sewer discharges show the same dynamics as the measured sewer discharges. The occurrence and magnitude of the discharge peaks are well matched in most of the events for the two sewer sub-systems. In some cases, often for events with intense precipitation, the peaks are overestimated. However, sometimes the peaks are also underestimated in high precipitation events. Thus, for the peak magnitudes no systematic bias can be observed. Over- or underestimation of the peaks can occur in one sewer sub-system, while in the other the peak is matched, or the peaks are underestimated in one event and overestimated in another. This points toward errors in the precipitation data. Furthermore, the spatial resolution of 1 km2 of the RADOLAN rainfall product is rather coarse compared to the area of the sewer subsystems (MS5 = 0.2 km2, MS2 = 0.9 km2). Because of this, small-scale variations in the spatial rainfall distribution might be missed by the radar product, which in turn has an effect on the sewer discharge simulation. The fact that for a single event an overestimation in one sewer subsystem is observed, while the other shows an underestimation hints toward mismatches or errors in the spatial distribution of the rainfall input.
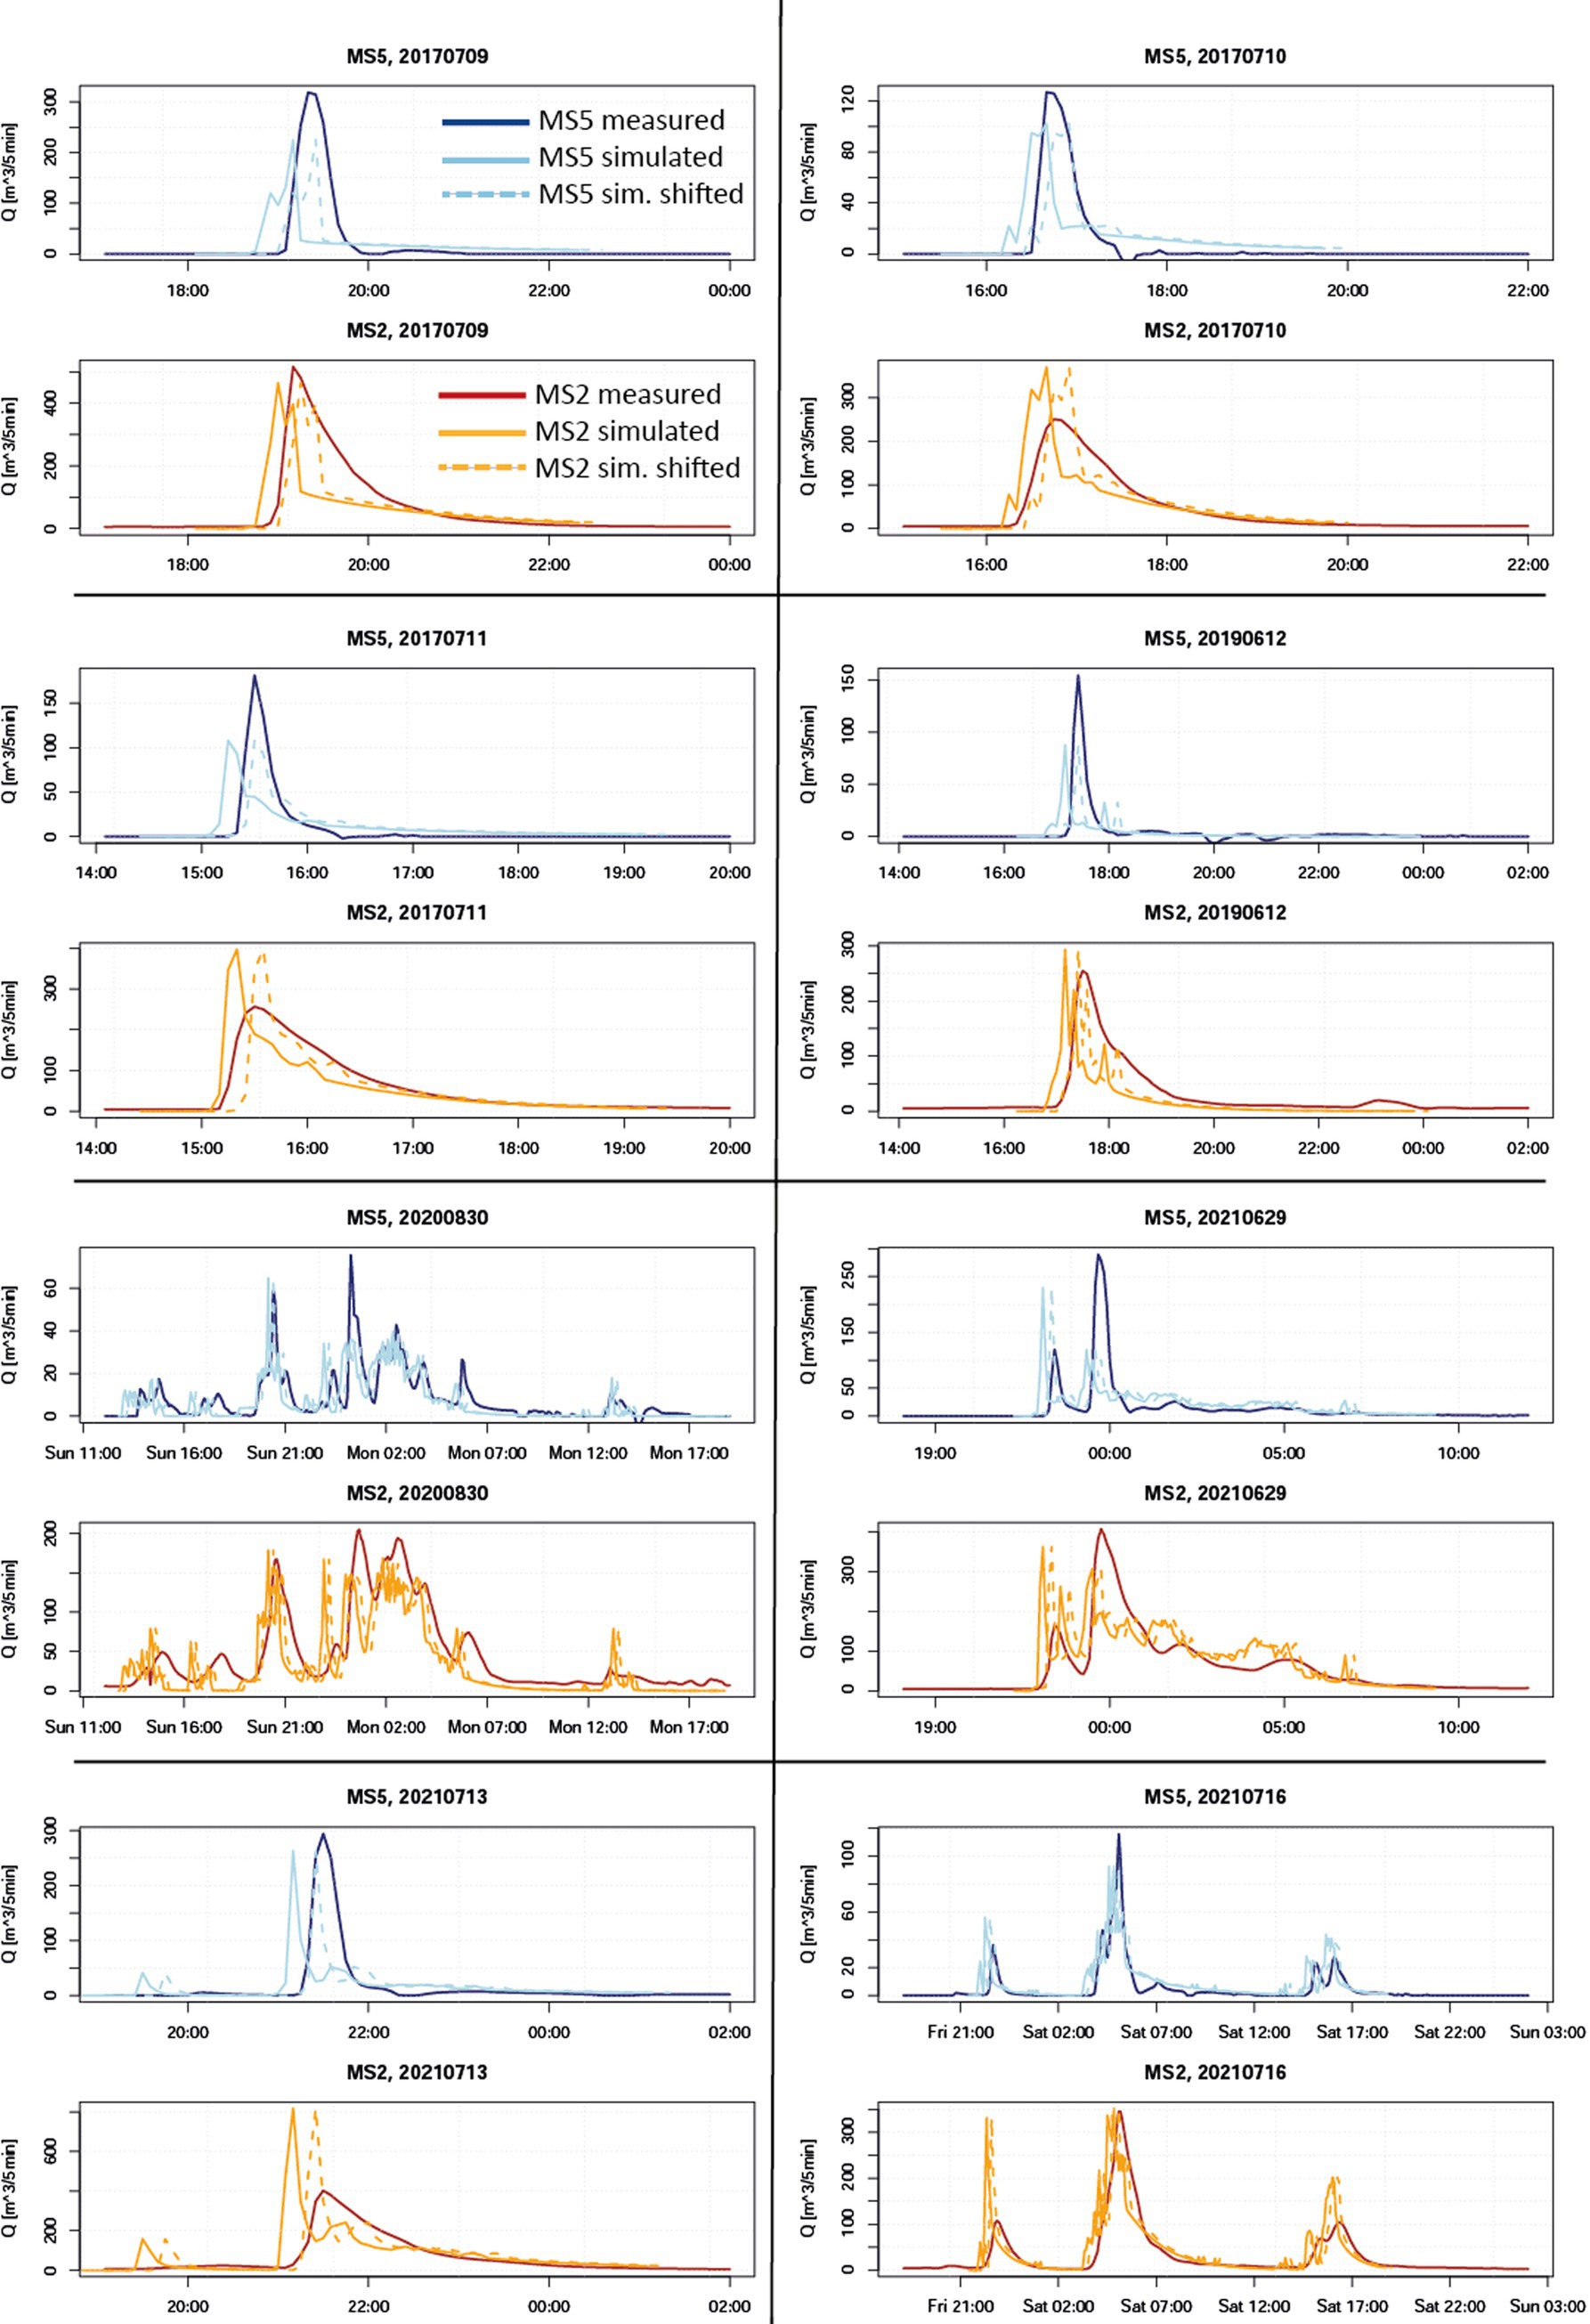
Figure 6. Measured and simulated sewer discharge for the sewer sub-systems MS2 and MS5 for the selected rainfall events with infiltration capacity = 10 mm/h, sewer capacity = 20 mm/h, and sewer drainage activation threshold = 5 mm. The graphs indicated with “sim. shifted” have been shifted by 15 min.
In addition, a notable time delay between the simulated and measured time series is always observed, with the simulated discharge preceding the measured discharge. This is explained by the simplified approach for the sewer system implemented in RIM2D, which causes an instantaneous response of the simulated sewer discharge to precipitation. The observed time shift between the simulated and measured sewer discharge is about 15–20 min. The dashed lines in Figure 6, which are the simulated sewer discharge shifted by 15 min, match the temporal dynamics of the measured discharge very well. The time delay represents the latency of the urban drainage system, representing the runoff concentration of collected rainfall from the surface into the sewer network and conveyance of flow to the point where it is measured. Supplement Figures S1 – S3 show the results for the model runs 2, 3, and 4. Overall, the simulated sewer discharges of the different model runs have a very similar temporal dynamics as run 1 and the observed discharge, which is explained by the dominance of the rainfall input. Slight differences can be observed in the magnitudes and timing, as a result of the different parameterization of the sewer capacity and threshold value.
The comparison with the SWMM sewer discharge simulations supports this finding. As shown in Figure 7, also the SWMM simulations under- or overestimate the measured sewer discharge, depending on the event and sewer subsystem. The simulated hydrographs and peak discharges of RIM2D are similar to SWMM, except for the event 11/07/2017 in MS2. In this particular event RIM2D and SWMM results are quite different, with RIM2D overestimating the peak discharge (but good timing) and SWMM underestimating the peak discharge and a delayed hydrograph.
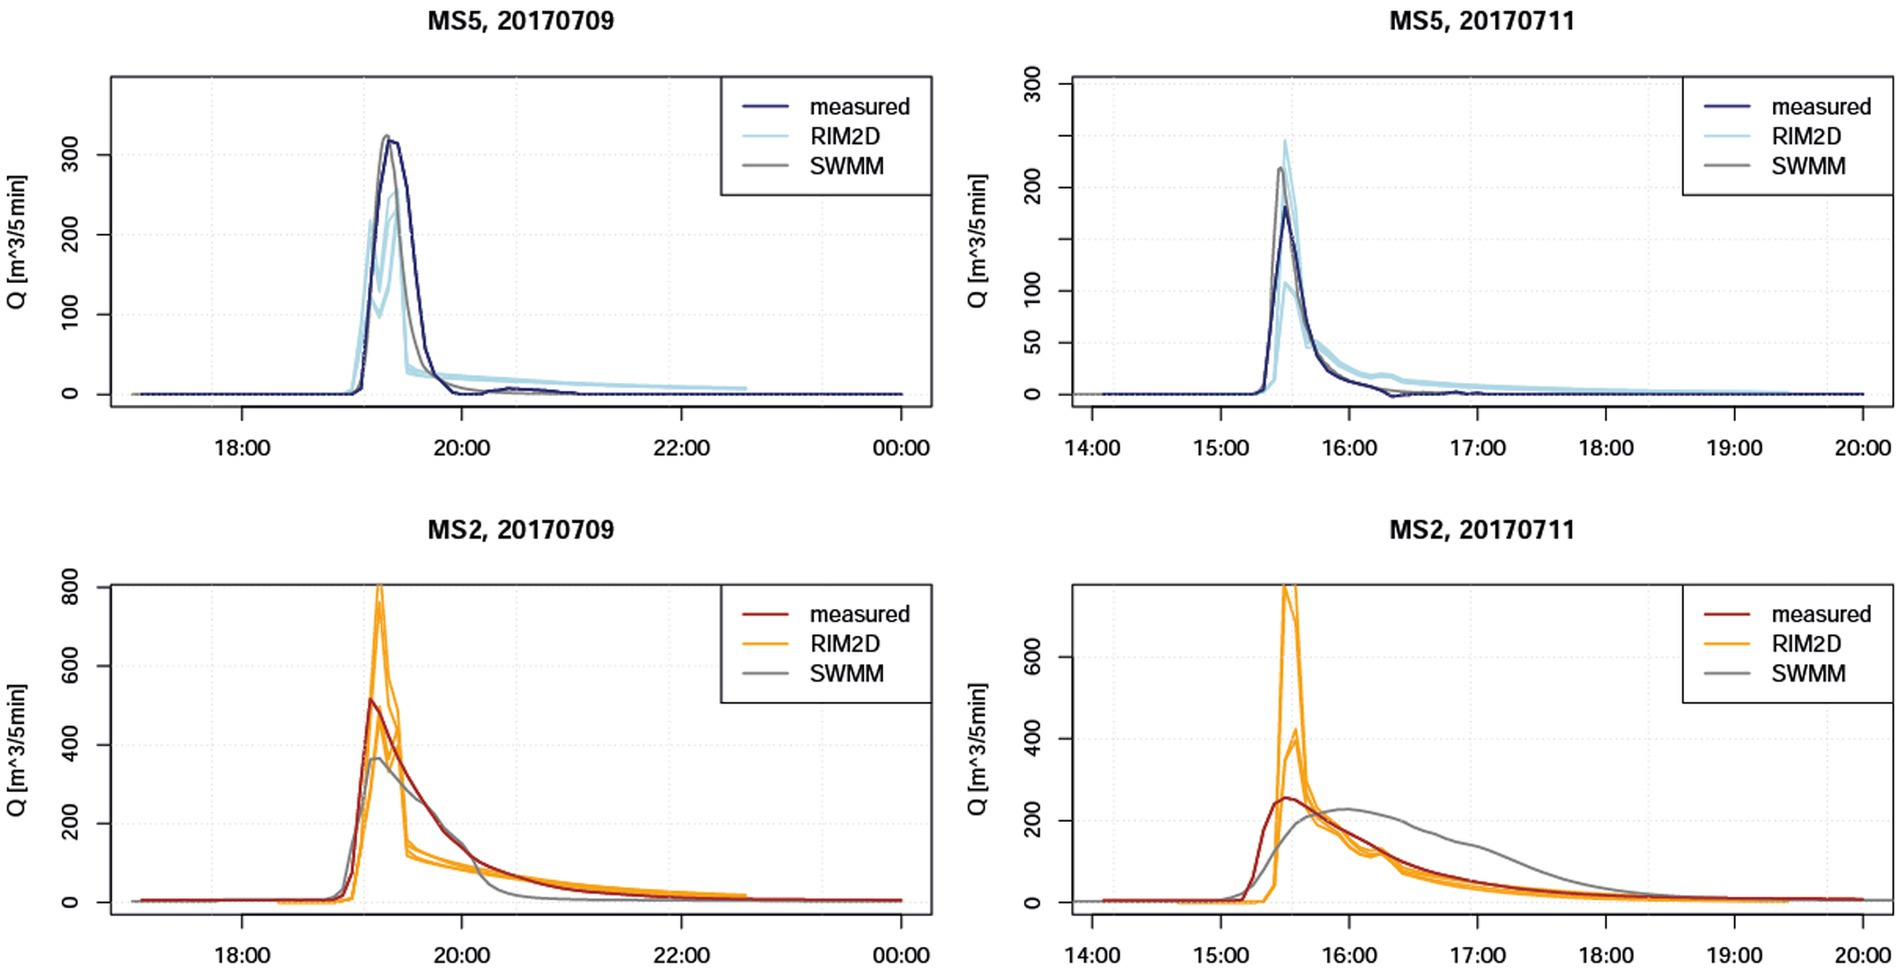
Figure 7. Comparison of RIM2D sewer discharge simulation results (all model runs 1–4, with time shift as compensation for sewer discharge concentration) with SWMM simulations for the events 2017-07-09 and 2017-07-11.
With respect to pluvial urban flooding the volume and maximum (peak) sewer discharge, are more important than the timing of the simulated flow events. If the peak discharge exceeds the maximum discharge capacity, sewer sections surcharge and might cause overflow of manholes and cause inundation. This effect is represented in RIM2D through the capacity-based approach by keeping the rainfall volumes exceeding the sewer capacity on the surface, which is then routed as surface inundation through the domain. The overall rainfall event volume drained by the sewer system is highly relevant for the volume and extent of surface inundation as well as the amount of water propagated to downstream areas by surface flow. Thus, simulating reasonable sewer volumes is key for realistic urban inundation caused by rainstorm events. Table 3 shows the volume comparison between the measured and simulated sewer discharges, and highlights the differences between the model runs more clearly. Overall, the differences between simulated and measured sewer volumes cover a wide range from almost perfect matches to a deviation up to +/− 50%. Over all simulations, the average volume difference shows small values between −4.3 and + 13.8% for the 4 model parameterizations, with standard deviations around 25% (Table 4). These results mirror the visible deviations of the measured and simulated discharge peaks in Figure 6. It is noteworthy that these differences are also visible and are in the same range in the SWMM simulation (Table 3).
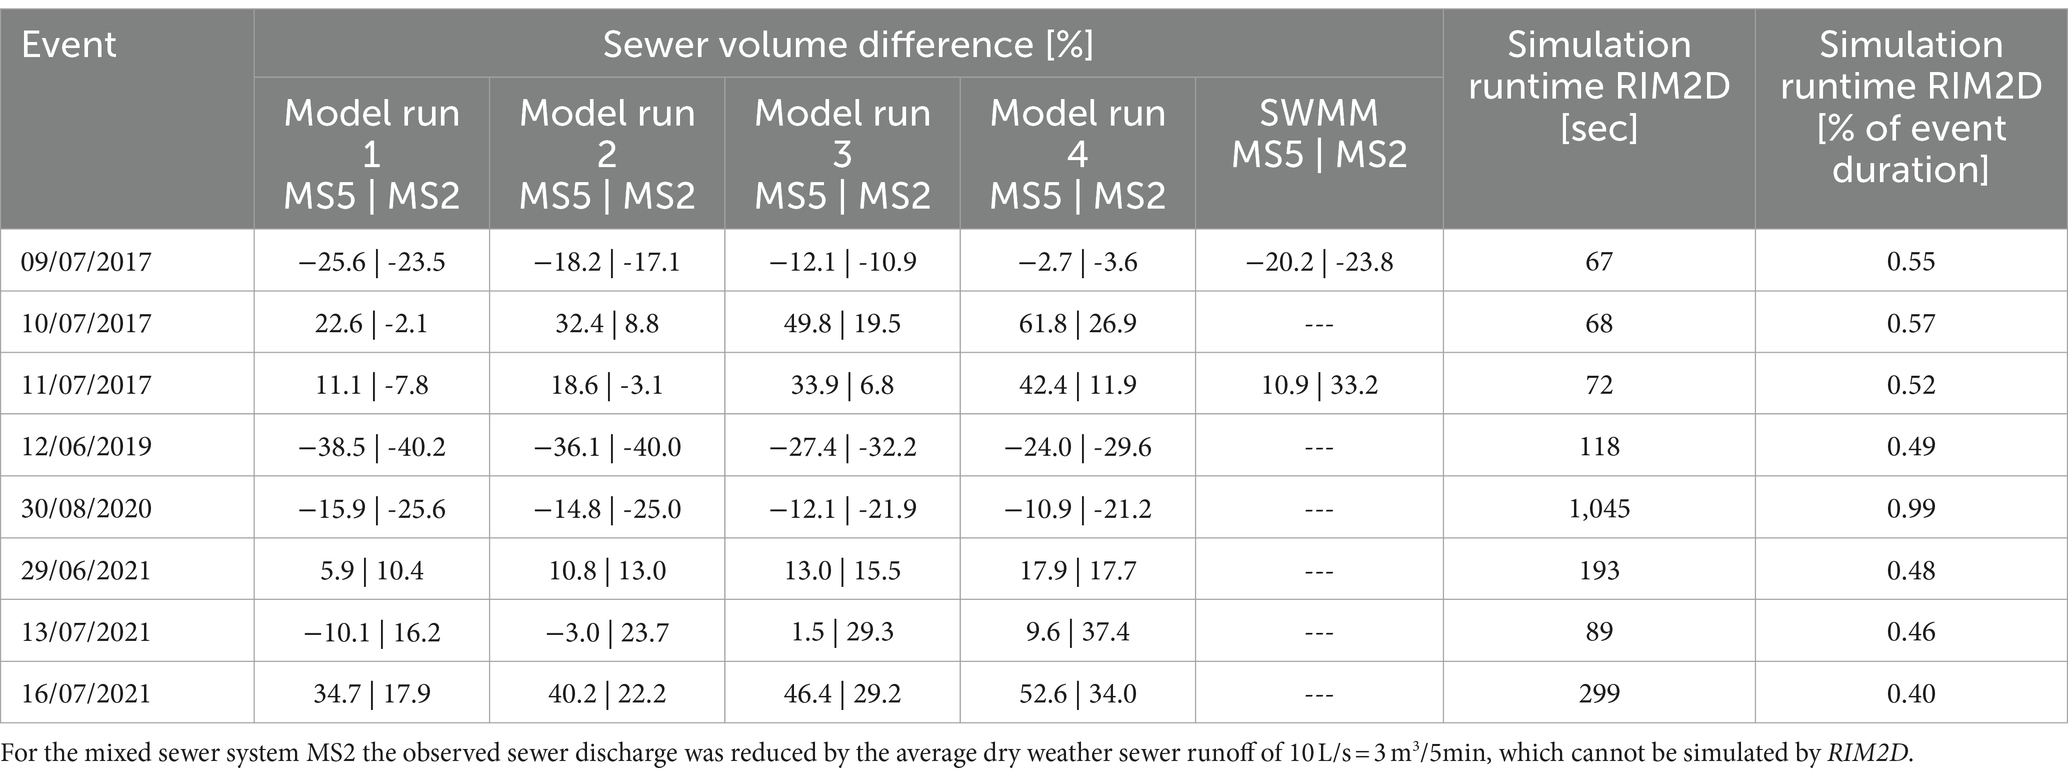
Table 3. Difference between measured and simulated sewer volume per event and runtimes of the RIM2D simulations.
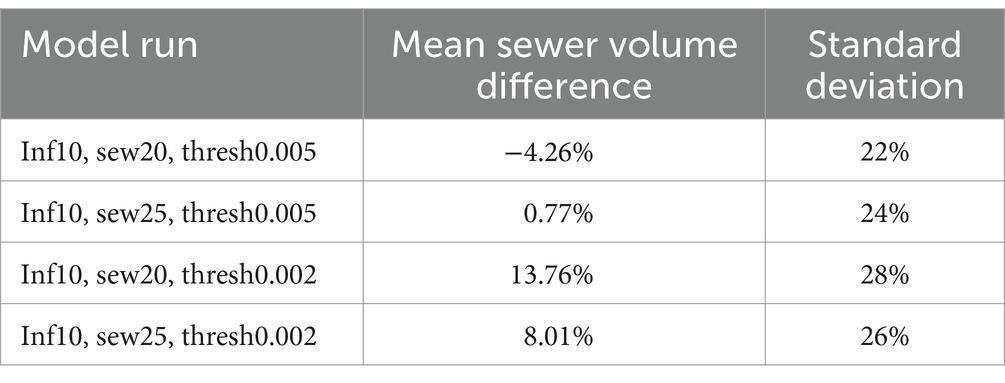
Table 4. Mean difference between measured and simulated sewer volume over all 8 rainfall events.
The observed variations in drainage volumes, which do not show any particular systematic pattern over the simulated events, model parameterizations, and model type lead to the conclusion that the used radar rainfall product is not able to fully resolve the small-scale variability of rainfall intensities that cause the observed sewer dynamics. Thus, considering the uncertainties of the rainfall estimates, in combination with the simplifications of the sewer modeling in RIM2D and the assumed spatially uniform capacities, the good simulation results in terms of sewer volume and temporal dynamics confirm the validity of RIM2D and the model concept and the assumptions taken for urban flood simulations.
Table 3 also lists the model runtimes. For all events the simulation runtimes are less than 1% of the event duration, whereas the different parameterizations had no notable effect on simulation runtimes. This shows that the simulations were more than 100-times faster than the event duration in real time, which is a remarkable simulation speed for hydraulic simulations in an urban area of about 26 km2 and more than 1 million raster cells. For comparison, the SWMM model including the simplified 2D diffusive surface flow propagation (Reyes-Silva et al., 2023) require several minutes computation time. This is in the range of the RIM2D simulations, but a catchment area size 26 times smaller than the whole Lockwitzbach simulation domain (sewer-subsystem MS5 and MS2 only). Models including agent-based intervention measures (Novoa et al., 2023) compute 20–30 min for such events and the area of the sewer subsystem only. Scaling these approaches up to the domain of the RIM2D simulations would results in simulation runtimes no longer suitable for operational flood forecasting.
4 Conclusion
RIM2D is a raster-based GPU-accelerated hydraulic model, with features specifically designed for fast urban flood simulation. This encompasses the representation of buildings as flow obstacles, rainwater storage on roofs and roof drainage, and capacity-based approaches for infiltration on pervious surfaces and for the sewer system draining sealed surfaces. The consideration of sewer drainage is crucial for urban pluvial flooding caused by extreme precipitation events, because it reduces surface inundation in urban areas considerably. Thus, urban flood models have to consider the drainage effect in order to provide plausible and realistic inundation simulation. The typical coupled 2D surface and 1D sewer system modeling approach is, however, computationally too expensive for use in probabilistic flood risk assessments or in operational flood forecasts. The simplified approaches implemented in RIM2D offer an alternative solution compromising between computational speed and consideration of hydraulic details.
The capability of RIM2D to simulate sewer drainage has been extensively tested with a unique dataset providing measurements of sewer discharge during rainfall events in a part of the city of Dresden, Germany. It could be shown that RIM2D is able to capture the general discharge dynamics in the sewer system as well as the drained precipitation volume. This leads to the conclusion, that the capacity-based approach for urban drainage is effective and efficient for plausible urban flood simulations. However, it has to be noted that sewer surcharge and subsequent localized flooding from sewer manholes is not represented in the modeling approach, as the sewer surcharge is simulated as spatially distributed surface inundation. The surface inundation, however, could not be validated due to lacking quantitative information on surface inundation. The detected non-systematic deviations of the simulated sewer discharge in both RIM2D and SWMM simulations imply that, at the presented spatial scale, the quality of the urban pluvial flood simulations is strongly affected by the quality of the rainfall input, and to a lesser extent by the hydraulic model assumptions.
The high computational speed of RIM2D in combination with plausible hydraulic simulations of urban inundation opens the door to applications where simulation runtimes are critical and standard coupled 2D-1D urban hydraulic models with long runtimes cannot be used. One of these use cases is probabilistic flood risk assessments, where large numbers of flood events have to be simulated to capture the probabilistic nature of pluvial floods and integrate the risk over multiple return periods. The currently observed more frequent and intense rain storms require the establishment or re-design of flood risk management plans for practically every city, because pluvial flooding by rain storms can occur everywhere. Moreover, as the likelihood and intensity of rain storms are expected to increase over the next decades, estimations of future pluvial flood hazard and risk should be included in the design of flood management plans. This requires a large number of flood simulations. The simulation speed of RIM2D offers a big advantage for these studies, as it allows for many simulations to be performed in acceptable time.
Another important use case with high relevance is spatially explicit flood forecasting, in which urban inundation is simulated based on operational precipitation forecasts. This kind of flood impact forecasts have recently received a lot of attention in both science and public due to substantial damages and loss of lives in past fluvial and pluvial flood events (Potter et al., 2018; Weyrich et al., 2018; Merz et al., 2020; Fekete and Sandholz, 2021; Apel et al., 2022). For operational flood forecasting, simulation runtimes are decisive, because the lead times, particularly for convective storms, are very short, and thus the flood model has to provide simulation results in short time, as achieved by RIM2D in the presented validation example. RIM2D could thus be used for both pluvial and fluvial or combined fluvial-pluvial flood forecasting, including impacts of floods, as Apel et al. (2022) have already shown the capabilities of RIM2D for operational fluvial flood impact forecasting.
Data availability statement
The validation datasets presented in this study can be found in OPARA, the online data repository of the Technical University of Dresden: http://dx.doi.org/10.25532/OPARA-247. The datasets used for model setup are open source and can be obtained as follows: DEM from the Federal State of Saxony, Germany: https://www.geodaten.sachsen.de/downloadbereich-digitale-hoehenmodelle-4851.html. Surface Sealing from the FederalState of Saxony, Germany: https://luis.sachsen.de/boden/versiegelung.html.
Author contributions
HA: Writing – review & editing, Writing – original draft, Visualization, Validation, Supervision, Software, Methodology, Conceptualization. JB: Writing – review & editing, Investigation, Data curation. BH: Writing – review & editing, Supervision, Project administration, Funding acquisition, Data curation, Conceptualization. SV: Writing – review & editing, Software, Investigation, Funding acquisition. BM: Writing – review & editing, Supervision, Funding acquisition.
Funding
The author(s) declare financial support was received for the research, authorship, and/or publication of this article. The work was funded by the Helmholtz Association through the Helmholtz Initiative on Climate Adaptation and Mitigation (HI-CAM, www.helmholtz-klima.de).
Acknowledgments
The authors would like to acknowledge the support and discussion with the environmental office of the city of Dresden.
Conflict of interest
The authors declare that the research was conducted in the absence of any commercial or financial relationships that could be construed as a potential conflict of interest.
Publisher’s note
All claims expressed in this article are solely those of the authors and do not necessarily represent those of their affiliated organizations, or those of the publisher, the editors and the reviewers. Any product that may be evaluated in this article, or claim that may be made by its manufacturer, is not guaranteed or endorsed by the publisher.
Supplementary material
The Supplementary material for this article can be found online at: https://www.frontiersin.org/articles/10.3389/frwa.2024.1310182/full#supplementary-material
Footnotes
1. ^https://www.geodaten.sachsen.de/downloadbereich-digitale-hoehenmodelle-4851.html
2. ^https://luis.sachsen.de/boden/versiegelung.html
3. ^https://opendata.dwd.de/climate_environment/CDC/grids_germany/5_minutes/radolan/reproc/2017_002/
References
Ali, H., Fowler, H. J., Lenderink, G., Lewis, E., and Pritchard, D. (2021). Consistent large-scale response of hourly extreme precipitation to temperature variation over land. Geophys. Res. Lett. 48:e2020GL090317. doi: 10.1029/2020GL090317
Apel, H., Trepat, O. M., Hung, N. N., Chinh, D. T., Merz, B., and Dung, N. V. (2015). Combined fluvial and pluvial urban flood hazard analysis: method development and application to can Tho City, Mekong Delta, Vietnam. Nat. Hazards Earth Syst. Sci. Discuss. 3, 4967–5013. doi: 10.5194/nhessd-3-4967-2015
Apel, H., Vorogushyn, S., and Merz, B. (2022). Brief communication: impact forecasting could substantially improve the emergency management of deadly floods: case study July 2021 floods in Germany. Nat. Hazards Earth Syst. Sci. 22, 3005–3014. doi: 10.5194/nhess-22-3005-2022
Archer, N. A. L., Bell, R. A., Butcher, A. S., and Bricker, S. H. (2020). Infiltration efficiency and subsurface water processes of a sustainable drainage system and consequences to flood management. J. Flood Risk Manag. 13:e12629. doi: 10.1111/jfr3.12629
Bates, P. D., Horritt, M. S., and Fewtrell, T. J. (2010). A simple inertial formulation of the shallow water equations for efficient two-dimensional flood inundation modelling. J. Hydrol. 387, 33–45. doi: 10.1016/j.jhydrol.2010.03.027
Benisch, J., Wagner, B., Förster, C., Helm, B., Grummt, S., and Krebs, P. (2017). “Application of high-resolution measurement system with hydrodynamic modelling for the integrated quantification of urbanization effects on a creek” in Proceedings of the 14th IWA/IAHR international conference on urban drainage. Prague, Czech Republic.
Berg, P., Moseley, C., and Haerter, J. O. (2013). Strong increase in convective precipitation in response to higher temperatures. Nat. Geosci. 6, 181–185. doi: 10.1038/ngeo1731
Bertsch, R., Glenis, V., and Kilsby, C. (2017). Urban flood simulation using synthetic storm drain networks. Water 9:925. doi: 10.3390/w9120925
Bürger, G., Pfister, A., and Bronstert, A. (2019). Temperature-driven rise in extreme sub-hourly rainfall. J. Clim. 32, 7597–7609. doi: 10.1175/JCLI-D-19-0136.1
de Almeida, G. A. M., and Bates, P. (2013). Applicability of the local inertial approximation of the shallow water equations to flood modeling. Water Resour. Res. 49, 4833–4844. doi: 10.1002/wrcr.20366
Dong, B., Xia, J., Zhou, M., Li, Q., Ahmadian, R., and Falconer, R. A. (2022). Integrated modeling of 2D urban surface and 1D sewer hydrodynamic processes and flood risk assessment of people and vehicles. Sci. Total Environ. 827:154098. doi: 10.1016/j.scitotenv.2022.154098
DWA (2006). “DWA-A 118E - Hydraulic Dimensioning and Verification of Drain and Sewer Systemssche Bemessung und Nachweis von Entwässerungssystemen” in DWA-A 118E. ed. D. G. A. F. Water (Henef, Germany: DWA)
Fekete, A., and Sandholz, S. (2021). Here comes the flood, but not failure? Lessons to learn after the heavy rain and pluvial floods in Germany 2021. Water 13:3016. doi: 10.3390/w13213016
Junghänel, T., Ertel, H., and Deutschländer, T. (2017). "KOSTRA-DWD-2010R - Bericht zur Revision der koordinierten Starkregenregionalisierung und -auswertung des Deutschen Wetterdienstes in der Version 2010 ". (Offenbach am Main: Deutscher Wetterdienst DWD),
Karmakar, S., Sherly, M. A., and Mohanty, M. (2022). “Urban flood risk mapping: a state-of-the-art review on quantification, current practices, and future challenges” in Advances in Urban Design and engineering: perspectives from India. eds. P. Banerji and A. Jana (Singapore: Springer Singapore), 125–156.
Kaspersen, P. S., Høegh Ravn, N., Arnbjerg-Nielsen, K., Madsen, H., and Drews, M. (2017). Comparison of the impacts of urban development and climate change on exposing European cities to pluvial flooding. Hydrol. Earth Syst. Sci. 21, 4131–4147. doi: 10.5194/hess-21-4131-2017
Kotz, M., Levermann, A., and Wenz, L. (2022). The effect of rainfall changes on economic production. Nature 601, 223–227. doi: 10.1038/s41586-021-04283-8
Lee, S., and An, H. (2019). Evaluating the effect of grid size and type in integrated 1D/2D coupled urban inundation modelling on the interacting discharge between the surface and sewerage system. J. Flood Risk Manag. 12:e12537. doi: 10.1111/jfr3.12537
Ludwig, P., Ehmele, F., Franca, M. J., Mohr, S., Caldas-Alvarez, A., Daniell, J. E., et al. (2022). A multi-disciplinary analysis of the exceptional flood event of July 2021 in Central Europe. Part 2: historical context and relation to climate change. Nat. Hazards Earth Syst. Sci. Discuss. 2022, 1–42. doi: 10.5194/nhess-2022-225
Martins, R., Leandro, J., and Djordjević, S. (2018). Influence of sewer network models on urban flood damage assessment based on coupled 1D/2D models. J. Flood Risk Manag. 11, S717–S728. doi: 10.1111/jfr3.12244
Merz, B., Kuhlicke, C., Kunz, M., Pittore, M., Babeyko, A., Bresch, D. N., et al. (2020). Impact forecasting to support emergency Management of Natural Hazards. Rev. Geophys. 58:e2020RG000704. doi: 10.1029/2020RG000704
Mohr, S., Ehret, U., Kunz, M., Ludwig, P., Caldas-Alvarez, A., Daniell, J. E., et al. (2022). A multi-disciplinary analysis of the exceptional flood event of July 2021 in Central Europe. Part 1: event description and analysis. Nat. Hazards Earth Syst. Sci. Discuss. 2022, 1–44. doi: 10.5194/nhess-2022-137
Novoa, D., Reyes-Silva, J. D., Helm, B., and Krebs, P. (2023). Development and demonstration of an interactive tool in an agent-based model for assessing pluvial urban flooding. Water 16. doi: 10.3390/w15040696
Palla, A., Colli, M., Candela, A., Aronica, G. T., and Lanza, L. G. (2018). Pluvial flooding in urban areas: the role of surface drainage efficiency. J. Flood Risk Manag. 11, S663–S676. doi: 10.1111/jfr3.12246
Papalexiou, S. M., and Montanari, A. (2019). Global and regional increase of precipitation extremes under global warming. Water Resour. Res. 55, 4901–4914. doi: 10.1029/2018wr024067
Pham, H. X., Shamseldin, A. Y., and Melville, B. W. (2021). Projection of future extreme precipitation: a robust assessment of downscaled daily precipitation. Nat. Hazards 107, 311–329. doi: 10.1007/s11069-021-04584-1
Potter, S. H., Kreft, P. V., Milojev, P., Noble, C., Montz, B., Dhellemmes, A., et al. (2018). The influence of impact-based severe weather warnings on risk perceptions and intended protective actions. Int. J. Disaster Risk Reduct. 30, 34–43. doi: 10.1016/j.ijdrr.2018.03.031
Rädler, A. T., Groenemeijer, P. H., Faust, E., Sausen, R., and Púčik, T. (2019). Frequency of severe thunderstorms across Europe expected to increase in the 21st century due to rising instability. NPJ Climate Atmospheric Sci. 2:30. doi: 10.1038/s41612-019-0083-7
Ress, L. D., Hung, C.-L. J., and James, L. A. (2020). Impacts of urban drainage systems on stormwater hydrology: rocky branch watershed, Columbia, South Carolina. J. Flood Risk Manag. 13:e12643. doi: 10.1111/jfr3.12643
Reyes-Silva, J. D., Novoa, D., Helm, B., and Krebs, P. (2023). An evaluation framework for urban pluvial flooding based on open-access data. Water 15:46. doi: 10.3390/w15010046
Rossman, L. A. (2015). "Storm Water Management Model, User’s Manual, Version 5.1; U.S. EPA: Cincinnati, OH, USA".),
Rözer, V., Peche, A., Berkhahn, S., Feng, Y., Fuchs, L., Graf, T., et al. (2021). Impact-based forecasting for pluvial floods. Earth's Future 9:2020EF001851. doi: 10.1029/2020EF001851
Rudd, A. C., Kay, A. L., Wells, S. C., Aldridge, T., Cole, S. J., Kendo, E. J., et al. (2020). Investigating potential future changes in surface water flooding hazard and impact. Hydrol. Process. 34, 139–149. doi: 10.1002/hyp.13572
Saadi, M., Furusho-Percot, C., Belleflamme, A., Chen, J. Y., Trömel, S., and Kollet, S. (2023). How uncertain are precipitation and peak flow estimates for the July 2021 flooding event? Nat. Hazards Earth Syst. Sci. 23, 159–177. doi: 10.5194/nhess-23-159-2023
Schleiss, M., Olsson, J., Berg, P., Niemi, T., Kokkonen, T., Thorndahl, S., et al. (2020). The accuracy of weather radar in heavy rain: a comparative study for Denmark, the Netherlands, Finland and Sweden. Hydrol. Earth Syst. Sci. 24, 3157–3188. doi: 10.5194/hess-24-3157-2020
Tellman, B., Sullivan, J. A., Kuhn, C., Kettner, A. J., Doyle, C. S., Brakenridge, G. R., et al. (2021). Satellite imaging reveals increased proportion of population exposed to floods. Nature 596, 80–86. doi: 10.1038/s41586-021-03695-w
Thieken, A. H., Bubeck, P., Heidenreich, A., von Keyserlingk, J., Dillenardt, L., and Otto, A. (2023). Performance of the flood warning system in Germany in July 2021 – insights from affected residents. Nat. Hazards Earth Syst. Sci. 23, 973–990. doi: 10.5194/nhess-23-973-2023
Wagner, B., Reyes-Silva, J. D., Förster, C., Benisch, J., Helm, B., and Krebs, P. (2019). “Automatic calibration approach for multiple rain events in SWMM using Latin hypercube sampling” in New trends in urban drainage modelling. ed. G. Mannina (Springer International Publishing), 435–440.
Wang, W., Chen, W., and Huang, G. (2021). Urban Stormwater modeling with local inertial approximation form of shallow Water equations: a comparative study. Int. J. Disaster Risk Sci. 12, 745–763. doi: 10.1007/s13753-021-00368-0
Keywords: pluvial flood, urban inundation, flood modeling, RIM2D, GPU acceleration, heavy precipitation, urban flood risk, flood forecasting
Citation: Apel H, Benisch J, Helm B, Vorogushyn S and Merz B (2024) Fast urban inundation simulation with RIM2D for flood risk assessment and forecasting. Front. Water. 6:1310182. doi: 10.3389/frwa.2024.1310182
Edited by:
Nathan Barber, Tennessee Valley Authority, United StatesReviewed by:
Elena Ridolfi, Sapienza University of Rome, ItalyNathan Barber, Tennessee Valley Authority, United States
Copyright © 2024 Apel, Benisch, Helm, Vorogushyn and Merz. This is an open-access article distributed under the terms of the Creative Commons Attribution License (CC BY). The use, distribution or reproduction in other forums is permitted, provided the original author(s) and the copyright owner(s) are credited and that the original publication in this journal is cited, in accordance with accepted academic practice. No use, distribution or reproduction is permitted which does not comply with these terms.
*Correspondence: Heiko Apel, heiko.apel@gfz-potsdam.de