 Simon Bée1,2
 André St-Hilaire
- 1INRS, Québec City, QC, Canada
- 2Canadian Rivers Institute, Fredericton, NB, Canada
- 3Department of Biology, University of Prince-Edward-Island, Charlottetown, PE, Canada
The degradation of soils and its detrimental consequences on aquatic environments is an important research topic in agricultural regions such as Prince Edward Island (PEI, Canada). Enhanced information related to suspended sediments in watercourses can serve as an effective decision-making tool in agricultural land management. This study aims to compare flow, suspended sediment concentrations (SSC), and loads using the Soil and Water Assessment Tool (SWAT) in two watersheds in Prince Edward Island (PEI). The final investigations will focus on the potential variations in hydrological and sedimentary values in the future using a relatively pessimistic climate change scenario. Finally, the projected sediment concentrations and loads will be analyzed, considering their potential impacts on ecosystems. Water level and turbidity were recorded using two water level loggers and two optical backscatter sensors (OBS) deployed in the Tuplin Creek and Spring Valley watersheds. These instruments continuously recorded suspended sediments and flow data from June 2021 to September 2022. The data were used to manually calibrate the hydrological and suspended sediment models. The understanding of sediment loads and the benefits of proposed changes to agricultural practices can be tested with the SWAT model, as it incorporates a land use index that varies spatially and temporally. Calibration and validation of both the hydrological and sediment models were satisfactory, with Kling-Gupta Efficiency coefficients varying between 0.51 and 0.73 and Nash-Sutcliffe coefficients varying between 0.61 and 0.73 respectively, indicating successful simulation of both variables in an agricultural context in spite of relatively short calibration and validation periods. Under the selected climate change scenario (RCP 8.5), daily flows and suspended sediment concentrations were simulated until 2,100, showing a slight increase in the average suspended sediment concentration (CSS). For Tuplin Creek, extremely high sediment peaks (>1,500 mg/L) could become significantly more frequent, potentially causing more frequent and severe ecosystem disturbances according to the simulations.
Introduction
Suspended sediments, nitrates, phosphates and pesticides can be dragged in streams by different means such as the erosion from the rain, the wind or the melting snow (FAO and IWMI, 2017). To stay suspended, sediments in the water column need to be subjected to turbulence greater than the settling velocity of the particles. It is the finer part of suspended sediments (typically, ≤63 μm) which are carried on long distances in the river (Asselman, 2000; Church, 2006).
Increased sediment loads in streams is a recurring problem in watershed with bare or agricultural soils, which are vulnerable to water and wind erosion, especially when the natural vegetation cover is absent. In Prince-Edward-Island (PEI, Canada), the mostly sandy soils and sandy silts can be carried into the waterways connected to the land. The consequences of increased sediment loads are then diverse, but can include decline of the aquatic diversity, silting up of rivers, transport of pollutants to the ocean (Ockenden et al., 2012), etc. Fine sediment deposition can also have an impact on spawning and egg deposition for salmonids and thus reduce the hatching rate of brook trout (Salvelinus fontinalis; Alberto et al., 2017) or Atlantic salmon (Salmo salar; Levasseur et al., 2006), which are species that are found in PEI. Highly turbid rivers can therefore suffer from relatively low fish abundance compared to more pristine systems (Henley et al., 2000; Guignion et al., 2019).
Moreover, suspended sediments end up in estuaries where they can also have negative impacts on these fragile ecosystems. The impacts are multiple and result in different harmful effects such decrease in light penetration leading to seagrass loss, macroalgal and phytoplankton decline, etc. (Deeley and Paling, 1998). There are also various risks for aquatic species, such as lower growth and nutritional status of juvenile fish, which may potentially lead to increased vulnerability to predation, physiological stress, and disease (Newcombe and Jensen, 1996). Fish can suffer from increase in turbidity. Predation becomes more difficult in highly turbid environments (Higham et al., 2015; Abrahams et al., 2017). Also, estuarine planktivorous fish find it more difficult to feed in a turbid environment, in particular because of the low luminosity which will cause a decrease in primary production (Bruton, 1985).
Agricultural practices are a known source of sediments. Certain types of plowing, soil treatment or fallowing can lead to increased sediment input into the water during rainfall events (Blevins et al., 1990). These threats to the environment can be quantified using in situ measurements in order to estimate the quantities of soil lost and suspended sediments ending up in the river (Alberto et al., 2016). Measurements can be made using turbidity probes calibrated with NTU standards and be associated to flow measurement to estimate loads. Optical backscatter (OBS) sensors (Sirabahenda et al., 2019), and more recently acoustic backscatter sensors, are indirect monitoring techniques suitable for continuous monitoring that is essential for a temporarily high variable like SSC. Modeling is an additional predictive tool to assess at any time and in any place the quantities of SSC in water according to land use and meteorological variability. There is still a need to better understand the functional relationships between the variables that most affect sediment dynamics.
The estimation of future sediment yield is crucial for the planning of mitigation actions. Evaluating the impacts of climate and land use transformations on sediment yield is important for formulating effective strategies and policies to manage water resources. A number of models have been used to estimate sediment concentrations and loads in rivers. Soft computing methods such as Artificial Neural networks, Gene expression programming and Adaptive Neuro-Fuzzy Inference systems have been used successfully (Kisi and Shiri, 2012; Roushangar et al., 2014; Sirabahenda et al., 2017; Yavari et al., 2018). However, relatively few studies have focused on generating past trends and future scenarios for suspended sediment concentrations and loads, compared to those focusing on river flows or temperature. Syvitski et al. (2005) have shown that the global sediment flux decreased in past decades because of retention in reservoirs. Modeling studies (using SWAT) have investigated present and future SSC (Shrestha S. et al., 2018; Shrestha B. et al., 2018; Bhatta et al., 2019, 2020). They showed the link between land use change and future sediment trends. Ficklin et al. (2009) have concluded that human actions on land use have a predominant impact on the decrease of sediment yields. Other research (Zhou et al., 2017; Pandey et al., 2021) provide evidence of a possible significant decline in suspended sediment concentrations in the future, mainly related to human interventions on land use and to regional climate change.
On Prince Edward Island, impacts of agriculture have been studied in recent years on some watersheds using models specially designed for the study of sediment concentrations and loads (Dunn et al., 2011; Sirabahenda et al., 2017). However, none of the recent studies have investigated the potential impacts of climate change on sediment concentrations and loads in fish-bearing streams. The only recent studies related to climate change in the region focused on the coastal impacts of sea level rise (Richards and Daigle, 2015), changes in rainfall (Bhatti et al., 2021) and water availability (Bhatti et al., 2022). The present study provides the first sediment-related scenarios associated with climate change in PEI.
The Tuplin Creek and Spring Valley sub-watersheds have yet to be studied. They both flow directly into the Southwest Estuary (Figure 1). The land use on the drainage basins is heavily dominated by intensive potato agriculture. This intensive agricultural activity impact soils vulnerability to erosion and therefore may lead to concerns related to water quality downstream (Coffin et al., 2018). Continuous monitoring of sediments is recommended to help authorities make informed decisions (Alberto et al., 2016), and aims to help farmers in their efforts to reduce the impact of agriculture on rivers. When monitoring cannot be adequately or consistently performed, models can be of great help to make informed decisions related to land use management.

Figure 1. Locations of the two studied watersheds in PEI (Canada).
SWAT is a model used to simulate flows and water quality (Neitsch et al., 2011). The model can account for various types of agricultural practices and land use. In the case of this study, the focus is on suspended sediments in two small watersheds on Prince Edward Island. SWAT has been used to assess the impact of the changing climate on sediments in many regions of the world, including Iran (Azari et al., 2016), India (Nilawar and waikar, 2018), Thailand (Shrestha et al., 2022) and China (Ma et al., 2021).
The objective of this study is to verify the adequacy of the SWAT model to generate flow and SSC projections in the two aforementioned agricultural watersheds on PEI. The first specific objective is to calibrate and validate the hydrological and sediment modules of SWAT and validate the model performance with the most appropriate statistical indicators. The second objective will be to compare simulated flows and sediment loads for the two watersheds. The third objective is to generate climate change scenarios for discharge and sediments with a relatively pessimistic green-house gas emission scenario (RCP 8.5) to generate future hydrological and sediment scenarios for the 2,100 horizon. The purpose of the simulation is to get a glimpse of what the future sedimentary trends could be in these agriculture-dominated watersheds. Future river ecosystem vulnerability will be examined by investigating the frequency of very high SSC events which are known to generate stress to aquatic fauna.
Methods
SWAT: model description
SWAT is a semi-distributed physical-based conceptual agro-hydrological model, which simulates the hydrological processes of a watershed continuously at a daily time step and in a more recent version, at an hourly time step. SWAT is coupled with the ARCGIS-ArcView extension, a geographic information system called ARCSWAT (Arnold et al., 2012, ArcSWAT 2012.10.5.1).1 The hydrological module has two main components. First, sub-watershed and hydrologic response units (HRU) must be defined and then, a water budget is computed. The HRU daily water balance considers precipitation, irrigation, evapotranspiration, surface runoff, lateral flow and percolation to shallow and/or deep aquifers. The model requires several input data. First, the watershed boundaries are defined according to the digital elevation model. The finer scale is the sub-watershed, which will be defined according to the topography and the hydrographic network. The most precise geographical level of data is the Hydrological Response Units (HRUs), which are areas with relatively homogenous physiographic characteristics such as slope, pedology and land cover. They are created by the superposition of all hydrological and soil layers. These are conceptual units useful for modeling.
The model is based on physical processes and can simulate among other variables: flows, groundwater levels, crop/vegetation growth, erosion, lateral flows, and sediments, as well as the environmental impact of land management practices. Various agricultural practices can be simulated, such as fertilizer and manure spreading, tillage, irrigation, tile drainage, riparian buffer strips filtering, as well as water storage in wetlands and ponds.
Required data include the digital elevation model (DEM; from the PEI Department of Environment, Energy & Forestry, Forests, Fish & Wildlife, 2000, 2000 Orthomap Index), the hydrographic network layer, the land use (PEI Department of Environment, Energy & Forestry, Resource Inventory, 2010) and soil types layer (Research Branch Agriculture Canada/PEI Department of Agriculture, 1994, Soil Survey of PEI) and finally the characteristics of the slopes that will be generated by the software. The DEM is at a resolution of 1.5 m.
Geographical Information System layers, along with their resolution and sources are summarize in Table 1. Meteorological input data include precipitation, wind speed, air temperature, solar radiation and relative humidity, also summarized in Table 1.
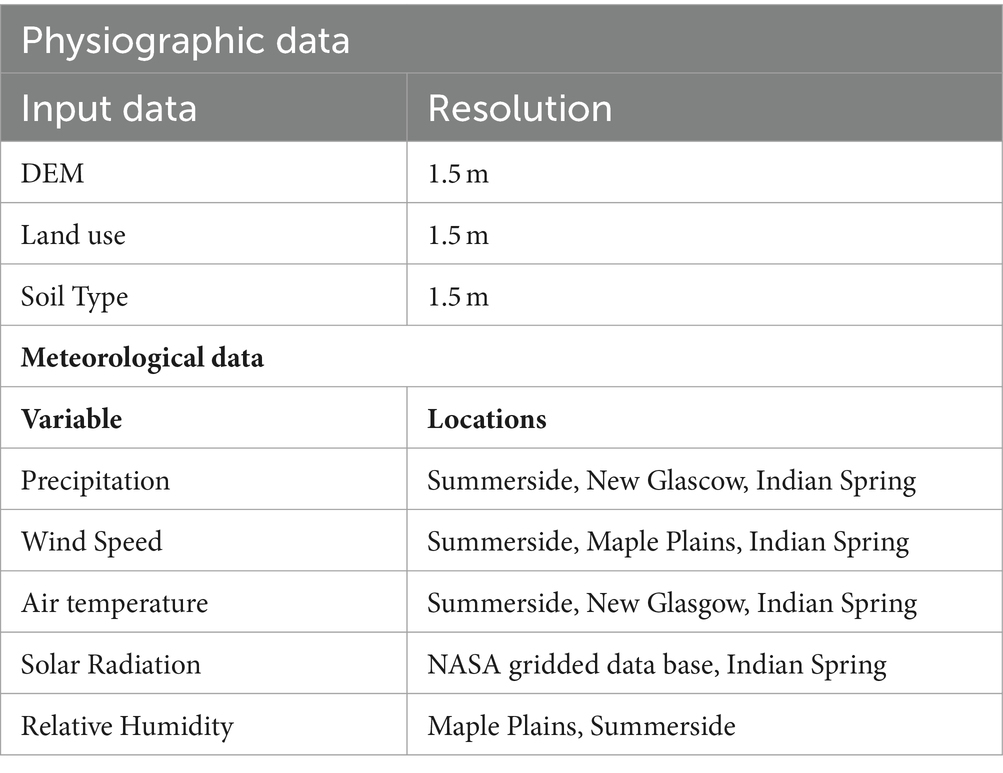
Table 1. Source and resolution of input SWAT layers.
The hydrological module in SWAT computes a water budget on each HRU. This budget accounts for canopy interception, surface runoff, infiltration and evapotranspiration. The hydrological module also has a snowmelt routine that is based on the difference between the snowpack temperature and the maximum daily air temperature. The Soil Conservation Service curve number equation is used to estimate surface runoff. Within the soil layers, SWAT redistributes water into deep percolation, return flow from shallow aquifer and subsurface lateral flow (Neitsch et al., 2011). In this study the Penman-Monteith model was used to estimate crop evapotranspiration. It considers various parameters such as air temperature, relative humidity, wind speed, atmospheric pressure, day length, crop height and stomatal resistance of the crops.
The sediment module in SWAT uses the Modified Universal Soil Loss Equation (MUSLE; Gassman et al., 2014) for modeling sediment erosion (Qi et al., 2015). The MUSLE makes it possible to determine the sediment transport associated with each individual storm event. The most critical erodibility conditions are typically reached during the month of April due to the freeze–thaw period (Edwards, 2013).
The equation was developed for small areas but has proven effective for catchments up to 234 km2 (Williams and Hann, 1976). It is defined in Equation 1 as follows:
With
Sed = sediment flux in (t/day).
Qsurf = surface runoff volume (in mm/ha).
qp = peak runoff rate (m3/s).
AreaHRU = area of the HRU (ha).
KUSLE = soil erodibility factor (tonne.m2.h/m3.tonne.cm).
𝐶𝑈𝑆𝐿𝐸 = the crop/vegetation and management factor.
𝑃𝑈𝑆𝐿𝐸 = the Support and Retention Practice Factor.
𝐿𝑆𝑈𝑆𝐿𝐸 = the length and steepness factor of the slope.
𝐶𝐹𝑅𝐺 = the raw fragmentation factor which is a function of the percentage of rock fragments [CFRG = exp.(−0.053 rock)].
The SWAT manual provides a more in-depth description of the model.2
Model performance indicators
Both hydrological and sediment modules calibration for the two watersheds were completed using observations from June to December 2021. Model performance was assessed with a number of performance statistics criteria: the Nash Sutcliff coefficient (NSE: Nash and Sutcliffe, 1970), the Kling Gupta efficiency (KGE; Gupta et al., 2009) and the relative bias (PBIAS). All three statistical metrics were recommended by Moriasi et al. (2007).
The NSE index is calculated using Equation 2:
• observed represents the observed flow (m3/s) or suspended sediment (mg/L) values;
• simulated represents the simulated flow (m3/s) or suspended sediment (mg/L) values;
• observed_mean is the mean of observed flow (m3/s)or suspended sediment (mg/L) values.
A value of 1 indicates a perfect fit, while values less than 0.5 indicate poor performance. A NSE value below 0 indicates poorer performance compared to a reference model based on the mean of observations. NSE has several advantages including its sensitivity to both the bias and variability of the model, its ability to handle negative and positive errors equally, and its suitability for comparing models of different scales. However, given that Equation (2) uses squared error, it tends to emphasize model errors in the high range of observed values.
The second performance criterion is the Kling Gupta Efficiency (KGE) developed by Gupta et al. (2009) to provide a diagnostically interesting alternative to the Nash-Sutcliffe efficiency, by facilitating the analysis of the relative importance of different error components (correlation, bias and variability) in the context of hydrological modeling Kling et al. (2012), proposed a revised version of this index (Equation 3), to ensure that the bias and variability ratios are not cross-correlated:
• r represents the correlation coefficient between observed and simulated values;
• α represents the ratio of the standard deviation of observed values to the standard deviation of simulated values;
• β represents the ratio of the mean of observed values to the mean of simulated values.
A value of 1 indicates a perfect fit between observed and modeled values, while values closer to 0 indicate poorer performance, albeit better than using the mean as a model. Given that the KGE index incorporates three components: correlation, bias, and variability, it allows for a comprehensive evaluation of model accuracy.
The relative bias PBIAS (Equation 4) is a measure of the average difference between modeled and observed values, expressed as a percentage of the mean observed value:
The result is a relative measure that indicates the degree of overestimation or underestimation of the predicted value compared to the observed value. By multiplying this result by 100, the relative bias is in percentage (PBIAS henceforth).
Study watershed
Prince Edward Island is located in the Gulf of St. Lawrence. The island has an area of 5,660 km2. Approximately 42.5% of the total land area (240.514 ha) in Prince Edward Island is dedicated to farming. A significant portion of this agricultural land, around 35,378 ha, is specifically utilized for potato cultivation (Adekanmbi et al., 2023). The soil is composed of sand and clay, with some outcrops of sedimentary rocks, usually sandstone or shale.
Two small agricultural watersheds have been chosen for this study: Tuplin Creek (7.54 km2) and Spring Valley (23.57 km2), they are emptying into the Southwest Estuary near the center of PEI. In addition to potato crops, some agricultural lands are used for pasture. Both watersheds are characterized by relatively low flows.
Land cover, morphology and slopes of the watersheds are presented in Table 2. Soil types are dominated by a sandy loam texture. Two soil types are predominant on the two watersheds, Albery with a moderate drainage ratio and Charlottetown, which is a well-drained soil [Agriculture and Agri-Food Canada (AAFC)].3

Table 2. SWAT model inputs, soil and land use characteristics.
The climate is considered as moderate maritime climate influenced by the surrounding seas. The average air temperature is −7°C in January and 19°C in July. The average annual temperature is 6.5°C °C in Summerside (17 kilometers from the watersheds). The island has one of the most variable daily climates in Canada. The average rainfall near the stations is 855 mm of rain and 285 mm of snow (Summerside station).
Figure 2 show the geographic location of the two studied watersheds, with meteorological station locations. They are part of multiple small littoral watershed complex, they flow into an estuary called the Southwest River estuary flowing northeastward, emptying into the Atlantic Ocean.
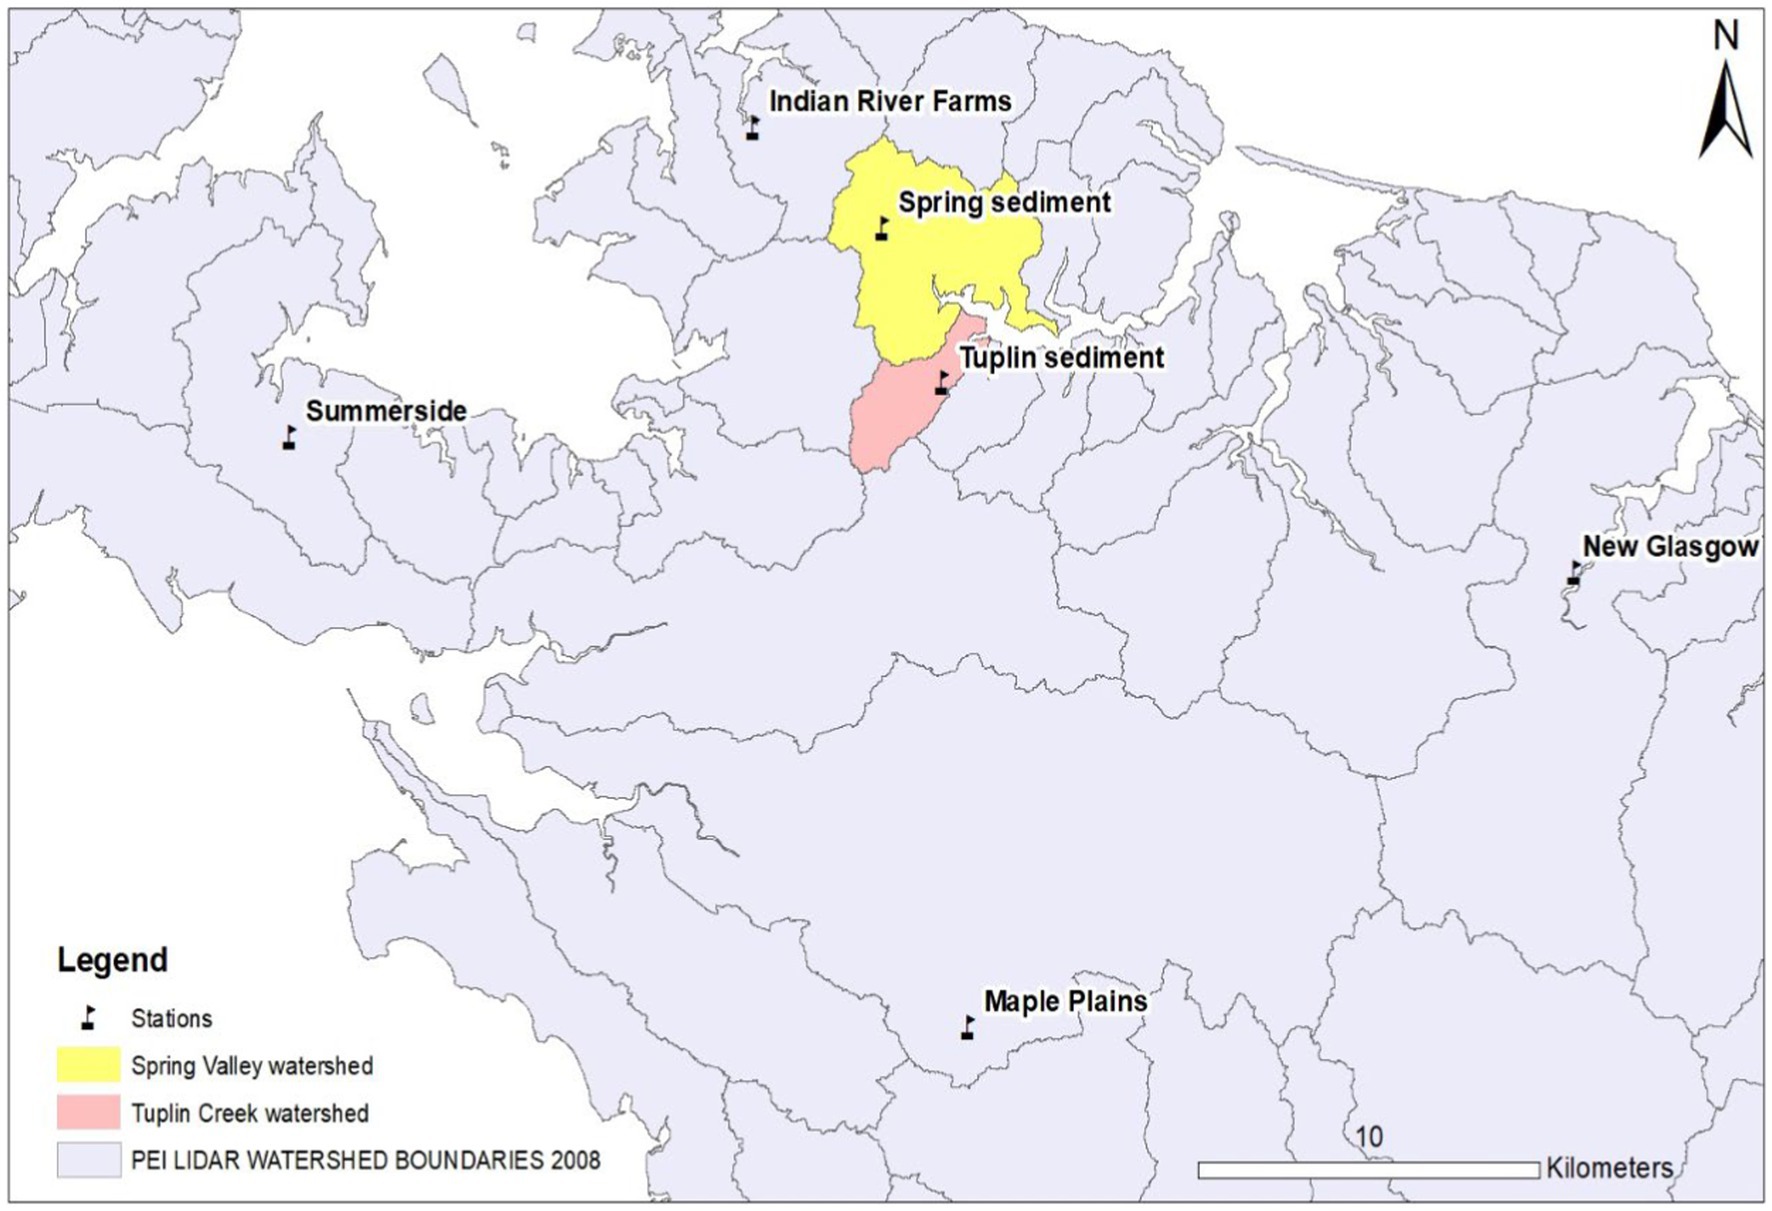
Figure 2. Watersheds and meteorological station locations.
The drainage area at location of suspended sediment and water level measurement probes is 5.13 km2 for Tuplin Creek and 2.82 km2 for Spring Valley (Figure 3). The reason for deploying the probes in the upstream section of the drainage basin is to ensure that they were not influenced by tides, which propagate far upstream in these systems. Multiple subbasins (21 for Tuplin Creek and 7 for Spring Valley) are included in the modeled drained areas. Elevations vary between 0 and 60 m for Tuplin Creek with an average elevation of 27.4 m and between 0 and 100.5 m with an average elevation of 31.1 m for Spring Valley.
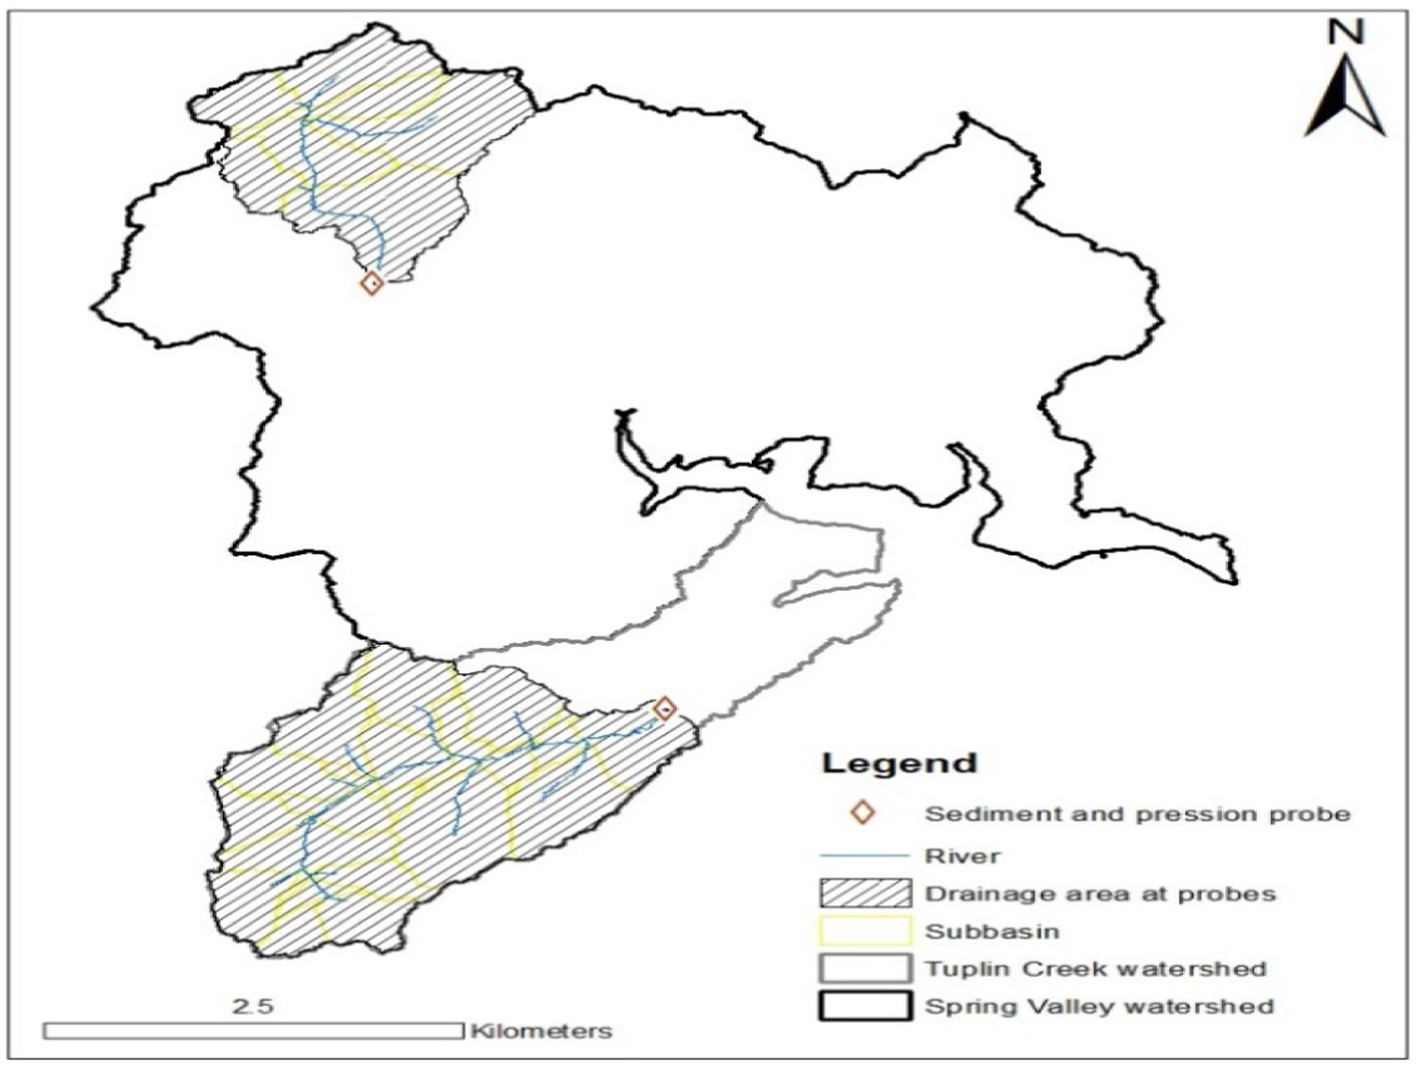
Figure 3. Hydrometric and sediment sensors locations, with drained area.
Streamflow and turbidity data collection
For turbidity, Eureka Manta2 sensors (Water Quality Instrumentation | Eureka Water Probes range: 0 to 3,000 NTU linearity: ±1% of FS below 1,000 NTU, ±3% of FS between 1,000 and 3,000) and for pressure, Onset HOBO Water Level [HOBO 30-Foot Depth Water Level Data Logger | Onset's HOBO and InTemp Data Loggers (onsetcomp.com) Logger ± 0.3% FS, 0.62 kPa (0.09 psi) maximum error] were installed in the two watersheds. The Eureka turbidity sensor measures the reflectance from near infrared in the water column of suspended in nephelometric turbidity units (NTU). The measurement frequency was every 30 min.
To convert NTU to suspended sediment concentrations (SSC, mg/L), calibration curves were constructed by collecting grab sample from mixtures of in situ water and streambed surface sediment and passed through 63 μm sieves. The sieved fine sediments were placed in a bucket with stream water at various concentrations and stirred constantly. Turbidity of the solution was measured in NTU and a grab sample was taken. This sample was filtered, and the dry weight measured to link NTU and SSC (mg/l). The use of the <63 μm fraction was found to best simulate instantaneous samples collected during rain events (Pavey et al., 2007; Alberto et al., 2016). The detailed description of the calibration method is given in Sirabahenda et al. (2017).
Stream discharge was measured manually during high and low flow events with a Marsh-McBirney Flow-Mate 2000 velocity meter every 15 days on average to construct a stage-discharge rating curve.
The meteorological data come from meteorological stations located relatively close to the two watersheds (Figure 1). The required input data include wind, solar radiation, temperature and precipitation. The relative humidity data were retrieved from the Summerside station operated Environment Canada4 located 16 km from the watersheds of the study.
Model hydrological calibration and validation
Calibration was done manually (Neitsch et al., 2009) and using daily data (from June 2021 to December 2021). Manual calibration was done to adjust the model parameters using trial and error until the model performance is satisfactory. Parameters had to be adjusted based on their sensitivity to model output, and then manually change to improve the model fit to the observed data. It remains a reliable technique for improving model accuracy, particularly in watersheds with limited observed data or high complexity. Validation of the hydrological model focused on the period from December 2021 to June 2022.
For the hydrological module, the model parameters associated with surface runoff were first modified to resemble reality as closely as possible. Subsequently, the soil evaporation compensation factor (ESCO) parameter was set and finally soil water available capacity (AWC) parameter was adjusted. Then, the values of the groundwater parameters were modified. First of all the groundwater movement coefficient in unsaturated zones (GW revap), the aquifer recharge delay, which depends on its geomorphology (GW delay), the base flow, directly related to aquifer recharge rate (alpha bff day) and aquifer depth threshold required for return flow (GWQMN). Finally, other parameters related to the minimum and maximum melting rates (SMFMX and SMFMN), the hydraulic conductivity of the river (CH_K), the hardness coefficient of the channel and the alpha factor of the base flow (ALPHA_BF) were adjusted for the calibration of the hydrological module of SWAT.
Results of the SWAT calibration and validation are presented in Figure 4. These results show a low number of high discharge peaks throughout the short study period. Only one significant flow peak (but still <1m3/s) was observed in both watersheds, occurring on February 17 during a rainfall event of 40 mm. The two watersheds exhibit similar behaviors and hydrological variations in their curves and flows. The model is effective in simulating peaks, but certain periods where the base flow is significant, such as from April to June 2022, are simulated less perfectly. The model appears to underestimate base flow during the spring part of the validation (Figure 4).
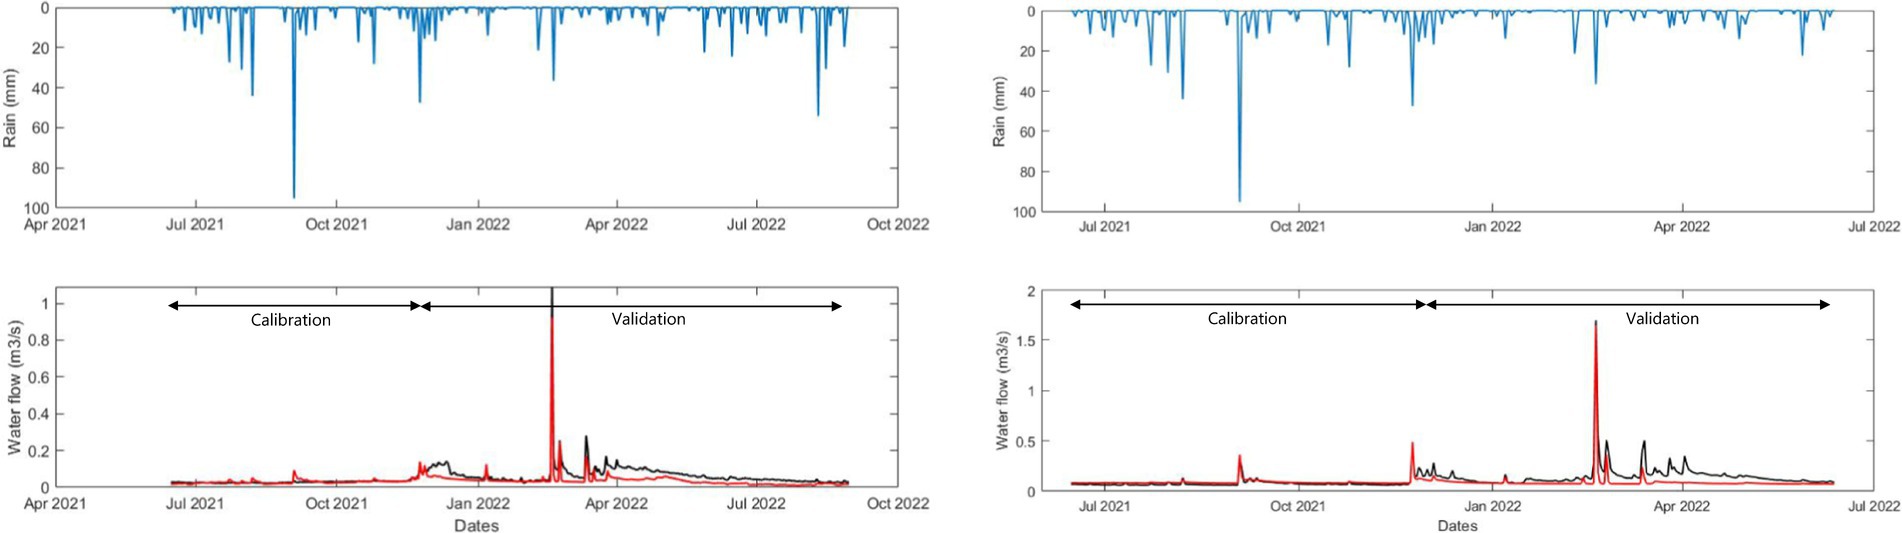
Figure 4. Calibration and validation of discharge using SWAT model for Tuplin Creek and Spring Valley compare with precipitation data.
Sediment module calibration and validation
The calibration of the sediment module was completed after to the calibration of the hydrological model and takes into account the modification of various parameters. The parameters relating to the slopes were first changed in order to reflect reality: first the slopes of the HRUs with (SLOPE) and then the slope length factor (SLSUBBSN). Parameters related to crops in both watersheds include the agricultural practice factor (USLE_C) and the agricultural management factor (USLE_P). Then come the factors related to channel routing, including the erodibility of the riverbed (CH_EROD) and that expressing the deposition of sediments (CH_COV). The linear and exponential coefficient values of sediment re-entrainment (SPEXP and SPCON) were finally modified to adjust the calibration. The calibration of the sediment part was successfully carried out with statistical results making it possible to proceed to the validation stage.
Results are presented in Figure 5. Calibration and validation have been made during relatively short periods (approximately 6 month each) for the 2 watersheds. For the calibration period, NSE values for the two basins were 0.54 (Tuplin) and 0.71 (Spring Valley), while KGE values were 0.72 and 0.74, respectively. For the validation period, NSE values were 0.61 (Tuplin) and 0.71 (Spring Valley) while KGE values were 0.51 and 0.57, respectively.
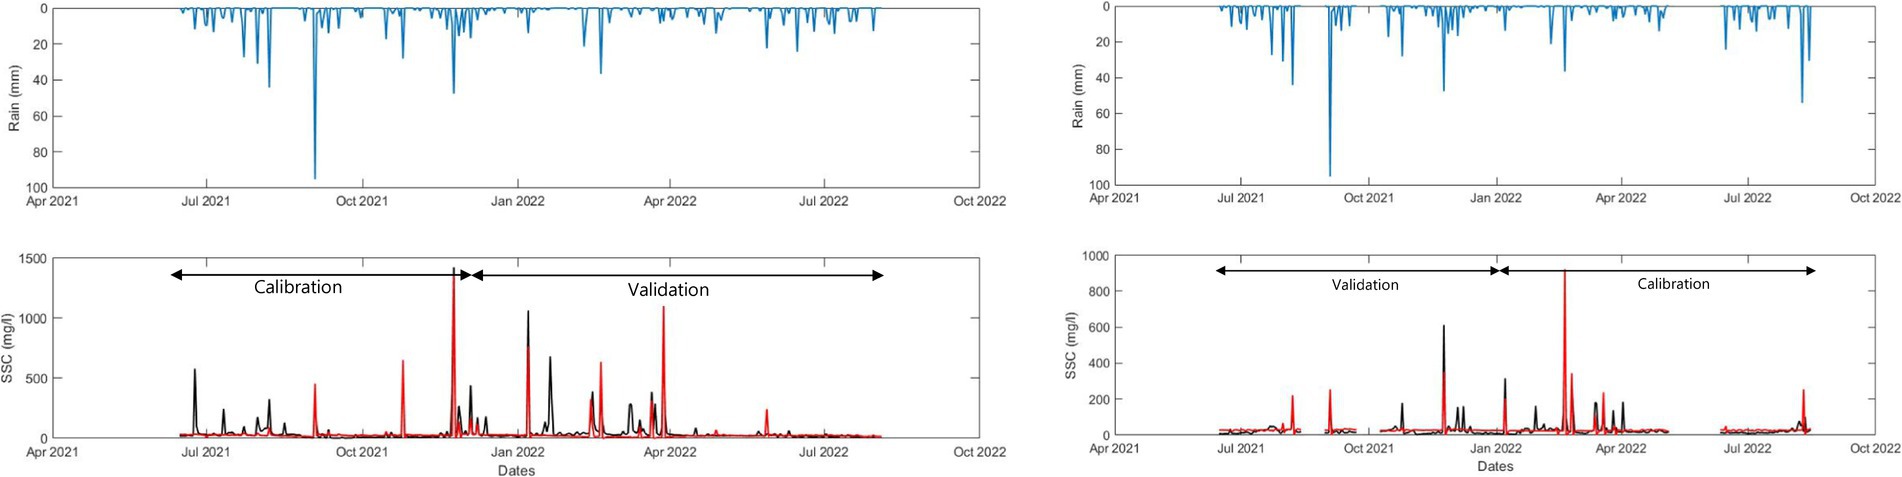
Figure 5. Calibration and validation of SSC using SWAT model for Tuplin Creek and Spring Valley compared with precipitation data.
The results of calibration and validation show the efficiency of the model in simulating most of the sediment peaks. Suspended sediment peaks are related to rainfall events, although the most intense rainfall does not necessarily result in the largest suspended sediment peaks. Some peaks for the Tuplin Creek watershed are not simulated by the model, such as the mid-January peak where concentrations over 600 mg/L are not captured by the model. Additionally, this peak occurs without equivalent in terms of rainfall events.
For the Spring Valley watershed, most of the suspended sediment peaks are correctly simulated. However, some periods had to be removed due to malfunctions of the measurement probes. Indeed, the probes were buried by sediments deposited on the sensors and prevented the optical reading of suspended sediments. Performance measures were therefore used on periods not impacted by probe burial.
Climate change scenario
The potential impact that climate change could have on hydrology and suspended sediment concentration was investigated in this study. The choice was made for the RCP 8.5 climate change scenario. It assumes that greenhouse gas emissions will rise without significant efforts to reduce emissions, and radiative forcing will reach or exceed 8.5 w/m2 by 2,100 [Intergovernmental Panel on Climate Change (IPCC), 2019]. The reasons for selecting this scenario are that: (1) it has been often used in climate change studies as the “business as usual scenario” [including those of Nilawar and Waikar (2018) and Shrestha et al. (2022) that focus on stream sediments], and (2) it is the IPCC scenario that projects the highest amount of greenhouse gas emission over the next 100 years. The analysis was performed based on three different time horizons: near future (2023–2050), middle future 2050s (2050–2075), and far future 2,100 s (2075–2,100).
This constantly increasing concentration until the end of the century will lead to significant global warming. The forecasts indicate a possible increase in surface temperature of 4.5°C to 6°C compared to the pre-industrial era. Climate change can have radically different impacts depending on the region of the globe which implies geographically targeted studies of future environmental consequences all over the globe. RCP 8.5 scenario is just one possible future pathway for greenhouse gas emissions and climate change, efforts to reduce greenhouse gas emissions could result in a different future climate outcome.
Future meteorological data required to construct the hydrological and suspended sediment projections were retrieved from the Coordinated Regional Climate Downscaling Experiment (CORDEX), which are available through the Earth System Grid Federation (ESGF) nodes.5 The selected model was CanRCM4, which is a regional climate model which dynamically downscales the global climate information generated by the second-generation Canadian Earth System Model (CanESM2). CanESM2 is a Global climate model (GCM) developed by the Canadian Centre for Climate Modeling and Analysis (CCCMA) of Environment and Climate Change Canada.
In the case of Prince Edward Island, according to the RCP 8.5 climate change scenario, it would appear that the increase in temperatures (Figure 6) will continue until the end of the century. Average high and average low temperatures could see an increase of 5°C to 6°C by 2,100 (Figure 6). Another forecast (Bhatti et al., 2022) indicates an increase in average temperature in the center of Prince Edward Island of up to 8°C by 2050 and 11°C by 2080.
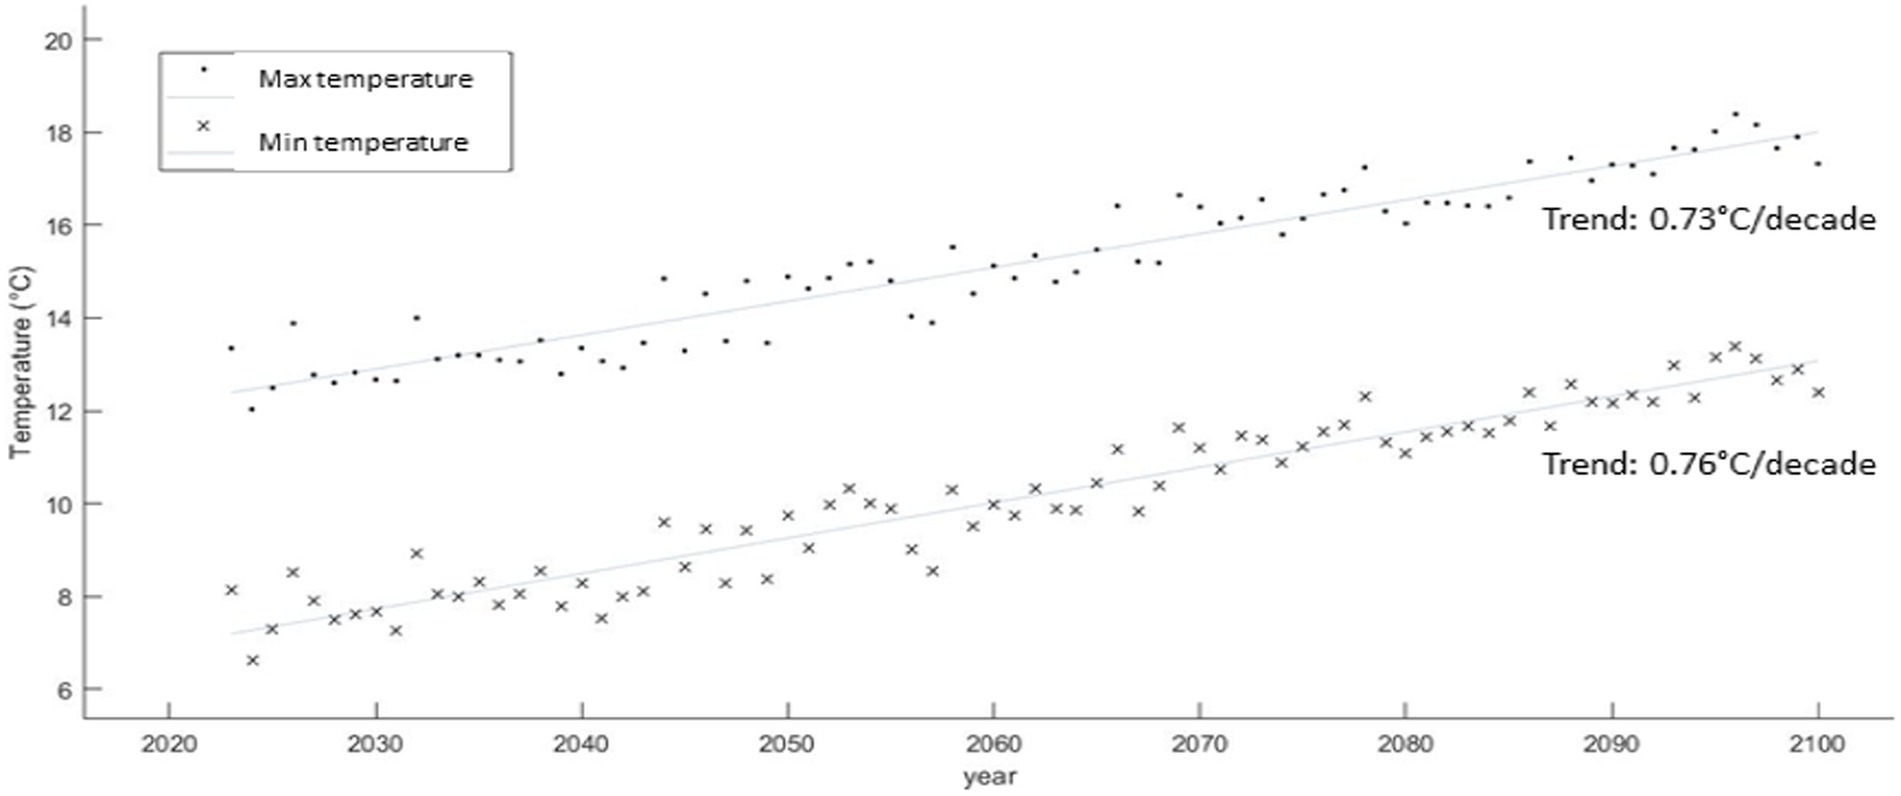
Figure 6. Temperature data generated from CanESM2-RCP 8.5 scenario until 2,100, average maximum and minimum temperature trends.
The Mann-Kendall trend test was used to confirm that temperature trends in this scenario are significant. This is also the case for precipitation (Figure 7). Total annual precipitation could from 1,141 mm (1991–2020) compared to 1,192 mm in the future (2051–2080) per month (Bhatti et al., 2022). This is a weak trend. The distribution of precipitation over the year will indicate an increase in precipitation in the months of February, March and April, and therefore more solid precipitation. More frequent mild spells would impact the possibility of accumulation of snow cover, with more frequent episodes of melting. This would also indicate a possible increase in soil erosion due to these more frequent melting phenomena (Edwards et al., 1998, 2013). Other projections (Maqsood, 2021) show that a vast majority of PEI stations will see a decrease in average annual precipitation.
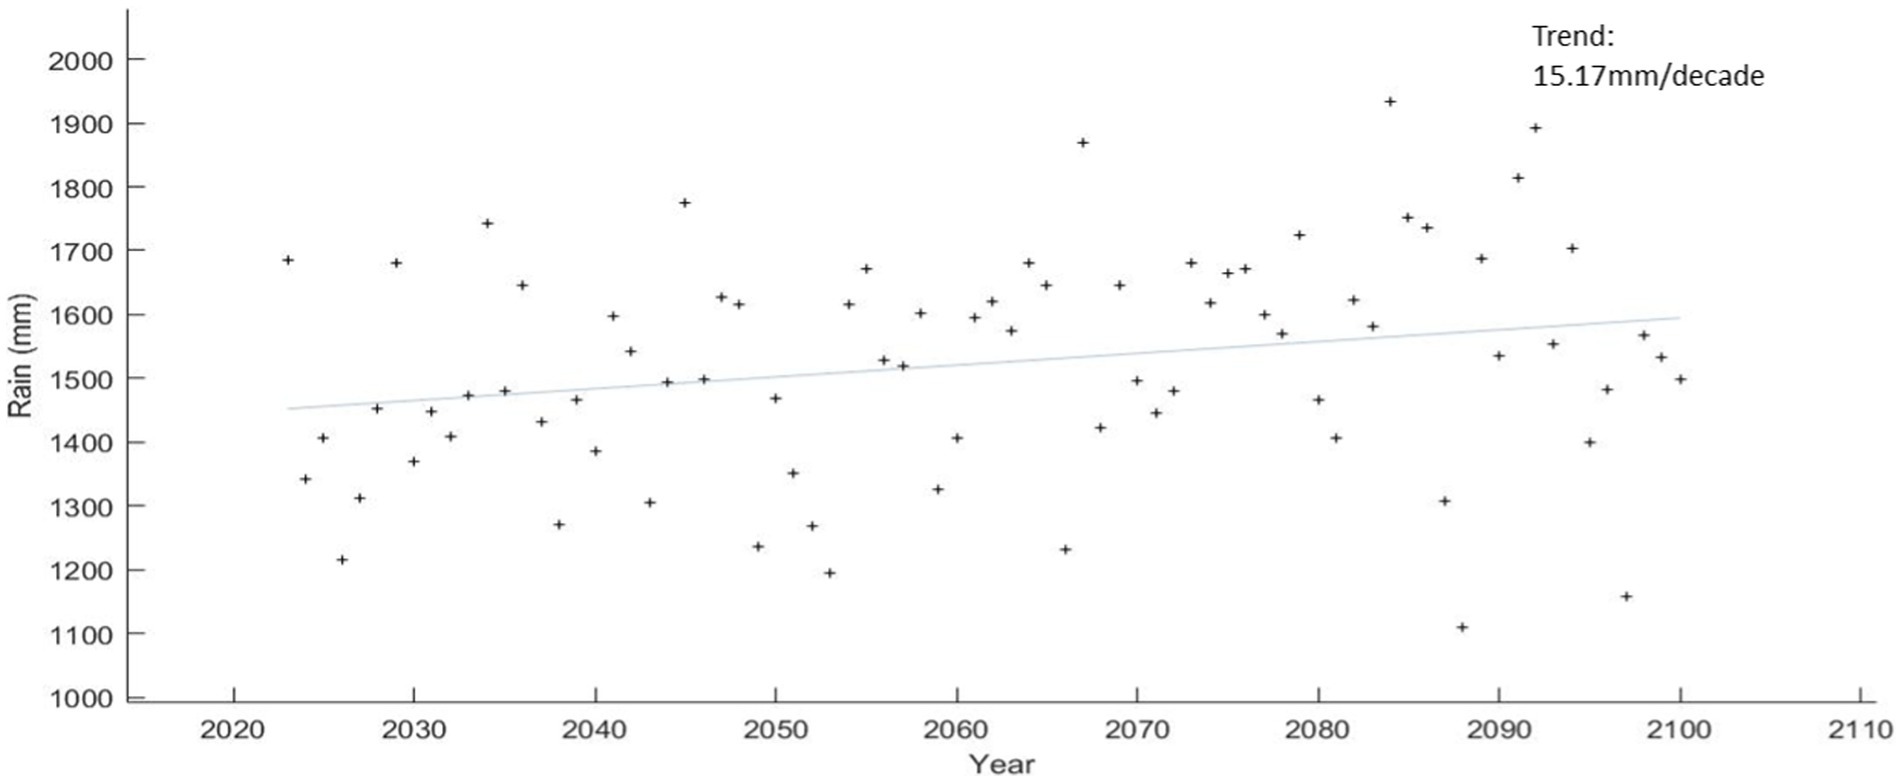
Figure 7. Precipitation data generated from CanESM2-RCP 8.5 scenario until 2,100.
Results
Performance criteria for calibration and validation (Table 3) of SWAT simulated data show the effectiveness of the model in simulating hydrological and sedimentary values, with validation values greater than 0.5 for both NSE and KGE. Hydrological calibration and validation were performed with only one significant peak flow event, and therefore the performance measures are inherently linked to the simulation of this peak. This is due to the short period for implementing model calibration and validation. The mismatch between extreme rainfall events and the most significant peak flows could be due to antecedent conditions in the watersheds. Meteorology alone is not solely responsible for the highest flow increases. Depending on the physical properties of the soils including antecedent soil moisture, a significant amount of rainfall can be retained in the soil (Tramblay et al., 2010), without direct runoff into the rivers.
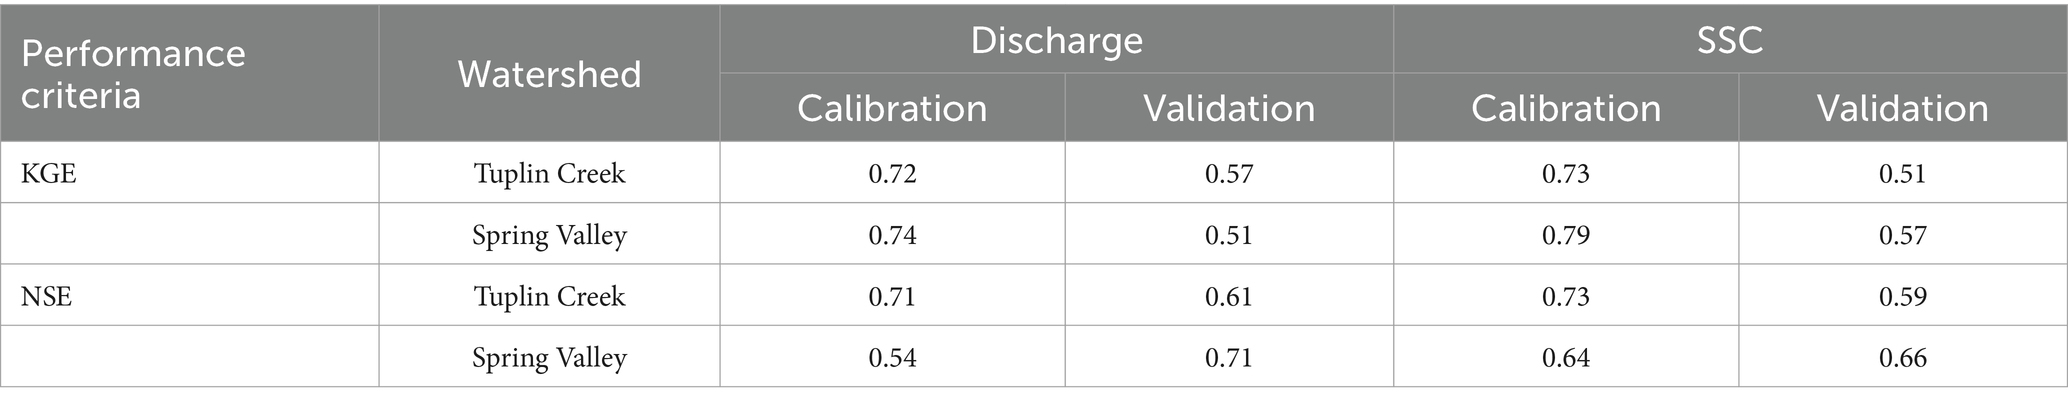
Table 3. Statistical performances for discharge and suspended sediment during calibration and validation periods.
Regarding sediment calibration and validation, the results show significant differences between the two watersheds for some high sediment concentration events. These differences are attributable to conditions and events not predicted by the model. For example, a sediment peak in mid-January for Tuplin Creek was not adequately simulated by the model, despite the event having over 600 mg/L of suspended sediment. This peak occurred when there was no corresponding rainfall event, and the second watershed did not have any significant sediment event that day. This can be explained by unpredictable actions, such as work near the river or agricultural management practices. However, the results from the performance criteria in Table 3 show that the model is effective in simulating suspended sediments concentration. The short calibration and validation period remains a limitation to achieving higher performance criteria due to the limited number of significant sediment events.
Climate change impact on hydrology
After the calibration of hydrology and suspended sediment data, meteorological data from future climate projections were used to obtain streamflow scenarios up to 2,100 with the RCP 8.5 climate change scenario (Figure 8). The hydrology projections up to 2,100, shown in Figure 8, display the annual variations in streamflow for Tuplin Creek and Spring Valley watersheds. Table 4 presents the different descriptive statistics of future time periods concerning streamflow. Periods for which these statistics were performed include observed data from 2021 to 2023, projections from 2023 to 2050, from 2050 to 2075, and from 2075 to 2,100. The mode of the simulated time series for the future time periods appears to increase, indicating an overall higher streamflow, in correlation with the statistically increased precipitation in the future. When compared with the observed data, the other descriptive statistics suggest that the values of future time series are higher. Regarding the first three quartiles for the Spring Valley and Tuplin Creek watersheds, an increase in values is noted in the future, indicating a statistically significant increase in low streamflow values. The Mann-Kendall statistical test show a positive flow trend in both subbasins. The fourth quartile value of each period does not show a clear trend.
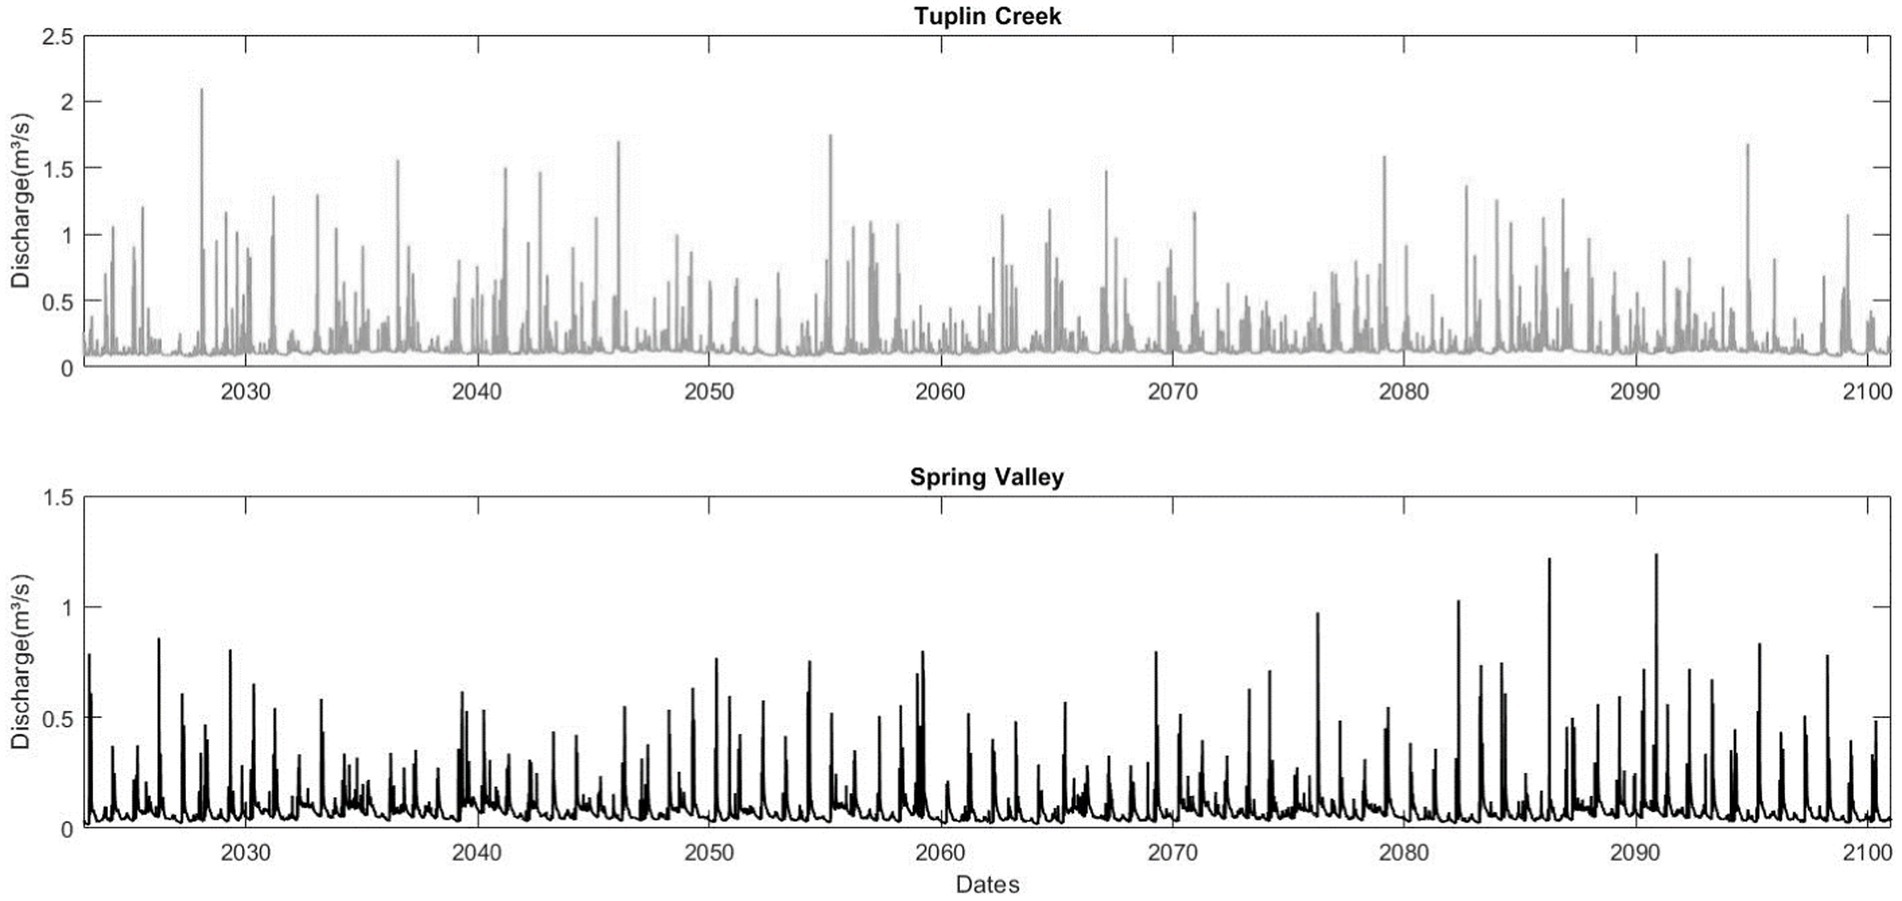
Figure 8. Simulated discharge using SWAT model until 2,100 for Tuplin Creek and Spring Valley.
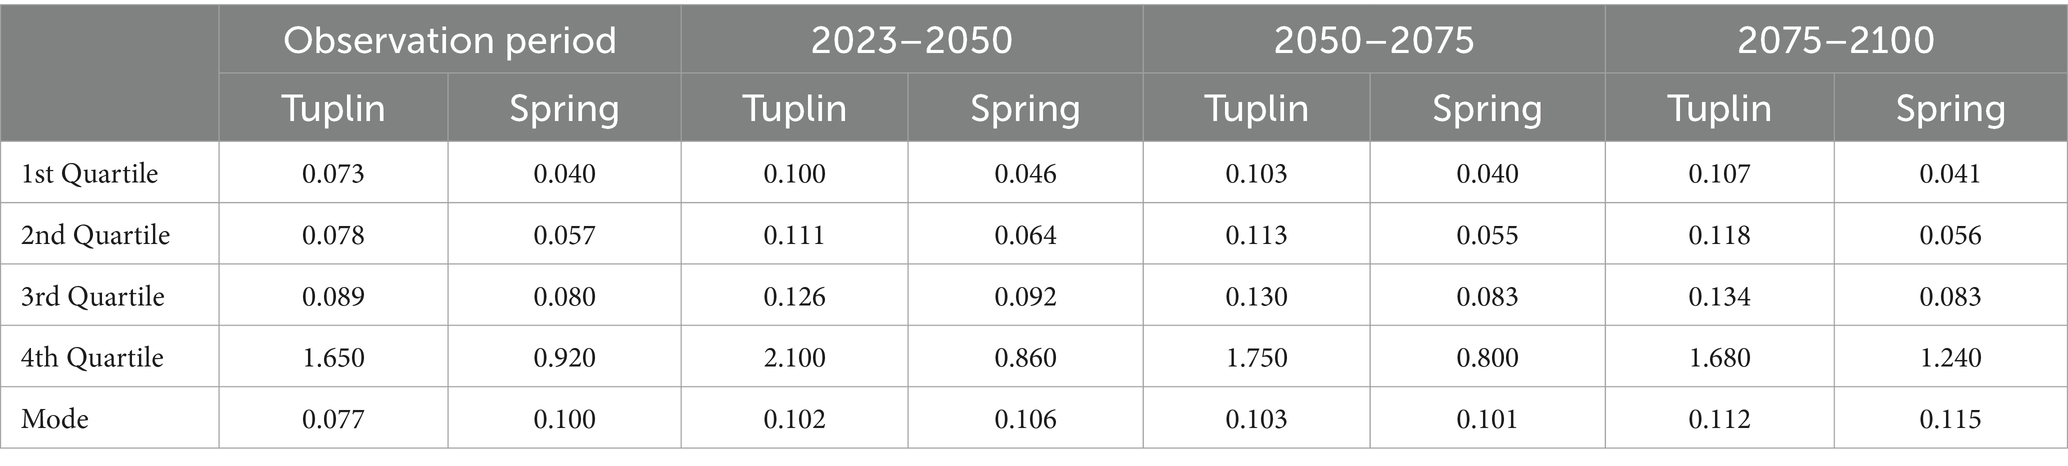
Table 4. Descriptive statistics of simulated streamflow data (m3/s) up to 2,100, comparison of different future periods using quartiles and mode of values.
Table 5 shows the frequency of exceedances of high flows that have been simulated and observed during various future time periods. Values in Table 5 show a decline in the number of extreme events for Tuplin Creek in future time periods and a decrease followed by an increase for Spring Valley. These results do not indicate a concrete common trend in the data, suggesting that a trend in extreme flow values is difficult to predict, according to the selected climate change scenario.
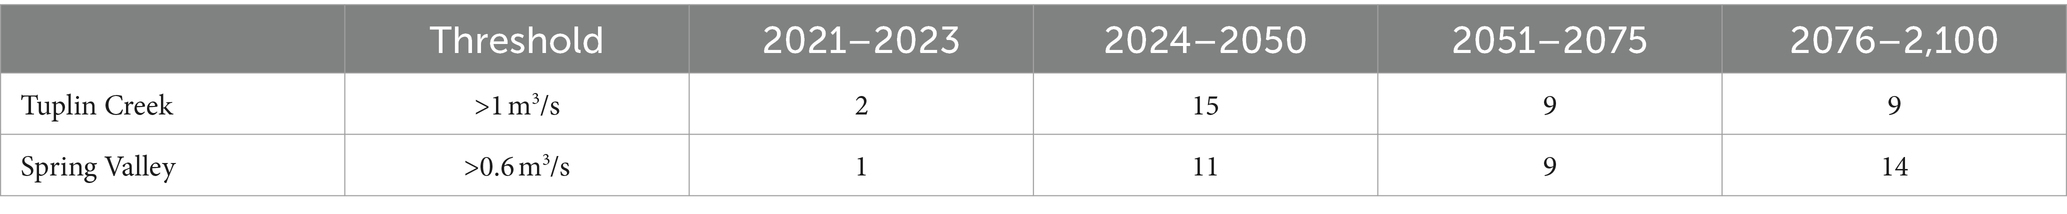
Table 5. Number of exceedances of a threshold corresponding to observed extreme events for future periods according to the CanESM2-RCP 8.5 scenario used as input in SWAT.
Climate change impact on sediment concentration
Figure 9 displays the suspended sediment concentrations (SSC) scenario from 2023 to 2,100. The presence of trends (Mann-Kendall test) confirmed a statistically significant positive increase in SSC values up to 2,100.
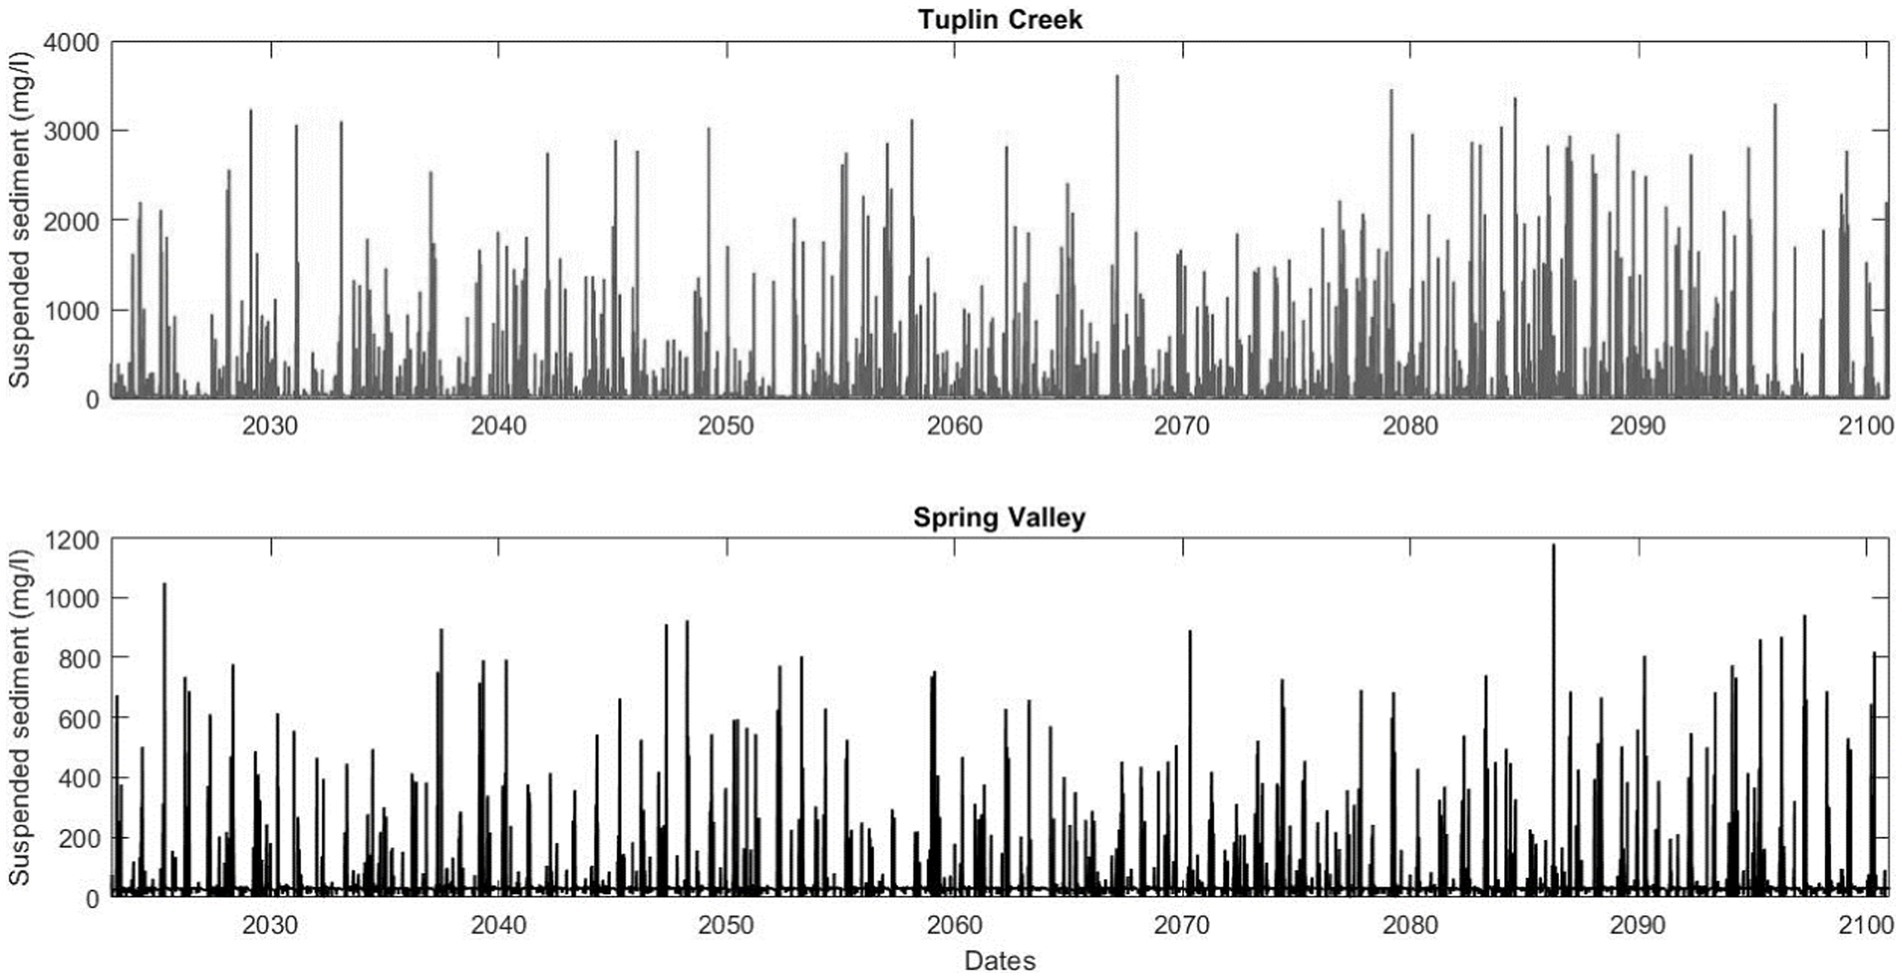
Figure 9. Simulated SSC data using SWAT model until 2,100 for Tuplin Creek (top) and Spring valley (bottom).
As for the descriptive statistics shown in Table 6, they reveal the possible future trends of suspended sediments. The future periods compared to the observed data have some differences, with quartiles and modes being significantly higher for the future periods (except for the third quartile for Tuplin Creek). This indicates an increase in SSC values compared to the observed data for the lowest and highest values, with associated potential harmful environmental impacts (Table 7). This increase can also be explained by the short period of observation for SSC values, resulting in a more significant statistical bias and less representativeness of values over the long term.
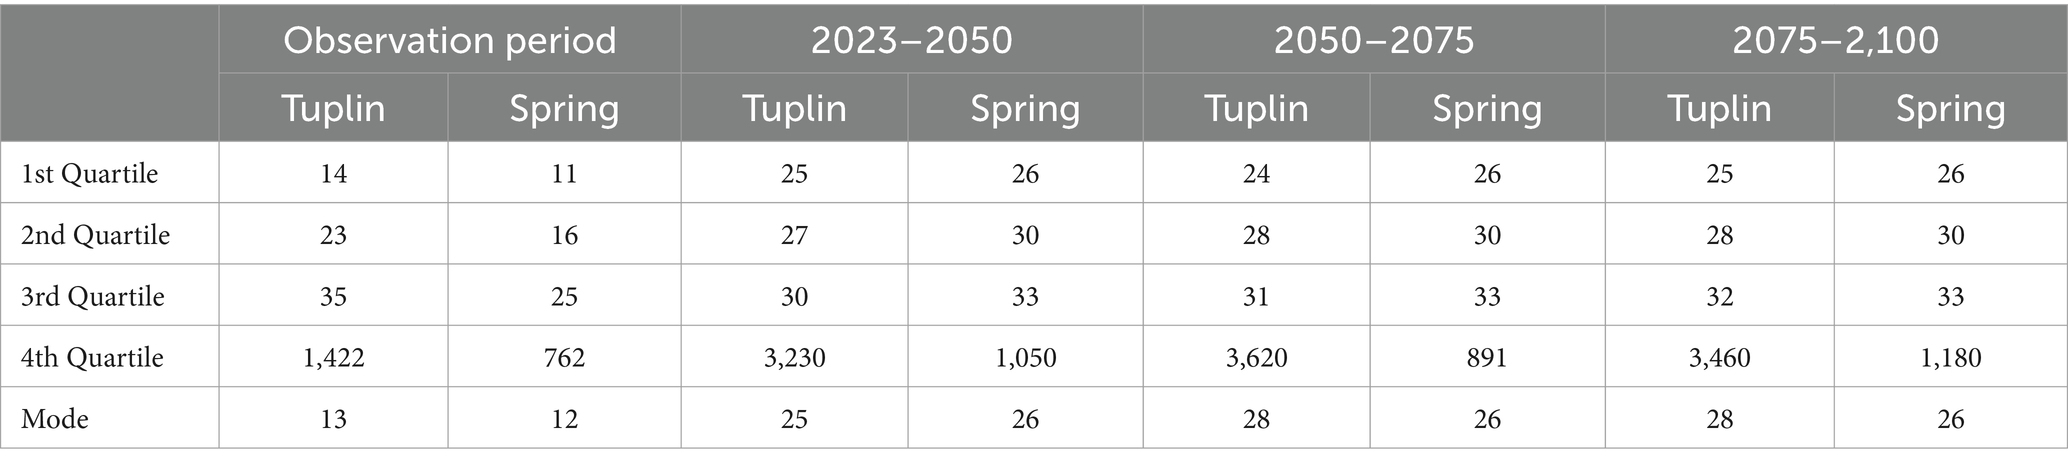
Table 6. Descriptive statistics of simulated SSC (mg/L) up to 2,100, comparison of different future periods using quartiles and mode of values.
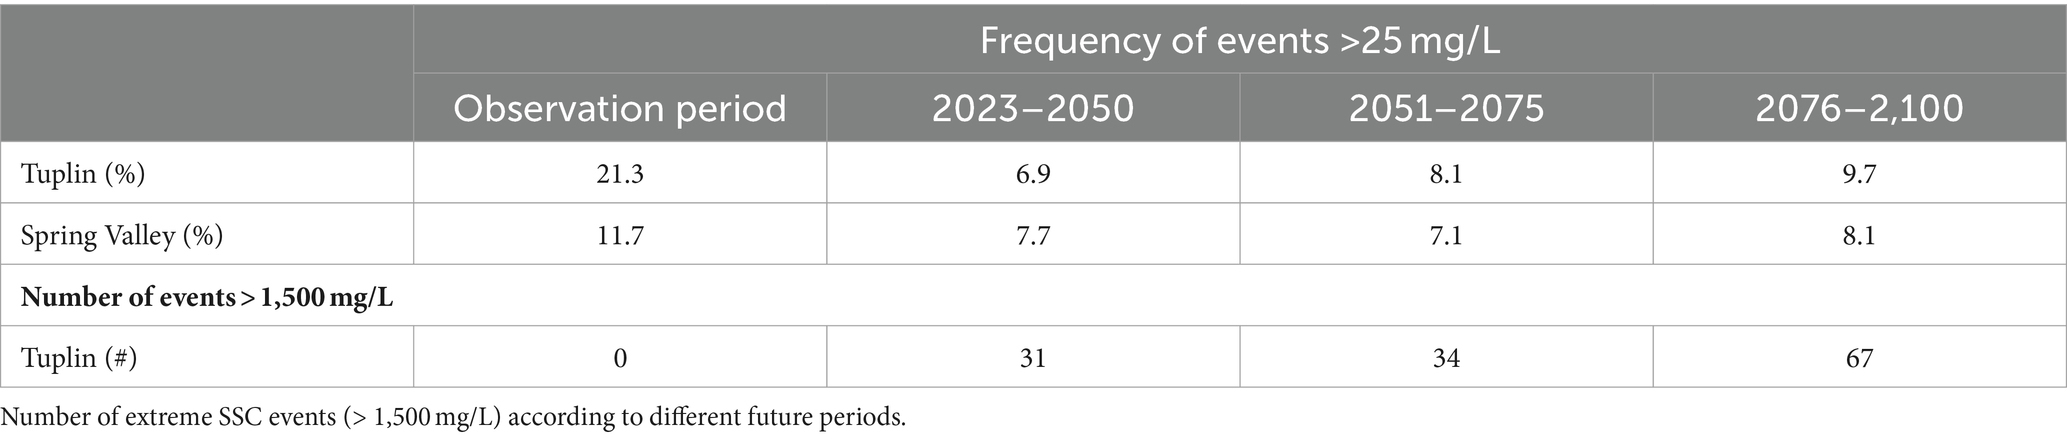
Table 7. Percentage of time with SSC concentration exceeding 25 mg/L compared to the baseline for different future periods for both watersheds.
Regarding future periods, no clear trend is observable. The values of different quartiles and modes vary little as time progresses. The extreme values of each period are also quite similar for the two watersheds, indicating that SSC peaks should not increase significantly. It is possible to link this small increase to increased precipitation, and the discharge values that also show a weak tendency to increase.
The impact of suspended sediments on aquatic fauna and flora has been widely studied to assess the risk to aquatic environments. Studies on the dangers of suspended sediments on fish life cycle stages (Burkhead and Jelks, 2001; Kemp et al., 2011) have listed some of the threats to these aquatic species. Species present on Prince Edward Island such as white perch and striped bass, which reproduce in freshwater, are sensitive to SSC when they exceed tolerance values, particularly juveniles (Morgan et al., 1983). Juveniles are even more vulnerable when exposed to high levels of suspended sediment for longer durations. The Canadian Council of the Ministers of the Environment guidelines stipulate that on average, the SSC should not exceed a value greater than 25 mg/L above regional background concentrations (Liu and Marine, 1999; CCME).6 Hence, projected events exceeding the observed mean by more than 25 mg/L were identified tabulated (Table 7).
In addition, the possible impact of very high suspended sediment peaks on some ichthyofauna was explored. Critical values of more than 1,500 mg/L of suspended sediment over 24 h were recorded in Table 7 for Tuplin Creek to assess the number of exceedances of this threshold for future periods. An exceedance of 1,500 mg/L of SSC over 24 h would result in mortality rates of 12 to 18% for juvenile white perch (Morone americana) and 19 to 21% for juvenile striped bass (Morone Saxatilis) according to the literature (Morgan et al., 1983).
The sediment values being a daily average, certain hours necessarily have much higher SSC levels than those reported in Table 7. These critical moments for aquatic fauna are particularly dangerous for species with little tolerance for very high levels over a short period of time. These sub-daily events were not considered in the present study.
Table 7 shows, that future SSC projections would have a lower frequency of exceedance of the lower threshold (25 mg/L above the observed mean which is 13 mg/L for Tuplin Creek and 12 mg/L for Spring Valley). This may be due to higher initial dilution associated with higher base flows. Table 7 also indicates that the projected percentage of exceedance of this lower threshold would increase slightly from 6.9 to 9.7% in Tuplin and from 7.7 to 8.1% in Spring Valley.
For Tuplin Creek, the number of days with an average SSC above 1,500 mg/L for different time periods is projected to increase. With the limited data period for the observed values, no exceedance of this threshold was observed historically. For the future scenario, an increase in the number of these spikes was noted. Thus, from 31 events from 2023 to 2050, the number increases to 67 from 2076 to 2,100. This would indicate a more significant pressure on aquatic species and events leading to possible increase in stressful events of even mortality. These were only reported for Tuplin Creek because none were found in the Spring Valley projections (Figure 9).
Climate change impact on sediment load
Figure 10 shows the annual sediment load in tons per year from 2023 to 2,100. Both watersheds would see a statistically significant increase in annual sediment load from 2023 to 2,100 according to the selected climate change scenario, as confirmed by the Mann-Kendall test which is positive for both study locations. Linear regression shows that for Tuplin Creek, the increase in annual sediment load is greater than for Spring Valley. For the 2 years with observed data, average annual sediment loads are 212 tons for Tuplin Creek and 95 tons for Spring Valley. Comparing these values with future sediment load data, 84% of sediment load values are higher in the future for Tuplin Creek and 57% for Spring. The potential increased sediment load can be linked to numerous environmental issues, especially in estuaries which will be impacted by the increased influx of sediment. Risks of eutrophication and pollution are increased with the rising sediment load, as well as threats to the physical structure of the estuary due to sedimentation and bed elevation. Under the RCP 8.5 climate change scenario and with similar land use as today, the trend for sediment load would be toward an increase.
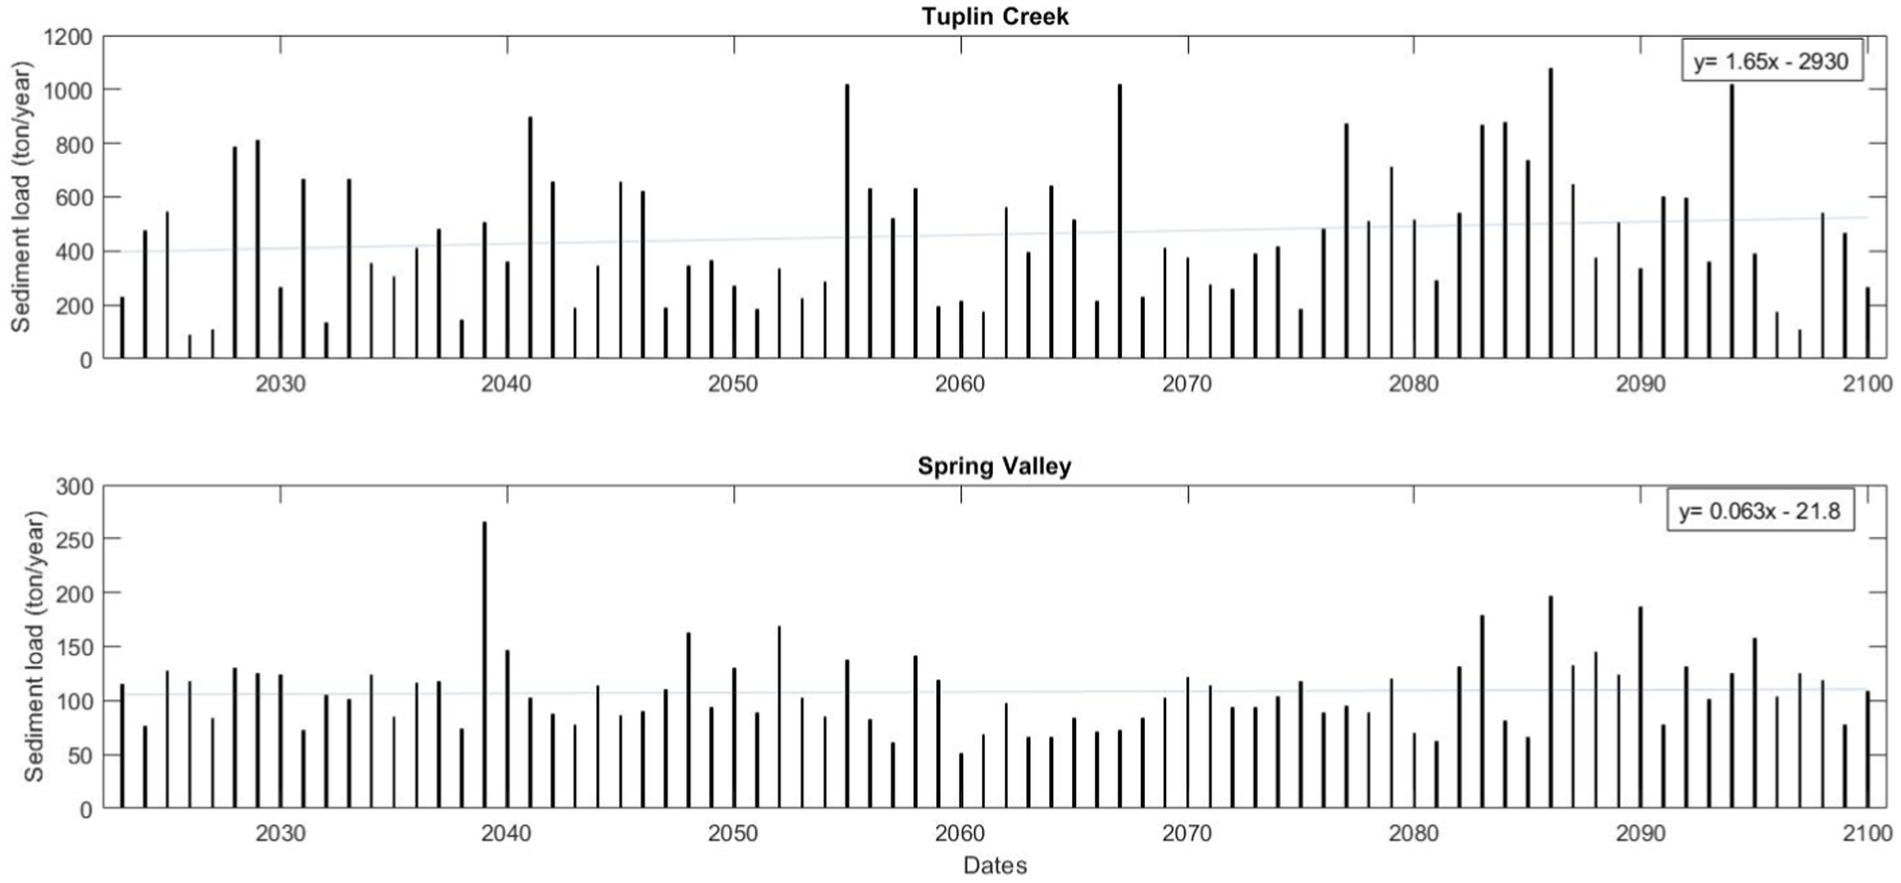
Figure 10. Simulated yearly sediment load data using SWAT model until 2,100 for Tuplin Creek and Spring valley.
Discussion
Other researchers have used the SWAT model to examine the impacts of climate change on suspended sediment in watershed areas across various regions worldwide (Yesuf et al., 2015; Rodríguez-Blanco et al., 2016; Zuo et al., 2016). These investigations have provided valuable insights into the discernible consequences of climate change on the dynamics of suspended sediment.
Previous studies focusing on suspended sediment in PEI (Dunn et al., 2011; Sirabahenda et al., 2020) have demonstrated the successful utilization of the SWAT model for this purpose in different contexts, including both forested and agricultural areas. This study demonstrates the effectiveness of the SWAT model in simulating present and future streamflows and suspended sediment concentrations (SSCs). The performance evaluation criteria, such as Kling-Gupta Efficiency (KGE) and Nash-Sutcliffe Efficiency (NSE), indicate successful simulation of the respective data sets. The assessment of possible future trends in suspended sediment in this study provides a glimpse into the potential risks faced by agricultural watercourses on PEI under the most pessimistic climate change scenario.
The chosen climate scenario, which represents the most pessimistic outlook, provides a clear illustration of the potential climate impacts if no action is taken to mitigate global warming and sediment loading. Climate change impacts on the island are relatively less pronounced compared to other regions (except for coastal erosion), owing to the buffering role played by the Gulf of Saint Lawrence surrounding PEI. The gulf helps to moderate both high and low temperatures. Precipitation is projected to increase throughout the century on PEI under the RCP 8.5 climate change scenario. Additionally, temperatures are expected to exhibit a consistent positive trend, with lower average temperatures increasing at a faster rate than higher average temperatures, resulting in higher winter temperature and accelerated snow melting. This study focuses on a relatively pessimistic scenario. Future studies should consider alternative scenarios.
In terms of hydrological modeling, the model may underestimate certain baseflows, especially during periods without major hydrological peaks, possibly due to inadequate consideration of groundwater processes. The model output data indicate a slight increase in streamflows throughout the century, with a significant decrease in annual flood events due to more frequent melting phenomena in the winter. When compared to observed data, which were collected over a short period, the future hydrological values exceed those of the different quartiles, indicating an increase in streamflows. However, these trends are projections that do not account for potential changes in local conditions. There remains a high level of uncertainty regarding future data, particularly due to the direct impact of human activities such as intensive pumping of groundwater, which could diminish river discharge during the summer, as well as changes in land use, which cannot be predicted yet. Nevertheless, if a similar agro-productive system to the current one is maintained, it is likely that pumping will increase in the future, further impacting the hydrological balance, as is already the case with existing wells (Island, 2004).
Regarding suspended sediment, the model results reveal that compared to observed data, future values are significantly higher for all quartiles and maximum values. This can be attributed to the limited calibration and validation period, which reduces the representativeness of the data but still suggests a probable increase in suspended sediment levels. The frequency of very high SSC events is expected to occur more frequently in one of the two watersheds, indicating greater pressure on aquatic ecosystems. From 2075 to 2,100, the number of sediment peaks exceeding 1,500 mg/L (a threshold associated with more than 15% mortality of juvenile striped bass and white perch in 1 day) is projected to double compared to previous periods in Tuplin Creek. The other watershed, Spring Valley, which has a relatively smaller drainage area, does not experience significant sediment peaks or an increase in their frequency in the future. This indicates that despite their proximity, local conditions in each watershed are likely intrinsically linked to the levels of suspended sediment in the watercourses. Looking at the local conditions with regard to SSCs, and in particular the loads per km2, the results show that Spring Valley with an average of 38 tons per km2 per year undergoes less sediment transfer over the period than Tuplin Creek with an average of 89 tonnes per km2 per year. This therefore indicates a higher runoff per kilometer for Tuplin Creek, thus implying less sediment retention near the rivers or more numerous sources of suspended sediment. The slightly lower forest coverage (−5%) and slightly higher agricultural land use in Tuplin Creek compared to Spring Valley could be the cause of larger sediment peaks, as forested buffers play a crucial role in sediment retention. Furthermore, the slopes in the vicinity of both rivers exhibit similar characteristics. The percentage of exceedances of 25 mg/L in suspended sediment concentration (SSC), compared to the baseline level, appear to be increasing chronologically in future periods. This could imply additional physiological stress for fish (Gregory et al., 1993) and, consequently, a progressive degradation of aquatic living conditions, even though the percentage increases are small.
While species have various adaptation strategies to cope with peak SSC events, mortality can still be significant for different aquatic species during these extreme turbid events (Newcombe and Jensen, 1996; Au et al., 2004). Since the concentration of suspended sediment primarily depends on land use practices in adjacent areas and precipitation, changes in agricultural practices could yield positive results in reducing SSC. Increasing riparian buffers is one approach to reducing SSC (Cho et al., 2010; Sirabahenda et al., 2017).
The limitations of this study include its focus on a specific climate change scenario without projecting changes in land use in the future. The limited period of observed data affects the representativeness of present values and current conditions. The sampling locations, significantly upstream of the river outlets into the estuary, also mean that the observed conditions do not fully represent the conditions throughout the watersheds.
Furthermore, it is important to acknowledge the presence of uncertainties in SWAT modeling. The SWAT model simplifies intricate hydrological and biogeochemical processes by converting them into mathematical equations and parameters. However, this simplification may not fully capture the intricate complexities and variations present in real-world systems, which can result in potential inaccuracies in the model’s predictions.
Conclusion
The application of the SWAT model has shown that it is possible, in a predominantly agricultural context and within a limited period, to calibrate and validate streamflow and suspended sediment data for two small watersheds. The findings of this study shed light on the potential risks faced by agricultural watercourses on Prince Edward Island (PEI) under a pessimistic climate change scenario. The anticipated increase in precipitation is likely to contribute to a future rise in streamflow. Additionally, there is a possibility of an increase in the frequency of suspended sediment peaks, which poses risks to ecosystems.
However, these findings should be interpreted with caution, considering the short calibration period, the uncertainties inherent in the SWAT model and the fact that only one climate change scenario was used in simulations. Watersheds with different land use characteristics exhibited varying responses to future sediment peaks, indicating the probable significance of forested land in sediment retention. Moreover, the potential impacts of sediment peaks on aquatic ecosystems and species’ adaptation strategies underscore the need for proactive measures to mitigate adverse effects.
Further research, incorporating longer-term data and considering a range of scenarios, can enhance our understanding of the complex interactions between climate change, land use practices, and sediment dynamics, facilitating more informed decision-making for sustainable water resource management in the face of changing environmental conditions.
Data availability statement
The raw data supporting the conclusions of this article will be made available by the authors, without undue reservation.
Author contributions
SB: Data curation, Formal analysis, Investigation, Methodology, Validation, Visualization, Writing – original draft. AS-H: Conceptualization, Funding acquisition, Investigation, Methodology, Project administration, Resources, Software, Supervision, Validation, Visualization, Writing – review & editing. MH: Conceptualization, Data curation, Formal analysis, Funding acquisition, Investigation, Methodology, Project administration, Software, Supervision, Validation, Visualization, Writing – review & editing.
Funding
The author(s) declare financial support was received for the research, authorship, and/or publication of this article. This project was funded in parts by MITACS.
Conflict of interest
The authors declare that the research was conducted in the absence of any commercial or financial relationships that could be construed as a potential conflict of interest.
Publisher’s note
All claims expressed in this article are solely those of the authors and do not necessarily represent those of their affiliated organizations, or those of the publisher, the editors and the reviewers. Any product that may be evaluated in this article, or claim that may be made by its manufacturer, is not guaranteed or endorsed by the publisher.
Footnotes
2. ^https://swatmodel.tamu.edu
3. ^https://sis.agr.gc.ca/cansis/publications/surveys/pe/pe83-54/index.html
4. ^http://wateroffice.ec.gc.ca
5. ^https://cordex.org/data-access/esgf/
6. ^https://prrd.bc.ca/wp-content/uploads/post/prrd-water-quality-database-and-analysis
References
Abrahams, M. V., Bassett, D. K., and Montgomery, J. C. (2017). Sensory biology as a risk factor for invasion success and native fish decline. Trans. American Fisheries Society 146, 1238–1244. doi: 10.1080/00028487.2017.1353545
Adekanmbi, T., Wang, X., Basheer, S., Nawaz, R. A., Pang, T., Hu, Y., et al. (2023). Assessing future climate change impacts on potato yields—A case study for Prince Edward Island. Canada. Foods 12:1176. doi: 10.3390/foods12061176
Alberto, A., Courtenay, S. C., St-Hilaire, A., and van den Heuvel, M. R. (2017). Factors influencing brook trout (Salvelinus fontinalis) egg survival and development in streams influenced by agriculture. J. Fisheries Sci. 11, 9–20. doi: 10.21767/1307-234X.1000113
Alberto, A., St-Hilaire, A., Courtenay, S. C., and van den Heuvel, M. R. (2016). Monitoring stream sediment loads in response to agriculture in Prince Edward Island. Canada. Environ. Monit. Assess. 188:415. doi: 10.1007/s10661-016-5411-3
Arnold, J. G., Moriasi, D. N., Gassman, P. W., Abbaspour, K. C., White, M. J., Srinivasan, R., et al. (2012). SWAT: Model use, calibration, and validation. Trans. ASABE 55, 1491–1508. doi: 10.13031/2013.42256
Asselman, N. E. M. (2000). Fitting and interpretation of sediment rating curves. J. Hydrol. 234, 228–248. doi: 10.1016/S0022-1694(00)00253-5
Au, D. W. T., Pollino, C. A., Wu, R. S. S., Shin, P. K. S., Lau, S. T. F., and Tang, J. Y. M. (2004). Chronic effects of suspended solids on gill structure, osmoregulation, growth, and triiodothyronine in juvenile green grouper Epinephelus coioides. Mar. Ecol. Prog. Ser. 266, 255–264. doi: 10.3354/meps266255
Azari, M., Moradi, H. R., Saghafian, B., and Faramarzi, M. (2016). Climate change impacts on streamflow and sediment yield in the north of Iran. Hydrol. Sci. J. 61, 123–133. doi: 10.1080/02626667.2014.967695
Bhatta, B., Shrestha, S., Shrestha, P. K., and Talchabhadel, R. (2019). Evaluation and application of a SWAT model to assess the climate change impact on the hydrology of the Himalayan River basin. Catena 181:104082. doi: 10.1016/j.catena.2019.104082
Bhatta, B., Shrestha, S., Shrestha, P. K., and Talchabhadel, R. (2020). Modelling the impact of past and future climate scenarios on streamflow in a highly mountainous watershed: A case study in the West Seti River basin. Nepal. Sci. Total Environ. 740:140156. doi: 10.1016/j.scitotenv.2020.140156
Bhatti, A. Z., Farooque, A. A., Krouglicof, N., Peters, W., Acharya, B., Li, Q., et al. (2021). Climate change impacts on precipitation and temperature in Prince Edward Island. Canada. World Water Policy 7, 9–29. doi: 10.1002/wwp2.12046
Bhatti, A. Z., Farooque, A. A., Krouglicof, N., Peters, W., Li, Q., and Acharya, B. (2022). Prospective climates, and water availabilities under different projections of environmental changes in Prince Edward Island. Canada. Water 14:740. doi: 10.3390/w14050740
Blevins, R. L., Frye, W. W., Baldwin, P. L., and Robertson, S. D. (1990). Tillage effects on sediment and soluble nutrient losses from a Maury silt loam soil. J. Environ. Qual. 19, 683–686. doi: 10.2134/jeq1990.00472425001900040009x
Bruton, M. N. (1985). The effects of suspensoids on fish. In perspectives in southern hemisphere limnology: Proceedings of a symposium, held in wilderness, South Africa, July 3–13, 1984: 221–241. Springer Netherlands.
Burkhead, N. M., and Jelks, H. L. (2001). Effects of suspended sediment on the reproductive success of the tricolor shiner, a crevice-spawning minnow. Trans. Am. Fish. Soc. 130, 959–968. doi: 10.1577/1548-8659(2001)130<0959:EOSSOT>2.0.CO;2
Cho, J., Lowrance, R. R., Bosch, D. D., Strickland, T. C., Her, Y., and Vellidis, G. (2010). Effect of watershed subdivision and filter width on SWAT simulation of a coastal plain watershed 1. JAWRA J. American Water Resources Assoc. 46, 586–602. doi: 10.1111/j.1752-1688.2010.00436.x
Church, M. (2006). Bed material transport and the morphology of alluvial river channels. Annu. Rev. Earth Planet. Sci. 34, 325–354. doi: 10.1146/annurev.earth.33.092203.122721
Coffin, M. R. S., Courtenay, S. C., Pater, C. C., and van den Heuvel, M. R. (2018). An empirical model using dissolved oxygen as an indicator for eutrophication at a regional scale. Mar. Pollut. Bull. 133, 261–270. doi: 10.1016/j.marpolbul.2018.05.041
Deeley, D. M., and Paling, E. I. (1998). Assessing the ecological health of estuaries in Southwest Australia. Melbourne, Australia: Gleneagles Publishing.
Dunn, A. M., Julien, G., Ernst, W. R., Cook, A., Doe, K. G., and Jackman, P. M. (2011). Evaluation of buffer zone effectiveness in mitigating the risks associated with agricultural runoff in Prince Edward Island. Sci. Total Environ. 409, 868–882. doi: 10.1016/j.scitotenv.2010.11.011
Edwards, L. M. (2013). The effects of soil freeze–thaw on soil aggregate breakdown and concomitant sediment flow in Prince Edward Island: A review. Can. J. Soil Sci. 93, 459–472. doi: 10.4141/cjss2012-059
Edwards, L., Richter, G., Bernsdorf, B., Schmidt, R. G., and Burney, J. (1998). Measurement of rill erosion by snowmelt on potato fields under rotation in Prince Edward Island (Canada). Can. J. Soil Sci. 78, 449–458.
FAO and IWMI (2017). Water pollution from agriculture: A global review. Rome, food and agriculture Organization of the United Nations (FAO) and Colombo. Milan, Italy: International Water Management Institute.
Ficklin, D. L., Luo, Y., Luedeling, E., and Zhang, M. (2009). Climate change sensitivity assessment of a highly agricultural watershed using SWAT. J. Hydrol. 374, 16–29. doi: 10.1016/j.jhydrol.2009.05.016
Gassman, P. W., Sadeghi, A. M., and Srinivasan, R. (2014). Applications of the SWAT model special section: overview and insights. J. Environ. Qual. 43, 1–8.
Gregory, R. S., Servizi, J. A., and Martens, D. W. (1993). Comment: utility of the stress index for predicting suspended sediment effects. N. Am. J. Fish Manag. 13, 868–873. doi: 10.1577/1548-8675-13.4.868
Guignion, D., Gaudet, C., and Mac Farlane, R. (2019). A renewed conservation strategy for Altantic salmon in Prince Edward Island. Charlottetown, PEI, Canada: Oak Meadows Inc, 150.
Gupta, H. V., Kling, H., Yilmaz, K. K., and Martinez, G. F. (2009). Decomposition of the mean squared error and NSE performance criteria: implications for improving hydrological modelling. J. Hydrol. 377, 80–91. doi: 10.1016/j.jhydrol.2009.08.003
Henley, M. A., Patterson, R. J., Neves, R. J., and Lemly, A. D. (2000). Effects of sedimentation and turbidity on lotic food webs: A concise review for natural resource managers. Rev. Fish. Sci. 8, 125–139. doi: 10.1080/10641260091129198,Neves & A. Dennis Lemly
Higham, T. E., Stewart, W. J., and Wainwright, P. C. (2015). Turbulence, temperature, and turbidity: the ecomechanics of predator–prey interactions in fishes. Integr. Comp. Biol. 55, 6–20. doi: 10.1093/icb/icv052
Intergovernmental Panel on Climate Change (IPCC) (2019). Representative concentration pathways (RCPs). Geneva, Switzerland: IPCC.
Island, P. E. (2004). Application of numerical modeling to groundwater assessment and management in Prince Edward Island. In proceedings of the 2004 57th Canadian geotechnical conference, Québec, QC, Canada (pp. 25–27).
Kemp, P., Sear, D., Collins, A., Naden, P., and Jones, I. (2011). The impacts of fine sediment on riverine fish. Hydrol. Process. 25, 1800–1821. doi: 10.1002/hyp.7940
Kisi, O., and Shiri, J. (2012). River suspended sediment estimation by climatic variables implication: comparative study among soft computing techniques. Comput. Geosci. 43, 73–82. doi: 10.1016/j.cageo.2012.02.007
Kling, H., Fuchs, M., and Paulin, M. (2012). Runoff conditions in the upper danube basin under an ensemble of climate change scenarios. J. Hydrol. 424, 264–277.
Levasseur, M., Bergeron, N. E., Lapointe, M. F., and Bérubé, F. (2006). Effects of silt and very fine sand dynamics in Atlantic salmon (Salmo salar) redds on embryo hatching success. Can. J. Fish. Aquat. Sci. 63, 1450–1459. doi: 10.1139/f06-050
Liu, X., and Marine, N. R. G. (1999). Canadian water quality guidelines for the protection of aquatic life. Canadian Council of Ministers of the Environment, Winnipeg, 1–5.
Ma, D., Qian, B., Gu, H., Sun, Z., and Xu, Y. P. (2021). Assessing climate change impacts on streamflow and sediment load in the upstream of the Mekong River basin. Int. J. Climatol. 41, 3391–3410. doi: 10.1002/joc.7025
Maqsood, J. (2021). Machine learning based climate projections for sustainable potato production in Prince Edward Island. M.Sc. Thesis, Faculty of Sustainable Design Engineering. Canada: University of PEI.
Morgan, R. P., Rasin, V. J., and Noe, L. A. (1983). Sediment effects on eggs and larvae of striped bass and White perch. Trans. Am. Fish. Soc. 112, 220–224. doi: 10.1577/1548-8659(1983)112<220:SEOEAL>2.0.CO;2
Moriasi, D. N., Arnold, J. G., Van Liew, M. W., Bingner, R. L., Harmel, R. D., and Veith, T. L. (2007). Model evaluation guidelines for systematic quantification of accuracy in watershed simulations. Trans. ASABE 50, 885–900. doi: 10.13031/2013.23153
Nash, J. E., and Sutcliffe, J. V. (1970). River flow forecasting through conceptual models part I: A discussion of principles. J. Hydrol. 10, 282–290. doi: 10.1016/0022-1694(70)90255-6
Neitsch, S. L., Arnold, J. G., Kiniry, J. R., and Williams, J. R. (2009). 1.1 Overview of soil and water assessment tool (SWAT) model. Tier B, 8, 3–23.
Neitsch, S.L., Arnold, J.G., Kiniry, J.R., and Williams, J.R. (2011). Soil & water assessment tool theoretical documentation version 2009. Technical report no 406, Texas water resources institute, College Station, pp. 1–647.
Newcombe, C. P., and Jensen, J. O. (1996). Channel suspended sediment and fisheries: a synthesis for quantitative assessment of risk and impact. N. Am. J. Fish Manag. 16, 693–727. doi: 10.1577/1548-8675(1996)016<0693:CSSAFA>2.3.CO;2
Nilawar, A. P., and Waikar, M. L. (2018). Use of SWAT to determine the effects of climate and land use changes on streamflow and sediment concentration in the Purna River basin, India. Environ. Earth Sci. 77, 1–13. doi: 10.1007/s12665-018-7975-4
Ockenden, M. C., Deasy, C., Quinton, J. N., Bailey, A. P., Surridge, B., and Stoate, C. (2012). Evaluation of field wetlands for mitigation of diffuse pollution from agriculture: sediment retention, cost and effectiveness. Environ. Sci. Pol. 24, 110–119. doi: 10.1016/j.envsci.2012.06.003
Pandey, A., Bishal, K. C., Kalura, P., Chowdary, V. M., Jha, C. S., and Cerdà, A. (2021). A soil water assessment tool (SWAT) modeling approach to prioritize soil conservation management in river basin critical areas coupled with future climate scenario analysis. Air, Soil and Water Res. 14:117862212110213. doi: 10.1177/11786221211021395
Pavey, B., St-Hilaire, A., Courtenay, S., Ouarda, T., and Bobée, B. (2007). Exploratory study of suspended sediment concentrations downstream of harvested peat bogs. Environ. Monit. Assess. 135, 369–382. doi: 10.1007/s10661-007-9656-8
Qi, H. X., Li, H. Z., Ma, P., and You, J. (2015). Integrated sediment quality assessment through biomarker responses and bioavailability measurements: application in Tai Lake, China. Ecotoxicol. Environ. Saf. 119, 148–154.
Richards, W., and Daigle, R. (2015). Scenarios and guidance for adaptation to climate change and sea level rise-NS and PEI municipalities. Atlantic climate adaptation solutions association. Report prepared for the Nova Scotia Department of Environment and the Atlantic Canada adaptation solutions association, Halifax, NS, Canada: Nova Scotia Environment. 78.
Rodríguez-Blanco, M. L., Arias, R., Taboada-Castro, M. M., Nunes, J. P., Keizer, J. J., and Taboada-Castro, M. T. (2016). Potential impact of climate change on suspended sediment yield in nw Spain: A case study on the Corbeira catchment. WaterSA 8:444. doi: 10.3390/w8100444
Roushangar, K., Mehrabani, F. V., and Shiri, J. (2014). Modeling river total bed material load discharge using artificial intelligence approaches (based on conceptual inputs). J. Hydrol. 514, 114–122. doi: 10.1016/j.jhydrol.2014.03.065
Shrestha, S., Bhatta, B., Shrestha, M., and Shrestha, P. K. (2018). Integrated assessment of the climate and land use change impact on hydrology and water quality in the Songkhram River basin, Thailand. Sci. Total Environ. 643, 1610–1622. doi: 10.1016/j.scitotenv.2018.06.306
Shrestha, S., Bhatta, B., Talchabhadel, R., and Virdis, S. G. P. (2022). Integrated assessment of the land use change and climate change impacts on the sediment yield in the Songkhram River basin. Thailand. Catena 209:105859. doi: 10.1016/j.catena.2021.105859
Shrestha, B., Cochrane, T. A., Caruso, B. S., and Arias, M. E. (2018). Land use change uncertainty impacts on streamflow and sediment projections in areas undergoing rapid development: A case study in the Mekong Basin. Land Degrad. Dev. 29, 835–848. doi: 10.1002/ldr.2831
Sirabahenda, Z., St-Hilaire, A., Courtenay, S. C., Alberto, A., and van den Heuvel, M. R. (2017). A modelling approach for estimating suspended sediment concentrations for multiple rivers influenced by agriculture. Hydrol. Sci. J. 62, 2209–2221. doi: 10.1080/02626667.2017.1367396
Sirabahenda, Z., St-Hilaire, A., Courtenay, S. C., and van den Heuvel, M. R. (2019). Comparison of acoustic to optical backscatter continuous measurements of suspended sediment concentrations and their characterization in an agriculturally impacted river. WaterSA 11:981. doi: 10.3390/w11050981
Sirabahenda, Z., St-Hilaire, A., Courtenay, S. C., and van den Heuvel, M. R. (2020). Assessment of the effective width of riparian buffer strips to reduce suspended sediment in an agricultural landscape using ANFIS and SWAT models. Catena 195:104762. doi: 10.1016/j.catena.2020.104762
Syvitski, J. P., Vörösmarty, C. J., Kettner, A. J., and Green, P. (2005). Impact of humans on the flux of terrestrial sediment to the global coastal ocean. Science 308, 376–380. doi: 10.1126/science.1109454
Tramblay, Y. C., Bouvier, C. M., and Didon-Lescot, J.-F. (2010). Dragana Todorovik, Jean-Marc Domergue, assessment of initial soil moisture conditions for event-based rainfall–runoff modelling. J. Hydrol. 387, 176–187. doi: 10.1016/j.jhydrol.2010.04.006
Williams, J. R., and Berndt, H. D. (1976). Determining the universal soil loss equation’s length-slope factor for watersheds. In National Soil Erosion Conference (pp. 34–45).
Yavari, S., Maroufpoor, S., and Shiri, J. (2018). Modeling soil erosion by data-driven methods using limited input variables. Hydrol. Res. 49, 1349–1362. doi: 10.2166/nh.2017.041
Yesuf, H. M., Assen, M., Alamirew, T., and Melesse, A. M. (2015). Modeling of sediment yield in Maybar gauged watershed using SWAT, Northeast Ethiopia. Catena 127, 191–205. doi: 10.1016/j.catena.2014.12.032
Zhou, Y., Xu, Y. J., Xiao, W., Wang, J., Huang, Y., and Yang, H. (2017). Climate change impacts on flow and suspended sediment yield in headwaters of high-latitude regions—A case study in China’s far northeast. WaterSA 9:966. doi: 10.3390/w9120966
Keywords: sediments, discharge model, SWAT, climate change, agriculture
Citation: Bée S, St-Hilaire A and van den Heuvel M (2024) Modeling sediment concentrations and loads for two small agricultural watersheds in Prince-Edward-Island (Canada): present conditions and a future scenario. Front. Water. 6:1337907. doi: 10.3389/frwa.2024.1337907
Edited by:
Matteo Camporese, University of Padua, ItalyReviewed by:
KS Kasiviswanathan, Indian Institute of Technology Roorkee, IndiaJalal Shiri, University of Tabriz, Iran
Copyright © 2024 Bée, St-Hilaire and van den Heuvel. This is an open-access article distributed under the terms of the Creative Commons Attribution License (CC BY). The use, distribution or reproduction in other forums is permitted, provided the original author(s) and the copyright owner(s) are credited and that the original publication in this journal is cited, in accordance with accepted academic practice. No use, distribution or reproduction is permitted which does not comply with these terms.
*Correspondence: André St-Hilaire, andre.st-hilaire@inrs.ca