 Stephen B. Ferencz
 Adam Mangel†
 Frederick Day-Lewis
- Earth Systems Science Division, Pacific Northwest National Laboratory, Richland, WA, United States
Water management in snowmelt hydrologic regimes, characterized by large annual fluctuations in stream flow driven by seasonal snow melt, faces the challenge of highly variable supply that often does not align with timing of demand. Climate change may exacerbate management challenges by significantly reducing snowpack or shifting snow melt earlier. Here, managed aquifer recharge (MAR) is evaluated as a potential strategy to reallocate excess early-season stream flow to time periods when less surface water is available. This strategy differs from traditional MAR, where the goal is to minimize loss to surface water. We assess how to site MAR operations such that groundwater recharge flows back to the surface water system in a lagged manor to benefit water management objectives, which we term “enhanced baseflow.” We use a regional groundwater model for the Treasure Valley aquifer located in southwestern Idaho, United States to demonstrate a generalizable approach using regional groundwater models as tools to identify favorable baseflow enhancement locations. Hypothetical MAR is simulated at 197 candidate locations, which are then evaluated for how effectively they meet potential management objectives. In addition to demonstrating the modeling and evaluation approach, we discuss lessons learned from applying a pre-existing regional groundwater model to MAR for enhanced baseflow and also describe important considerations, such as the physical and institutional availability of surface flows and specific management objectives, when assessing regional and site-specific suitability of MAR for enhanced baseflow as a potential management strategy.
1 Introduction
Snowmelt hydrologic regimes, where annual streamflow is prominently influenced by the timing and quantity of runoff generated during spring snow melt, are likely to experience earlier and more rapid snowmelt due to climate change (Kapnick and Hall, 2010; Cohen et al., 2020). These trends have been observed across the western United States (US) (Stewart et al., 2005; Ficklin et al., 2013; Huang et al., 2018) and climate models indicate they are likely to continue (Siirila-Woodburn et al., 2021). Water management in these hydroclimates has long-utilized reservoirs to store and redistribute water during periods of low flow, as well as to generate hydropower from the potential energy of stored snowmelt; however, most optimal reservoir locations have been developed and environmental considerations make permitting and development costly and challenging (Brown et al., 2019). Consequently, there is a need for management strategies that improve water resource resilience under possible future climate conditions characterized by earlier snowmelt and climate extremes such as more frequent and intense droughts (Barnett et al., 2005; Cohen et al., 2020; Wasti et al., 2022).
Managed aquifer recharge (MAR), the practice of increasing groundwater recharge using surface or reclaimed water, has been around for over 60 years (Dillon, 2005). Two common approaches for MAR are infiltration basins or injection wells (Dillon, 2005). Historically, the focus of research on MAR has been how to infiltrate and store (and sometimes recover) groundwater in depleted and stressed aquifers; however, MAR has recently been recognized as a promising tool to redistribute streamflow in seasonally variable hydrologic regimes, such as in snowmelt dominated systems (Surinaidu et al., 2016; Niswonger et al., 2017; Kourakos et al., 2019; Van Kirk et al., 2020). Under such a scheme, excess surface water (SW) during high-flow periods is used to recharge aquifers which then slowly release the recharged water back to the SW system, ideally increasing streamflow during low-flow periods.
A number of studies have explored approaches to characterize site suitability for MAR ranging from regional (Smith and Pollock, 2012; O'Geen et al., 2015; Gibson et al., 2018) to local scales (Lee et al., 2019). The sophistication of approaches ranges from evaluating analytical solutions to characterize infiltration and groundwater mounding (Smith and Pollock, 2012), to simplified conceptual numerical models (Szabó et al., 2023), to three-dimensional (3D), transient regional groundwater simulations (Russo et al., 2015; Kourakos et al., 2019). The primary focus of MAR characterization is identifying surface and aquifer characteristics that favor high infiltration rates and large storage capacities (Smith and Pollock, 2012; Gibson et al., 2018). In some cases, site suitability has also been considered in the context of specific environmental management objectives. For example, Russo et al. (2015) evaluated the effectiveness of MAR locations for reducing sea-water intrusion of a stressed coastal aquifer, and Kourakos et al. (2019) evaluated the effect of seasonal MAR on long-term baseflow, but their assessment did not focus on characterizing sub-annual baseflow dynamics. To our knowledge, no study has evaluated MAR site characterization for the purpose of enhancing baseflow to benefit SW management (i.e., identifying MAR locations with the expressed purpose of increasing baseflow flow during specific times to benefit maintenance of environmental flows or water supply).
In this work, we demonstrate the use of a 3D regional groundwater flow model (Hundt, 2023; Hundt and Bartolino, 2023) for the Treasure Valley Aquifer in Idaho, US to evaluate hundreds of potential MAR locations for suitability with respect to enhancing seasonal baseflow. This study is meant to show how groundwater modeling and, in this case, a pre-existing model, can aid the identification of promising MAR locations; however, our study is not designed to address region-specific issues or management goals within the study region. Rather, results are presented and interpreted in the context of hypothetical, general SW management objectives such as the timing and magnitude of enhanced baseflow relative to the MAR recharge signal. We also provide key lessons learned from applying a pre-existing regional groundwater model to this type of research question and describe important considerations for assessment of MAR for management of baseflow.
2 Methods
Designing, parameterizing, and calibrating a large, regional groundwater model is time-consuming and labor-intensive. When available, it is advantageous to use a pre-existing regional model, and researchers often adapt existing models for research questions of their own. There is a large and growing number of publicly available regional groundwater models that can serve as starting-points for model-based site-characterization efforts (ScienceBase, 2023; Zipper et al., 2023). This study leverages a recently published regional groundwater model of the Treasure Valley regional aquifer (Hundt, 2023; Hundt and Bartolino, 2023) located in southwestern Idaho, US (Figure 1A) to explore the baseflow response to a hypothetical transient MAR signal.
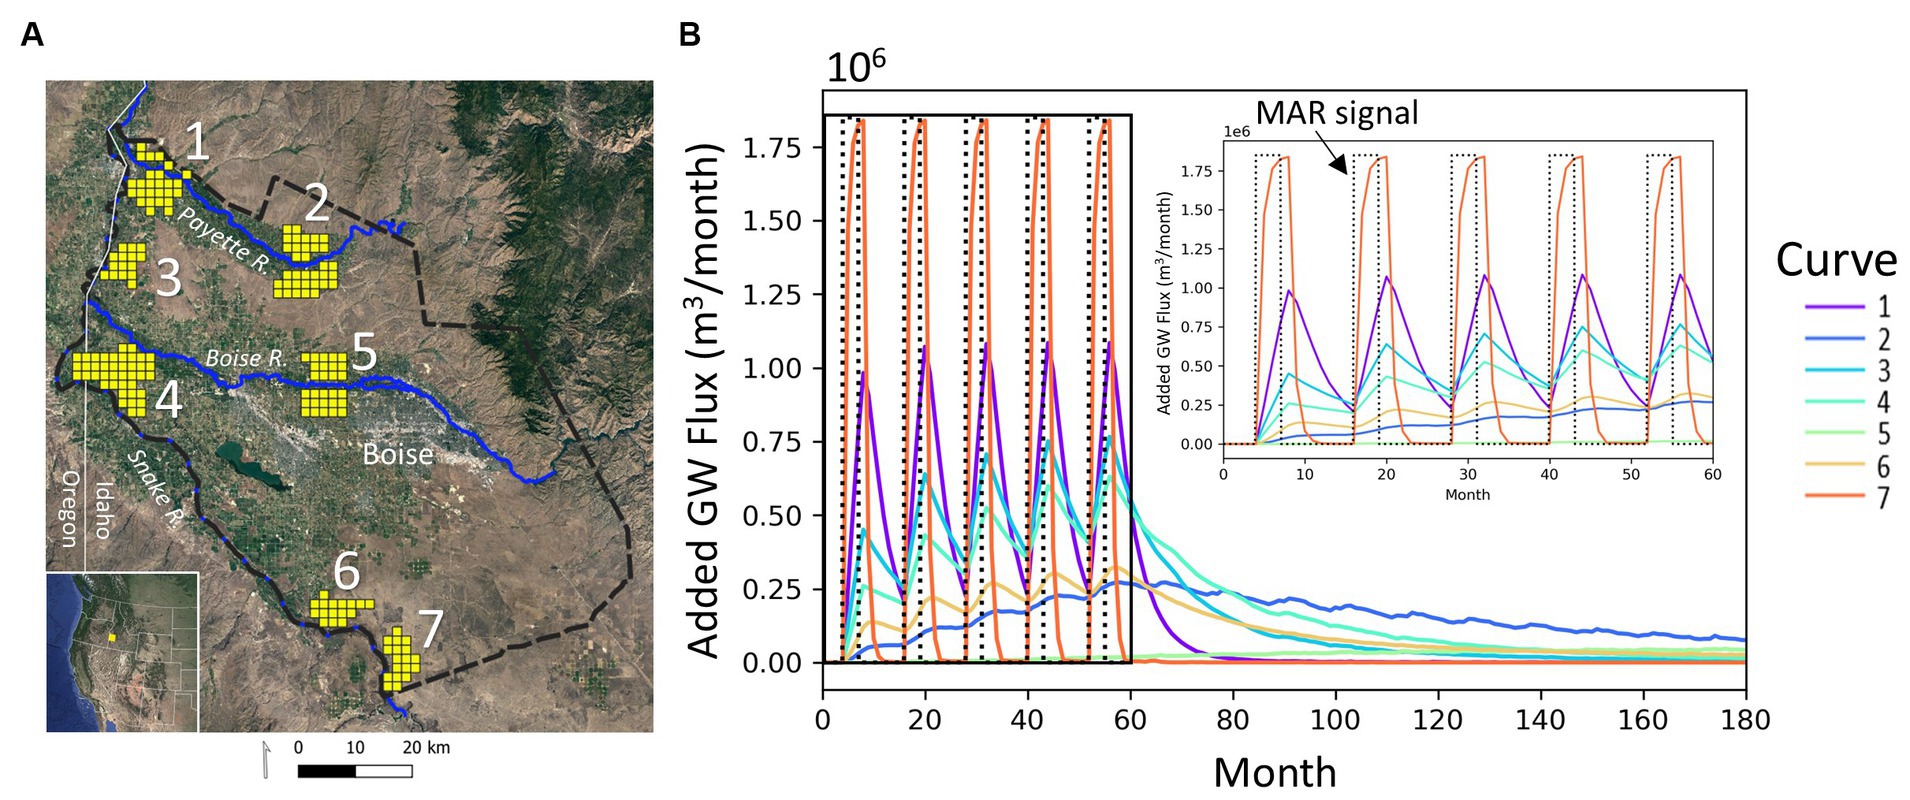
Figure 1. (A) Location of Treasure Valley aquifer study area with model domain (dashed black line), rivers represented in the model (blue lines), and the seven MAR zones where recharge was simulated at each grid cell, with inset showing the model location in the western United States. (B) Examples of monthly baseflow enhancement from simulated MAR at seven grid cells within the seven MAR zones, with an inset showing the 5 years when MAR was simulated. The MAR pattern is shown in the dotted black line that resembles a square wave.
2.1 Treasure Valley hydrological model
The Treasure Valley Hydrological Model (TVHM) (Hundt, 2023) is a 3D groundwater flow model designed for MODFLOW 6 (Langevin et al., 2017, 2021). The model covers 10,600 km2 and is comprised of 64 rows, 65 columns, and six layers that resolve variation of hydrogeologic properties with laterally and with depth in the model domain. The domain is horizontally discretized into a 1.6 km x 1.6 km orthogonal grid, while the vertical spacing varies based on the hydrogeological layer data (Example cross sections in SI Figure 1). Subsurface properties reflect the dominant four lithologies in the region: unconsolidated alluvial sediments, fine lacustrine sediments, basalt, and metamorphic basement (Bartolino, 2019, lithological descriptions in SI).
The model includes the major rivers in the basin (Figure 1A), defined by the RIV package in MODFLOW 6. The RIV package enables bi-directional flux between groundwater and SW dictated by the head difference between the groundwater and the SW elevation in the corresponding river cell. In addition to representing the major rivers in the model domain, the model uses the DRN package to represent baseflow-fed drains in the irrigated regions of the model domain that drain shallow groundwater to the major rivers (SI Figure 2). The DRN package allows groundwater to leave the model domain without exiting via a river cell. Hydrogeologic parameters and river and drain conductance were calibrated by the model designers using PEST (Doherty, 2005) to match to historical head measurements in groundwater wells and match baseflow observations in the drain canals.
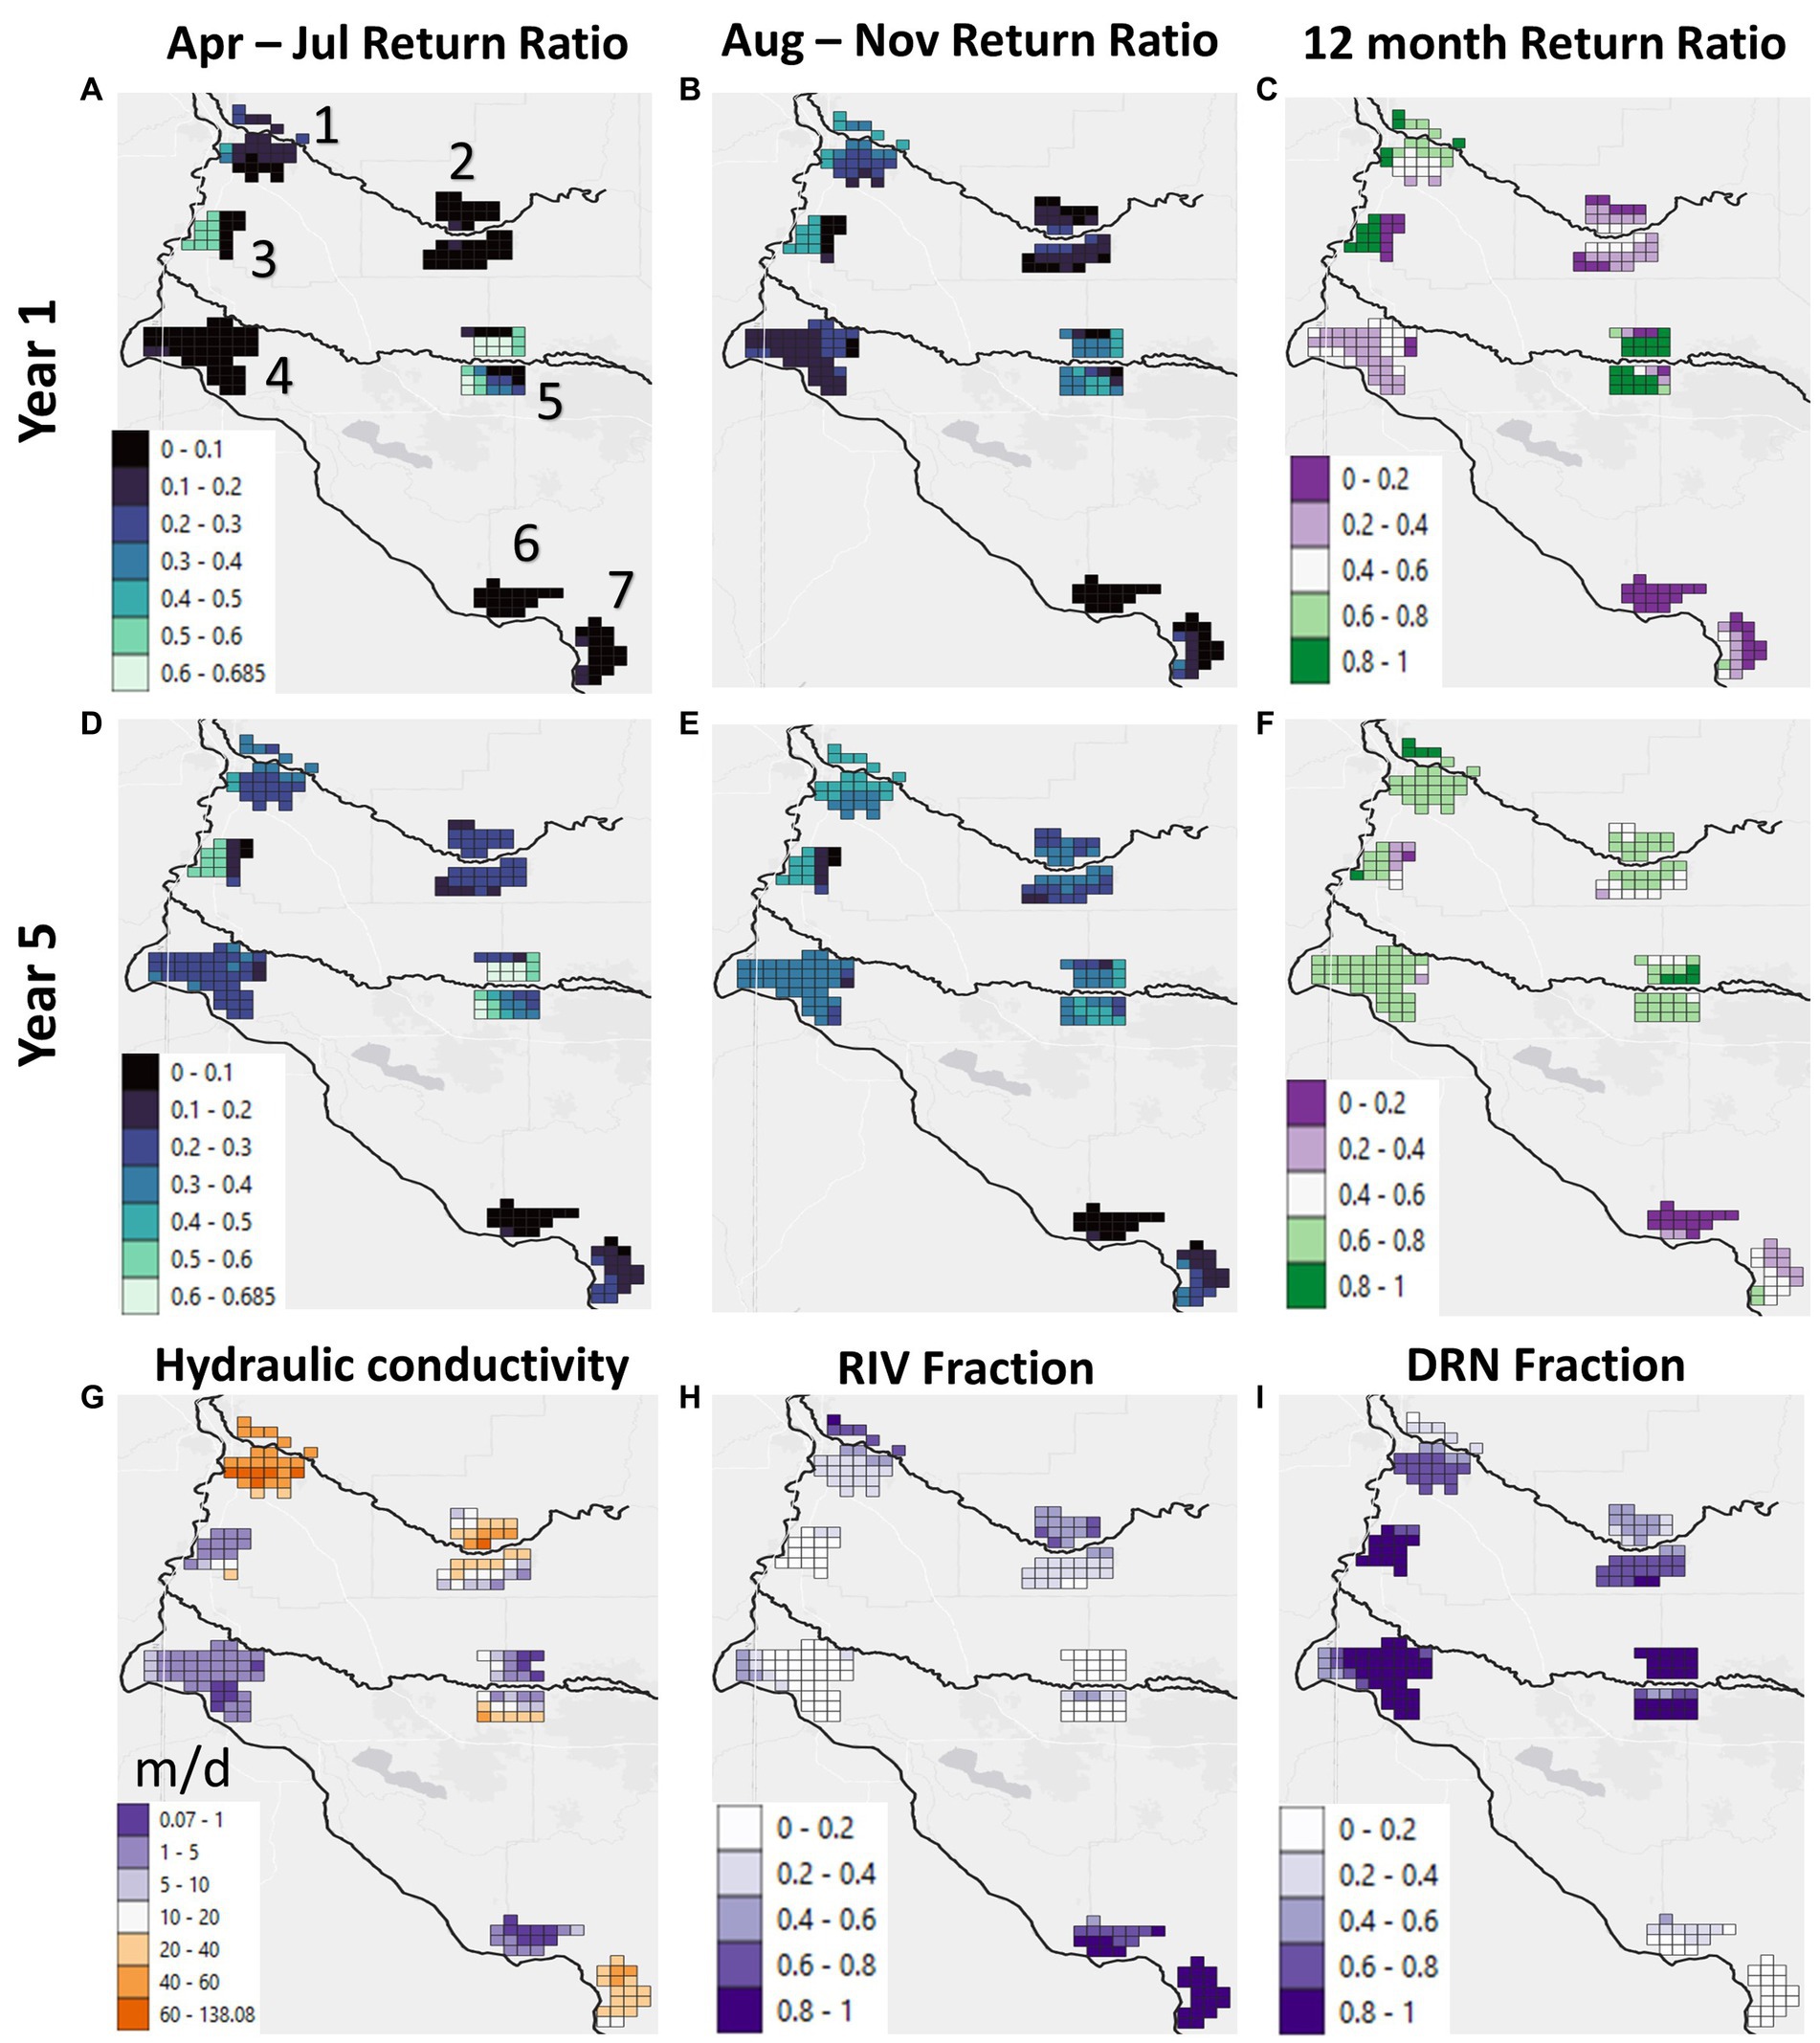
Figure 2. Return ratios (RRs) for the April – July recharge period in year 1 and 5 (A,D), August – November RRs during the 4 months following recharge (B,E), and 12-month RRs in Year 1 and Year 5 (C,F). Hydraulic conductivity for the MAR grid cells (G), and the fraction of baseflow from each candidate MAR grid cell that went to river cells (RIV) (H) or drain cells (DRN) (I).
The model runs at monthly time steps, spanning the 25-year historical period from 1986 to 2010. The model includes anthropogenic influences on hydrological fluxes in the form of gridded transient recharge that captures historical SW irrigation and canal leakage as well as groundwater pumping for both municipal supply and irrigation.
2.2 Modeling approach
The baseflow response to MAR was iteratively evaluated at 197 locations spatially distributed over 7 candidate MAR zones (Figure 1A). The zones were chosen arbitrarily but spaced across portions of the domain with differing hydrogeologic units in the unconfined top layer and chosen to avoid regions with heavily pumped groundwater (SI Figures 3, 4). Zones 2 and 3 are in a mixture of coarse-grained fluvial and alluvial sediments and fine-grained lacustrine sediments; Zones 1, 4, and 5 are mostly fine-grained alluvial sediments; and Zones 6 and 7 are basalt. All MAR cells were screened to be within 5 km of a river cell.
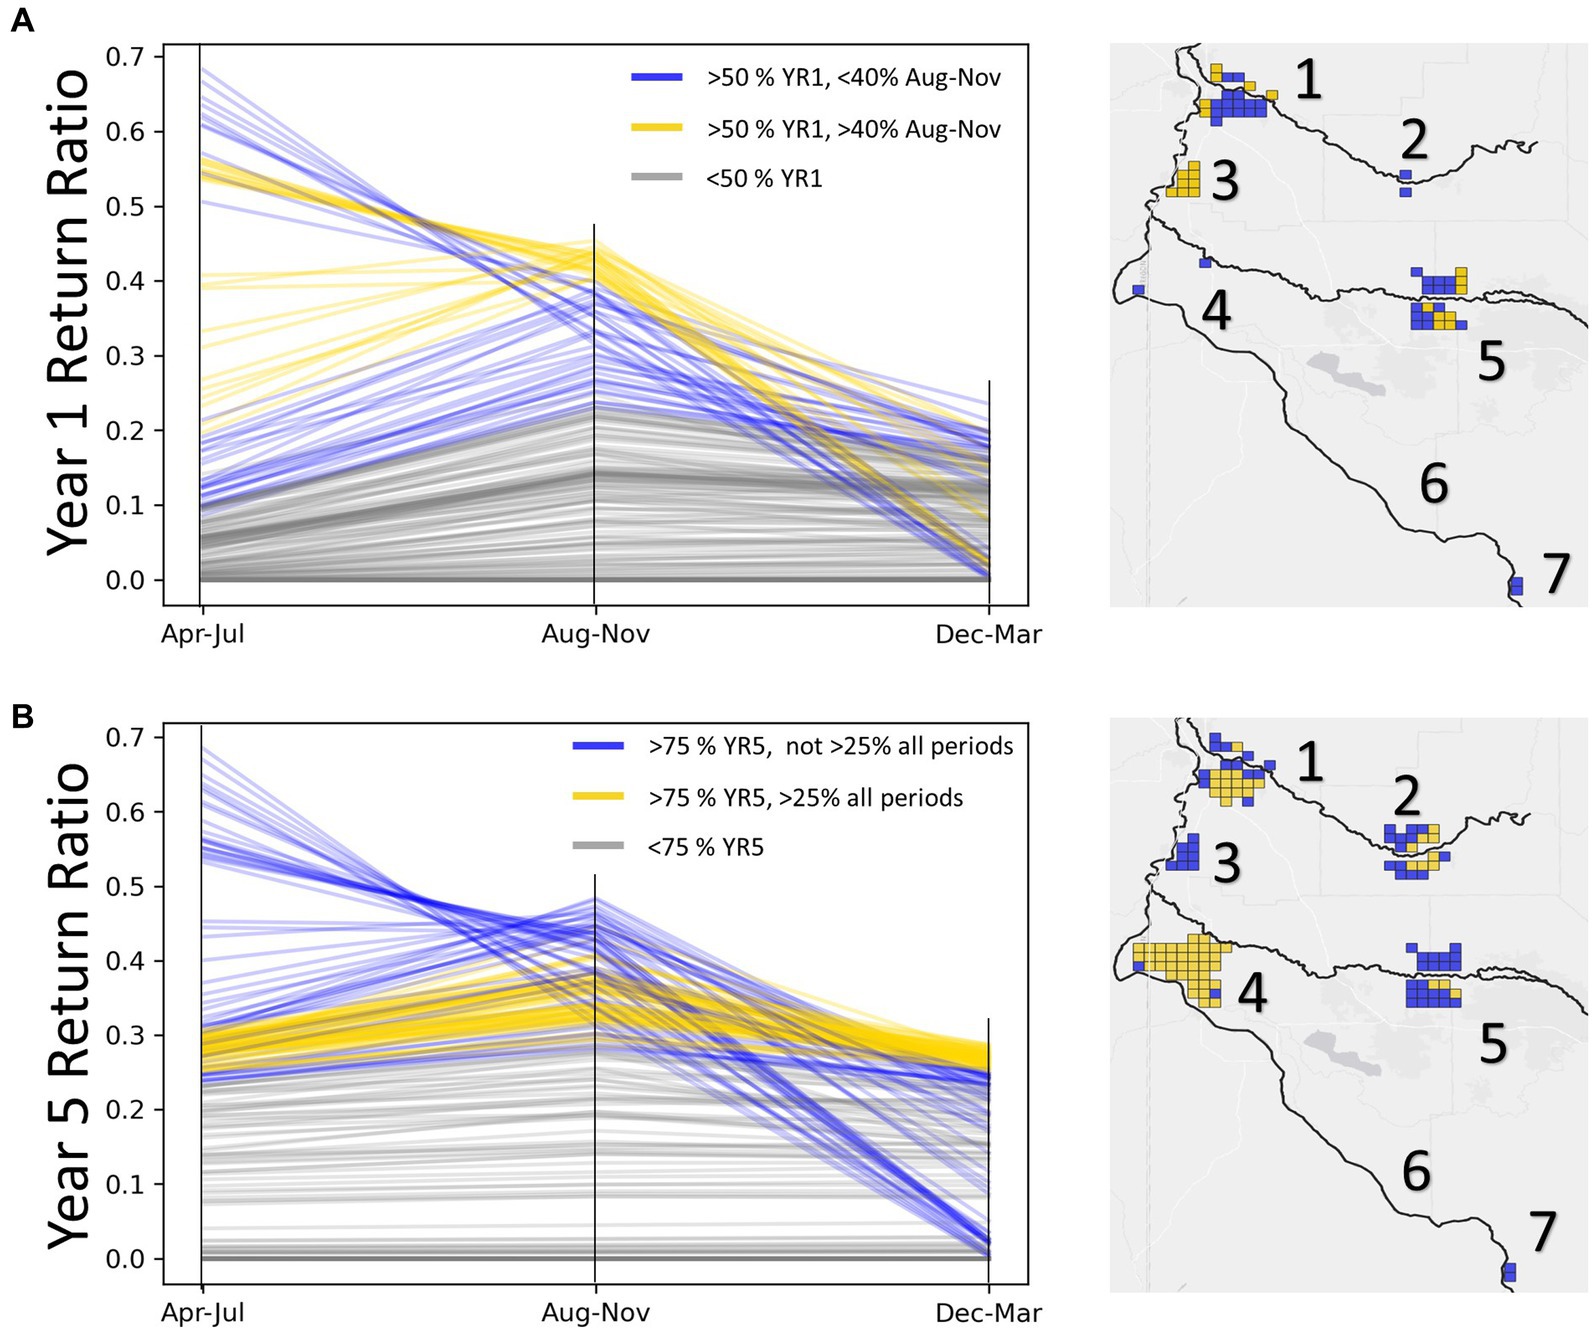
Figure 3. Return fractions during Apr-Jul, Aug-Nov, and Dec-Mar periods for all 197 locations in year 1 (A) and year 5 (B). Locations satisfying the 12-month return fraction criteria in blue and locations satisfying the additional period-specific criteria in gold. Locations satisfying one or both criteria are mapped. Numbers denote MAR Zones.
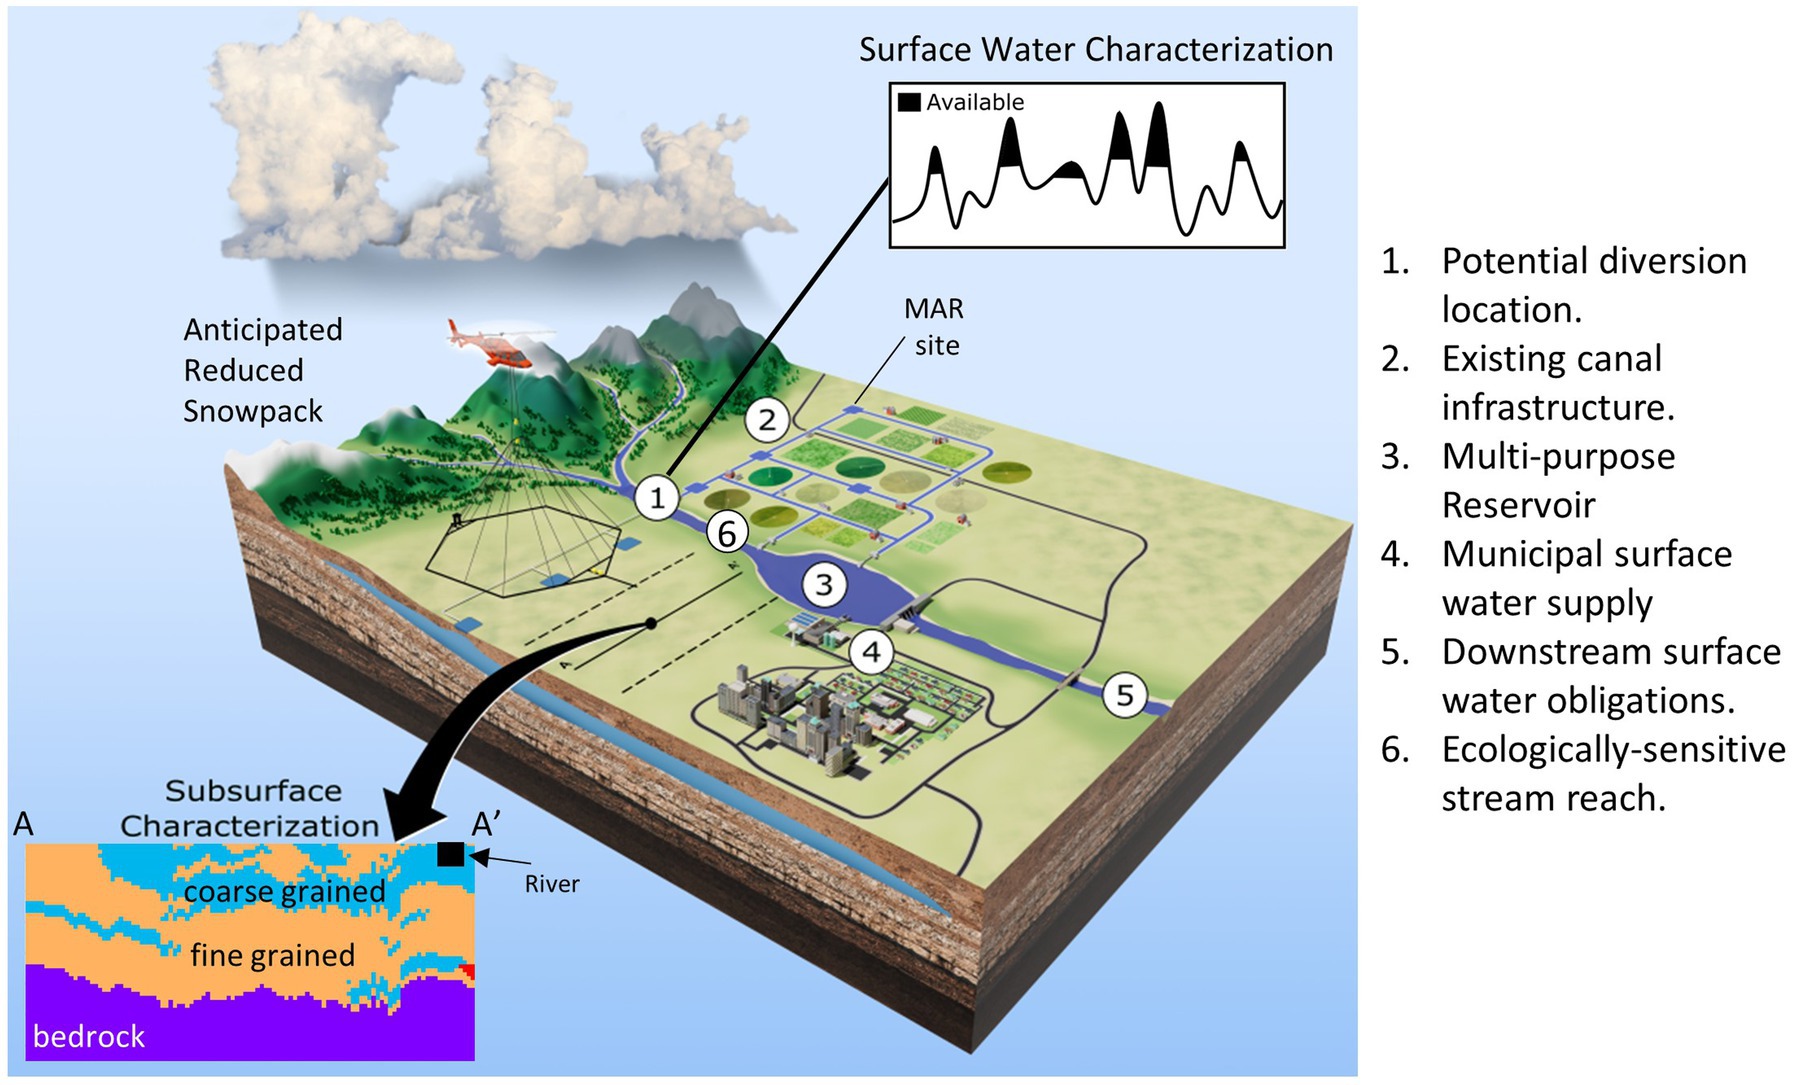
Figure 4. Water management considerations in a hypothetical snow-melt-reliant region where MAR for enhanced baseflow is being considered as an adaptive management strategy. The region has multiple considerations such as SW demand for farming, municipal supply, and reservoir operations. Upper right inset shows SW available for MAR (filled black portion) at a potential diversion location. Lower left inset shows a hypothetical example of subsurface lithology determined via airborne EM.
Iterative execution of simulating MAR recharge at each candidate grid cell was streamlined using FloPy (Bakker et al., 2016, 2021), a Python interface for MODFLOW. Managed aquifer recharge was represented by modifying the TVHM to incorporate an additional WEL input file that defined a transient recharge signal at the MAR cell under consideration. We use a hypothetical MAR signal (dashed line Figure 1B) representative of diverting a portion of early season surface flows from April to July at a rate of 61,650 m3/day (50 acre-ft/day), a reasonable rate for an individual MAR site (Smith and Pollock, 2012). Our analysis was not concerned with representing a specific type of MAR approach and the grid-cell level recharge simply represents the net MAR occurring in the unconfined layer at each candidate cell. For each MAR candidate cell, the full 25-year simulation was run to track the baseflow response during and following the MAR period. The change to baseflow (“enhancement”) resulting from a MAR scenario was quantified by differencing the simulations with MAR against a baseline baseflow time series neglecting MAR.
2.3 Quantifying MAR performance
In contrast with traditional MAR where it is desirable to minimize the losses to SW and achieve long-term accumulation of storage (Scanlon et al., 2016), the goal for enhanced baseflow is for the aquifer to delay but not permanently retain recharged water. To this end, we created metrics to quantify salient information to SW management, such as when additional baseflow occurs and the amount of baseflow enhancement during different times of the year. Our approach was to quantify the MAR return ratio (RR or RRs for plural), the ratio of recharged volume to enhanced baseflow, over three different time periods (April – July, August – November, and December – March) and also over the 12-month period from when MAR starts in April to the following March. The April–July RR describes what fraction of recharge returns during the MAR period, also when demand for SW from irrigation can be high. The August–November RR captures much recharge returns in the late summer and early fall when flows are typically low, instream flows are commonly an issue, SW ecosystems can be stressed, and demands from irrigation can still be present. Last, the Dec-Mar RR accounts for returns during the winter months. Depending on the specific management objectives, there could be benefits of returns being more concentrated in a given period or spread uniformly across the water year.
3 Results
3.1 Enhanced Baseflow response signals
The modeling revealed a wide range of enhanced baseflow responses (Supplemental Information, Figure S5). A subset of representative responses were selected to illustrate the types of responses (Curves 1–7, Figure 1B). At some locations, the baseflow response closely resembles the recharge signal in timing and magnitude (Curve 7), whereas in other locations added baseflow was highly attenuated (Curves 2 and 6). Locations with less attenuated baseflow responses tend to have more rapid recessions after MAR is terminated (Curves 1 and 7). At locations with more attenuation (Curves 2, 4, and 6), the tail of the recession can be very long, in some cases having enhanced baseflows 50% of the peak value more than 5 years after recharge ended. The variety of response types suggests that a combination of locations could be used to benefit both short-term (seasonal or same-year) flows and also enhance baseflow over longer periods.
3.2 Mapping MAR response metrics
Mapped RR metrics for all 197 locations show distinct spatial patterns in enhanced baseflow response characteristics across the seven candidate MAR zones (Figure 2). The Apr-Jul, Aug-Nov, and total 12-month return ratios (April through March) were quantified for the first (Year 1) and fifth (Year 5) years of MAR operation (Figures 2A–F). Additionally, hydraulic conductivity (K) and fraction of enhanced baseflow that returned to a river cell versus via a drain cell (baseflow in a tributary to the main rivers) are shown to aid interpretation of the RR results (Figures 2G–I).
Year-1 results (Figures 2A–C) show how “flashy” each candidate MAR location is (i.e., how quickly MAR becomes baseflow). The baseflow response at the flashy cells resemble Curves 1 and 7 in Figure 1B. From a management perspective, quick return times could be desirable if MAR is intended to enhance surface flows within the same year. A small number of locations, mostly in Zones 1, 3, and 5, show very high Year 1 RRs, some above 90%. Zones 3 and 5 had the highest Apr-Jul RRs and had similar ratios for Aug-Nov as Zone 1. Zones 2, 4, 6, and 7 had Apr-Jul RRs less than 10%, Aug-Oct less than 20%, and Year-1 ratios less than 40%. Interestingly, other than Zone 1, there is not a clear relationship between the various Year 1 RRs and hydraulic conductivity; some of the highest K values are in Zone 7 which has RRs similar to the other group with low RRs (Zones 2, 4). The flashy locations in Zones 1, 3, and 5 show more of a resemblance to the river and drain fraction distributions than the K distribution, with high Year-1 April–July and August–November RRs being associated with high drain fractions. The physical interpretation of this relationship is that drains act as shortcuts for the recharge to exit the subsurface as baseflow rather than having to travel a longer distance to a river cell (RIV).
Year-5 results provide information on how continuous operation of MAR influence RR characteristics (Figures 2D–E). The RRs for the flashy locations show insignificant differences in Year 5; this is the case because the Year-1 behavior is repeats in every subsequent year. In contrast, locations in Zones 1, 2, 4, and 7 show increases in Apr-Jul, Aug-Nov, and total Year-5 RRs. Zones whose RRs are notably different in Year 5 compared to Year 1 have more lag in their baseflow response, similar to Curves 2, 3, and 4 in Figure 1B. Due to this lag, these locations generate increasing baseflow with each year of operation, until reaching a quasi-steady state (Figure 1B). Another aspect of more lagged responses is that they tend to have less seasonal variability and produce more constant enhanced baseflow, which is reflected by high annual RRs (60–80%), but low return ratios during Apr-Jul and Aug-Nov compared to the flashy locations (Figures 2D–F). Notably, even for Year 5 the RRs for Zone 6 remain very low, and this is the only zone in which all grid cells have low RRs, unique in having low K and low DRN connectivity (Figures 2G,I).
3.3 Identifying suitable MAR locations based on hypothetical management objectives
The monthly baseflow enhancement results can also be used to screen suitable locations for MAR based on specific enhancement criteria. Two examples are used to demonstrate this, one using the Year-1 results reflecting a single year of operation and the other using Year 5 to assess a scenario where MAR is operated over a longer time period.
For Year 1, locations are screened according to two management objectives: at least 50% of the recharged water returns as baseflow within the first year and at least 40% of the returns occur during the Aug-Nov period. Locations that satisfy the former objective are mainly located in Zones 1, 3, and 5, whereas the subset of locations that satisfy the second objective are distributed similarly between Zones 1, 3, and 5, each having between 6 and 8 cells (Figure 3A). In total, 57 cells (28.9%) met the first objective and only 22 (11.1%) cells satisfied both of the Year-1 objectives. No locations in Zones 2, 4, 6, and 7 satisfied both criteria (Figure 3A). Suitable locations for Year 1 favor Zones characterized by high K and high drain fractions, which increase the propagation rate of recharge via subsurface flow (high K) and also reduce the subsurface travel distance (drains).
The management objective for the Year-5 case calls for 75% of the Year-5 recharged water to return within Year 5 and further screened for locations that provide high levels of constant, year-round baseflow by having at least 25% return ratios in each of the three, four-month periods. Almost two thirds (60.9%) of cells met the 75% 12-month return ratio target, but only 62 (31.5%) locations met both criteria. Although Zone 4 had no locations that met the criteria, it had the majority of suitable locations for the Year-5 criteria (Figure 3B). No locations in Zones 3, 6, or 7 met the Year-5 criteria (Figure 3B). Unlike Year 1, suitable locations for Year 5 are not associated with specific K and drain attributes. Instead, different combinations of zonal characteristics such (1) as higher K and higher river fractions (Zone 2) or (2) lower K and high drain fractions (Zone 4) both attenuate the MAR signal in a way that produces high seasonal RRs (>25%). The fact that Zone 7 (high K and high river fraction, similar to Zone 2) does not satisfy the Year 5 criteria highlights the value in modeling recharge processes to characterize the enhanced baseflow response when screening for MAR site-suitability.
4 Discussion
4.1 Benefits and considerations of using an existing GW model
Our results demonstrate how an existing GW model can be an effective screening tool for initial MAR for enhanced baseflow suitability. Some key benefits of using a regional GW model to evaluate the baseflow response over more conceptual approaches, such as analytical solutions (Knight et al., 2005) or simplified 2D models (Szabó et al., 2023) is that the numerical model is able to account for (1) anthropogenic effects (pumping, additional recharge from SW irrigation) that can alter the baseflow response, (2) geological heterogeneity that may control local hydraulic connection to rivers or boundaries, and (3) the effects of transient hydrologic conditions such as river stage, periodic well pumping, irrigation, and changing water table elevations that can alter the baseflow response (Kendy and Bredehoeft, 2006; Ferencz and Tidwell, 2022). This study benefitted from the regional model being designed in MODFLOW 6, which is compatible with FloPy. Other model types and legacy versions of MODFLOW would present additional challenges for representing key processes and iterative model execution for MAR evaluation.
Care should be given when using an existing model that the spatial and temporal resolution and physical and process representation are appropriate for MAR evaluation and siting. An example of physical representation would be if the THVM did not include the effects of irrigation drains. The high percentage of baseflow leaving the model from drain cells (Figure 2) show that drains create a shortcut for the return of MAR recharge to the SW system. Without the drains, the suitability of sites with respect to recharge returns would be substantially different. Regarding spatial resolution, the coarse resolution of the TVHM cannot capture the local water-table recharge response of an infiltration basin, so it would not be appropriate for determining the field-scale water-table response at recharge basins. Further characterization could involve embedded refined sub-models to evaluate recharge and baseflow dynamic at locations identified at coarser resolution (Leaf and Fienen, 2022). We ensured that the recharge rates in this study did not raise of the water table above the ground surface by checking water table elevations in each MAR grid cell. Higher resolution sub-models could evaluate water-table dynamics near hypothetical recharge basins to ensure there are no negative impacts on agriculture such as root-zone flooding (Kourakos et al., 2019).
4.2 Using geophysics to AID regional and site characterization
In regions without a groundwater model and with sparse field data to inform model development, reconnaissance geophysical surveys could be a cost-effective method to gather data on subsurface structure and lithology. For example, airborne electromagnetic (EM) surveys (Figure 4) have been used to identify transitions between surficial alluvial aquifers and underlying bedrock or fine-grained materials (Knight et al., 2018; Minsley et al., 2021) Regional geophysical surveys, combined with borehole data, can aid the development of a hydrogeologic model used for exploratory groundwater modeling and site characterization. In regions with an existing groundwater model, such as the Treasure Valley Aquifer, geophysical surveys can support development or refinement of the hydrogeologic framework model, which is critical to representing the hydraulic connection of groundwater and SW, the accuracy of modeling results, and, ultimately, model-based identification of MAR sites, as demonstrated in this work.
4.3 Other factors to consider when evaluating MAR for enhanced baseflow
Although the focus of this work was on identifying locations that have favorable baseflow enhancement characteristics (e.g., have high RRs and are compatible with SW management objectives), there is a flow-regime and institutional characterization component that is equally important when evaluating the suitability of MAR for baseflow. Before significant effort is expended characterizing MAR suitability, characterization is required of the flow regime and the status of institutional and legal obligations of SW (downstream uses, water rights, environmental flows) that affect when and how much unallocated streamflow is available for MAR (Figure 4). For example, in the Eastern Snake River Aquifer, Idaho, availability of SW for MAR depends on spring streamflow (Hipke et al., 2022). In dry years, no SW is available for MAR because of the needs of downstream users (e.g., farms, municipalities, hydro-electric power, and environmental flows), while in wet years there is excess available water beyond infrastructure capacity to fully divert and recharge (Hipke et al., 2022). The efficacy of MAR for baseflow enhancement thus depends critically on the frequency and volume of available unallocated water. In addition to SW availability, SW water quality issues should also be carefully evaluated to ensure that MAR does not harm GW quality, either by introducing SW contaminants into the subsurface (Alam et al., 2021) or by altering groundwater chemistry in a way that mobilizes harmful contaminants (Fakhreddine et al., 2021). Such considerations are beyond the scope of this study but should be carefully considered when evaluating implementation of MAR.
In reality, site suitability will likely be a tradeoff between the aforementioned SW flow regime suitability and existing SW obligations, financial constraints, and management objectives. A few examples of potential management objectives are shown in Figure 4, such as: (1) enhancing SW availability for conjunctive use such as increasing SW availability for summer irrigation, (2) helping meet environmental flow targets for ecologically sensitive stream segments in basins that lack an upstream reservoir that can perform managed releases, or (3) enhancing reservoir inflows during dry months in basins where excess snowmelt flows would otherwise be released downstream.
An important consideration is the tradeoff between MAR performance (infiltration capacity, timing and magnitude of enhanced baseflow) and cost. A cost/benefit analysis of the unit cost of enhanced baseflow versus the value of end-uses (e.g., hydropower, environmental flows, irrigation, municipal supply) may indicate that a less optimal location may be a better choice for MAR on a unit-cost basis compared to the cost of obtaining and routing water to a more optimal recharge location. One way to reduce costs is to leverage existing infrastructure, such as existing diversion locations and canals (Figure 4). Another cost–benefit consideration is the proportional enhancement of baseflow. For example, the location of MAR sites (near smaller tributaries vs. the main river) could influence how beneficial they are to low flow enhancement. For example, several 50 acft/day MAR sites along the Boise or Payette rivers (Figure 1A) could potentially double summer low flows, but several sites along the Snake River (Figure 1A) would only increase summer low flows by a few percent.
5 Closing remarks
The goals of this study were threefold. First, introduce the concept of MAR for enhanced baseflow as an approach for water management to reallocate streamflow during high flow periods to later periods when there are lower flows and possibly more demand. Second, demonstrate how regional groundwater models can be utilized as an initial screening tool to identify favorable locations (i.e., where enhanced baseflow suits regional management objectives) for further characterization. Third, describe considerations for implementing MAR for enhanced baseflow in a real-world setting such as SW availability, management objective, cost/benefit tradeoffs, and water quality.
MAR for enhancing baseflow has the potential to be an adaptive strategy for reducing the vulnerability of snowmelt hydrologic regimes to earlier and more rapid snowmelt recharge by redistributing some of the early season flows as baseflow. In addition to facing the challenge of identifying suitable recharge locations, the use of MAR for enhancing baseflow faces the added challenge of locating recharge such that the return flow benefits the management objectives of the SW system. MAR for enhanced baseflow is a largely unexplored water-management strategy with ample opportunities for further research into site characterization methods (e.g., geophysical characterization, regional models with refined sub-models that represent individual infiltration basins), modeling approaches to represent MAR operations in a dynamic real-world setting (e.g., modeling the operation of MAR sites that consider transient SW availability, quantifying local and regional scale changes in SW availability due to enhanced baseflow), and cost–benefit analysis compared to other management approaches.
Data availability statement
The raw data supporting the conclusions of this article will be made available by the authors, without undue reservation.
Author contributions
SF: Analysis, Writing – review & editing, Writing – original draft. AM: Funding, Writing – review & editing, Writing – original draft. FD-L: Funding, Writing – review & editing, Writing – original draft.
Funding
The author(s) declare that financial support was received for the research, authorship, and/or publication of this article. This work was funded by the US Department of Energy Water Power Technology Office and performed at the Pacific Northwest National Laboratory (PNNL). PNNL is operated by Battelle Memorial Institute for the U.S. Department of Energy under Contract DE-AC05-76RL01830.
Acknowledgments
We thank Stephen Hundt of the USGS who helped answer questions about the TVHM and Mike Perkins who made the landscape graphic for Figure 4. We also thank Jim Yoon at PNNL and the two reviewers for providing thoughtful feedback that improved the manuscript.
Conflict of interest
The authors declare that the research was conducted in the absence of any commercial or financial relationships that could be construed as a potential conflict of interest.
Publisher’s note
All claims expressed in this article are solely those of the authors and do not necessarily represent those of their affiliated organizations, or those of the publisher, the editors and the reviewers. Any product that may be evaluated in this article, or claim that may be made by its manufacturer, is not guaranteed or endorsed by the publisher.
Supplementary material
The Supplementary material for this article can be found online at: https://www.frontiersin.org/articles/10.3389/frwa.2024.1375523/full#supplementary-material
References
Alam, S., Borthakur, A., Ravi, S., Gebremichael, M., and Mohanty, S. K. (2021). Managed aquifer recharge implementation criteria to achieve water sustainability. Sci. Total Environ. 768:144992. doi: 10.1016/j.scitotenv.2021.144992
Bakker, M., Post, V., Hughes, J. D., Langevin, C. D., White, J. T., Leaf, A. T., et al. (2021). FloPy v3.3.5 - release candidate: U.S. Geological Survey software release, 2021. Reston, Virginia: U.S. Geological Survey.
Bakker, M., Post, V., Langevin, C. D., Hughes, J. D., White, J. T., Starn, J. J., et al. (2016). Scripting MODFLOW model development using python and FloPy. Groundwater 54, 733–739. doi: 10.1111/gwat.12413
Barnett, T. P., Adam, J. C., and Lettenmaier, D. P. (2005). Potential impacts of a warming climate on water availability in snow-dominated regions. Nature 438, 303–309. doi: 10.1038/nature04141
Bartolino, J.R. , (2019), Hydrogeologic framework of the Treasure Valley and surrounding area, Idaho and Oregon: U.S. Geological Survey scientific investigations report 2019–5138. Reston, Virginia: U.S. Geological Survey.
Brown, T. C., Mahat, V., and Ramirez, J. A. (2019). Adaptation to future water shortages in the United States caused by population growth and climate change. Earths Future 7, 219–234. doi: 10.1029/2018EF001091
Cohen, J. S., Zeff, H. B., and Herman, J. D. (2020). Adaptation of multiobjective reservoir operations to snowpack decline in the Western United States. J. Water Resour. Plan. Manag. 146, 1–17. doi: 10.1061/(ASCE)WR.1943-5452.0001300
Dillon, P. (2005). Future management of aquifer recharge. Hydrogeol. J. 13, 313–316. doi: 10.1007/s10040-004-0413-6
Doherty, J.E. , (2005), PEST, model-independent parameter estimation—User manual (5th Edn.) Brisbane, Australia, Watermark Numerical Computing.
Fakhreddine, S., Prommer, H., Scanlon, B. R., Ying, S. C., and Nicot, J. P. (2021). Mobilization of arsenic and other naturally occurring contaminants during managed aquifer recharge: a critical review. Environ. Sci. Technol. 55, 2208–2223. doi: 10.1021/acs.est.0c07492
Ferencz, S. B., and Tidwell, V. C. (2022). Physical controls on irrigation return flow contributions to stream flow in irrigated alluvial valleys. Front. Water 4:828099. doi: 10.3389/frwa.2022.828099
Ficklin, D. L., Stewart, I. T., and Maurer, E. P. (2013). Climate change impacts on streamflow and subbasin-scale hydrology in the upper Colorado River basin. PLoS One 8:e71297. doi: 10.1371/journal.pone.0071297
Gibson, M. T., Campana, M. E., and Nazy, D. (2018). Estimating aquifer storage and recovery (ASR) regional and local suitability: a case study in Washington state, USA. Hydrology 5:7. doi: 10.3390/hydrology5010007
Hipke, W., Thomas, P., and Stewart-Maddox, N. (2022). Idaho's eastern Snake plain aquifer managed aquifer recharge program. Groundwater 60, 648–654. doi: 10.1111/gwat.13214
Huang, X. Y., Hall, A. D., and Berg, N. (2018). Anthropogenic warming impacts on Today's Sierra Nevada snowpack and flood risk. Geophys. Res. Lett. 45, 6215–6222. doi: 10.1029/2018GL077432
Hundt, S. A. (2023). Data and archive for a groundwater flow model of the Treasure Valley aquifer system, southwestern Idaho, 1986-2015: U.S. Geological Survey data release. doi: 10.5066/P9U6OOPH
Hundt, S. A., and Bartolino, J. R. (2023). Groundwater-flow model of the Treasure Valley, southwestern Idaho, 1986–2015: U.S. Geological Survey scientific investigations report 2023–5096. Reston, Virginia: U.S. Geological Survey, 107.
Kapnick, S., and Hall, A. (2010). Observed climate-snowpack relationships in California and their implications for the future. J. Clim. 23, 3446–3456. doi: 10.1175/2010JCLI2903.1
Kendy, E., and Bredehoeft, J. D. (2006). Transient effects of groundwater pumping and surface-water-irrigation returns on streamflow. Water Resour. Res. 42, 1–11. doi: 10.1029/2005WR004792
Knight, J. H., Gilfedder, M., and Walker, G. R. (2005). Impacts of irrigation and dryland development on groundwater discharge to rivers - a unit response approach to cumulative impacts analysis. J. Hydrol. 303, 79–91. doi: 10.1016/j.jhydrol.2004.08.018
Knight, R., Smith, R., Asch, T., Abraham, J., Cannia, J., Viezzoli, A., et al. (2018). Mapping aquifer systems with airborne electromagnetics in the Central Valley of California. Groundwater 56, 893–908. doi: 10.1111/gwat.12656
Kourakos, G., Dahlke, H. E., and Harter, T. (2019). Increasing groundwater availability and Seasonal Base flow through agricultural managed aquifer recharge in an Irrigated Basin. Water Resour. Res. 55, 7464–7492. doi: 10.1029/2018WR024019
Langevin, C. D., Hughes, J. D., Banta, E. R., Niswonger, R. G., Panday, S., and Provost, A. M. (2017). Documentation for the MODFLOW 6 groundwater flow model. Reston, VA: U.S. Geological Survey Techniques and Methods, 197.
Langevin, C. D., Hughes, J. D., Banta, E. R., Provost, A. M., Niswonger, R. G., and Panday, S. (2021). MODFLOW 6 modular hydrologic model version 6.2.2. U.S. Geological Survey software release 2021. Reston, Virginia: U.S. Geological Survey.
Leaf, A. T., and Fienen, M. N. (2022). Modflow-setup: robust automation of groundwater model construction. Front. Earth Sci. 10:903965. doi: 10.3389/feart.2022.90396
Lee, H., Koo, M. H., and Oh, S. (2019). Modeling stream-aquifer interactions under seasonal groundwater pumping and managed aquifer recharge. Groundwater 57, 216–225. doi: 10.1111/gwat.12799
Minsley, B. J., Rigby, J. R., James, S. R., Burton, B. L., Knierim, K. J., Pace, M. D. M., et al. (2021). Airborne geophysical surveys of the lower Mississippi Valley demonstrate system-scale mapping of subsurface architecture. Commun. Earth Environ. 2:131. doi: 10.1038/s43247-021-00200-z
Niswonger, R. G., Morway, E. D., Triana, E., and Huntington, J. L. (2017). Managed aquifer recharge through off-season irrigation in agricultural regions. Water Resour. Res. 53, 6970–6992. doi: 10.1002/2017WR020458
O'Geen, T. A., Saal, M., Dahlke, H., Doll, D., Elkins, R., Fulton, A., et al. (2015). Soil suitability index identifies potential areas for groundwater banking on agricultural lands. Calif. Agric. 69, 75–84. doi: 10.3733/ca.v069n02p75
Russo, T. A., Fisher, A. T., and Lockwood, B. S. (2015). Assessment of managed aquifer recharge site suitability using a GIS and modeling. Groundwater 53, 389–400. doi: 10.1111/gwat.12213
Scanlon, B. R., Reedy, R. C., Faunt, C. C., Pool, D., and Uhlman, K. (2016). Enhancing drought resilience with conjunctive use and managed aquifer recharge in California and Arizona (vol 11, 035013, 2016). Environ. Res. Lett. 11, 1–15. doi: 10.1088/1748-9326/11/3/035013
ScienceBase . (2023). United States Geological Survey. Available at: https://www.sciencebase.gov/catalog/ (Accessed December 12, 2023).
Siirila-Woodburn, E. R., Rhoades, A. M., Hatchett, B. J., Huning, L. S., Szinai, J., Tague, C., et al. (2021). A low-to-no snow future and its impacts on water resources in the western United States. Nature Rev. Earth Environ. 2, 800–819. doi: 10.1038/s43017-021-00219-y
Smith, A. J., and Pollock, D. W. (2012). Assessment of managed aquifer recharge potential using ensembles of local models. Ground Water 50, 133–143. doi: 10.1111/j.1745-6584.2011.00808.x
Stewart, I. T., Cayan, D. R., and Dettinger, M. D. (2005). Changes toward earlier streamflow timing across western North America. J. Clim. 18, 1136–1155. doi: 10.1175/JCLI3321.1
Surinaidu, L., Muthuwatta, L., Amarasinghe, U. A., Jain, S. K., Ghosh, N. C., Kumar, S., et al. (2016). Reviving the Ganges water machine: accelerating surface water and groundwater interactions in the Ramganga sub-basin. J. Hydrol. 540, 207–219. doi: 10.1016/j.jhydrol.2016.06.025
Szabó, Z., Szijártó, M., Tóth, A., and Mádl-Szonyi, J. (2023). The significance of groundwater table inclination for nature-based replenishment of groundwater-dependent ecosystems by managed aquifer recharge. Water 15. doi: 10.3390/w15061077
Van Kirk, R. W., Contor, B. A., Morrisett, C. N., Null, S. E., and Loibman, A. S. (2020). Potential for managed aquifer recharge to enhance fish habitat in a Regulated River. Water 12. doi: 10.3390/w12030673
Wasti, A., Ray, P., Wi, S., Folch, C., Ubierna, M., and Karki, P. (2022). 'Climate change and the hydropower sector: a global review', Wiley interdisciplinary reviews-climate. Change 13, 1–29. doi: 10.1002/wcc.757
Keywords: managed aquifer recharge, enhanced baseflow, climate change, water resources, groundwater modeling, MODFLOW
Citation: Ferencz SB, Mangel A and Day-Lewis F (2024) Managed aquifer recharge as a strategy to redistribute excess surface flow to baseflow in snowmelt hydrologic regimes. Front. Water. 6:1375523. doi: 10.3389/frwa.2024.1375523
Edited by:
Thomas C. Harmon, University of California, Merced, United StatesReviewed by:
John Sharp, The University of Texas at Austin, United StatesMichele Vurro, National Research Council, Italy
Copyright © 2024 Ferencz, Mangel and Day-Lewis. This is an open-access article distributed under the terms of the Creative Commons Attribution License (CC BY). The use, distribution or reproduction in other forums is permitted, provided the original author(s) and the copyright owner(s) are credited and that the original publication in this journal is cited, in accordance with accepted academic practice. No use, distribution or reproduction is permitted which does not comply with these terms.
*Correspondence: Stephen B. Ferencz, stephen.ferencz@pnnl.gov
†Present address: Adam Mangel, Haley and Aldrich, Inc., Water Resources Service, Richmond, VA, United States