 Felipe Ugalde
 Gino Casassa
 Cedomir Marangunic1
 Jorge Carrasco
- 1Geoestudios, San José de Maipo, Chile
- 2Centro de Investigación Gaia Antártica, Universidad de Magallanes, Punta Arenas, Chile
- 3Laboratorio de Análisis Isotópico, Facultad de Ingeniería, Universidad Andrés Bello, Viña del Mar, Chile
- 4Dirección General de Aguas, Santiago, Chile
The catastrophic detachment of Aparejo Glacier (one of the three known cases in the Andes) took place on 1 March 1980 and resulted in the removal of an ice volume initially estimated to be 7.2 Mm3, which originally was 1.0 km long and covered an area of 0.2 km2. The event caused the sudden mobilization of the sliding mass 3.7 km down valley at an estimated speed of 110 km/h, causing remarkable geomorphological changes, including the obliteration of most of the glacier. 40 years after the event, we analyze new evidence: 3 ground surveys carried out in 2015 and 2016; DEMs and glacier outlines compiled from orthorectified aerial imagery pre-and post-event; GNSS data; Ground Penetrating Radar (GPR) data; a terrestrial LiDAR scan survey of 2020, together with detailed interviews with 2 direct witnesses of the event, terrestrial and helicopter-borne photographs acquired 12 days after the sudden detachment. The combined interpretation of these new data, allow us to make a more precise estimation of the pre-detachment glacier volume, 12.9 ± 0.6 × 10⁶ m3 and the detached ice volume of 11.7 ± 0.6 × 10⁶ m3 (90% of the total volume of the glacier). We also show that in the 40-year period Aparejo Glacier has recovered 12.4% of the original glacier volume, with a mean ice thickness of 19.5 m and a maximum of 40 m according to GPR data, being preserved within the same basin as the detached glacier. In recent years, the glacier has shown a mean elevation change of −3.7 ± 1.2 m during the 2015–2020 period, with maximum thinning values greater than 8 m, which are probably caused by enhanced ablation due to climate warming and reduced precipitation during the current megadrought which started in 2010 and has lasted more than 1 decade. We conclude that under the projected scenarios of climate warming and reduced precipitation for central Chile, the risk associated to a new detachment of Aparejo Glacier is unlikely.
1 Introduction
A vast number of different types of cryospheric hazards have been reported in Chile such as rock and ice avalanches, glacier surges and Glacier Lake Outburst Floods, or GLOFs (Iribarren Anacona et al., 2015). Notable events include the rock-avalanche and debris flow of Estero Parraguirre (Peña and Klohn, 1989; Casassa and Marangunic, 1993; Hauser, 2002) and the Tinguiririca glacier collapses of 1994 and 2006/2007 (Iribarren Anacona et al., 2015; Kääb et al., 2021), both in central Chile. GLOFs have been reported from the north of Chile (28°S) to Cordillera Darwin in southernmost Tierra del Fuego (56°S), but concentrating mostly in Patagonia, including glacier-dammed GLOFs like those which repeatedly occurred at Cachet 2 Lake and Colonia Glacier (Dussaillant et al., 2010); and moraine-dammed GLOFs like the one occurred at Cerro Largo in Soler Valley (Hauser, 2000). In the Central Andes of Argentina are well documented the GLOFs from the Grande del Nevado del Plomo Glacier since late XVIII century (Iribarren Anacona et al., 2015; Gonzalez et al., 2020), whereas in central Chile at least two GLOFs from Cachapoal Glacier (both in 1847 and 1981) and Juncal Sur Glacier (1954) are accounted for Iribarren Anacona et al. (2015). Falaschi et al. (2018) identified 21 surge-type glaciers in the Central Andes of Chile and Argentina, being the 1786 glacier surge of Grande del Nevado del Plomo Glacier the oldest record to the date. In Chile the surges of Nieves Negras and Juncal Sur Glaciers, in 1927 and 1947, respectively, were first reported by Lliboutry (1956). These events, coupled with glacio-volcanic interactions, like the lahars triggered by Villarrica and Hudson volcanoes in 1971 (Best, 1992; Hauser, 2000) constitute a potential and permanent risk for communities emplaced near glacier environments. Although it has been reported with high confidence the relationship between climate change and the increase in number of glacial lakes around the globe, and thus GLOF susceptibility (Hock et al., 2019), it is also true that today, thanks to advances in remote sensing and new technologies, along with further and deeper research, such as the works of Iribarren Anacona et al. (2015), Falaschi et al. (2018) and Kääb et al. (2021), much more cases of unperceived cryospheric hazards have been reported than before.
One particular type of hazard corresponds to the sudden large-volume collapse of low-angle mountain glaciers. This process consists of the partial to total release of a glacier’s tongue followed by the subsequent massive mobilization of glacier ice, snow and debris down-valley (Jacquemart and Cicoira, 2021; Kääb et al., 2021). Following Jacquemart and Cicoira (2021), the latter phenomena will be referred to as a glacier detachment. Nowadays, glacier detachments have gained more attention worldwide after the events of Kolka Glacier in 2002, resulting in the of 130 Mm3 of ice in the Caucasus, killing 125 people (Kotlyakov et al., 2004; Huggel et al., 2005; Evans et al., 2009), and the detachment of twin glaciers in front of Aru Lake, Tibetan Plateau, during the summer of 2016, resulting in the death of 9 herders and hundreds of animals (Gilbert et al., 2018; Kääb et al., 2018). More recently, a minor glacier detachment of a volume of 4.2 ± 0.6 Mm3, which occurred in 2007, has been reported for Las Leñas Glacier in the central Argentinean Andes, fortunately without casualties or damages (Falaschi et al., 2019). All of these events, along with 17 others around the world, are compiled and described in the work of Kääb et al. (2021). This study refers to the 1980 Aparejo Glacier detachment which occurred on a small catchment tributary to the Yeso River valley, central Chile (−33.5626, −70.0088, Figure 1). Together with the Aparejo event, two separate glacier detachments of the southern glacier of Tinguiririca Volcano constitute the only known cases of sudden large-volume glacier detachments in Chile (Iribarren Anacona et al., 2015; Kääb et al., 2021).
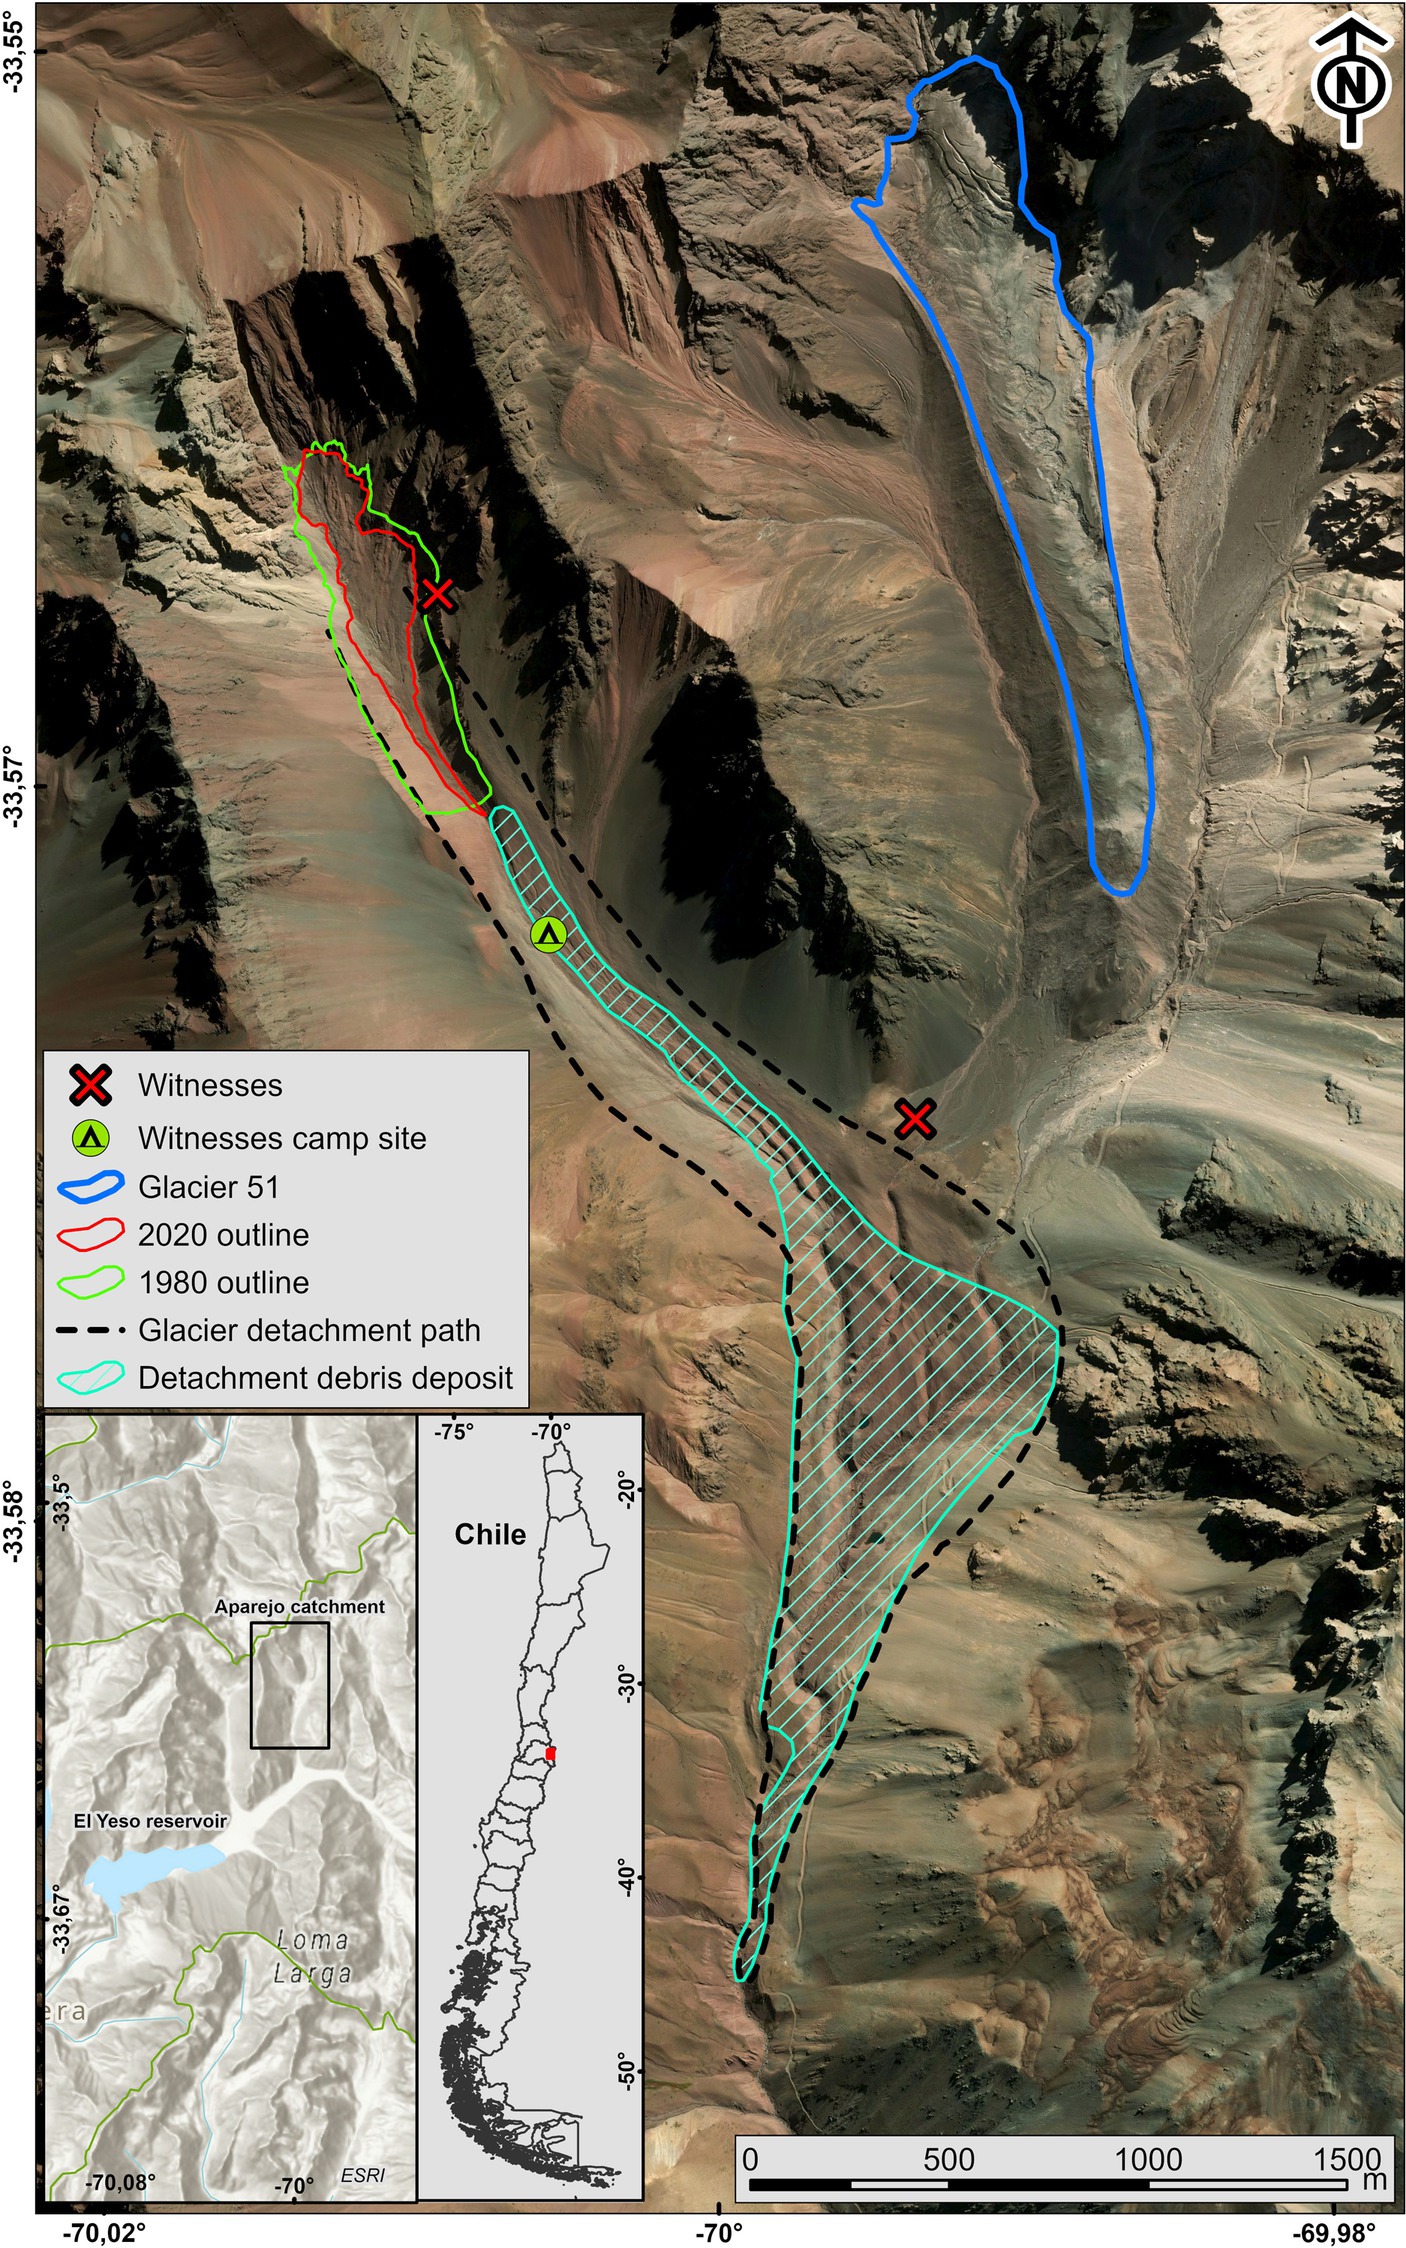
Figure 1. Study area of Aparejo Valley. The thick green line shows the glacier area before the 1980 sudden detachment. The light blue line is the April 2020 glacier outline. The black dashed line is the 1980 detachment path. The hachured area points to the debris deposit after the glacier detachment. The X indicates the location of the two mountaineering groups, witnesses of the 1980 event along with their camp (green circle with a triangle). The mountaineers survived, harmless, after crossing the glacier (upper group, north) and the slide path (lower group, south) less than one minute before the event. Their camp site, luckily with no occupants, resulted completely buried after the Aparejo glacier detachment.
The fact that Aparejo Glacier is still occupying the same basin after its sudden large detachment of 1980, establishes the necessity to assess whether it can or cannot decouple again, posing a potential hazard in the area. In this sense, the present work aims to contribute to the understanding of two unanswered questions regarding the Aparejo Glacier before and after its 1980 sudden detachment: (1) what were the drivers of the detachment? and (2) which conditions have led to the glacier’s current (2020) state? In order to assess both questions, here we analyze a nearly 60-year record of the glacier’s evolution through archival aerial and terrestrial photography, satellite imagery, GNSS (Global Navigation Satellite System) data and GPR (Ground Penetrating Radar) surveys, coupled with a terrestrial Light Detecting and Ranging (LiDAR) survey. Based on the mentioned data both area and surface elevation changes are assessed. We present as well a brief analysis of the local climatic conditions at the time of the detachment, and a stable isotopes’ analysis of Aparejo Glacier’s ice to provide more insights regarding its current status.
2 Study site
The Chilean Andes are known for being a young mountain range located on the Pacific margin of South America. They are part of the only present-day active case of a subduction-type orogeny (Riesner et al., 2018). In the central region of Chile, the Principal Cordillera (western margin of the Andean range) originates as result of tectonic shortening and magmatic activity due to the uninterrupted subduction of the Nazca Plate beneath the South American Plate (Charrier et al., 2015). This configuration allows the region to develop high elevation summits over 6,000 m a.s.l. including active volcanoes such as Tupungatito, Maipo and San José. In this scenario lies the Upper Maipo basin, which an area of 4,858 km2 and over 1,100 glaciers within (Dirección General de Aguas, 2022a). The latter is composed by 8 independent basins, including the Yeso River Basin, where lies the Aparejo valley.
Aparejo valley, located 60 km east of Santiago, is accessible by car road to the confluence of Aparejo Creek into Yeso River (Figure 1). Elevations within the 7 km-long valley range from 4,794 m a.s.l. at the headwaters (summit of Cerro Aparejo) to 2,650 m a.s.l. where Aparejo Creek flows into Yeso River. Slopes along the valley varies from 10 to 40 degrees between the main path of Aparejo Creek and the glacier’s headwall. The valley faces a mostly south-southeast orientation.
According to the first Chilean glacier inventory (Marangunic, 1979), based on 1955/1956 aerial photographs at a nominal scale of 1:46.000, there were two glaciers in the Aparejo Valley: Glacier N. 50 (−33.56, −70.0, area 0.15 km2, which we refer hereafter as Aparejo Glacier) and Glacier N. 51 (−33.55, 70.98, area 0.44 km2). Glacier N. 50 was 70% covered by rock debris according to the 1955 aerial photographs. In the updated official glacier inventory (IPG2022_v2, Dirección General de Aguas, 2022a) performed by the Chilean Water Directorate (DGA), Glacier N. 50 (IPG2022_v2 code CL105703102) is named “Aparejo” and has an area of 0.13 km2, thus being classified as a glacieret. Whereas Glacier N. 51 (IPG2022_v2 code CL105703048), and from now on referred to as “Glacier 51,” has an area of 0.53 km2. The minimum/maximum elevations of Aparejo Glacier are estimated by Dirección General de Aguas (2022a) to be 3307/3800 m a.s.l. In both cases the outlines of IPG2022_v2 were obtained by DGA using a Spot 6 image of January 2015 with a spatial resolution of 1.5 m, whereas the elevation estimations was assessed by using SRTM data (Dirección General de Aguas, 2022b).
The climate of the study area is defined by the permanent influence of the South Pacific High-Pressure Centre and the seasonal north–south displacement of the westerly regime that steers frontal systems toward central Chile during the winter. This results in precipitation in central Chile being mainly of frontal origin, with systems that develop in the Pacific Ocean and travel eastward. It shows a strong seasonal behavior with dry conditions in summer (December–February) and 5-month (May–September) rainfall events that concentrate more than 90% of the total annual precipitation. Also, in the mountain, more than 90% of the snowfall in the Central Andes (between 30° S and 38° S) occurs during May–September (Falvey and Garreaud, 2007). The spatial distribution of the annual accumulation shows a southward increment and an increase with terrain elevation due to the orographic effect on the passing frontal system. It is worth mentioning that during summer, the northern and eventually the central part of the Chilean Andes are affected by the South American monsoon circulation, which transports moist air from the Amazon basin toward the mountains (Vera et al., 2006). The orographic effect generates upward motion, allowing convective cloud formation and subsequent precipitation in the Aparejo Glacier and surrounding areas.
Large annual and multi-annual variability has been found in precipitation records in the Central Andes of Chile and Argentina (e.g., Masiokas et al., 2006; Quintana and Aceituno, 2012). El Niño/La Niña episodes severely affect the annual precipitation at 2-6-year scales, with El Niño being relatively wetter and warmer than the long-term average in central Chile. At the same time, La Niña is relatively drier and colder than climatological average (e.g., Aceituno, 1988). The Pacific Decadal Oscillation (PDO) with a timescale of 20–30 years also modulates the precipitation regime in central Chile (Montecinos and Aceituno, 2003). The warm phase of the PDO concurs with above-average precipitation, while the cold phase concurs with below-average. A clear climate shift warming of nearly 1°C occurred in 1976/77 along western South America (Boiser and Aceituno, 2006; Carrasco et al., 2008) linked to the PDO. Thus, a cold phase dominated from 1947 to 1976 (reflected in more abundant La Niña events), while a warm phase prevailed during 1976–2000, with more frequent and wetter El Niño events (Carrasco et al., 2008).
In the study area, the annual average precipitation ranges from about 584.0 ± 335.8 mm at the El Yeso reservoir, located 5 km down-valley from the confluence of Aparejo Creek with Yeso River, to 1052.5 ± 483.6 mm at Lagunitas located around 56 km toward the northeast of Aparejo Gl (Table 1). On a regional scale, the annual average 0°C isotherm is located at 3700 ± 85 m a.s.l. (Bodin et al., 2010; Barría et al., 2019). At the same time, the local Equilibrium Line Altitude (ELA) is around 300 m above this altitude (Barría et al., 2019). According to the global permafrost zonation index map (Gruber, 2012), permafrost conditions would be favorable at headwalls above Aparejo Glacier at 3700 m a.s.l. As the Aparejo Glacier detachment happened at the end of the dry season.
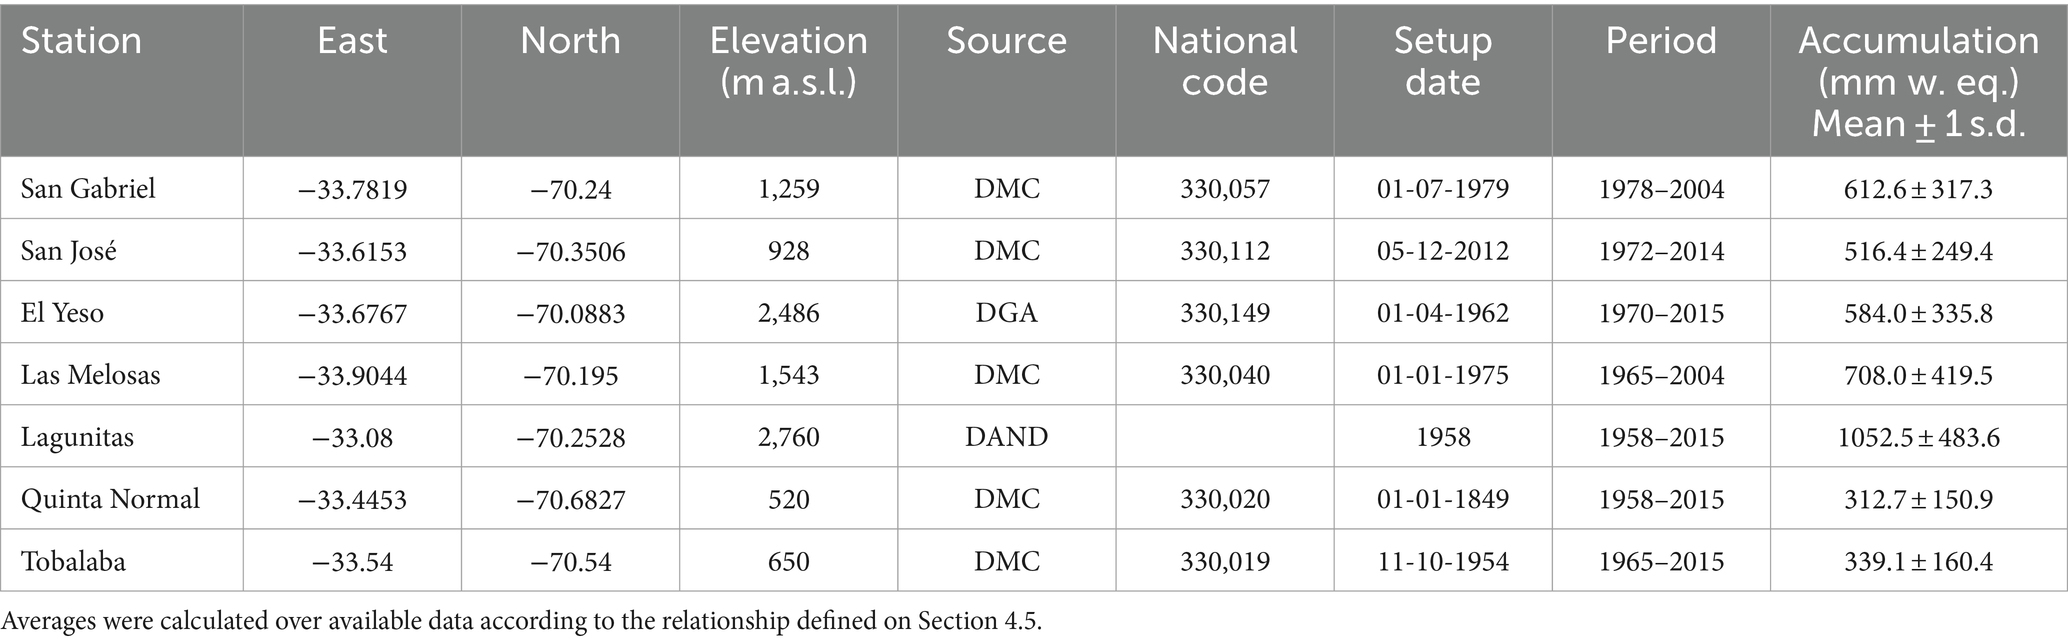
Table 1. Weather stations used for the meteorological assessment of this study.
Aparejo Glacier is situated in a region of complex geology, within the Aconcagua Fold and Thrust Belt (Fock, 2005; Antinao and Gosse, 2009), with several weak rock formations, including sandstones and fine-grained conglomerate, near the glacier, of Upper Jurassic to Lower Cretaceous epoch for the Lo Valdés and Colimapu Formations, respectively (Hallam et al., 1986; Salazar and Stinnesbeck, 2015; Mardones et al., 2021). These sedimentary formations are intruded by small fine-grained porphyritic bodies (Ugalde, 2016). Aparejo Creek lies to the west of a main west-verging thrust, El Diablo fault (Fock, 2005; Riesner et al., 2018). This geologic setting favors the near vertical disposition of the strata at the headwall of both Aparejo Glacier and neighbor Glacier 51.
No surging glaciers have been identified within the Yeso River basin. The nearest surging glacier reported in the literature corresponds to the Loma Larga Glacier (−33.7032, −70.0247) which is located 12 km south of Aparejo Glacier at the Río Volcán Basin (Falaschi et al., 2018; Farías-Barahona et al., 2020a).
3 The 1980 glacier detachment
The following description comprises the summary provided by Kääb et al. (2021) along with the previous publications by Peña (1980), Marangunic (1980, 1997), Ugalde (2016), and Ugalde et al. (2015, 2017). New evidence regarding the pre-detachment conditions of Aparejo Glacier is presented in the Results sections.
On 1 March 1980, an initially estimated volume of 7 × 10⁶ m3, that is, 85% of its total volume according to Marangunic (1997), sheared off the Aparejo Glacier in the Chilean Andes, mobilizing the detached mass 3.7 km down-valley with an estimated speed of 110 km h−1 (Ugalde et al., 2015, 2017; Ugalde, 2016). The mass movement deposit covered an area of 0.55 km2 with ice and rock debris piled up to a thickness of 17 m. The volume of the deposit was estimated at 8.1× 10⁶ m3 (Marangunic, 1980).
In total, five mountaineers witnessed the event and noted, immediately prior to the event, several supraglacial ponds and 2–3 cm of wet snow on the surface of the glacier (Marangunic, 1980). According to two of the 5 eyewitnesses, as soon as they had crossed the glacier, and once they were safely on its left (eastern) margin, at about 9:10 am, the glacier detached from its bergschrund, and started to slide as a block flow, with an undulating movement over its bed, progressively accelerating down valley (Rodrigo Mujica, personal communication). No seismic motion was perceived prior the detachment according to the witnesses, nonetheless, an intense rumbling was heard seconds before the glacier detachment (Rodrigo Mujica, personal communication).
According to the witnesses, during the first 2 km the glacier preserved its initial morphology, sliding down with a southeast direction. The glacier destroyed and buried the mountaineers camp, located about 100 m downslope from the glacier front. Three additional mountaineers, from the same group, had fortunately evacuated the camp site shortly before the slide and had just crossed the glacier detachment path to safe ground, witnessing the catastrophic ice motion as it sped down-valley. Still, one of them was hit on his back by an ice block, pushing him to the ground several meters away, resulting in light injuries (Patricio Cerda, personal communication). When the mass flow reached the main valley at the tributary originating from Glacier N. 51 (Figure 1), according to these witnesses and the field inspection (Marangunic, 1980), the glacier ice climbed 70 meters upslope before disintegrating with a spectacular cloud of ice and dust and progressed down valley as a turbulent flow. The event lasted 2 min approximately. When it came to a stop, it became covered with a thin airborne dust deposit.
Field inspection a few days after the event (12 March 1980) showed that a major part of the glacier basin was ice-free (Figure 2), with the lower bed in the 2/3 of the lower basin composed of till, with a slope of 3° in the lower third and 10° in the midsection. The upper third of the bed was composed mostly of bare rock and loose scree with a slope of 32°. The remnant ice (about 15% of the original glacier volume) was preserved mostly on the upper reaches of the basin (Marangunic, 1980). Ice blocks of more than 8 m in size could be observed within the deposit, together with smaller fragments of ice and rock debris. Within the slide path not covered by debris, furrows and striae with a maximum depth of 2 m could be observed (Figure 2; Marangunic, 1980; Peña, 1980).
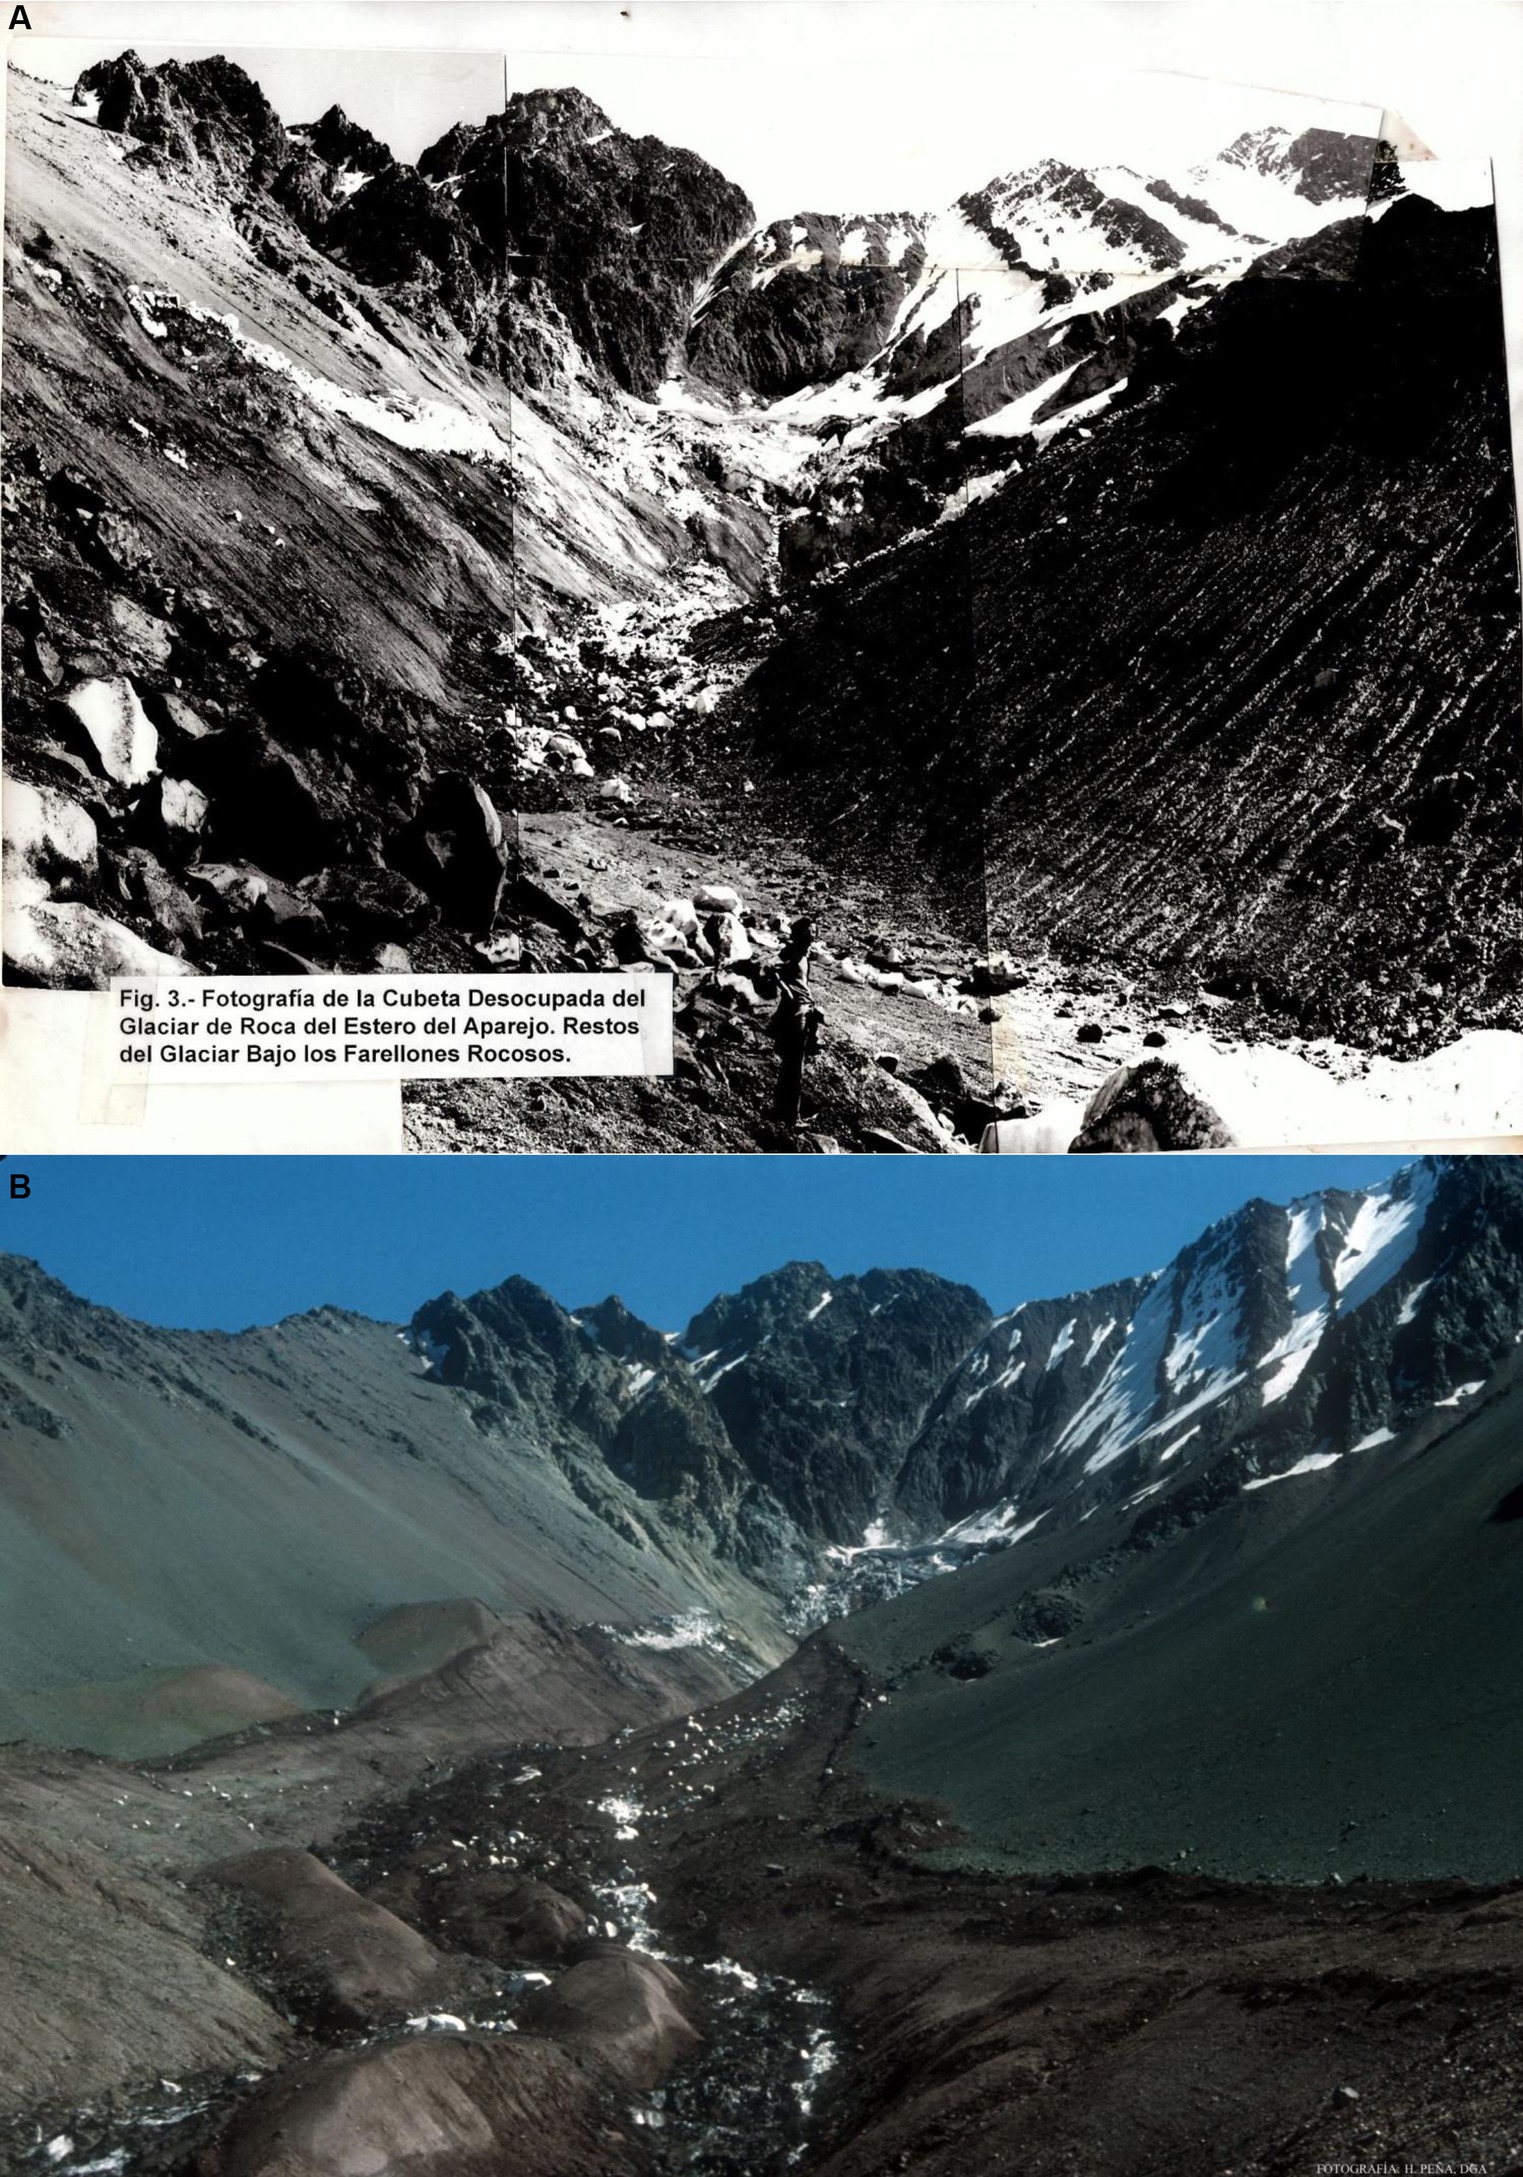
Figure 2. Field photographs (A,B) of the near-empty basin of Aparejo Glacier after its sudden detachment on 1 March 1980. Taken on 12 March 1980. After Marangunic (1997) and Peña (1980).
4 Data and methods
4.1 Glacier area changes
In order to quantify areal changes of Aparejo Glacier, a series of archival aerial and terrestrial photography, along with declassified satellite imagery, were orthorectified and geo-referenced. All these data were complemented with current high-resolution imagery. Table 2 summaries the details of each dataset. The oldest dataset corresponds to the 1956 Hycon photogrammetric survey provided by the Chilean Military Geographical Institute (IGM). The 1967 declassified stereo Corona KH-4A satellite imagery were acquired in digital format from the US Geological Survey (USGS). Aerial photographs from 1983 (Chile-60 flight) and 1996 (GEOTEC flight) were obtained from the Chilean Air Force Aero-Photogrammetric Service (SAF). All aerial and declassified satellite data were processed with the Agisoft Metashape Professional software (version 1.8). Due to the lack of Ground Control Points measured in the field, no Digital Elevation Models (DEMs) were generated from the aerial photographs of 1956, 1983, and 1996. All datasets were projected to the Universal Transverse Mercator (UTM) 19S zone.
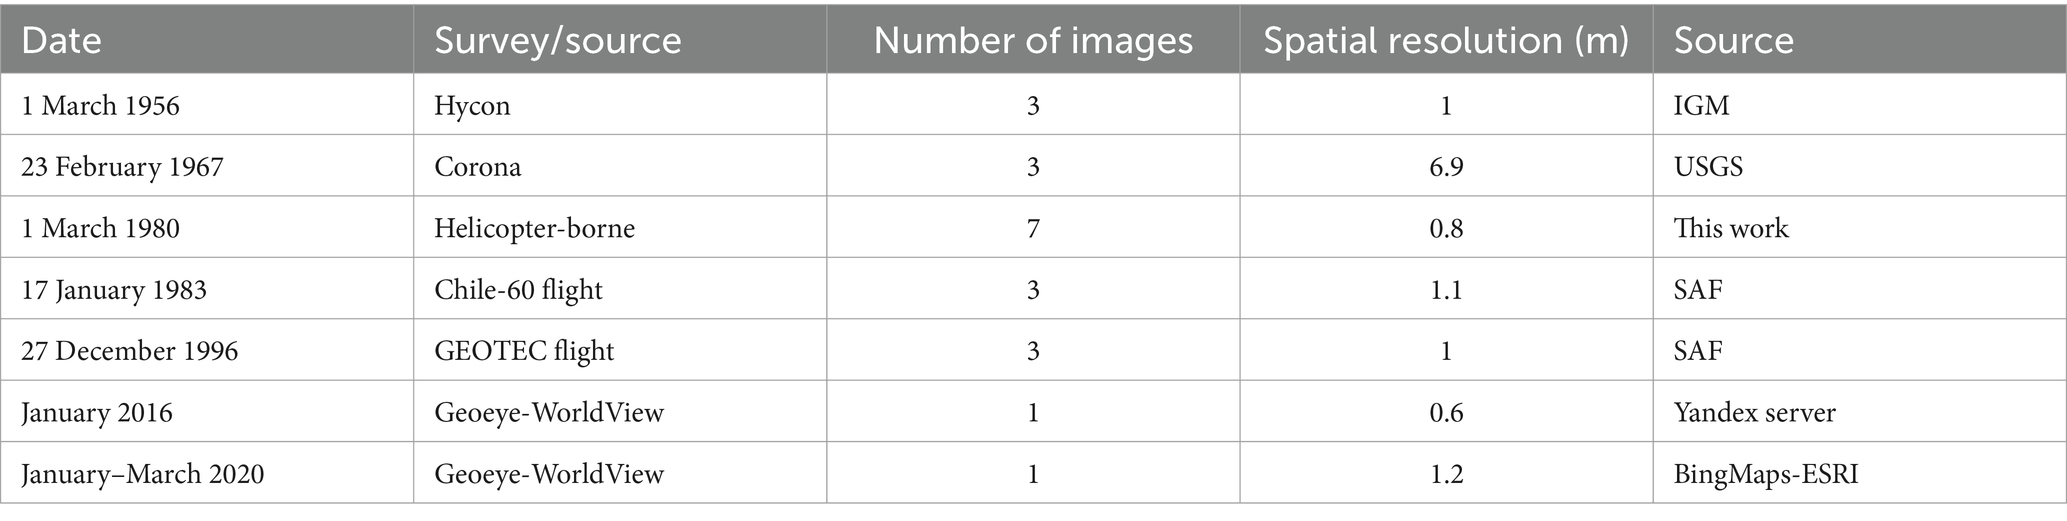
Table 2. Dataset used to map Aparejo Glacier area changes.
Once processed, the outlines for Aparejo Glacier were mapped through manual digitization by the same expert user. For the 2015 and 2020 outlines, high-resolution imagery was employed (Geoeye and Worldview) at a centimetric spatial resolution (Table 2). The datasets were obtained from the servers https://yandex.com/maps, https://www.bing.com/maps and ESRI™ Basemap. Due to data restrictions from the Yandex server, the image’s acquisition date ranges from 2012 to 2013, based on a Google Earth imagery inspection. In the case of the 2015 outline, the lateral boundaries of the glacier were updated to 2015 with the help of kinematic GNSS data and the GPR data collected in the field (see section 5.3). For the 2020 outline, a hillshade model was generated following a terrestrial LiDAR scan survey data of 2020 (see Section 4.2). All these processes were developed using ArcGIS Pro 3.2.
An additional historical dataset was generated for the 12 March 1980 field survey footage (Marangunic, 1980). Following the 2020 LiDAR, data coupled with high-resolution imagery, 4 ground control points (GCPs) where obtained. The latter were employed in the Agisoft Metashape Professional software (version 1.8) for deriving a 1980 photogrammetric model generation. Seven 1980 field photos were used for that purpose, all taken from a helicopter flight after the detachment on 12 March. The generated model allowed us to delineate the pre-event glacier outline and the post-detachment glacier remnants.
In total, we manually delineate the glacier contours for 1956, 1967, 1980, 1996, 2015, and 2020. For all mentioned datasets, the uncertainty of the manual glacier delineation process was estimated based on 1-pixel size of the digitized aerial photographs and satellite imagery (Williams et al., 1997), which was subsequently multiplied by the perimeter length (Farías-Barahona et al., 2020b).
Complementary to the analysis, high resolution (sub-meter pixel size) Google Earth Pro optical imagery was employed for geomorphological assessments regarding the Aparejo Glacier current and recent conditions. 9 images in total from the summers of 2014 to 2023 were analyzed, most of them showing cloud free conditions with scarce patches of remnant snow.
4.2 Glacier elevation changes
On 6 June 2015 a ground penetrating radar survey was performed on Aparejo Glacier in order to determine glacier thickness, along with a GNSS survey, which allowed to estimate the surface topography and the geolocation of the radar measurements. The topographic survey was performed using two Topcon Hiper SR receivers, one static and one mobile (rover) units. The kinematic GNSS survey provided a nominal altitudinal precision of 10 cm of the data. Replicating the followed procedure and obtained results by Farías-Barahona et al. (2020b) at El Morado Glacier, later, on 10 April 2020 a LiDAR scan of the whole glacier was obtained using a REIGL VZ-6000 long-range terrestrial laser scanning. One reflector was established on a non-glacier location at the eastern margin of Aparejo Glacier. Although the LiDAR can measure at a millimeter resolution, combined with GNSS georeferencing and optical distortions from the atmosphere, the nominal vertical, and also horizontal, resolution is estimated at 10 cm. In our LiDAR survey the point cloud density was at least 50 points/m2. After this data a Digital Elevation Model (DEM) was generated with a 1 m spatial resolution using CloudCompare Open Source Software. The DEM was used to estimate the minimum and maximum elevations of Aparejo Glacier throughout the analysis for each glacier outline generated. The described process was developed using the Add Surface Information tool on ArcGIS Pro 3.2. All datasets were projected to the Universal Transverse Mercator (UTM) 19S zone considering ellipsoidal elevations.
Both datasets (Table 3; Figure 3) were compared to estimate the recent glacier elevation changes for the period 2015–2020 through the direct subtraction of elevation values using the Field Calculator Tool on ArcGIS Pro 3.2 for each elevation point obtained from the GNSS survey. No interferometric nor photogrammetric data were considered for this assessment. Because of the limited spatial extent of the 2020 TLS data, no stable off-glacier areas could be surveyed. Thus, the level of uncertainty attributed to the calculations was quantified as 1 sigma of the observed elevation changes. For the pre-and post-event glacier elevation changes, the 1980 photogrammetric model was employed for a direct comparison of the glacier margins elevations from all years with available outlines. This analysis was performed employing the measuring tool on ArcGIS Pro 3.2 applied to 13 elevation profiles perpendicular to the glacier main flow-line.
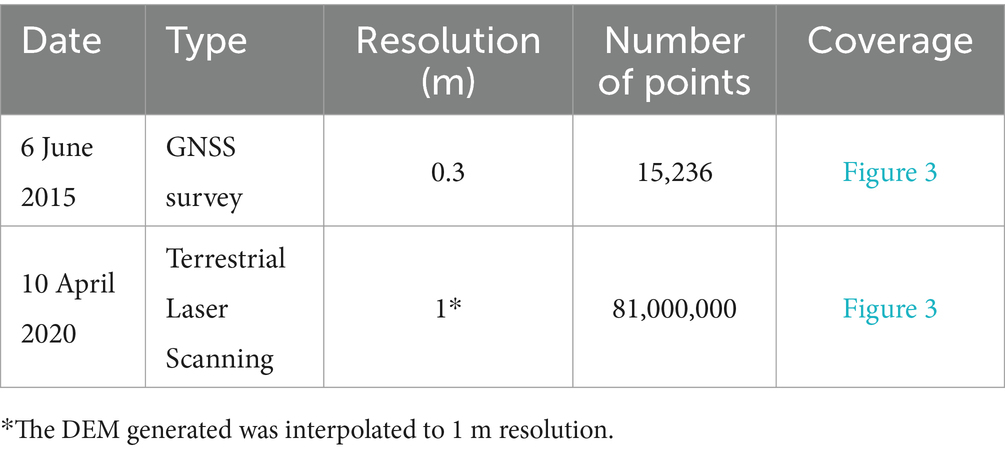
Table 3. Elevation datasets obtained during 2015 and 2020 surveys.
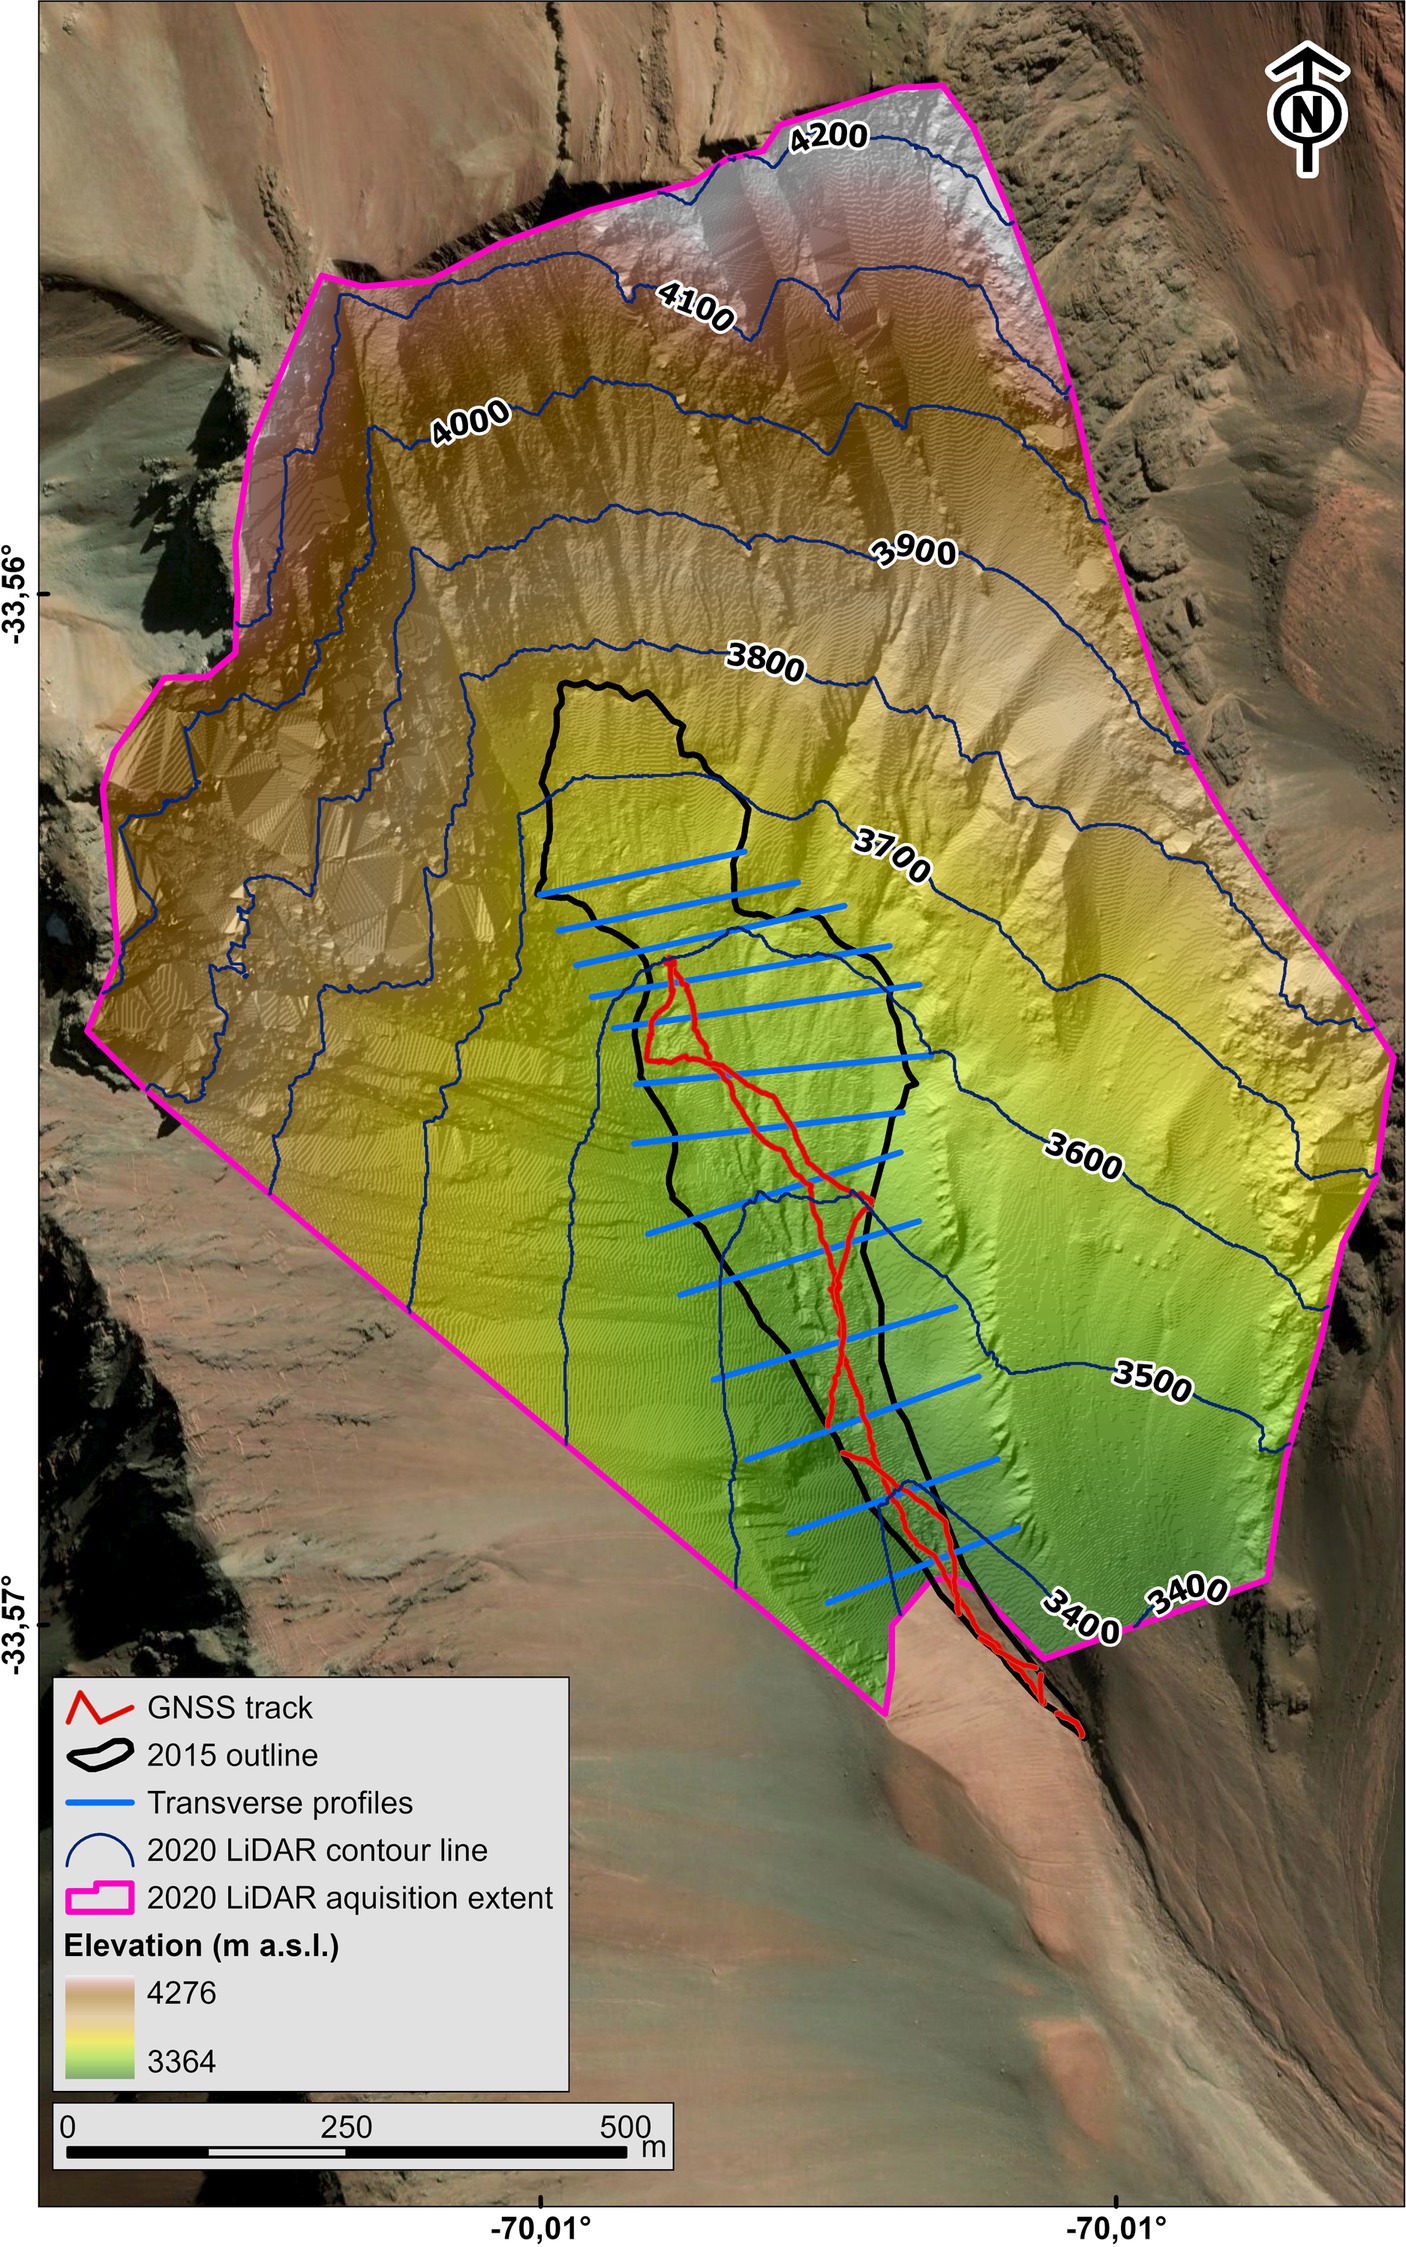
Figure 3. Extent of elevation datasets used in this study. The red line is the GNSS survey track. The black line is the 2015 glacier outline. Blue lines are the transverse profiles used for the 1980 topographic reconstruction. Light blue lines are the 2020 LiDAR contours. Pink line demarks the 2020 TLS LiDAR survey.
The 2020 LiDAR data was employed to reconstruct the 1980 pre-detachment glacier topography. For this purpose, 13 transverse profiles were traced between the 1980 glacier margins, considering a flat surface along each profile, and assuming an elevation coincident with the western margin, which is more clearly visible on the imagery than the eastern margin. For the longitudinal profile reconstruction (Figure 3), the center of the transverse profiles was assumed to correspond to the ascending path of the 2015 GPR and GNSS profiles.
4.3 Ground Penetrating Radar (GPR)
On 6 June 2015 a GPR survey was performed on Aparejo Glacier. We used an impulse Ground Penetrating Radar1 of a central frequency of 10 MHz, with 8 m-long ½ dipole antennae and a wavelength λair of 32 m in air and λice of 16.8 m in ice, with a pulse repetition rate of 1 kHz. The receiver stacked 1,024 traces with 256 samples per trace. Due to the shadow effect of the transmitted pulse, near-surface reflections cannot be detected and only thickness values larger than 10 m can be measured. The nominal accuracy of the ice depth data can be estimated as λice/4 equal to 4 m. The data obtained were processed using Reflex Win software (Sandmeier, 2011), version 7.0. The GPR was coupled with GNSS differential positioning, as shown in Supplementary Figure S2. A crossover analysis of the GPR and GNSS data was performed, confirming a precision of 0.1 m for both surveys, as is exposed on Supplementary Tables S1, S2. A subglacial profile was generated after the GPR data representing the glacier bed. This information was then compared with the elevation obtained from the GNSS and LiDAR survey along with the 1980 photogrammetric model.
4.4 Isotope analysis
With the aim of characterizing the stable water isotopes of the glacier ice, on 6 June 2015, 16 samples of glacier ice, frozen water from a stream in front of the glacier and stream water down valley were collected for stable isotope analysis. During the third campaign of 9 April 2016, 10 additional ice samples for isotopic analysis were collected from Aparejo Glacier, including two from Glacier 51. In total, 26 samples were collected at Aparejo Valley (Supplementary Figure S1). Analyses were performed at the Isotope Analysis Laboratory, Andrés Bello University, Viña del Mar, Chile. In order to establish the heavy versus light isotopes ratios of H and O (deuterium, 2H, and 18O, respectively), samples were filtered using 0.2 μm cellulose filters and analyzed by cavity ring-down spectroscopy (CRDS) using a Los Gatos Research (LGR) triple liquid isotope analyser (TLWIA-45EP). Results were normalized to the Vienna Standard Mean Ocean Water (V-SMOW) – Standard Light Antarctic Precipitation (SLAP) scale (reported as δ18O and δD). We will refer hereafter to the Global Meteoric Water Line (GMWL) (Rozanski et al., 1993), defined as follows:
After normalizing the isotope values the analysis focuses on variations due to altitudinal effects (Clark and Fritz, 1997).
4.5 Meteorological data
Two main datasets of meteorological data were analyzed to determine the climatic conditions before and after the Aparejo Glacier detachment. The first comprises the upper air temperature at 850 and 700 hPa obtained from the coastal radiosonde station Quintero (−32.78333, −71.5333, 7 m a.s.l., station WMO number 85543) for the period 1 February to 31 March 1980. The second dataset corresponds to precipitation data of 5 weather stations deployed on the western side of the Andes near the Aparejo Glacier. They are San Gabriel (−33.7819, −70.2400), San José (−33.6153, −70.3506), El Yeso (−33.6767, −70.0883), Las Melosas (−33.9044, −70.1950) and Lagunitas (−33.0800, −70.2528) stations (Table 1). Daily precipitation for February and March and the Zero Isotherm Altitude were analyzed (Figure 4A). All data were obtained from the Meteorological Direction of Chile (DMC), where they passed a quality control process. Besides this control, and because precipitation in central Chile is mostly associated with passing frontal systems and, therefore, if it rains in Santiago, it is highly probably rain in the mountains, the station time series including Quinta Normal and Tobalaba (station numbers 85,577 and 85,580, respectively) were used as spatial homologation test. All monthly data were compared among each other to confirm similar intra and interannual variability. Following the latter, the annual precipitation was estimated at each station for the periods indicated on Table 1 according to an exponential adjustment defined as follows (considering a mean squared error of 1.0):
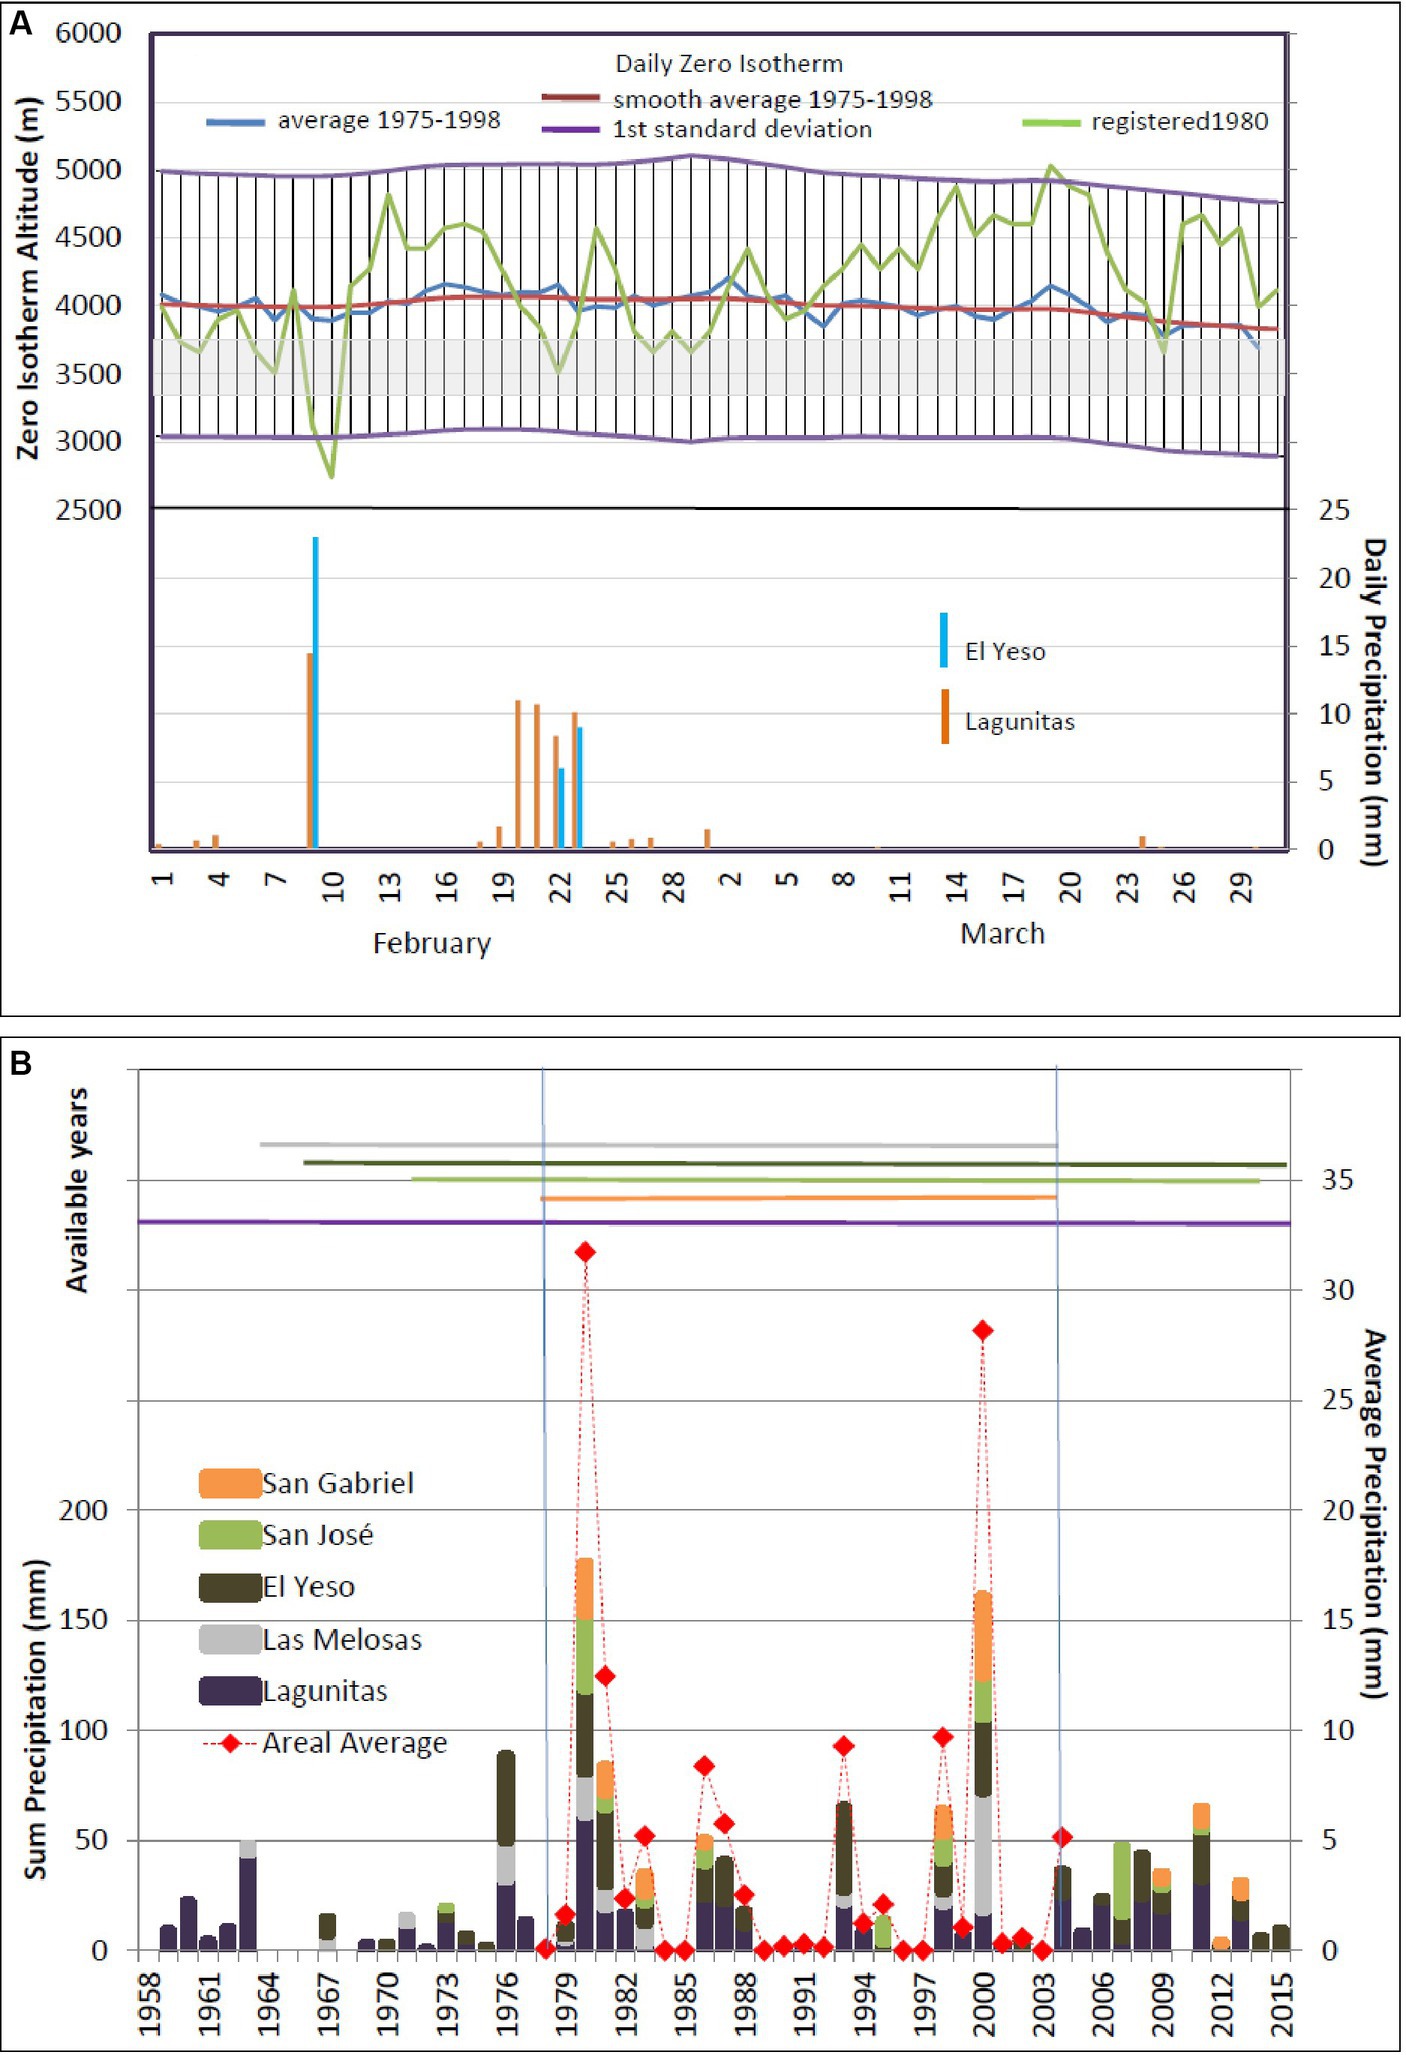
Figure 4. (A) Upper portion: Daily Zero Isotherm Altitude (ZIA) between February 1st, 1980, and March 30th, 1980. Lower portion: Daily precipitation at Lagunitas and El Yeso stations between February 1st, 1980, and March 30th, 1980. (B) Cumulated February precipitation (liquid) for all available stations (Table 3) deployed in the western side of the Andes in the vicinity of the Aparejo Glacier.
5 Results
5.1 Mapping and glacier area changes
Observations performed during the first field trip on 28 May 2015 revealed the existence of continuous glacier ice outcrops at an elevation of 3,285 m a.s.l., close to the location of the former Aparejo Glacier front. Most of the observed ice had a thin surface debris cover, less than 10 cm thick (see Supplementary Figures S2A,B). During the second field trip performed on 9 April 2016, we confirmed that the observed lowermost debris-covered ice during the first field trip, coincided with the 1956 glacier front. The glacier was discovered on the former glacier basin, largely covered (more than 75% of its surface) by a thin debris cover less than 5 cm thick (Supplementary Figure S2C). Many tensional crevasses were found close to the upper glacier section, with several shear fractures at its margins, some wider than 1 m (Supplementary Figure S2C).
Figure 5 and Table 4 summarizes our results after the successive delineation of Aparejo Glacier from 1956 to 2020. Only the 1983 aerial imagery was not useful because of the presence of snow covering most of the lower two thirds of the glacier. Aparejo Glacier area varied from 0.13 ± 0.002 km2 in 1956 to 0.10 ± 0.002 km2 in 2020, with a probable maximum extent prior to the glacier detachment in 1980 with an area of 0.21 ± 0.002 km2. At the same time, the 1980 glacier outline poses the widest width, with an average value of 220 m for the detached portion. In contrast, the lower two thirds of the glacier before and after its detachment had an average width below 100 m. In almost all years the length of the glacier was estimated to be around 1 km. Only the 1967 outline has a shorter length of 810 m. The minimum/maximum elevations of the glacier are estimated to be 3359/3790 m a.s.l. in 1980 and 3350/3759 m a.s.l. in 2020.
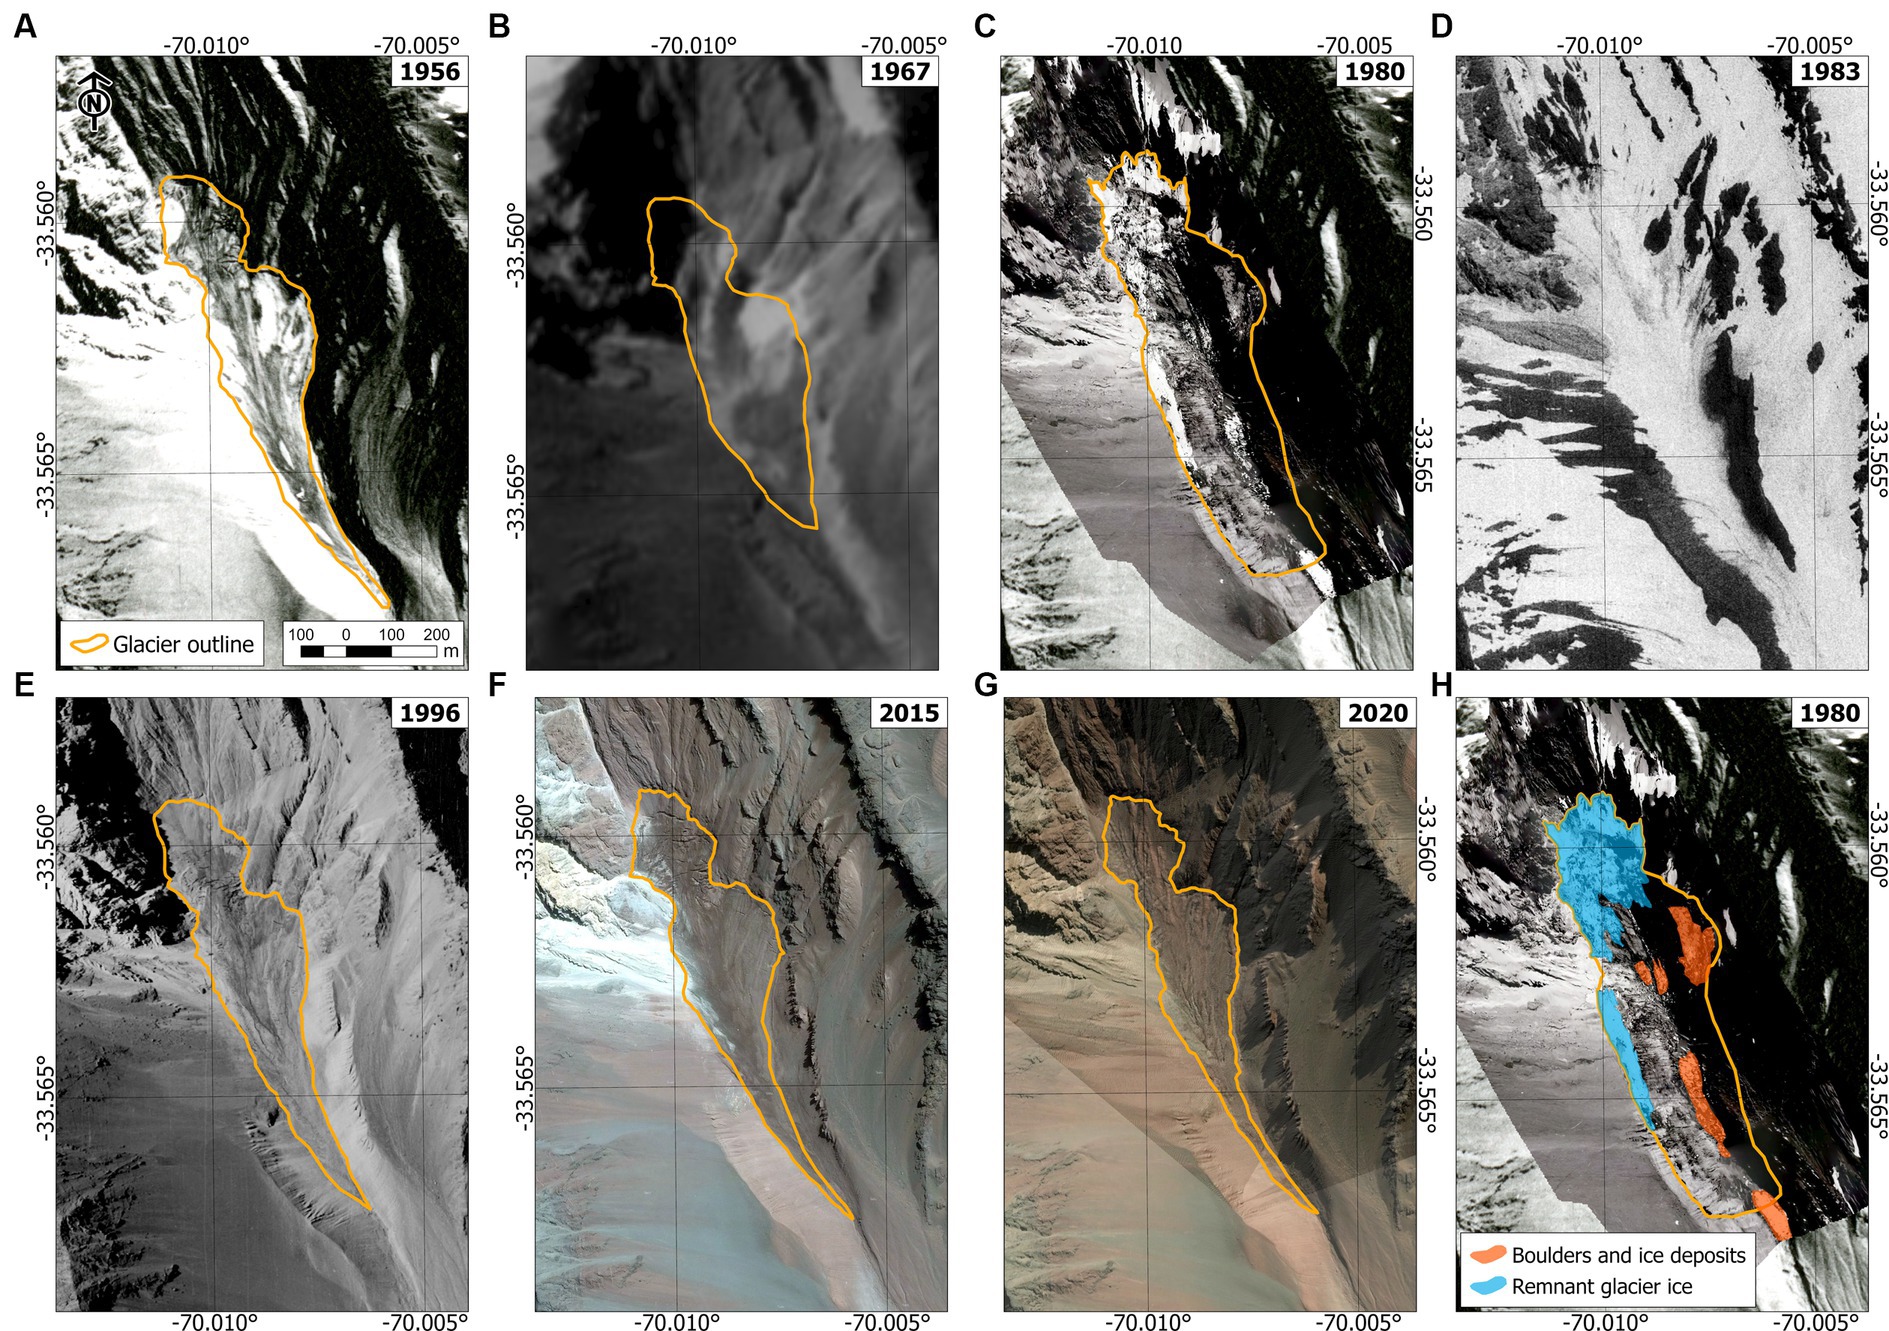
Figure 5. Area delineations for Aparejo Glacier. (A) 1956 outline after Hycon survey aerial photographs. (B) 1967 outline after Corona imagery. (C) 1980 outline after the photogrammetric dataset generated using 12 March 1980 field survey footage. (D) 1983 Aparejo basin showing extended snow coverage and fractures on the surface near Aparejo Glacier headwall. (E) 1996 outline after the SAF-GEOTEC aerial survey. (F) 2015 outline after field surveys and high-resolution imagery from Yandex server. (G) 2020 outline after LiDAR TLS data and BingMaps imagery. (H) Geomorphological mapping after the 1980 glacier detachment.
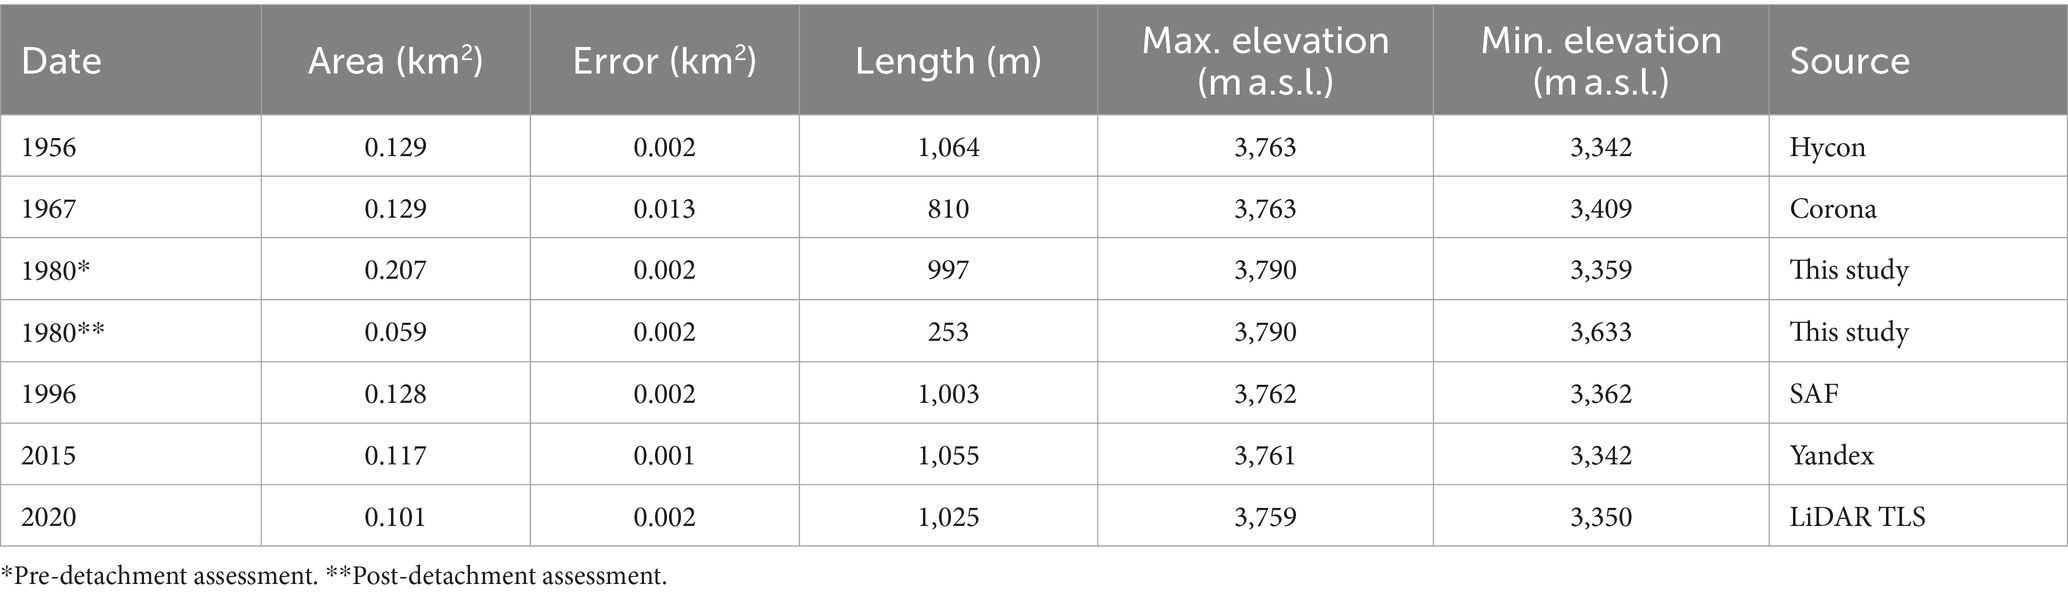
Table 4. Summary of Aparejo Glacier area and length delineations from 1956 to 2020.
The post-event glacier area (March 1980) obtained is 0.059 ± 0.002 km2, equivalent to the 28.4% of the pre-event glacier area (Figure 5H), whereas the ice-debris deposits left within the 1980 pre-detachment glacier area (Figures 2, 5) cover an area of 0.024 ± 0.002 km2.
5.2 Glacier surface elevation changes
Figure 6A shows the spatial distribution for the glacier elevation changes along the 2015 GNSS survey track when compared with the 2020 LiDAR survey. A mean elevation change rate of −0.74 ± 0.24 m a−1 was observed, equivalent to a change of −3.65 ± 1.19 m for the 2015–2020 period. Maximum thinning values beyond −8.0 ± 1.19 m are observed in the central section of the glacier, coinciding with the widest portion of the glacier both in 2015 and 2020. As shown in Figure 6, the ice thickness changes show mostly negative values, indicating that ice thinning has prevailed over the glacier in the period 2015–2020. We can also observe that the upper area of the glacier shows more thinning than the lower area, possibly due to the existence of cleaner ice, opposite to the lower area which has a thicker debris cover, probably due to enhanced ablation at lower elevations. For the post-event conditions, an elevation difference of −30 to −50 m was observed at the margins of the lower half of Aparejo Glacier for both 1980–2015 and 1980–2020 periods (Figure 6B).
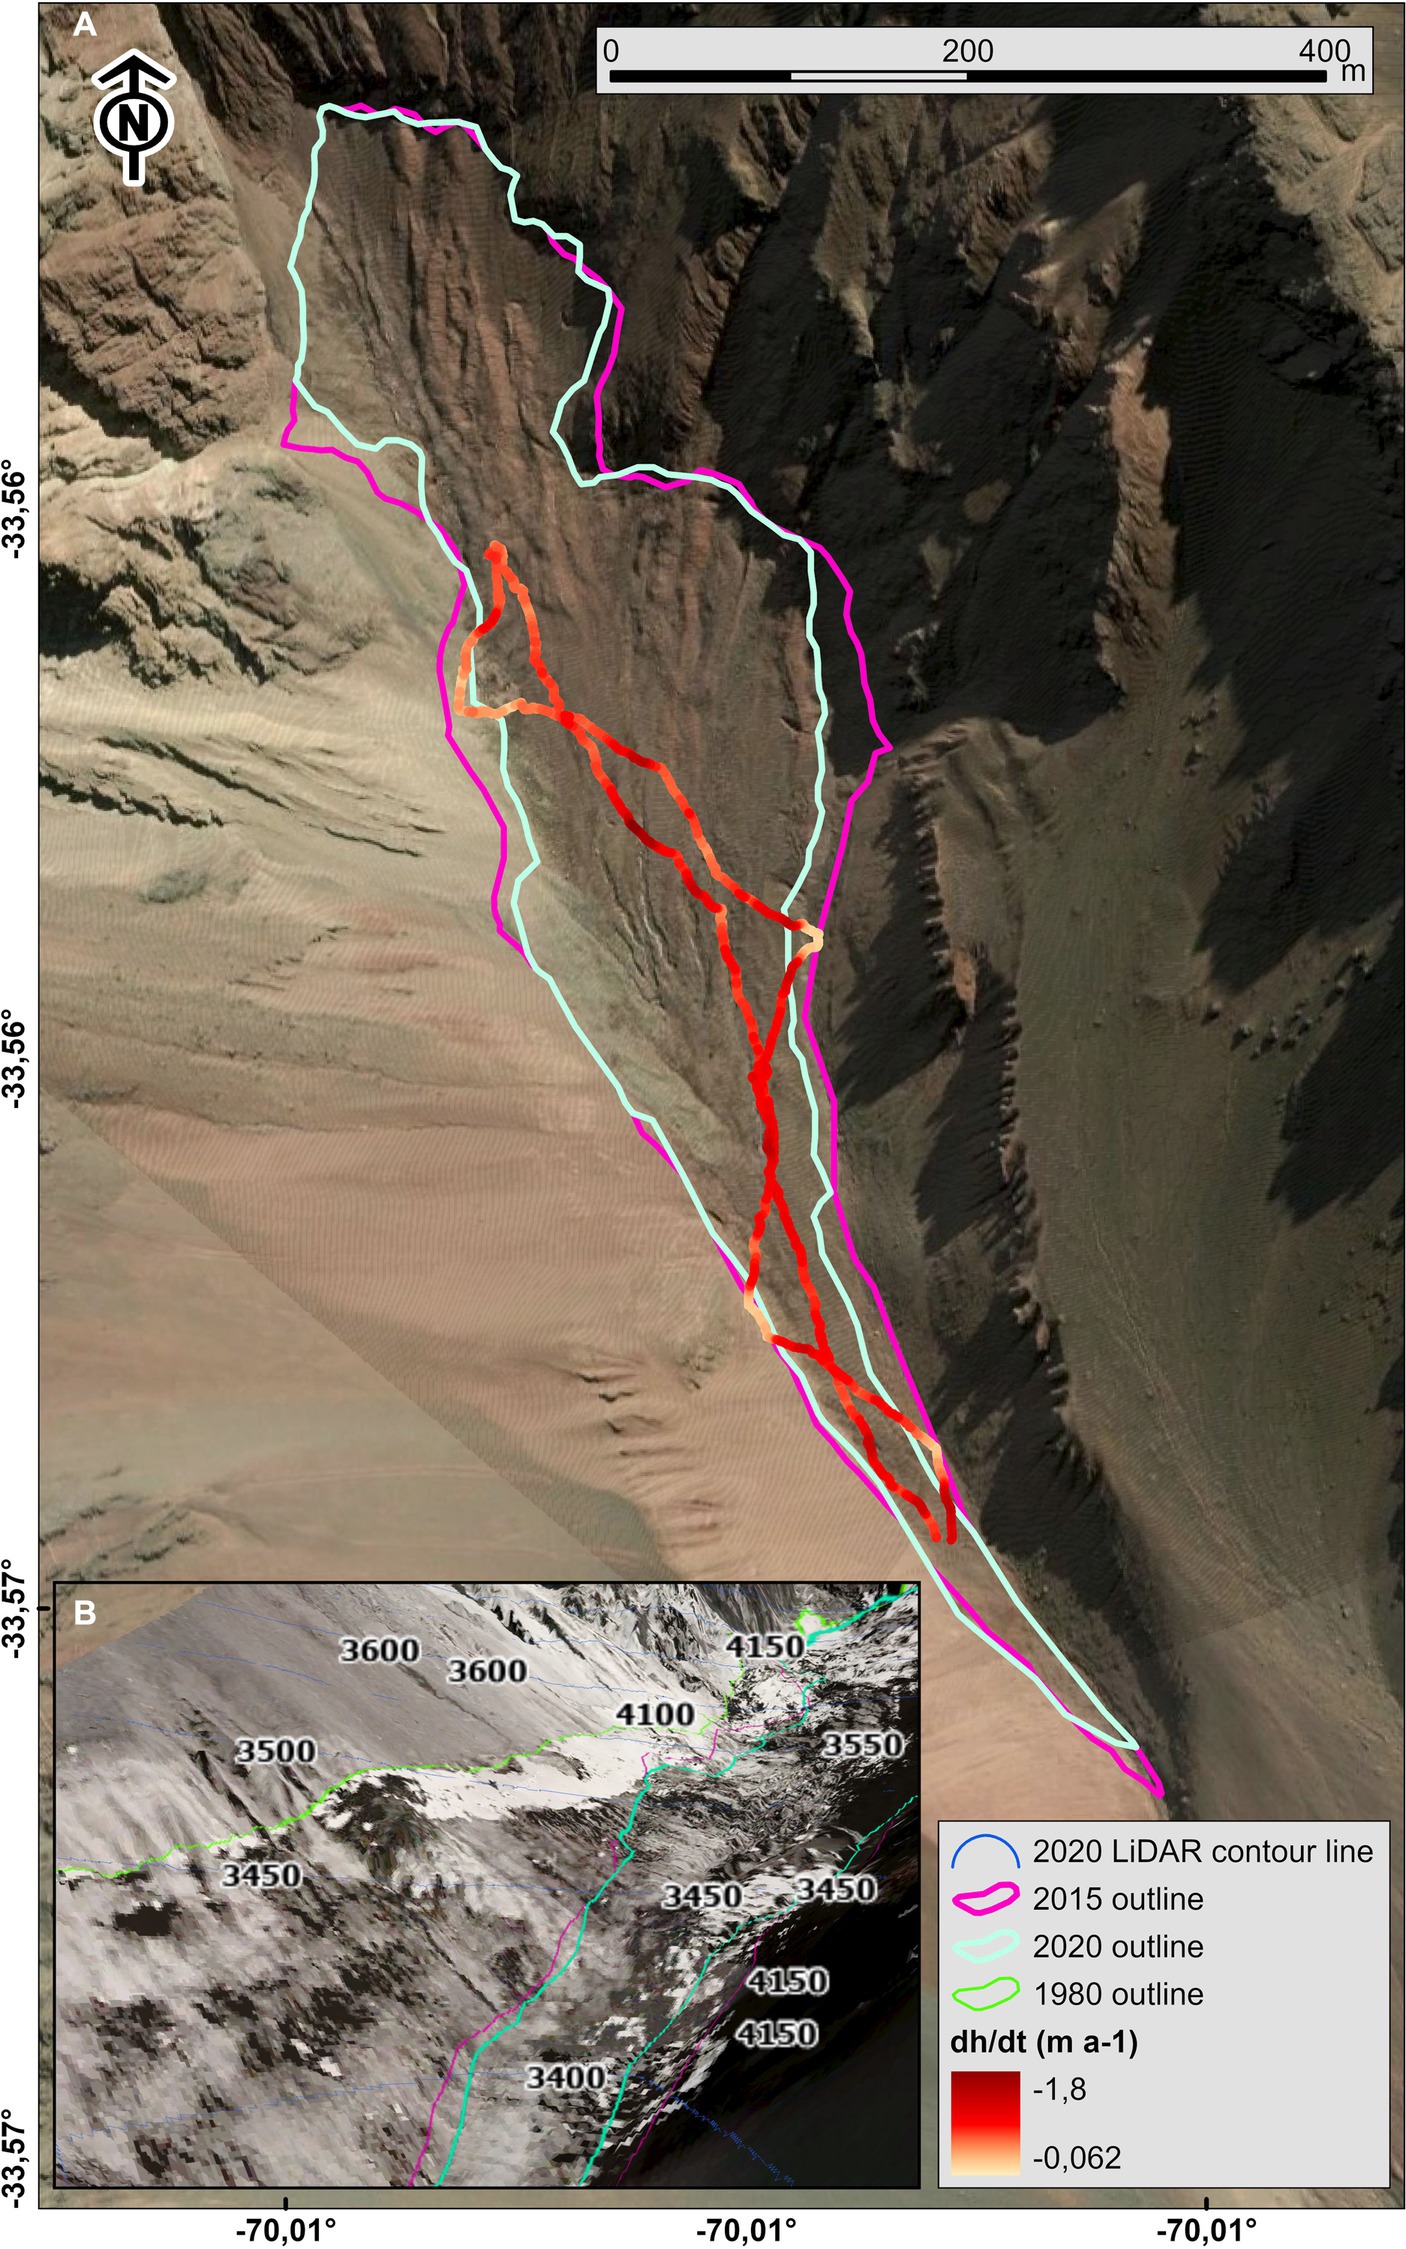
Figure 6. (A) Glacier elevation changes obtained through comparison of 2015 GNSS and 2020 LiDAR data. (B) Glacier elevation changes at the western margin of Aparejo Glacier through the comparison of the 1980, 2015, and 2020 outlines positions. Background image corresponds to the 1980 photogrammetric model generated in this study.
5.3 Ground Penetrating Radar
Figure 7A shows the spatial distribution of glacier thickness, based on a 2,588 m-long GPR profile collected on Aparejo Glacier. After applying the corresponding filtering of a minimum thickness value of 10 m (see Section 4.3), reliable glacier thickness data could be obtained for a profile length of 1,413 m, corresponding to 54.6% of the total length. The maximum thickness observed was 40 m on a clear reflector between the distances of 600 and 1,100 m, considering an ice velocity equal to 0.168 m/ns (Figure 7B), whereas the average thickness observed was 19.5 m. The highest thickness values, over 30 m, are concentrated in the medium third of the glacier. This value decreases slightly toward the glacier front and decreases on a more abrupt pattern toward the headwall.
Figure 7. (A) Thickness data on Aparejo Glacier based on the 2015 GPR survey. Dark blue colors points to a possible depression on the central-upper side of the glacier. (B) Radargram between 600 and 1,100 m (horizontal axis, distance through the profile length measured from the glacier’s front), with the interpretation of the glacier bed (red line), with a maximum ice depth of 40 m. The lateral axis refers to the two-way travel time in ns (left) and depth (right), considering an ice velocity equal to 0,168 m/ns. (C) Ground penetrating radar survey on the upper area of the Aparejo Glacier, June 6th, 2015. The person ahead of the group (not shown in the picture) carries the kinematic receiver for the GNSS survey. Several tensional and shear crevasses are observed on the glacier.
5.4 Glacier 1980 volume reconstruction
Figure 8 illustrates a reconstruction of Aparejo Glacier right before and after its sudden detachment. Also, the 2015 and 2020 surface profiles are presented along with the glacier bed topography after the GPR data. The profile location is shown on Figure 7A. Before its detachment, Aparejo Glacier had an extension of 0.21 km2 (Figure 5; Table 4). The margins near the glacier terminus reached an elevation of 3,420 m a.s.l., whereas the glacier’s length was about 1 km. The headwall position is observed at the same position as both before and after scenarios (1956 to 1967 and 1996 to 2020, Figure 5). The average surface slope of the glacier is estimated as 21°. According to GPR data (Figure 7), compared to the 1980 margin’s position and assumed elevation, the maximum pre-event thickness of the glacier is estimated in 77 m (Figure 8), whereas the average thickness is estimated as 62 m. This value allows us to estimate a pre-detachment glacier volume of 12.9 ± 0.6 × 10⁶ m3. We also estimate a 68 m elevation drop for the main fracture that started the sudden detachment. For the 0.06 km2 glacier area left after the detachment (Table 4), we estimate an average thickness of 20 m based on the 1980 post-event photogrammetric model (Figures 5H, 6B), which allows us to estimate a post-detachment glacier volume of 1.2 × 10⁶ m3. Thus, the glacier detached volume is estimated at 11.7 ± 0.6 × 10⁶ m3, equivalent to the 90% of the glacier’s pre-detachment volume.
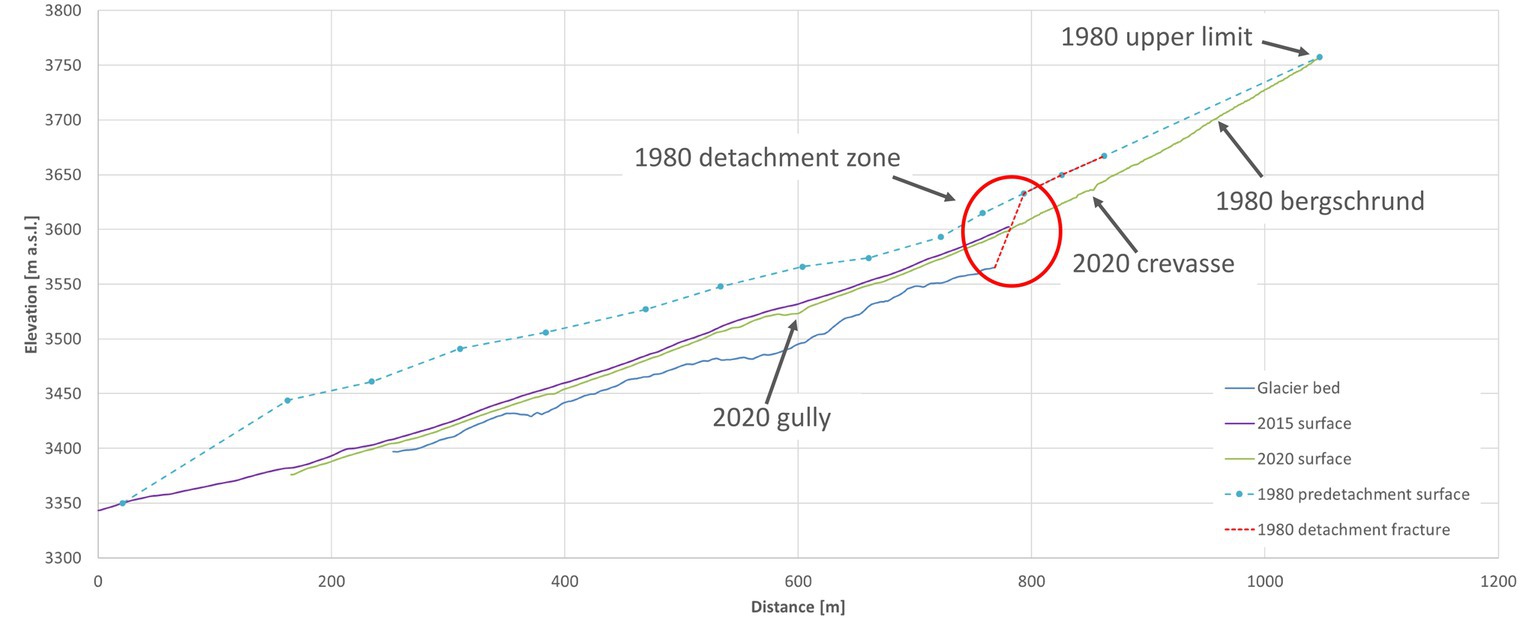
Figure 8. Longitudinal profile of Aparejo Glacier from 1980, 2015 and 2020. Blue line is the glacier bed inferred from GPR data. Purple line is the 2015 glacier surface from GNSS data. Green line is the 2020 glacier surface from LiDAR data. Dashed light blue line is the reconstructed 1980 glacier surface from the transverse profiles presented on Figure 3. Dashed red line is the detachment fracture observed in the 1980 photogrammetric model generated on this study. Several structures are highlighted including a gully and a crevasse above the 2020 glacier surface. The 1980 detachment zone (red circle) and the 1980 bergschrund are also highlighted.
5.5 Isotopic analysis
Supplementary Table S3 shows the results of the isotopic analysis of 26 samples shown in Supplementary Figure S1. The most depleted values of δD and δ18O are observed in samples from Glacier 51 (blue dot on Supplementary Figure S1A), with less depleted values on water samples collected downstream. The most enriched values are observed in the sample collected in a small lake (sample A15 on Supplementary Figure S1A) near the main stream, which may be affected by strong evaporation as discussed further in this section (Clark and Fritz, 1997; Spangenberg et al., 2007). The lake has been present since at least 1956, as revealed by Hycon aerial photos in Supplementary Figure S1B. The latter condition allows us to exclude the lake sample for further analysis.
Figure 9A shows the distribution of water stable isotopes values with respect to altitude, showing that no evident relationship of water isotope composition and altitude is present. Stream samples have homogeneous stable isotope values of water despite the sampling location, meaning that no important water-mixing is occurring downstream. The exceptions are the two highest samples, which values are similar to those of the Aparejo Glacier. Glacier 51 has a clearly distinguishable isotopic signature, much more depleted than any other water source from this sector. Considering that below 3,300 m a.s.l. there is no presence of ice, no clear relationship can be established. Nonetheless, snow samples collected likely show an isotopic depletion as altitude increases (Rozanski and Araguás, 1995).
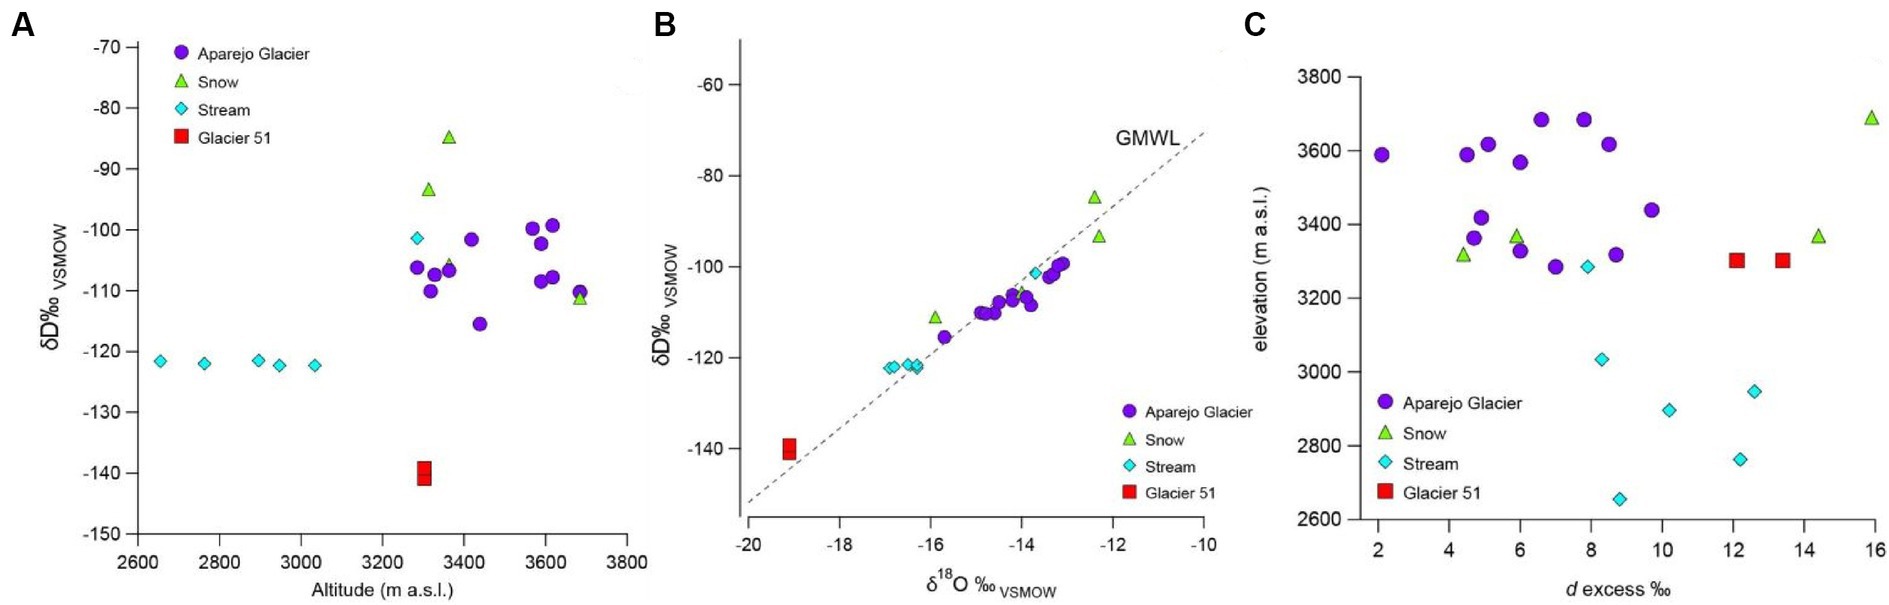
Figure 9. (A) Scatter plot showing altitudinal variation of the isotopic composition of all samples collected, except for the one from the lake. (B) Scatter plot of co-isotope relationship (δD and δ18O) composition of all sample types collected nearby and on Aparejo Glacier. The dashed line shows the Global Meteoric Water Line (Rozanski et al., 1993). (C) Deuterieum excess (dexcess) values of all type of samples collected against altitude.
Figure 9B shows the isotopic composition of all collected samples, which plot close to the Global Meteoric Water Line (GMWL), as defined by Rozanski et al. (1993), except for the one from the lake, not included in the plot. Three clusters of samples are recognizable, from more depleted to more enriched water stable isotope values: those from Glacier 51, the ones from the stream and those obtained at the Aparejo Glacier. Snow samples plot in a sparser way, showing higher variability, probably due to substantial differences in the deposition time of the different snowfall events, that could reflect different sources, environmental conditions and also post-depositional processes like sublimation.
5.6 Climate conditions
Figure 4A shows the Daily Zero Isotherm fluctuations measured for February and March 1980 obtained from the coastal radiosonde station Quintero. For February 1980 we observed both cold and warm days with a minimum and maximum Zero Isotherm Altitude (ZIA) of 2,750 and 4,750 m a.s.l., respectively, whereas the ZIA average for 1975–1998 is estimated around 4,000 m a.s.l. As for the meteorological situation for the day of Aparejo Glacier detachment, 1 March 1980, we observe the presence of an upper-level trough crossing the Andes, as detected by the 500 hPa analysis and the descent of the ZIA (Figure 4A).
In February 1980 two important precipitation events took place, one in 9 February and the other between 19 and 23 February (Figure 4A). Both events are accounted for by the daily precipitation measured in El Yeso and Lagunitas stations. On the nearest weather station, El Yeso (2,486 m a.s.l., Table 1), the precipitation amount varied between 23 and 14 mm, respectively, whereas in Lagunitas station (2,760 m a.s.l., Table 1), the total precipitation was 14 mm for 9 February and 43 mm for the event of 19–23 February.
Figure 4B shows the accumulated February precipitation (liquid) for all available stations deployed in the western side of the Andes near the Aparejo Glacier. The areal average of liquid precipitation reveals February 1980 as the highest value (32 mm) recorded between 1978 and 2004. According to the Lagunitas station data, located 60 km to the NNW of Aparejo Glacier, which constitutes the oldest and most reliable mountain station in the Central Chilean Andes, the February 1980 precipitation is also the highest recorded within the period, followed by the 1963 February record.
6 Discussion
6.1 Glacier pre-detachment evolution
As Figure 5 and Table 4 show, Aparejo Glacier has had an evolution from a relatively steady area of 0.13 km2 for the 1956–1967 period, to a remarkably large growth of 0,08 km2 until its pre-detachment extension of 0.21 km2 was reached in 1980. Our results show a 200 m length reduction of the glacier from 1956 to 1967, and a 50 m wider geometry for the 1967 outline when compared to the 1956 outline. Interestingly, Figure 5B shows what resembles a bulgy-like geometry in the middle of the glacier for 1967. However, it was not possible to analyze the bulge elevation due to the lack of a DEM for 1967. For the 1967–1980 period, we observe a 190 m glacier front advance. What is more remarkable is the widening of the glacier at the 1967 terminus position. The latter would have varied from a few meters in 1967 to almost 200 m in 1980 (Figure 5C). Bulging before glacier detachments events have been reported for Kolka, Aru, Sedongpu and Flat Creek glaciers (Kääb et al., 2021). In the case of Aparejo Glacier this feature would have been accounted for 13 years before the sudden detachment event.
As for the pre-detachment glacier mass balance, although we do not have any data, Farías-Barahona et al. (2019) give an accurate assessment for the Echaurren Norte Glacier, located 11 km southwest of Aparejo Glacier. As part of their results, the authors compare the annual mass balance of the Echaurren Norte Glacier and annual precipitation at El Yeso station between 1975–2015 (Farías-Barahona et al., 2019, Figure 6). For the period 1975–1980 one El Niño event occurred in 1978 and a positive mass balance for Echaurren Norte Glacier was verified for the 5-year period, with annual precipitation slightly below 500 mm at El Yeso Station for all 5 years, with the exception of 1978, when the precipitation was 787.5 mm. Garreaud et al. (2019) (Figure 2) calculate an annual series of the Central Chile regional precipitation index (RPI). A total of 9 years with RPI over 100% compared to the average are accounted for within the 1956–1980 period, whereas 9 years qualify as droughts, and another 7 years with precipitation in the range of 80–100%. The latter agrees with the 9 weak-moderate-strong El Niño years identified for the same period according to the Oceanic Niño Index (NOAA, 2024). At the same time, temperature anomalies had a negative (cooling) tendency between 1958 and 1976 (Figure 3A in Barría et al., 2019). The tendency reverted just after 1976, leading to the only positive mass balance of Echaurren Norte Glacier in 1978. This idea is reinforced by the fact that in 1976–1977 the Pacific Decadal Oscillation (PDO) shifted from a negative to a positive phase (Quintana and Aceituno, 2012; Barría et al., 2019).
As for the bulging and glacier growth between 1967 and 1980, the geometry of the glacier lateral moraine (Supplementary Figure S3) may have played a role favoring its development. This feature presents a 30 m narrowing adjacent to the Aparejo Glacier frontal position on every existing outline, with the exception of the 1967 extent (Figure 5). In particular, the 1980 glacier outline has its terminus next to the narrowest portion in between the lateral moraines (Supplementary Figure S3). This configuration could have led the glacier to grow on a confined condition prior to its sudden detachment. It is worth noting the similarity of the latter with the pre-detachment scenario for Tsambagarav Glacier detachment (48.66, 90.75), Altai Mountains, Mongolia, after the 1987 outline observed by Kääb et al. (2021). In both cases the sinuosity of the lateral moraines would have had a similar role in the glacier’s evolution before their sudden detachment.
Although Masiokas et al. (2016) reconstruct a negative mass balance trend for Echaurren Norte Glacier for the 1940–1970 period, which would have stabilized soon after the beginning of the 1970 decade, considering the southern exposure of Aparejo Glacier, it is reasonable to assume that the local meteorological conditions prior to its detachment would have led to the glacier to duplicate its area on a 24-year span.
As for the possibility of past detachments of Aparejo Glacier, the strip lines evident on the 1956 aerial photographs in the valley downstream of the glacier (Supplementary Figure S1B) are extremely similar to the strip lines along the glacier deposit path after the 1980 detachment, which points to the occurrence of similar past events, perhaps even larger. In fact, during the Little Ice Age (Fernández-Navarro et al., 2023), the glacier must have been much larger, potentially having had repeated instabilities such as sudden large detachments. Nonetheless, careful field investigations (Jacquemart et al., 2022) are necessary to determine whether Aparejo Valley older deposits could correspond to previous detachments.
6.2 Aparejo Glacier detachment drivers
Similar to Kolka Glacier catastrophe (Kotlyakov et al., 2004; Huggel et al., 2005; Evans et al., 2009; Kääb et al., 2021), one atmospheric factor that could contribute to the collapse of the glacier is a warmer than usual environment. Analyzing the upper air temperature at 850 and 700 hPa obtained from the coastal radiosonde station Quintero (Figure 4A), this factor however, is discarded so that the monthly average for February 1980 was below the corresponding long-term average. Indeed, the days before the Aparejo Glacier detachment colder than average air temperatures were recorded, as reflected by ZIA values below average (see Figure 4A).
Considering the latter, precipitation arises thus as a main atmospheric factor that needs to be evaluated as a potential detachment trigger. Both summer precipitation events that took place in February 1980 (Figure 4A) occurred with a ZIA lower than average and below or at least within the altitudinal range of the glacier. This means that the precipitation on the glacier was most likely of solid type (snow). Nonetheless, after the precipitation events of February 1980, the ZIA rapidly rose above the altitudinal range of the glacier, thus favoring snow melt. No precipitation was recorded just before the Aparejo Glacier collapse at the few stations deployed in the central Chile Andes, except for the Lagunitas station located around 60 km to the north, that recorded 1.5 mm on 1st March, with a ZIA of 3,658 m a.s.l. on February 29 that rose to 3,810 m a.s.l. on the 1st of March. According to the witnesses, snowfall on February 29th accumulated a 10 cm surface layer of wet snow on Aparejo Glacier and surroundings (R. Mujica, personal communication). The supraglacial ponds that the mountaineers observed while crossing the glacier, just before the event, were probably the result of extensive snow melt on the glacier.
These observations suggest that the triggering mechanism of the glacier detachment likely involved an extreme reduction of the basal drag due to high water saturation of the glacier bed. Aparejo Glacier appears to sit on a glacier bed composed primarily of weak subglacial till, and the slope on the lower two thirds of the glacier averages 7° (according to field observed data, after Marangunic, 1980). Snowmelt infiltration and warm precipitation due to a sudden increase in the zero-degree isotherm elevation would have provided the main source of infiltrated water, leading to enhanced water pressure at the glacier bed and, thus, reducing effective pressure (Jacquemart and Cicoira, 2021; Kääb et al., 2021). As for the main water pathways, according to witnesses and post-detachment footage (Supplementary Figure S4), Aparejo Glacier had a severe fractured texture on its surface. Thus, it is reasonable to assume that much of the melt water present just before the detachment, as evidenced by the surface ponds reported by the witnesses, reached the glacier bed facilitated by numerous crevasses, thus increasing the subglacial water pressure. Abnormal crevassing before failure is known to be a shared condition for other detached glaciers such as Kolka, the twin Aru glaciers, Tsambagarav, Sedongpu and Rasht (Kääb et al., 2021).
As for the abnormal crevassed condition for Aparejo Glacier before the detachment, although there is no known pre-event footage, besides what is shown in Figure 5 for the 1956 and 1967 conditions, it is worth noting the surge-like behavior of nearby Glacier 51. Indeed, during a field inspection on 12 March 1980, Marangunic (1980) found that the nearby glacier to the east, Glacier 51 (Figure 1), showed significant signs of surge-like instability, such as a heavily crevassed front and massive patches of freshly exposed ice along its entire length (Supplementary Figure S5). The prominent terminal moraine at Glacier 51, with over 100 m of elevation difference compared to its proglacial plain, probably helped containing its detachment. As Supplementary Figure S5 shows, it is remarkable how the surge-like behavior of Glacier 51 resulted in an overflow of glacier ice on both margins and on its front. What is most conspicuous, is the synchronicity of both phenomena, Aparejo Glacier detachment and Glacier 51 surge-like abnormality, within a distance of 1.5 km in the same basin. As Kääb et al. (2021) suggest, sudden glacier detachments could be seen as rare and extreme endmembers of surge-like glacier instabilities, thus, for both Aparejo Glacier and Glacier 51 to have exhibited a similar instability, a common local factor (beside meteorological conditions) must be present. Remarkably, the reconstructed pre-detachment surface topography of Aparejo Glacier (Figure 8) shows in the lower two thirds a thicker (bulgy) geometry than in the upper section of the glacier. This condition is typical of surge-like behavior (Jiskoot, 2011).
Regarding the geological role, we propose that the local geological conditions played a key role on the Aparejo Glacier detachment and, at the same time, on the surge-like glacier behavior of Glacier 51. As was described in section 2, Aparejo Glacier is in middle of the Aconcagua Fold and Thrust Belt and, on a more detailed scale, Aparejo Valley east margin is flanked by the El Diablo Fault. This configuration favors the near vertical disposition of the sedimentary strata on the headwall of Aparejo Glacier (Supplementary Figures S2B,C, S4) and Glacier 51, which is also coronated by Aparejo Peak (4,794 m a.s.l.), a massive gypsum body surrounded by sedimentary formations. On both glaciers at the headwalls of Aparejo Valley, the vertical drop from the highest summits to their respective accumulation zones is 500 to 900 m, whereas the horizontal distance to the accumulation zone lies in the 600 to 1,000 m range, resulting on a steep 40° slope over Aparejo Glacier and Glacier 51. At the same time, as Rodríguez et al. (2020) observed, the main recognized geological structures near Aparejo Glacier (El Diablo Thrust) are dominantly oriented parallel to the detachment path, favoring the preferential direction of the mass movement.
Considering the southern exposure of Aparejo Valley, plus the weakness of the sedimentary formations, mainly sandstones and fine-grained conglomerate, all above 3,500 m a.s.l, this favors the development of gullies above Aparejo and 51 Glacier, where snow avalanches are triggered, depositing large amounts of snow on the glaciers. Indeed, as Supplementary Figure S3 shows, snow avalanches originating above Aparejo Glacier can reach its terminus after traveling over 1 km. In this configuration, glacier accumulation is sustained mostly by snow avalanches, especially in cold and humid years, whereas in summer debris flows are predominant, allowing Aparejo Glacier to receive uninterrupted inputs of mass. This scenario poses a parallel process to what Jacquemart et al. (2020) found for Flat Creek Glacier, Alaska. In their study, the authors observed that the area upstream of the bulge identified on the glacier, before its sudden detachment, received water from a larger catchment than any other point of the glacier. In the case of Aparejo Glacier, instead of a larger catchment, we state that gullies above the glacier became main corridors for snow avalanches, debris-flows and, thus, an intense mass input both before and after its sudden detachment. A similar phenomenon occurs north of Aparejo Glacier in the Las Vacas Creek (−33.488, −70.044), Río Colorado basin, were successive debris-flows are triggered almost every summer, such as the episode of intense rainfall corresponding to the Zonal Atmospheric River (ZAR) of January 2021 (Sernageomin, 2021). The Las Vacas basin is a small watershed of 34 km2 of which 29% of its upper area share the same topographic boundary as the Aparejo Valley. The fact that at both sides of the topographic boundary between Aparejo Peak and its nearest western height at about 4,200 m a.s.l., there is frequent evidence of debris flows and snow avalanches, this points to a particularly high accumulation regime for Aparejo Glacier and, likely as well for Glacier 51. This geological and topographic setting provides essential clues of the factors that contribute to trigger glacier instability.
As for the 1980 reconstructed geometry of Aparejo Glacier (Sections 5.1 and 5.4), the average width of 220 m coupled with the average slope of 21° (Figure 8) points to a loss of basal friction of about 90% based on the stability diagram (Figure 20) proposed by Kääb et al. (2021).
6.3 Post-detachment evolution and current status
The position of the main three groups of samples in Figures 9A,B suggest a possible water mix from different sources, where the isotopic signature of the stream water could be the result of the mix between Aparejo Glacier and Glacier 51 meltwater, possibly along with other unidentified sources such as groundwater, according to Crespo et al. (2017). In their study, the most depleted waters originated from debris-covered glaciers, while the most enriched waters originated from rock glaciers. In this case, although both glaciers are debris-covered, Glacier 51 ice is older than the Aparejo Glacier detachment event, so that its isotopic signature could reflect the signal of older ice.
We propose that most of the remnant ice after the 1980 event (1.2 × 10⁶ m3) has been preserved and has become part of the present Aparejo Glacier. This is reasonable, considering that the Aparejo Glacier has a southern exposure with low solar radiation. Consequently, the remnant ice preserved in the upper section of the glacier after the detachment (0.059 km2, Table 4) must have flowed downglacier, probably also sliding and avalanching down steeper slopes to the glacier’s mid and lower portions. It is also probable that snow accumulation due to precipitation and avalanches from steep slopes at both sides of the glacier contributed to fill the glacier basin. This transformation of snow into firn, and then into ice, would have easily occurred in a couple of decades, considering that the ice is probably near-temperate based on the relatively low elevation of the glacier.
This idea is reinforced by looking at the isotope secondary parameter of deuterium excess (dexcess) (Dansgaard, 1964). The dexcess of meteoric water mainly depends on the conditions during primary evaporation from the ocean (e.g.: relative humidity and sea surface temperature). This signature will be preserved as water falls as precipitation (solid or liquid) and is defined by the relationship:
Figure 9C shows the dexcess values for all samples analyzed in this study. Glacier 51 samples show much higher values than all other samples, which in turn will reflect different environmental conditions at the moisture source during the evaporation process, as the moisture source should remain the same (i.e.: Pacific Ocean). Higher dexcess are linked to lower relative humidity (i.e.: colder air temperature conditions) (Clark and Fritz, 1997). On the other hand, Aparejo Glacier samples have lower dexcess values, likely reflecting higher relative humidity conditions over the ocean (primary moisture source), while stream samples probably reflect a mix of both older Glacier 51 and Aparejo ice melt.
The fact that the stable isotopic signature of Aparejo Glacier’s ice closely resembles that of the sampled snow above the glacier (Figures 9A–C), suggests that its temporal scale and temperature conditions at its deposition time are similar. Contrastingly, a clear difference of around −4‰ (−35‰) for δ18O (δD ‰) is found for Glacier 51’s ice close to the glacier front, suggesting the presence of older ice. Therefore, Aparejo ice is probably younger than the one of Glacier 51, supporting the recent glacier regeneration which has occurred at Aparejo Glacier.
During the 1980s and 1990s particularly humid years occurred in central Chile, related to a higher frequency of El Niño events, linked in turn to a positive phase of the Pacific Decade Oscillation (PDO) (Quintana and Aceituno, 2012). As Farías-Barahona et al. (2019) observed, after analyzing the mass balance data from the relatively close Echaurren Norte Glacier,2 located 11 km southwest of Aparejo Glacier, and correlating it with the Multivariate ENSO Index (MEI) data for a time scale spanning from 1975 to 2015 (Figure 5 in Farías-Barahona et al., 2019), we can see the existence of a relationship between both time series. As the authors reveal, there is a strong relationship between the mass balance of Echaurren Norte Glacier and the ENSO index until the early years of the 2000–2010 decade. In fact, through the superposition of ENSO data, it is possible to identify five strong El Niño episodes: 1982, 1987, 1991, 1997, and 2002. All of them correspond to winter mass balance values higher than 2 m w.e. at Echaurren Norte Glacier (Farías-Barahona et al., 2019).
The first evidence of Aparejo Glacier’s extent after the 1980 detachment corresponds to the aerial photographs of 1996, when it had an area of 0,128 km2, thus having gained an area of 0.069 km2 with respect to the remnant area of 0.059 km2 immediately after the detachment. In terms of volume, we can assume that it also increased after the 1980 detachment, at least until 2002, during which five winters with high precipitation were recorded in central Chile, linked to El Niño episodes, as mentioned above. After 1996, area changes have not been substantial (Figure 5; Table 4), and we may assume that glacier volume has shown a moderate increase until 2010, when a megadrought started to affect a major area of Chile. Therefore, the main ice regeneration process at Aparejo Glacier probably took place during the 22 year-period 1980–2002, helped by the strong El Niño episodes. Notably, this time span is remarkably similar to the documented growth of Crater Glacier, Saint Helen Volcano, USA (Walder et al., 2004). Nonetheless, the latter would’ve grown highly influenced by a lava dome emplacement within the post 1980 collapse crater of Saint Helen Volcano.
Starting in 2010, a megadrought began to affect central Chile (Garreaud et al., 2017), partial evidence of which is the average glacier thinning of 3.65 m detected during the 2015–2020 period. In 2015, a maximum ice depth of 40 m was derived from the GPR data in the upper area of the glacier (Figure 7), in contrast to the maximum ice depth of 73 m inferred for the original glacier before the slide (Marangunic, 1980). Thus, in the present scenario of drier conditions, in addition to climate warming in the Central Andes of Chile (Burger et al., 2018), most likely Aparejo Glacier will continue to lose mass in the form of ice thickness depletion, regardless if its glacier front stays at the same position.
This current negative mass balance scenario allows us to estimate as very unlikely the risk associated to a new detachment of Aparejo Glacier. In fact, in terms of its mechanical stability, a continuous decrease of ice mass will diminish the driving forces of a sudden detachment scenario, so the glacier is and will be out of the “instability envelope” (Jacquemart and Cicoira, 2021; Kääb et al., 2021). Most probably then it will remain stable in the upcoming decades, unless climate trends reverse, with either wetter winters and/or cooler summers, both of which are not probable in the near future (IPCC, 2021). An additional factor that produces glacier mass loss at Aparejo Glacier, and thus reduces the risk of glacier instability, are the more frequent and highly fluidized debris flows produced especially during intense summer precipitation events, as is observed for the 2020 topography in Figure 8, which can erode and melt a relevant mass of ice. On that basis, Google Earth imagery also shows continuous debris deposits originating from the upper gullies located between the headwall strata, similar to what is shown in Figure 5G.
7 Conclusion
Sudden large-volume detachments of low angle glaciers are a particular type of hazard which lies in between rock and ice avalanches and glacier surges. It is still not clear the role of climate change on this phenomenon due to the scarce events reported (no more than 20 cases globally). In the post-Kolka and Aru Glacier detachments, the Aparejo Glacier sudden detachment has gained more relevance since it is one of the only three cases documented in the Andes. Although new literature from the last decade has provided a better understanding of the driver mechanisms for glacier catastrophic detachments on Caucasus, Pamir, Tibet, Alaska and the Andes, here we have examined new evidence regarding the 1980 Aparejo Glacier episode. In this study we analyzed data from 3 ground surveys carried out in 2015 and 2016; DEMs and glacier outlines compiled from orthorectified aerial imagery pre-and post-event; GNSS and GPR data; a terrestrial LiDAR scan survey of 2020, together with detailed interviews with 2 direct witnesses of the event, terrestrial and helicopter-borne photographs acquired 12 days after the event March 1980.
The combined interpretation of these new data, allowed us to make a more precise estimation of the detached ice volume of 11.7 ± 0.6 × 10⁶ m3 compared to the previous assessment of 7 × 10⁶ m3 by Marangunic (1997). We confirmed previous estimations of the post-detachment geometry, such as the 70 m height fracture and the smooth slope, 21°, for the glacier bed. As for the detachment drivers, we confirmed the previous hypothesis regarding an extreme reduction of the basal friction, 90%, due to high water saturation of the glacier bed after infiltration of snow melt into the glacier and underneath it. Snowmelt infiltration and warm precipitation, due to a sudden increase in the zero-degree isotherm elevation, would’ve provided the main source of infiltrated water, leading to enhanced water pressure at the glacier bed and, thus, reducing effective pressure. Coupled with a soft sedimentary layer underneath the glacier, along with a smooth slope, the combination of factors allowed Aparejo Glacier to detach on a catastrophic basis.
As for the post-detachment situation, we also observed that in the 40-year period after the sudden detachment that Aparejo Glacier recovered 12.4% of the original glacier volume, with a mean ice thickness of 19.5 m and a maximum of 40 m according to GPR data, being preserved within the same basin as the detached glacier. The glacier has shown a mean elevation change of −3.7 ± 1.2 m during the 2015–2020 period, with maximum thinning values greater than 8 m, which are probably caused by enhanced ablation due to climate warming and reduced precipitation during the current megadrought which started in 2010 and has lasted more than 1 decade.
This is a particular case of a glacier instability that led to an almost tragedy. Although the possibility of a new sudden detachment for Aparejo Glacier cannot be ruled out, as well as a possible pre-1955 detachment, we can conclude that under the projected scenarios of climate warming and reduced precipitation for central Chile, the risk associated to a new detachment of Aparejo Glacier is unlikely. Overall, the evidence presented here provide relevant knowledge regarding a yet to be understood glacier instability such as glacier detachments in mountain areas.
Data availability statement
The raw data supporting the conclusion of this article will be made available by the authors, upon demand, without undue reservation.
Author contributions
FU: Conceptualization, Formal analysis, Investigation, Methodology, Visualization, Writing – original draft, Writing – review & editing. GC: Conceptualization, Funding acquisition, Investigation, Resources, Supervision, Validation, Writing – review & editing, Project administration. CM: Conceptualization, Funding acquisition, Resources, Supervision, Validation, Writing – review & editing. FF: Data curation, Formal analysis, Funding acquisition, Investigation, Methodology, Writing – review & editing. JC: Formal analysis, Funding acquisition, Investigation, Methodology, Writing – review & editing. FB: Data curation, Formal analysis, Writing – review & editing.
Funding
The author(s) declare financial support was received for the research, authorship, and/or publication of this article. The study was supported by Geoestudios. This research has been supported by the Agencia Nacional de Investigación y Desarrollo grant “ANILLO ACT210046”.
Acknowledgments
The authors would like to thank Geoestudios, Arturo Aros and Raúl Ugalde for logistical support. Johann Blanc, Rodrigo Mujica, Gonzalo Campos, Tomás Martínez, Natalia Montero, Catalina Pino and David Valenzuela cooperated during field trips. Special acknowledgements to Cristián Peralta and Fernanda Manríquez for their helpful assistance in the GPR and remote sensing data processing, and to Rodrigo Mujica for narrating in the field the impressive 1980 Aparejo Glacier detachment. The authors acknowledge the Aero-photogrammetric Service (SAF) and the Geographical Military Institute (IGM) for the aerial photographs. The authors also acknowledge Humberto Peña for the 1980 colour on-site photographs. We also would like to thank the editor and the reviewers for their comments and observations that helped to improve this article.
Conflict of interest
FU, GC, and CM were employed by Geoestudios.
The remaining authors declare that the research was conducted in the absence of any commercial or financial relationships that could be construed as a potential conflict of interest.
Publisher’s note
All claims expressed in this article are solely those of the authors and do not necessarily represent those of their affiliated organizations, or those of the publisher, the editors and the reviewers. Any product that may be evaluated in this article, or claim that may be made by its manufacturer, is not guaranteed or endorsed by the publisher.
Supplementary material
The Supplementary material for this article can be found online at: https://www.frontiersin.org/articles/10.3389/frwa.2024.1377216/full#supplementary-material
Footnotes
References
Aceituno, P. (1988). On the functioning of the southern oscillation in the south American sector. Part I: surface climate. Mon. Weather Rev. 116, 505–524. doi: 10.1175/1520-0493(1988)116<0505:OTFOTS>2.0.CO;2
Antinao, J. L., and Gosse, J. (2009). Large rockslides in the southern Central Andes of Chile (32°-34.5°S): tectonic control and significance for quaternary landscape evolution. Geomorphology 104, 117–133. doi: 10.1016/j.geomorph.2008.08.008
Barría, I., Carrasco, J., Casassa, G., and Barría, P. (2019). Simulation of long-term changes of the equilibrium line altitude in the central Chilean Andes Mountains derived from atmospheric variables during the 1958-2018 period. Front. Environ. Sci. 7:161. doi: 10.3389/fenvs.2019.00161
Best, J. L. (1992). Sedimentology and event timing of a catastrophic volcaniclastic mass-flow, Volcán Hudson, Southern Chile. Bull. Volcanol. 54, 299–318. doi: 10.1007/BF00301484
Bodin, X., Rojas, F., and Brenning, A. (2010). Status and evolution of the cryosphere in the Andes of Santiago (Chile, 33.5°S). Geomorphology 118, 453–464. doi: 10.1016/j.geomorph.2010.02.016
Boiser, P. B., and Aceituno, P. (2006). Changes in surface and upper-air temperature along the arid coast of northern Chile. Paper presented at the 8th international conference on southern hemisphere meteorology and oceanography.
Burger, F., Brock, B., and Montecinos, A. (2018). Seasonal and elevational contrasts in temperature trends in Central Chile between 1979 and 2015. Glob. Planet. Change 162, 136–147. doi: 10.1016/j.gloplacha.2018.01.005
Carrasco, J. F., Osorio, R., and Casassa, G. (2008). Secular trend of the equilibrium-line altitude on the western side of the southern Andes, derived from radiosonde and surface observations. J. Glaciol. 54, 538–550. doi: 10.3189/002214308785837002
Casassa, G., and Marangunic, C. (1993). The 1987 Río Colorado rockslide and debris flow, Central Andes, Chile. Bull. Assoc. Eng. Geol. 30, 321–330. doi: 10.2113/gseegeosci.xxx.3.321
Charrier, R., Ramos, V. A., Tapia, F., and Sagripanti, L. (2015). Tectono-stratigraphic evolution of the Andean orogen between 31 and 37 S (Chile and Western Argentina). Geol. Soc. Lond., Spec. Publ. 399, 13–61. doi: 10.1144/SP399.20
Clark, I., and Fritz, P. (1997). Environmental isotopes in hydrology. Lewis Publishers: Boca Raton, FL.
Crespo, S., Aranibar, J., Gomez, L., Schwikowski, M., Bruetsch, S., Cara, L., et al. (2017). Ionic and stable isotope chemistry as indicators of water sources to the upper Mendoza River basin, Central Andes of Argentina. Hydrol. Sci. J. 62, 588–605. doi: 10.1080/02626667.2016.1252840
Dansgaard, W. (1964). Stable isotopes in precipitation. Tellus 16, 436–468. doi: 10.1111/j.2153-3490.1964.tb00181.x
Dirección General de Aguas . (2022a). Inventario público de glaciares, actualización 2022. Available at: https://dga.mop.gob.cl/Paginas/InventarioGlaciares.aspx (Accessed January 2, 2023).
Dirección General de Aguas . (2022b). Metodología del Inventario Público de Glaciares. Unidad de Glaciología y Nieves. Dirección General de Aguas, 2022. Santiago: Ministerio de Obras Públicas.
Dussaillant, A., Benito, G., Buytaert, W., Carling, P., Meier, C., and Espinoza, F. (2010). Repeated glacial-lake outburst floods in Patagonia: an increasing hazard? Nat. Hazards 54, 469–481. doi: 10.1007/s11069-009-9479-8
Evans, S. G., Tutubalina, O. V., Drobyshev, V. N., Chernomorets, S. S., McDougall, S., Petrakov, D. A., et al. (2009). Catastrophic detachment and high-velocity long-runout flow of Kolka glacier, Caucasus Mountains, Russia in 2002. Geomorphology 105, 314–321. doi: 10.1016/j.geomorph.2008.10.008
Falaschi, D., Bolch, T., Lenzano, M. G., Tadono, T., Lo Vecchio, A., and Lenzano, L. (2018). New evidence of glacier surges in the Central Andes of Argentina and Chile. Progress Phys. Geograph. 42, 792–825. doi: 10.1177/0309133318803014
Falaschi, D., Kääb, A., Paul, F., Tadono, T., Rivera, J. A., and Lenzano, L. E. (2019). Brief communication: collapse of 4 mm 3 of ice from a cirque glacier in the Central Andes of Argentina. Cryosphere 13, 997–1004. doi: 10.5194/tc-13-997-2019
Falvey, M., and Garreaud, R. (2007). Wintertime precipitation episodes in Central Chile: associated meteorological conditions and orographic influences. J. Hydrometeorol. 8, 171–193. doi: 10.1175/JHM562.1
Farías-Barahona, D., Ayala, Á., Bravo, C., Vivero, S., Seehaus, T., Vijay, S., et al. (2020a). 60 years of glacier elevation and mass changes in the Maipo River basin, Central Andes of Chile. Remote Sensing 12:1658. doi: 10.3390/rs12101658
Farías-Barahona, D., Vivero, S., Casassa, G., Schaefer, M., Burger, F., Seehaus, T., et al. (2019). Geodetic mass balances and area changes of Echaurren Norte glacier (Central Andes, Chile) between 1955 and 2015. Remote Sens. 11:260. doi: 10.3390/rs11030260
Farías-Barahona, D., Wilson, R., Bravo, C., Vivero, S., Caro, A., Shaw, T. E., et al. (2020b). A near 90-year record of the evolution of El Morado glacier and its proglacial lake, central Chilean Andes. J. Glaciol. 66, 846–860. doi: 10.1017/jog.2020.52
Fernández-Navarro, H., García, J. L., Nussbaumer, S. U., Tikhomirov, D., Pérez, F., Gärtner-Roer, I., et al. (2023). Fluctuations of the Universidad glacier in the Andes of Central Chile (34° S) during the latest Holocene derived from a 10Be moraine chronology. Quat. Sci. Rev. 300:107884. doi: 10.1016/j.quascirev.2022.107884
Fock, A. (2005). Cronología y tectónica de la exhumación en el Neógeno de los Andes de Chile central entre los 33 y los 34 S. Universidad de Chile: Santiago, 235 p.
Garreaud, R. D., Alvarez-Garreton, C., Barichivich, J., Boisier, J. P., Christie, D., Galleguillos, M., et al. (2017). The 2010–2015 megadrought in Central Chile: impacts on regional hydroclimate and vegetation. Hydrol. Earth Syst. Sci. 21, 6307–6327. doi: 10.5194/hess-21-6307-2017
Garreaud, R., Boisier, J. P., Rondanelli, R., Montecinos, A., Sepúlveda, H. H., and Veloso-Aguila, D. (2019). The Central Chile mega drought (2010–2018): a climate dynamics perspective. Int. J. Climatol. 40, 421–439. doi: 10.1002/joc.6219
Gilbert, A., Leinss, S., Kargel, J., Kääb, A., Gascoin, S., Leonard, G., et al. (2018). Mechanisms leading to the 2016 giant twin glacier collapses, Aru range, Tibet. Cryosphere 12, 2883–2900. doi: 10.5194/tc-12-2883-2018
Gonzalez, M. C., Moreiras, S. M., Jomelli, V., and Arnaud-Fassetta, G. (2020). Riesgo de crecida por rompimiento de diques de hielo en la cuenca del plomo, Andes Centrales (33° S): perspectivas a partir de eventos históricos. Cuadernos de investigación geográfica: Geographical Research Letters 46, 223–249. doi: 10.18172/cig.4219
Gruber, S. (2012). Derivation and analysis of a high-resolution estimate of global permafrost zonation. Cryosphere 6, 221–233. doi: 10.5194/tc-6-221-2012
Hallam, A., Biró-Bagóczkyl, L., and Pérez, E. (1986). Facies analysis of the Lo Valdés formation (Tithonian–Hauterivian) of the high cordillera of Central Chile, and paleogeographic evolution of the Andean basin. Geol. Mag. 123, 425–435. doi: 10.1017/S0016756800033513
Hauser, A. (2000). Remociones en masa en Chile (versión actualizada). Servicio Nacional de Geología y Minería: Santiago.
Hauser, A. (2002). Rock avalanche and resulting debris flow in estero Parraguirre and Rio Colorado, Región Metropolitana, Chile. In Cata-strophic landslides: effects, occurrence, and mechanisms, Evans SG, DeGraf JV (eds). Geol. Soc. Am. Rev. Eng. Geol. 15, 135–148. doi: 10.1130/REG15-p135
Hock, R., Rasul, G., Adler, C., Cáceres, B., Gruber, S., Hirabayashi, Y., et al. (2019). High mountain areas. In Pörtner, H.-O., Roberts, D. C., Masson-Delmotte, V., Zhai, P., Tignor, M., and Poloczanska, E. IPCC special report on the ocean and cryosphere in a changing climate (pp. 131–202).
Huggel, C., Zgraggen-Oswald, S., Haeberli, W., Kääb, A., Polkvoj, A., Galushkin, I., et al. (2005). The 2002 rock/ice avalanche at Kolka/Karmadon, Russian Caucasus: assessment of extraordinary avalanche formation and mobility, and application of quick bird satellite imagery. Nat. Hazards Earth Syst. Sci. 5, 173–187. doi: 10.5194/nhess-5-173-2005
IPCC (2021). “Summary for policymakers” in Climate change 2021: The physical science basis. Contribution of working group I to the sixth assessment report of the intergovernmental panel on climate change. eds. V. Masson-Delmotte, P. Zhai, A. Pirani, S. L. Connors, C. Péan, and S. Berger (Cambridge: Cambridge University Press).
Iribarren Anacona, P., Mackintosh, A., and Norton, K. P. (2015). Hazardous processes and events from glacier and permafrost areas: lessons from the Chilean and Argentinean Andes. Earth Surf. Process. Landf. 40, 2–21. doi: 10.1002/esp.3524
Jacquemart, M., and Cicoira, A. (2021). Hazardous glacier instabilities: ice avalanches, sudden large-volume detachments of low-angle mountain glaciers, and glacier surges. Treatise Geomorphol. 4, 330–345.
Jacquemart, M., Loso, M., Leopold, M., Welty, E., Berthier, E., and Hansen, J. S. (2020). What drives large-scale glacier detachments? Insights from Flat Creek glacier, St. Elias mountains, Alaska. Geology 48, 703–707.2 others. doi: 10.1130/G47211.1
Jacquemart, M., Welty, E., Leopold, M., Loso, M., Lajoie, L., and Tiampo, K. (2022). Geomorphic and sedimentary signatures of catastrophic glacier detachments: a first assessment from Flat Creek, Alaska. Geomorphology 414:108376. doi: 10.1016/j.geomorph.2022.108376
Jiskoot, H. (2011). “Glacier surging” in Encyclopedia of snow, ice and glaciers (Dordrecht: Springer), 415–428.
Kääb, A., Jacquemart, M., Gilbert, A., Leinss, S., Girod, L., Huggel, C., et al. (2021). Sudden large-volume detachments of low-angle mountain glaciers–more frequent than thought? Cryosphere 15, 1751–1785. doi: 10.5194/tc-15-1751-2021
Kääb, A., Leinss, S., Gilbert, A., Bühler, Y., Gascoin, S., Evans, S. G., et al. (2018). Massive collapse of two glaciers in western Tibet in 2016 after surge-like instability. Nat. Geosci. 11, 114–120. doi: 10.1038/s41561-017-0039-7
Kotlyakov, V. M., Rototaeva, O. V., and Nosenko, G. A. (2004). The September 2002 Kolka glacier catastrophe in North Ossetia, Russian Federation: evidence and analysis. Mt. Res. Dev. 24, 78–83. doi: 10.1659/0276-4741(2004)024[0078:TSKGCI]2.0.CO;2
Lliboutry, L. (1956) Nieves y glaciares de Chile, fundamentos de glaciologíaa. Santiago, Chile: Universidad de Chile, 472.
Marangunic, C. (1979). Inventario de glaciares en la hoya del Río Maipo. Dirección General de Aguas (DGA): Santiago, Chile.
Marangunic, C. (1980). Informe sobre deslizamientos de glaciares en el Estero del Aparejo, Valle del Río Maipo, Área Metropolitana. Oficina Nacional de Emergencias: Santiago, 8.
Marangunic, C. (1997). Deslizamiento catastrófico del glaciar en el Estero Aparejo. Actas del 4° Congreso Chileno de Geotecnia 2, 617–626.
Mardones, V., Peña, M., Pairoa, S., Ammirati, J. B., and Leisen, M. (2021). Architecture, kinematics, and tectonic evolution of the principal cordillera of the Andes in Central Chile (∼ 33.5° S): insights from detrital zircon U-pb geochronology and Seismotectonics implications. Tectonics 40:e2020TC006499. doi: 10.1029/2020TC006499
Masiokas, M. H., Christie, D. A., Le Quesne, C., Pitte, P., Ruiz, L., Villalba, R., et al. (2016). Reconstructing the annual mass balance of the Echaurren Norte glacier (Central Andes, 33.5 S) using local and regional hydroclimatic data. Cryosphere 10, 927–940. doi: 10.5194/tc-10-927-2016
Masiokas, M. H., Villalba, R., Luckman, B. H., Le Quesne, C., and Aravena, J. C. (2006). Snowpack variations in the Central Andes of Argentina and Chile, 1951–2005: large-scale atmospheric influences and implications for water resources in the region. J. Clim. 19, 6334–6352. doi: 10.1175/JCLI3969.1
Montecinos, A., and Aceituno, P. (2003). Seasonality of the ENSO-related rainfall variability in Central Chile and associated circulation anomalies. J. Clim. 16, 281–296. doi: 10.1175/1520-0442(2003)016<0281:SOTERR>2.0.CO;2
NOAA . (2024). Historical El Nino / La Nina episodes (1950-present). Available at: https://origin.cpc.ncep.noaa.gov/products/analysis_monitoring/ensostuff/ONI_v5.php (Accessed January 12, 2024).
Peña, H. (1980). Situación de los glaciares del estero Aparejo, río Yeso. Informe Interno. Dirección General de Aguas (DGA): Santiago.
Peña, H., and Klohn, W. (1989). “Non-meteorological flood disasters in Chile” in Hydrology of disasters. eds. O. Starosolszky and O. M. Melder (London: James & James), 243–258.
Quintana, J. M., and Aceituno, P. (2012). Changes in the rainfall regime along the extratropical west coast of South America (Chile): 30-43° S. Atmósfera 25, 1–22.
Riesner, M., Lacassin, R., Simoes, M., Carrizo, D., and Armijo, R. (2018). Revisiting the crustal structure and kinematics of the Central Andes at 33.5°S: implications for the mechanics of Andean mountain building. Tectonics 37, 1347–1375. doi: 10.1002/2017TC004513
Rodríguez, I., Páez, J., de Vries, M. S. V. W., de Vries, B. V. W., and Godoy, B. (2020). Dynamics and physical parameters of the Lastarria debris avalanche, Central Andes. J. Volcanol. Geotherm. Res. 402:106990. doi: 10.1016/j.jvolgeores.2020.106990
Rozanski, K., and Araguás, L. (1995). Spatial and temporal variability of stable isotope composition over the south American continent. Bulletin Institut Francais D'etudes Andines 24, 379–390. doi: 10.3406/bifea.1995.1189
Rozanski, K., Araguas-Araguas, L., and Gonfiantini, R. (1993). “Isotopic patterns in modern global precipitation” in Climate change in continental isotopic records. Geophysical monograph, vol. 78 (Washington, DC: AGU), 1–36.
Salazar, C. Y., and Stinnesbeck, W. (2015). Redefinition, stratigraphy and facies of the Lo Valdés formation (upper Jurassic-lower cretaceous) in Central Chile. Boletín del Museo Nacional de Historia Natural 64, 41–68. doi: 10.54830/bmnhn.v64.2015.109
Sandmeier, K. J. (2011). ReflexW Manual Ver. 6. Available at: http://www.sandmeier-geo.de/Download/reflexw_manual.pdf
Sernageomin . (2021). Informe sobre condición de embancamiento en confluencia de río colorado con Estero Las Vacas, comuna de San José de Maipo. Available at: https://disasterscharter.org/documents/10180/9099784/Daily-report-flooding-landslides-Chile.pdf (Accessed January 12, 2024).
Spangenberg, J. E., Dold, B., Vogt, M. L., and Pfeifer, H. R. (2007). Stable hydrogen and oxygen isotope composition of waters from mine tailings in different climatic environments. Environ. Sci. Technol. 41, 1870–1876. doi: 10.1021/es061654w
Ugalde, F. (2016). Estimación de peligro ante deslizamientos de glaciares en Chile central: el caso del glaciar Aparejo. Memoria de Título. Santiago: Universidad de Chile, 125 p.
Ugalde, F., Casassa, G., Marangunic, C., Mujica, R., and Peralta, C. (2015). El deslizamiento catastrófico del glaciar Aparejo: 35 años después, in: XiV Congreso Geologico Chileno, 4–8 October 2015. La Serena 2, 686–689.
Ugalde, F., Marangunic, C., and Casassa, G. (2017). Ice thickness changes at aparejo glacier in Central Chile from interferometric satellite data, first IEEE international symposium of geoscience and remote sensing (GRSS-CHILE), 15–16 June 2017. Valdivia 2017, 1–4. doi: 10.1109/GRSSCHILE.2017.7996013
Vera, C., Baez, J., Douglas, M., Emmanuel, C. B., Marengo, J., Meitin, J., et al. (2006). The south American low-level jet experiment. Bull. Am. Meteorol. Soc. 87, 63–78. doi: 10.1175/BAMS-87-1-63
Walder, J. S., Schilling, S. P., Vallance, J. W., and LaHusen, R. G. (2004). “Effects of lava-dome growth on the crater glacier of Mount St. Helens, Washington” in A volcano rekindled: the renewed eruption of mount St. Helens, 2004–2006. eds. D. R. Sherrod, W. E. Scott, and P. H. Stauffer, 257–276.
Keywords: glacier detachment, cryospheric hazards, mass movement, glacier regeneration, ground penetrating radar, Central Andes, Chile
Citation: Ugalde F, Casassa G, Marangunic C, Fernandoy F, Carrasco J and Buglio F (2024) The 1980 Aparejo Glacier catastrophic detachment: new insights and current status. Front. Water. 6:1377216. doi: 10.3389/frwa.2024.1377216
Edited by:
Simon Gascoin, UMR5126 Centre d'études spatiales de la biosphère (CESBIO), FranceReviewed by:
Rijan Bhakta Kayastha, Kathmandu University, NepalAleksandar Valjarević, University of Belgrade, Serbia
Copyright © 2024 Ugalde, Casassa, Marangunic, Fernandoy, Carrasco and Buglio. This is an open-access article distributed under the terms of the Creative Commons Attribution License (CC BY). The use, distribution or reproduction in other forums is permitted, provided the original author(s) and the copyright owner(s) are credited and that the original publication in this journal is cited, in accordance with accepted academic practice. No use, distribution or reproduction is permitted which does not comply with these terms.
*Correspondence: Felipe Ugalde, fugalde@geoestudios.cl