

- 1 Division of Biology, California Institute of Technology, USA
Combining intracellular electrophysiology and multi-photon calcium imaging in vivo, we studied the relationship between calcium signals (sampled at 500–750 Hz) and spike output in principal neurons in the locust antennal lobe. Our goal was to determine whether the firing rate of individual neurons can be estimated in vivo with calcium imaging and, if so, to measure directly the accuracy and resolution of our estimates. Using the calcium indicator Oregon Green BAPTA-1, we describe a simple method to reconstruct firing rates from dendritic calcium signals with 80–90% accuracy and 50 ms temporal resolution.
Introduction
Direct electrical measurements using extracellular electrode arrays and spike-sorting algorithms (Pouzat et al., 2002 ) are routinely used to examine neuronal activity in vivo (Dragoi and Buzsaki, 2006 ; Sargolini et al., 2006 ; Siapas et al., 2005 ). Such techniques are very powerful; they allow the simultaneous recording of small groups of neurons, typically up to 25 in insects (Perez-Orive et al., 2002 ) and 100 in rodents (Buzsaki, 2004 ), with an excellent temporal resolution (< 10 µs); yet, precise identification of the recorded neurons usually remains difficult to impossible. Optical techniques, such as calcium imaging (Denk and Svoboda, 1997 ; Helmchen and Waters, 2002 ; Smetters et al., 1999 ; Tsien, 1999 ; Yuste and Katz, 1991 ), have also been used in vivo with some success in insects and vertebrates (Brustein et al., 2003 ; Carlsson et al., 2005 ; Charpak et al., 2001 ; Delaney et al., 2001 ; Egelhaaf and Borst, 1995 ; Helmchen et al., 1999 ; Kerr et al., 2005 ; Ohki et al., 2005 ; Sachse and Galizia, 2002 ; Sobel and Tank, 1994 ; Stosiek et al., 2003 ; Svoboda et al., 1997 ; Wang et al., 2003 ; Yaksi and Friedrich, 2006 ). In this case, the advantages are more or less reversed: cell identification is easy, but estimating spiking activity from neuronal cytoplasmic calcium variation is difficult, especially when single spike resolution is desired (Carlsson et al., 2005 ; Sachse and Galizia, 2002 ; Wang et al., 2003 ). For example, calcium signals may not be coupled exclusively to action potential production; if subthreshold depolarization activates low voltage-gated calcium channels, calcium signals will represent a complex combination of synaptic input, intrinsic properties, and spike output. The lifetimes of calcium signals and of action potentials are also very different, making the extraction of spike rates below the calcium frequency cut-off indirect and computationally intensive (see Yaksi and Friedrich, 2006 ).
The early olfactory system, with its well-described molecular and anatomical layout (Buck and Axel, 1991 ; Hallem et al., 2004 ; Mombaerts et al., 1996 ; Vosshall et al., 2000 ), offers a beautiful opportunity to decipher basic information processing rules for chemical signals and, in so doing, combine imaging and electrophysiological approaches. In the exploration of such a sensory system, calcium imaging has been used in vivo to visualize concentration-dependence, tuning properties, and spatial maps of olfactory receptorsquotidn (ORN) activations in anesthetized mouse and rat (Fried et al., 2002 ; Spors et al., 2006 ; Wachowiak and Cohen, 2001 ), in zebrafish (Friedrich and Korsching, 1997 ), and in insects (Galizia et al., 1999 ; Wang et al., 2003 ); and to investigate spatiotemporal activity patterns of output and local neurons in the insect antennal lobe (Carlsson et al., 2005 ; Sachse and Galizia, 2002 ; Wang et al., 2003 ) and in the zebrafish olfactory bulb (Yaksi and Friedrich, 2006 ). In nearly all cases (with the exception of Yaksi and Friedrich, 2006 ), the true relationship between calcium signals and spike output (thresholds, dynamics range, transfer function) was unknown, complicating functional interpretation. Using a well-described model system (Laurent and Davidowitz, 1994 ; Laurent, 2002 ), we combined in vivo intracellular voltage recordings and two-photon calcium imaging on the antennal lobe's output neurons, the projection neurons (PNs); we attempted to derive a simple method to estimate spike output from dendritic calcium signals, using only one experiment-specific parameter (baseline fluorescence signal).
Materials and Methods
Animal preparation
Young adult female locusts (Schistocerca americana) from our crowded colony were prepared as described previously (Laurent and Davidowitz, 1994 ). The brain was exposed and held on a small platform to prevent any movements during imaging. The head and brain were oriented such that the glomerular arborization plane of most PNs was horizontal. The brain was desheathed, the antennal muscles denervated, and the brain superfused with locust saline (Laurent and Davidowitz, 1994 ). Odors (cis-3-hexen-1-ol, benzaldehyde, isoamylacetate, 1-hexanol, cherry, citral, cineole, 3-pentanone) were delivered using a custom-made odor-delivery system and a Teflon nozzle (diameter 1 cm) placed 1–3 cm away from one antenna. Odors were delivered in a constant stream of air (0.4–0.8 L∕second) at final concentrations of ca. 0.5 to 50%. The results reported are based on data obtained from 47 PNs in 40 animals.
Electrophysiology and dye loading
Thick (1.0 mm OD, 0.58 mm ID)- and thin (1.0 mm, 0.78 ID)-walled borosilicate electrodes with filament (Harvard Apparatus, Holliston, MA) were pulled on a Sutter Instruments (Novato, CA) P2000 horizontal laser puller and filled with a solution containing 2–3 mM Oregon Green BAPTA-1 (OGB-1; Molecular Probes, Eugene, OR) in 2 M potassium chloride (DC resistance: 70–150 M Ω). PNs were impaled by targeting the Ω-shaped neurite (∼2 µm diameter) from which the glomerular spokes (secondary dendrites) originate (see Figure 1 ). We also impaled PNs from their primary neurite (leading to the soma), from secondary dendrites and from glomerular branchlets. Spike waveforms and amplitudes did not differ significantly across these recording sites, suggesting that spike-mediating currents are quite homogeneously distributed throughout. Usable recordings lasted between 15 and 90 minutes. Local neurons were easily distinguished from PNs by their anatomy and absence of sodium action potentials (Stopfer and Laurent, 1999 ). Data were acquired via an Axoclamp-2B amplifier (Axon Instruments, Union City, CA), a National Instruments A-D card (15 kHz sampling) and LabView software (National Instruments, Austin, TX).
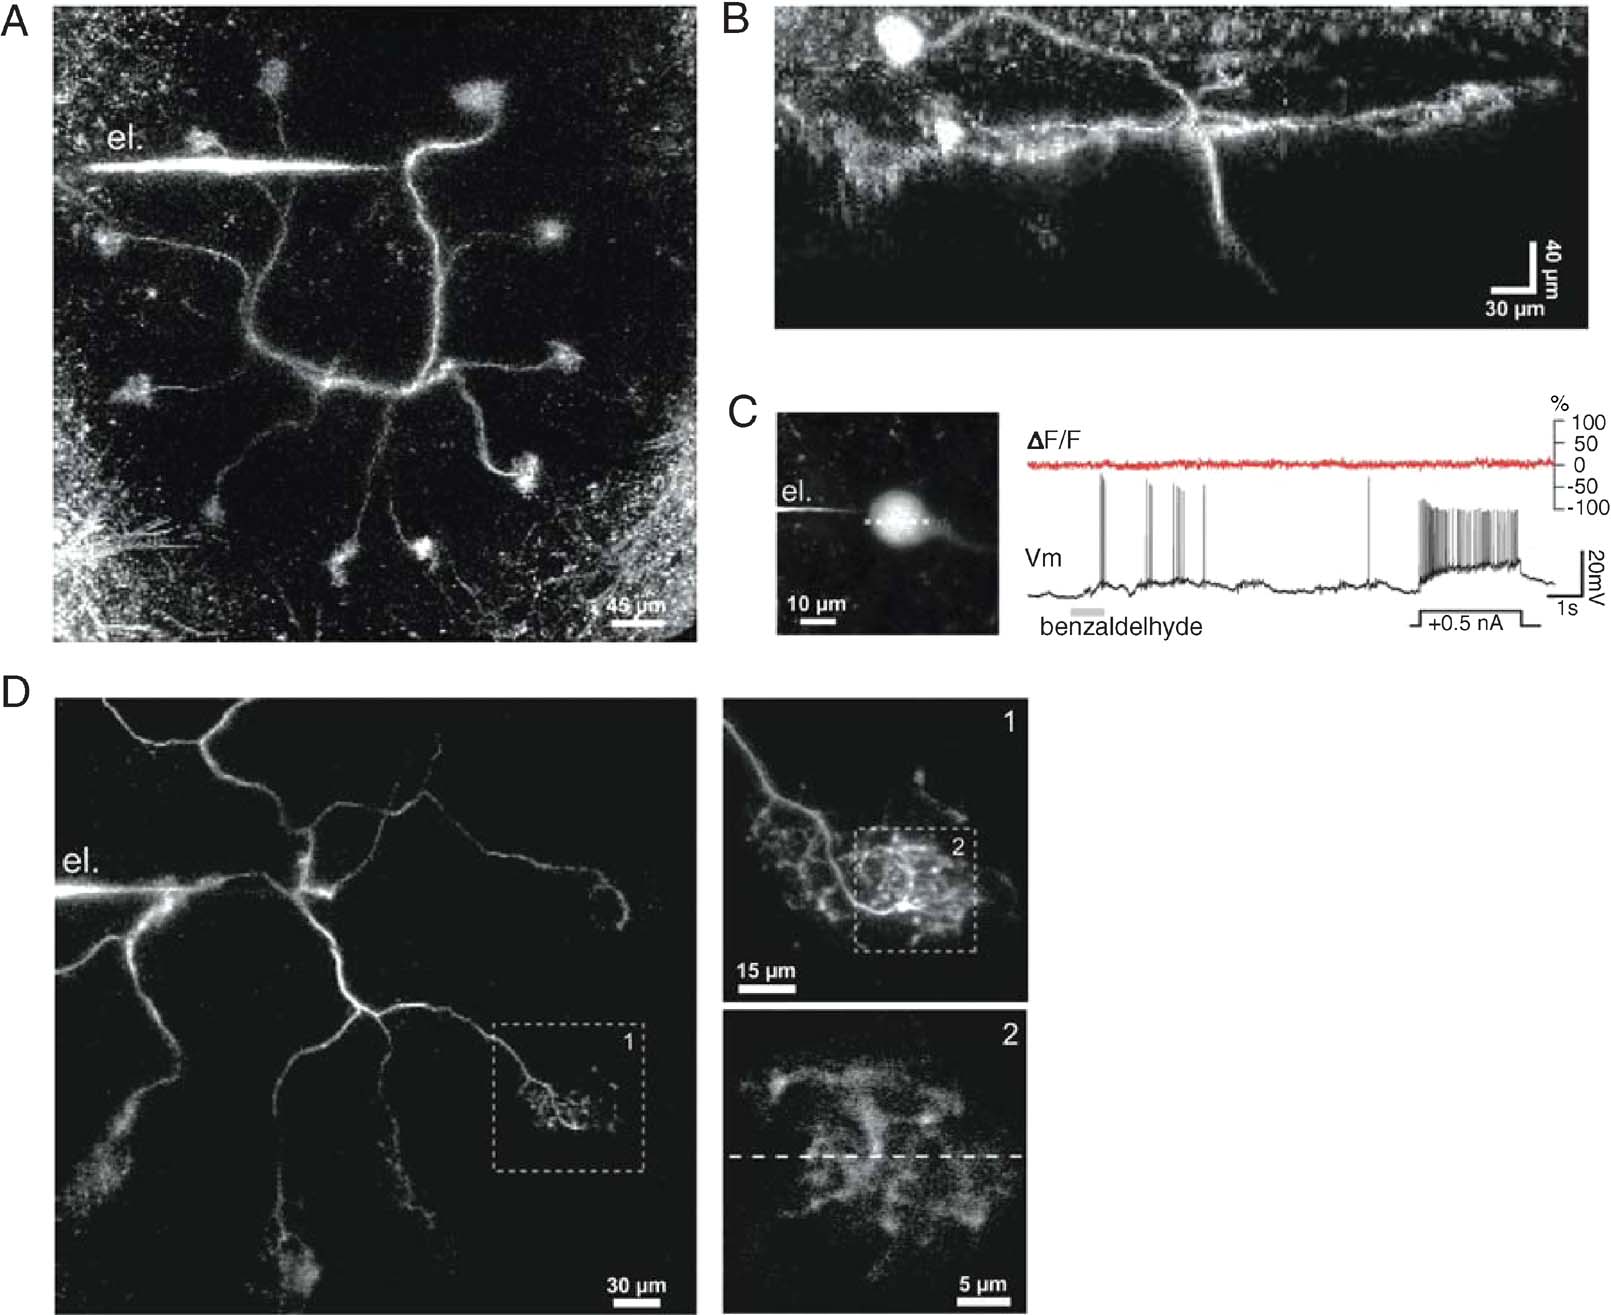
Figure 1. In vivo two-photon imaging of the calcium indicator OGB-1 in locust projection neurons (PNs). (A) Frontal view of a PN labeled from a secondary dendrite via the recording electrode (el.). Eleven of the PNquotidns 12 glomerular tufts can be seen, forming a circle in one plane. The soma and axon, respectively above and below the dendritic plane, are not included in this projection. (B) Side projection of a different PN, showing the soma (top left; typically on the antenna lobequotidns frontal surface), the plane of glomerular projections (view orthogonal to that in A), and part of the axon (pointing down). Fluorescence intensity was kept roughly constant over the image depth by tuning the laser excitation intensity. (C) Simultaneous voltage (Vm) and OGB-1-imaging (ΔF∕F, 500 Hz) recorded after dye injection into the soma (PN different from those in A–B): no significant changes in calcium signal could be induced by odor-evoked activity or current injection. (D) Dendritic impalement configuration typical for simultaneous calcium imaging and voltage recording (PN different from those in A–C): within 10 minutes of impalement, one or several tufts could be seen (box 1); a 30 × 30 µm2 area was then selected for line scans (stippled line, box 2).
In vivo calcium imaging
A two-photon microscope based on a galvanometric-mirrors-scan-system (Denk et al., 1990 ) and proximal detection (Radiance, 2001; BioRad, Hercule, CA) coupled to an upright microscope (BX51-WI; Olympus, Japan) was used to image calcium signals from PNs. A mode-locked Ti: sapphire laser (Tsunami-10 W pump; Spectra Physics, Mountain View, CA) tuned to 850 nm was used as excitation light. A gradient contrast system (Yi et al., 2006 ) used in widefield reflection mode allowed precise positioning of the brain and electrode, mounted on XY-translation stages. Non-prechirped excitation pulses were focused onto labeled PNs using a 40 × 0.75 NA water immersion lens (Leica Microsystems, Germany). The epi-collected fluorescence was bandpass filtered (520 BP 40, Chroma Technology, Rockingham, VT) and detected with a photomultiplier tube (bi-alkali photo cathode; Electron Tubes, UK). Application of up to 300 mW into the sample was needed to image glomeruli and dendrites located at a depth of up to 250 µm. To minimize photodamage, excitation power was adjusted with the depth of the focal plane using a liquid crystal based attenuator (NewPort, Irvine, CA) and kept to a minimum for sufficient S∕N ratio. No apparent changes in PN morphology, calcium signal, or electrical properties resulted from laser illumination. Twenty-four second-long line scans (256 pixel lines at 500 or 750 Hz) were performed across the width of individual glomeruli in their equatorial plane or on dendritic segments, and acquired with 12-bit resolution. Imaging and physiological data acquisitions were synchronized with a precision < 1 ms from a common pulsed command.
Data analysis
Electrophysiological and line-scan data were combined and analyzed off-line using LabView (National Instruments) and Igor (Wavemetrics) software. Fluorescence F was spatially averaged over the scanned line and temporally filtered (three-point median filter). Normalized fluorescence variations were computed as ΔF/F (t) = (F (t) − F0)/F0 where F (t) is the fluorescence at time t. Baseline fluorescence F0 was determined by averaging F (t) during periods (1–6 seconds) of resting activity (baseline, prior to odor pulse) or imposed hyperpolarization (Figures 3 and 5 ). Because background fluorescence was dominated by exogenous indicator, it was not subtracted. Note that all data will be presented for single (i.e., non averaged) trials. Spike-triggered averaged (STA) calcium transients were computed using a spike detection routine on Vm to align 200 ms segments of the raw F (t) traces (Figure 5 B). Smoothed firing rates were calculated from spike rasters (obtained from intracellular recording) by convolution with a Gaussian (σ = 50 ms) and subsequently down sampled to 500 or 750 Hz. Missed (M) and false positive (FP) events were measured after detection of local maxima in the measured and estimated firing rate profiles (separated by t ≥ 50 ms, Figure 6 A).
Algorithm for firing rate prediction
Our algorithm depends on three parameters—FB, TC, and S—derived from our experimental conditions (locust PNs; OGB-1). Of those, FB is the only experiment-specific calibration, used to measure baseline fluorescence at rest, in the absence of firing. FB is measured as the minimum value of F (t) during several seconds of baseline activity (typically, 6 seconds, preceding a stimulus pulse). TC is the duration over which the effect of the summation of two successive spike-evoked calcium transients cannot be resolved from baseline noise. S is the scaling factor used to convert the normalized fluorescence (F0 ≡ FB) into a firing rate unit (spikes∕second or sp∕second). The algorithm smooths the calcium trace (Gaussian filter, 10 Hz), measures slopes, identifies peaks and valleys, and implements the following steps for calcium-to-firing rate mapping:
Step 1 is a rectification of F (t): because positive and negative slopes in the smoothed F (t) trace represent changes in electrical activity (potential firing onset and interruption of firing, respectively), all portions of F (t) between a peak and the consecutive valley that last longer than TC are reset to FB, with a Gaussian decay function (σ = 50 ms) from the peak. F (t) between a peak and a consecutive valley separated by t < TC summate. This rectification brings most segments of negative slope to FB.
Step 2 is a linear scaling of the rectified F(t) by S to yield the estimated Rp(t). To reduce the false assignment of action potentials to calcium signals triggered by subthreshold depolarization, we set a 4 sp/second threshold on the estimated Rp(t), that is, estimated rates below this value are automatically set to 0. The choice of 4 sp∕second is justified in Figure 9 .
TC. Time parameter TC was determined empirically by generating the best fit between predicted and measured firing rates. Because the variance of this parameter across experiments was very small, we set it as a constant: TC = 1.2 τ, where τ is the time constant of decay of a spike-evoked transient (τ ≈ 50 ms, Figure 5 B).
S. S = 1.2 (sp∕second)/% was obtained by linear regression of measured versus predicted firing rates, using data from a selected set of PN-odor pairs (n = 5, Figures 6
A and 6
B). These PN-odor pairs were selected because measured odor-evoked firing rates did not exceed 40 sp∕second, thus limiting dye saturation (Figure 6
B). Normalized cross-correlation between predicted and measured firing rates, respectively Rp and Rm, were calculated as 
 where
where  is the linear correlation operator. Correlation coefficients were taken as absolute maxima of normalized cross-correlations (Figure 9
C). FP and M activity peaks (separated by at least 50 ms) were counted from Rp(t) and quantified as percentages of the total number of real spiking events (determined from Rm(t)).
is the linear correlation operator. Correlation coefficients were taken as absolute maxima of normalized cross-correlations (Figure 9
C). FP and M activity peaks (separated by at least 50 ms) were counted from Rp(t) and quantified as percentages of the total number of real spiking events (determined from Rm(t)).
Results
Locust projection neurons and experimental considerations
The locust antennal lobe contains about 830 PNs. The morphology of a typical locust PN is illustrated in Figures 1 A and 1 B. Somata are usually located near the anterior surface of the antennal lobe (Figure 1 B) and connected by a thin primary dendrite to a planar, multi-glomerular arbor contained within a ∼50 µm-thick “slice” (front view: Figure 1 A; side view: Figure 1 B). The glomeruli are the sites where ORN axons contact PN dendritic tufts. Typically, each locust PN projects to 10–14 glomeruli (out of ∼1000 in toto); correspondingly, individual ORN axons (∼90 000 in toto) project to several glomeruli (3–6). It is not known yet whether all ORN neurons of the same type converge to the same glomeruli, as they do in dipteras (Clyne et al., 1999 ; Hallem et al., 2004 ; Vosshall et al., 2000 ), nor whether the glomeruli visited by each PN are all innervated by ORNs of the same type, as observed with multi-glomerular mitral cells (MCs) in the mammalian accessory bulb (Del Punta et al., 2002; but see Wagner et al., 2006). In addition to receiving direct ORN input in the antennal lobe, PNs make direct, local excitatory connections with axon-less inhibitory neurons (Wilson et al., 2004; Jortner and Laurent, unpublished observations); because PN axons do not send collaterals in the antennal lobe, local PN output must originate from their glomerular dendrites. From this, we conclude that variations in intraglomerular calcium could reflect excitatory input from ORNs and spike-mediated PN output.
Spike output from PNs is routed downstream to the mushroom body where odor memorization and recall are thought to take place (Hammer and Menzel, 1998 ; Heisenberg, 1998 ), and to the lateral protocerebrum, via an axon (see initial segment in Figure 1 B, pointing down). When injected into the soma with sharp or patch microelectrodes (n = 10 PNs), BAPTA-based calcium indicators (Oregon Green 1 and 2) never diffused more than 10–20 µm away from the soma (for reasons thus far unknown). Despite large somatic voltage signals and the known expression of calcium currents in the soma membrane of insect neurons (Goldberg et al., 1999 ; Laurent et al., 1993 ), no calcium signal variations were observed (Figure 1 C). We next impaled PNs in their primary (Figures 1 A and 1 D) or finer dendrites with sharp microelectrodes backfilled with the high affinity indicator Oregon Green BAPTA-1 (OGB-1, Kd ∼ 200 nM). Dendritic resting potentials were between −55 and −60 mV and dendritic spike amplitudes between 40 and 60 mV (n = 47 PNs). Small constant currents (∼−200 pA) were often injected for iontophoresis; glomerular tufts could be seen within 3–10 minutes of impalement. Once a labeled glomerulus had been located (Figure 1 D, inset 1), we performed line scans within a 30 × 30 µm equatorial area at 500–750 Hz (Figure 1 D, inset 2). Electrophysiological and imaging data were acquired simultaneously over 24 second-long trials, and repeated several times with one or several of the eight odors in our stimulation apparatus (see Materials and Methods).
Calcium signals in vivo are noisy and heavily modulated
Single-trials containing a period of spontaneous activity and a 1 second-long odor stimulus (shaded bar) are shown in Figure 2 for three different PNs. At rest, these PNs fired an average of 2–5 sp∕second, typical of locust PNs in vivo (Mazor and Laurent, 2005 ; Perez-Orive et al., 2002 ), superimposed on a noisy background of synaptic activity. Upon odor stimulation, the neurons displayed complex, odor- and PN-specific firing characteristics (Laurent et al., 1996 ; Perez-Orive et al., 2002 ), with firing rates distributed between 0 and 60 sp∕second, as typical in locust. Periods of spiking alternated with epochs of hyperpolarization, which could in turn be interrupted by phasic subthreshold depolarizations (*, Figure 2 B). The recordings were free of movement artifacts, as indicated by the spatial stability of the fluorescence signals on each x-t scan (Figure 2 ). The normalized fluorescence fluctuations (ΔF/F, see Materials and Methods) seemed reasonably well correlated with those of Vm: they showed complex features, reflecting both the noisy and elevated baseline activity typical of in vivo conditions, and odor-induced firing modulation. Odor-evoked subthreshold depolarizing events or Vm modulation (*, Figure 2 ) could produce fluorescence increases comparable to those correlated with spiking. Individual spikes were accompanied by small calcium transients (∼2–10%), which we will examine in detail later. Interruptions in firing were generally accompanied by slow decays of fluorescence to below baseline average (▾), Figure 2 A–C), suggesting that a mapping between fluorescence and firing rates might require consideration of the neuron's past history of activity. We first examine OGB-1 fluorescence at baseline and PN dynamic ranges.
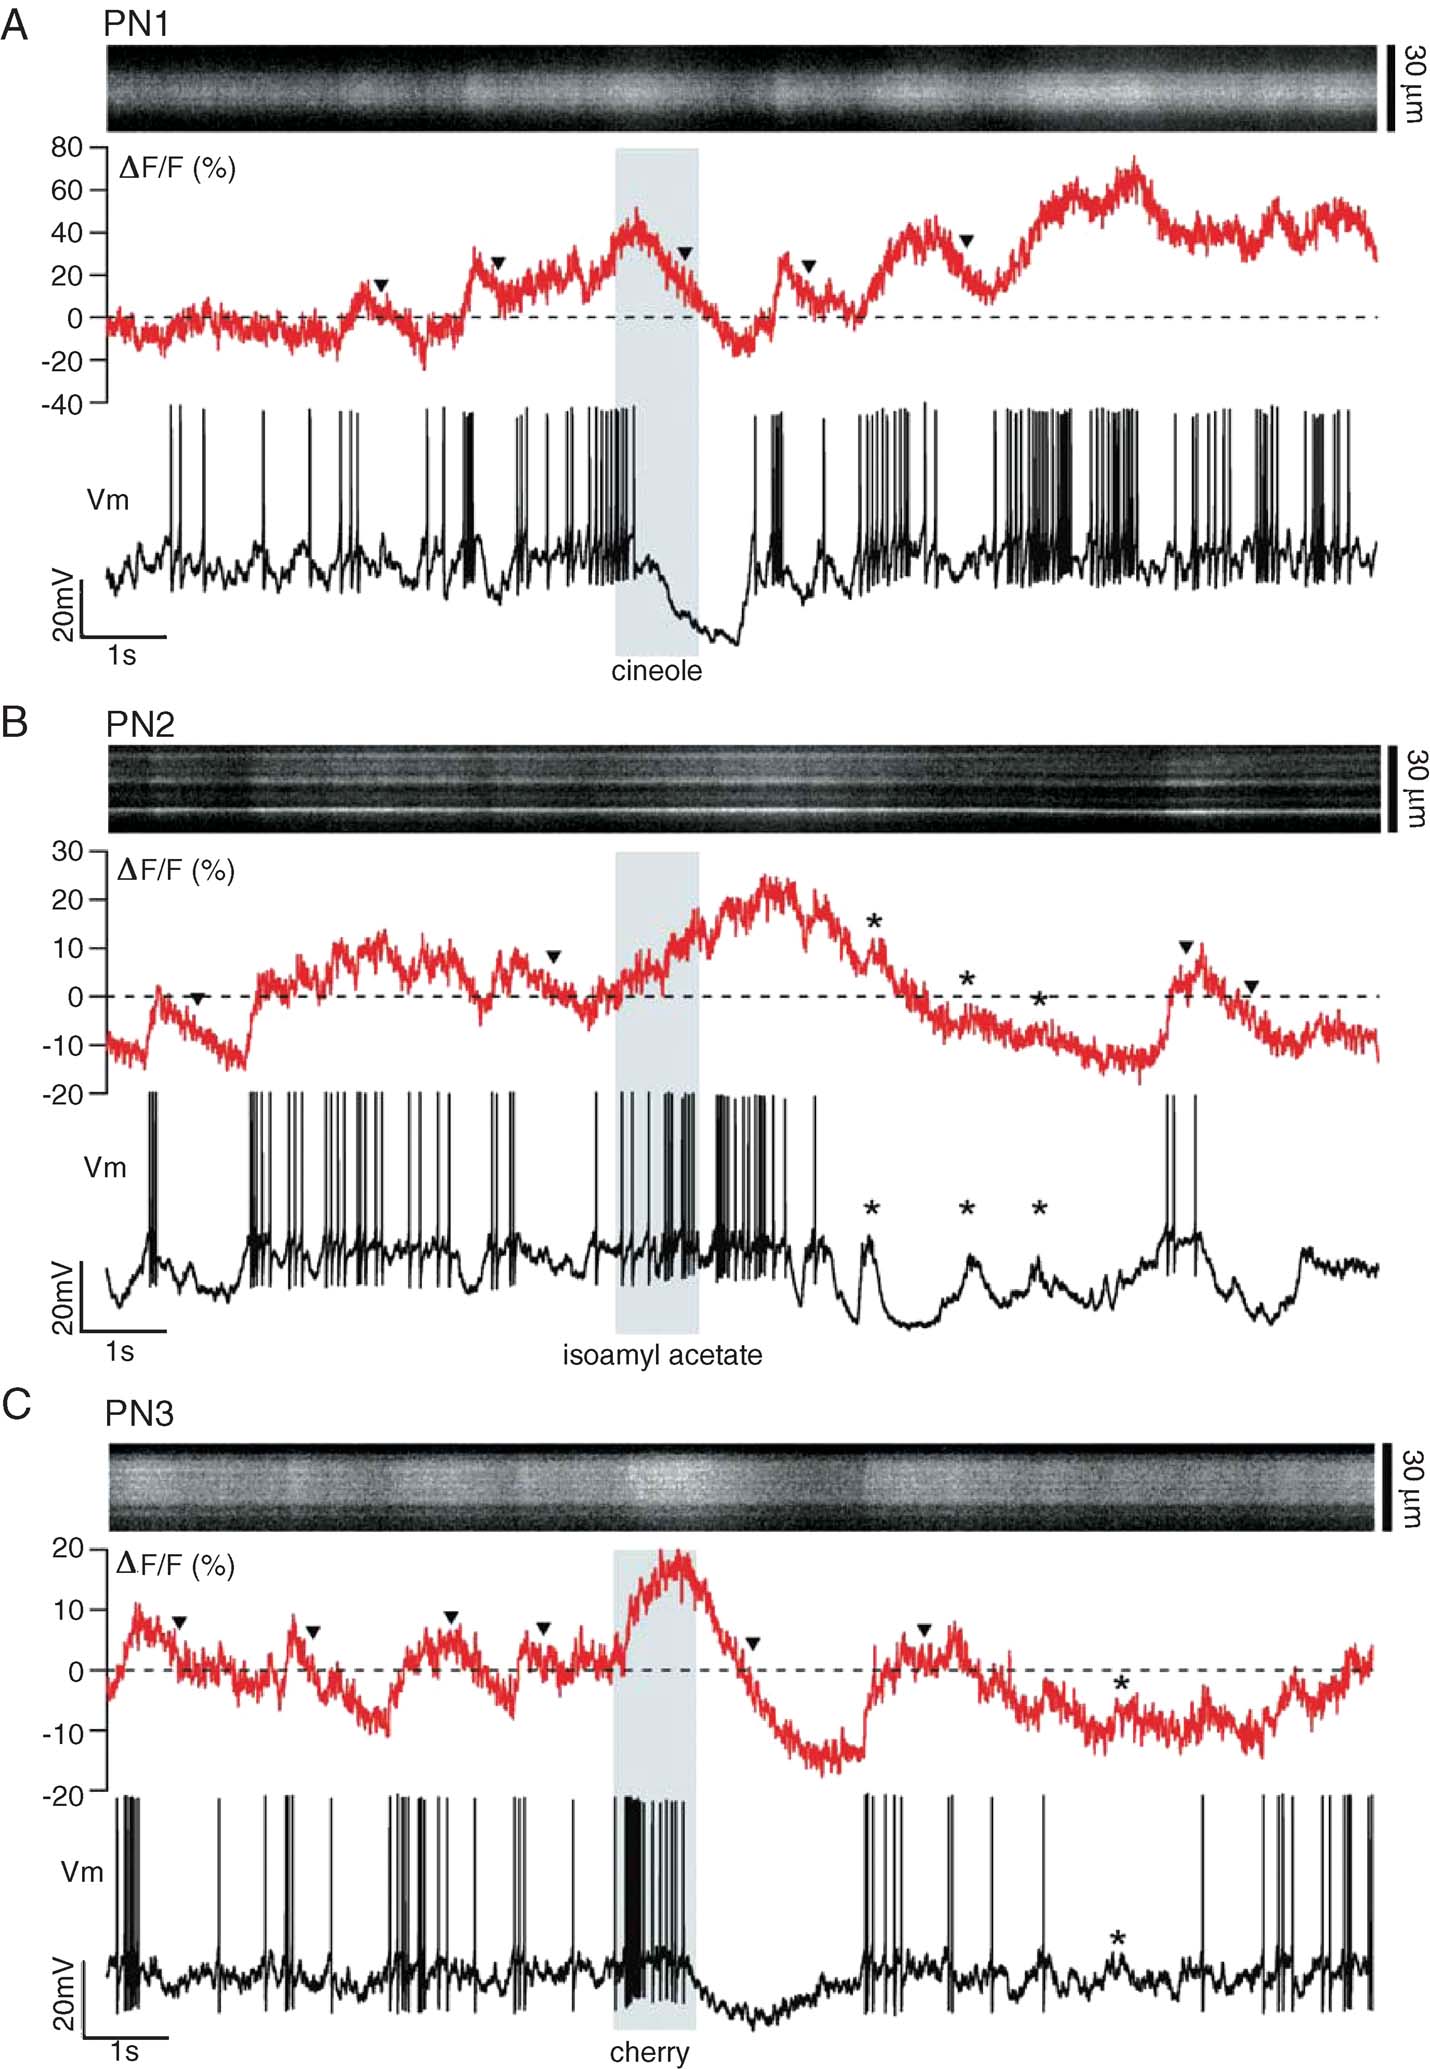
Figure 2. Simultaneous glomerular-calcium imaging and dendritic recording in PNs in vivo. (A–C) Single 24 second-long trials (16 seconds shown), each with a different PN and odor stimulus (indicated by vertical gray band). Top: xt-scan across one glomerular tuft (30 µm × 16 seconds); middle: corresponding ΔF∕F (500-Hz sampling); bottom: intracellular membrane potential (Vm; 15 kHz sampling). Stippled line: average baseline fluorescence before odor pulse. Note subthreshold components of PN voltage and corresponding ΔF∕F deflections (asterisks), and non-exponential decay of ΔF∕F after cessation of firing (triangles).
Dynamic ranges
We recorded intracellular potential and OGB-1 fluorescence signal fluctuations from PN glomerular dendrites in vivo and compared results obtained at resting potential (Figure 3 A) and at a moderately hyperpolarized holding potential (Figure 3 B). We made the following observations:
- Average baseline OGB-1 fluorescence at resting potential was somewhere in the middle of the indicator's dynamic range; this was confirmed by observing the consequences of short current pulses (Figure 3 A, I > 0: trial 1; I < 0: trial 2) on OGB-1 fluorescence. It follows that periods of decreased firing are accompanied by a decrease in OGB-1 fluorescence, and that periods of firing following a period of silence produce fluorescence transients that may not exceed the baseline mean; this can be seen for many of the action potentials produced in response to the cineole odor pulse (Figure 3 A).
- Only very high firing rates (obtained artificially by direct current injection; Figures 3 A and 3 B) led to likely saturation of the OGB-1 signal (70% ΔF/F, relative to minimum, reached in response to negative current injection). From this, we conclude that OGB-1 is well suited to detect the variations of PN activity that occur within their normal operating range (0–20 sp∕second, with rare transient discharges at rates not exceeding 60 sp∕second).
- Spontaneous and stimulus-evoked variations of fluorescence were often of similar magnitudes and time courses (for a PN held at its normal resting potential); care will thus be required to identify responses from these calcium signals.
- Despite these complications, OGB-1 signals were reasonably consistent across trials (Figure 3 A), and clearly correlated with the simultaneously recorded voltage: the variation of OGB-1 signals across trials clearly matched that of the PN's firing profiles over those trials. This suggests that OGB-1 signals may be sufficiently informative to reconstruct PN firing profiles in single trials.
- While OGB-1 signals were high at baseline (i.e., at normal resting potential in vivo), much of the baseline fluorescence was reduced by simple hyperpolarizing current injection. This indicates that much of the baseline intradendritic calcium enters through voltage-gated channels, even if calcium channel activation is itself likely due primarily to (depolarizing) synaptic bombardment (see below).
From these observations, we conclude that the Kd and dynamic range of OGB-1 are well matched to the operating range of locust PNs in vivo, and thus potentially well suited to reconstruct spiking activity from calcium-dependent fluorescence signals.
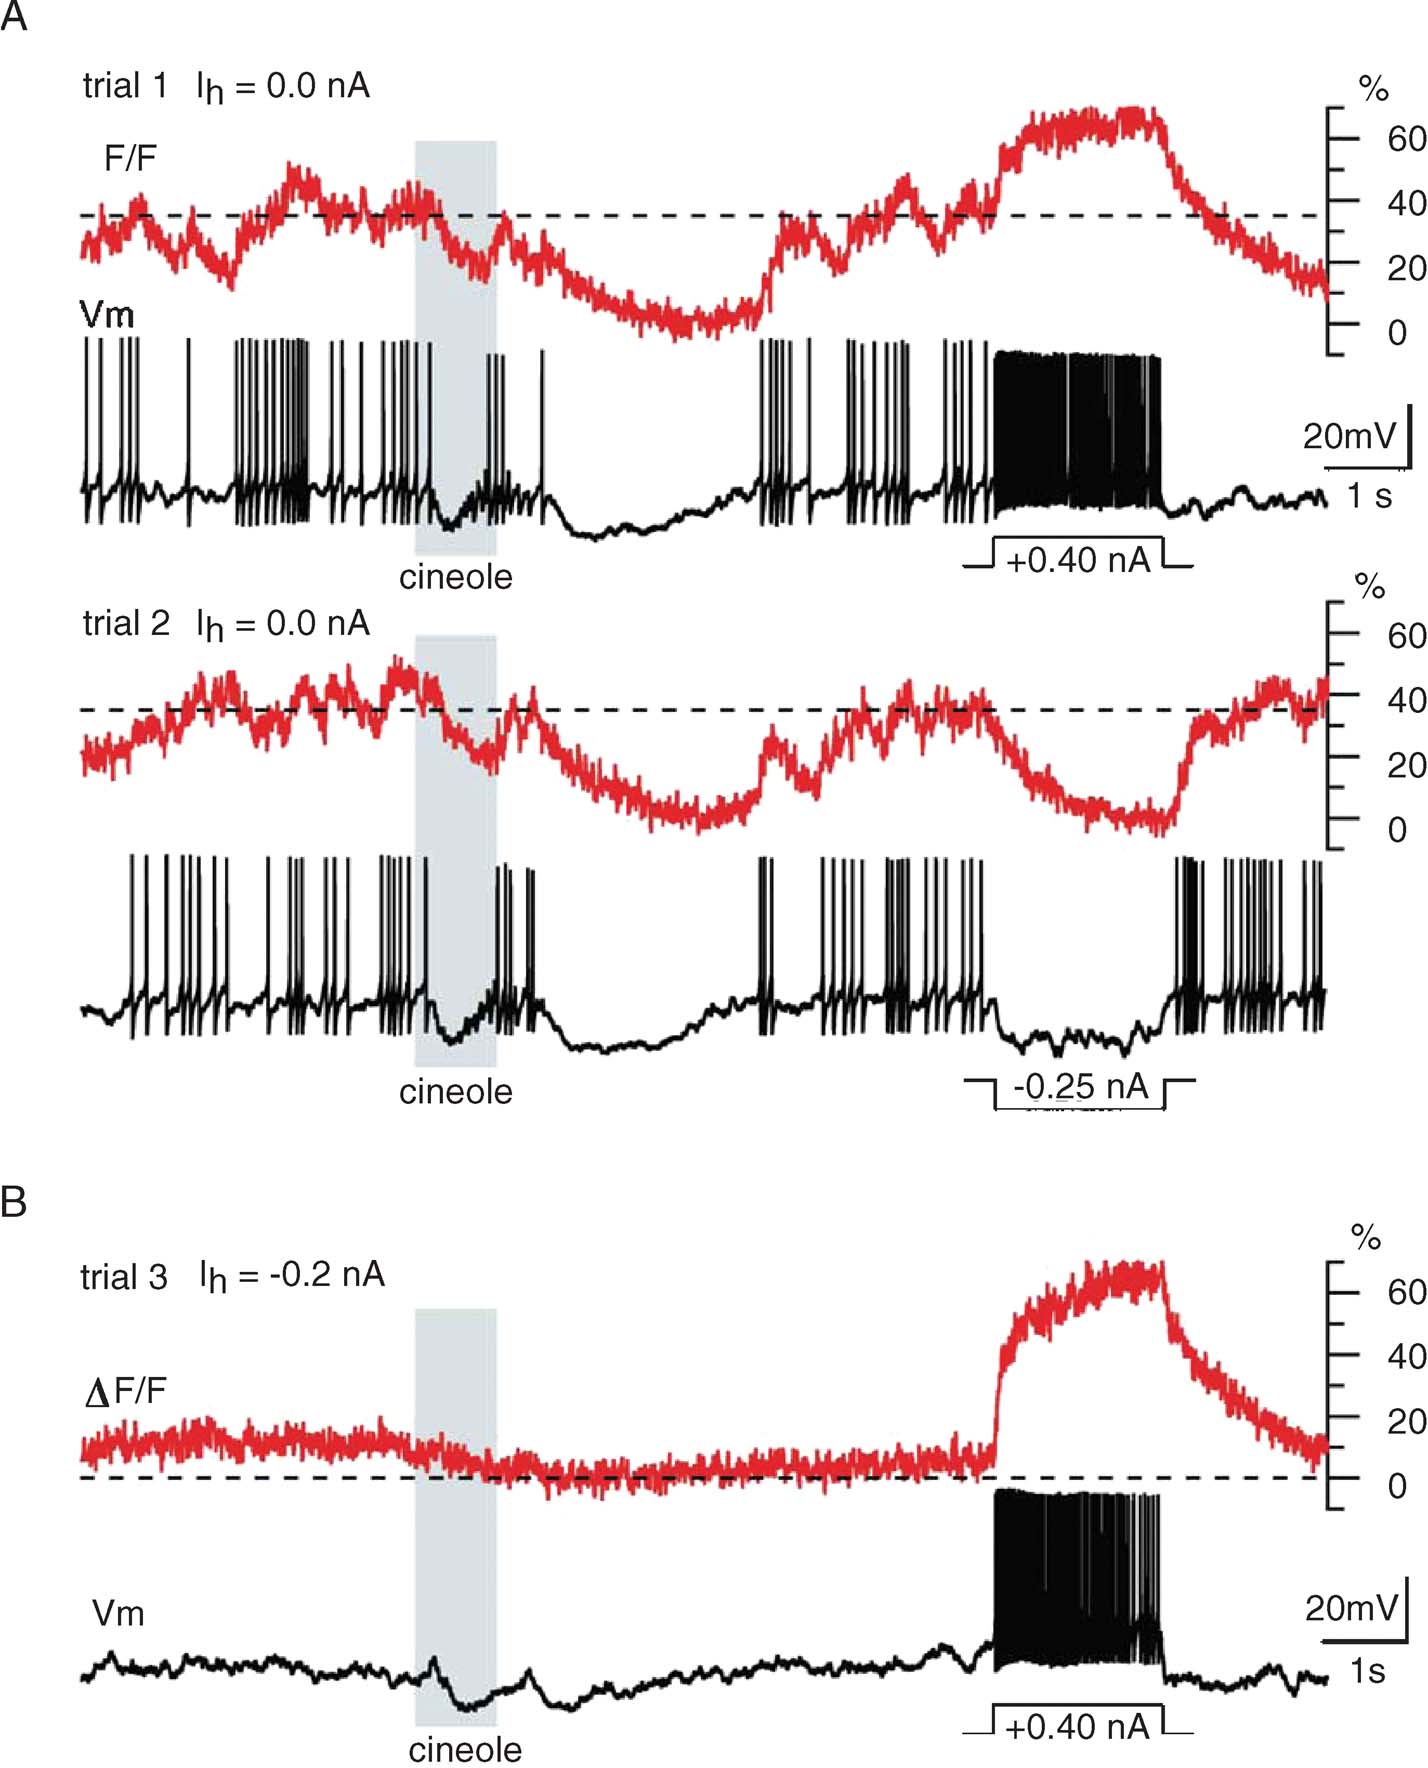
Figure 3. Calcium signal dynamics upon odor presentation and intracellular current injection. (A) Two successive trials with odor cineole (15 seconds of the 24 acquired for each trial are displayed) illustrating (i) the elevated baseline fluorescence (corresponding to a mean baseline firing rate of 5 sp∕second, typical for PNs), (ii) the odor-evoked fluorescence modulation (mostly below baseline in this example), and (iii) inter-trial response reliability. Current pulses (top: positive; bottom: negative) were injected toward the end of each trial, to evaluate the dynamic range of the fluorescence signal. F0: minimum fluorescence, reached here during both odor- and pulse-evoked hyperpolarizations. Stippled line: mean baseline fluorescence, determined before odor pulse. (B) Same PN, held slightly hyperpolarized by constant current (Ih) to minimize mean baseline fluorescence: depolarizing current pulse injection evokes calcium signal summation to level comparable to that in A (top). This indicates that PN baseline F in vivo is high.
Caveats
In several PNs, we sampled fluorescence signals from multiple glomerular dendrites. The PN in Figure 4 A, for example, was impaled in a dendrite and examined successively in seven of its target glomeruli. This PN was held slightly hyperpolarized during the odor trials so as to minimize baseline firing. Figure 4 A shows odor response segments from four of the seven glomeruli studied, together with the corresponding intracellular recordings. Successive odor trials evoked very similar voltage response patterns, typical of inter-trial variability with PNs (Stopfer and Laurent, 1999 ). The early odor-evoked spike burst, for example, contained 4 ± 1 action potentials, at peak rates of 32 ± 3 sp∕second. The amplitudes of the corresponding early OGB-1 transients were similarly clustered (37 ± 5% ΔF/F). The decay phase of these transients, however, (r, Figure 4 A) depended neither on the number of action potentials (Figure 4 B), nor on the firing rate (Figure 4 C). Rather, the decay rate varied with the glomerulus from which the transients had been recorded (Figure 4 A), ruling out decay phases of the OGB-1 signals as reliable correlates of PN firing rates.
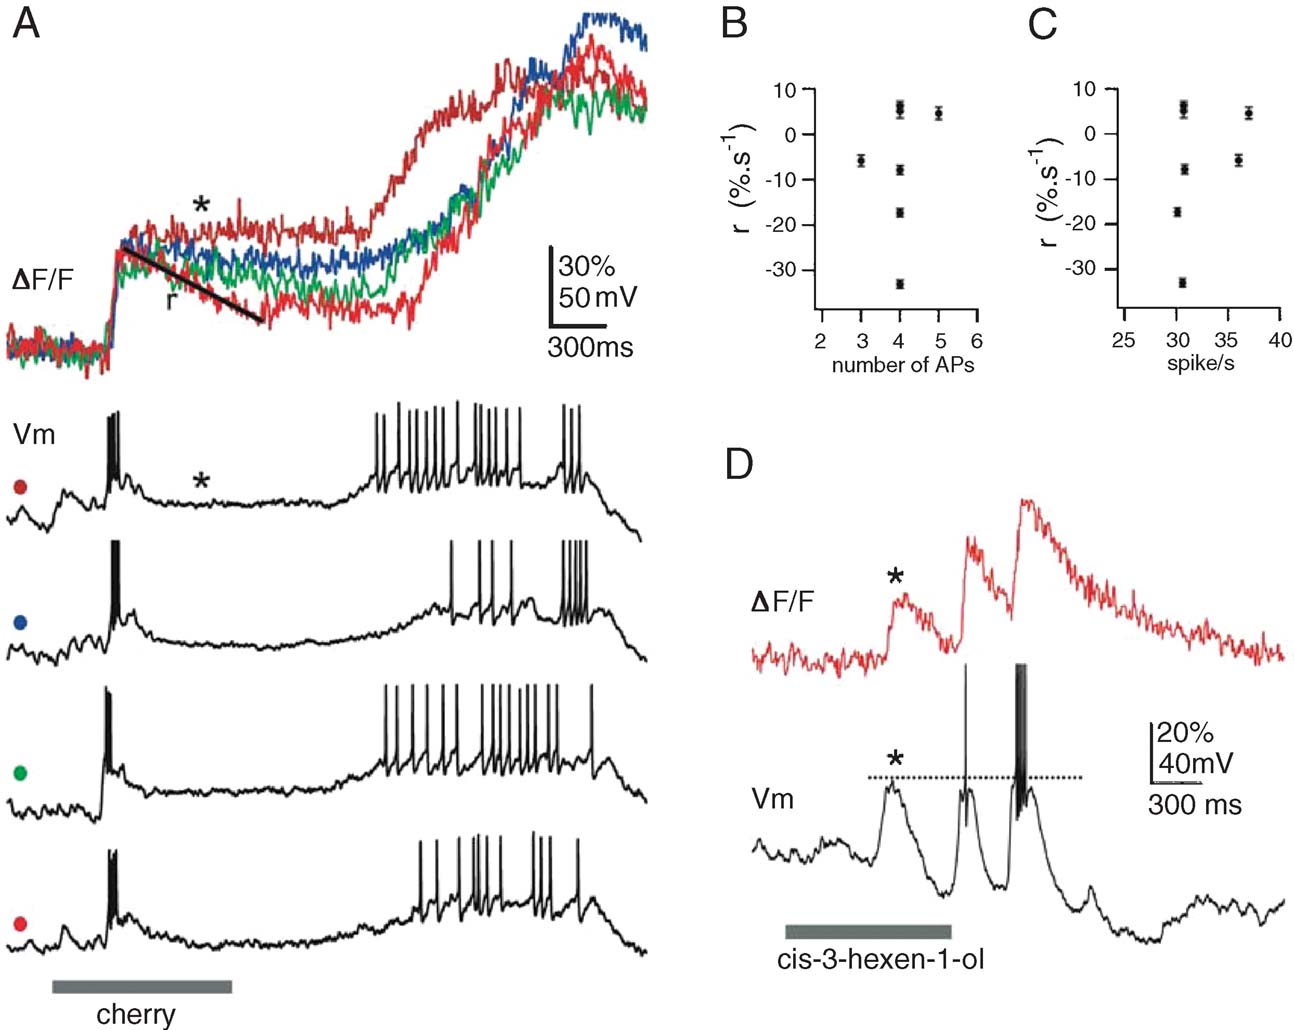
Figure 4. Calcium signals are not always correlated with spiking. (A) Seven glomeruli were successively imaged in this PN, using constant odor delivery conditions. Single trials of Vm and F responses evoked by 1-second pulse of cherry odor are shown for four glomerular tufts (four colors). PN was held very slightly hyperpolarized. Note consistency of early F and V responses across glomeruli, to be contrasted with lack of correlation between F (linearly quantified as a rate r ± SD) in silent phase of the response and spiking response in preceding moments (in number of APs, B; or rate, C). (D) A different PN, held slightly hyperpolarized, in which F is revealed to vary substantially even with subthreshold event (*).
We also noted that OGB-1 signals often rose even in the absence of action potential (Figure 4 A, late response phase, blue trace). This is seen more clearly with the PN in Figure 4 D: as before, this PN was held slightly hyperpolarized to minimize baseline firing. Of the three successive depolarizing phases evoked by the odor, the first failed to evoke any action potential; yet, this depolarization was accompanied by an OGB-1 signal (1, Figure 4 D) of amplitude comparable to the following two. These examples suggest that the contribution of subthreshold depolarization may, under certain circumstances, be a potential source of error for the evaluation of PN spike output from OGB-1 signals. Predicting PN output from OGB-1 signals will thus require a separation of these superimposed spike-dependent (indicative of PN output) and subthreshold components (indicative of synaptic drive to PNs).
Separating voltage-gated from synaptic contributions
Insect olfactory afferents are cholinergic (Bicker, 1999 ). Superfusion of the brain with 1 mM mecamylamine, a nicotinic receptor antagonist, led to drastic changes in PN activity at rest and during odor stimulation (n = 3 PNs). First, PN resting potential became more negative by 5–15 mV and baseline firing was suppressed, with the exception of occasional spontaneous bursts of spikes. Second, odor stimulation failed to evoke any depolarization. The effects of mecamylamine on electrical properties were reflected in the calcium signals (Figure 5 ). Mean OGB-1 signal intensity was drastically reduced in the glomeruli. Action potential trains, evoked by a small depolarizing current-pulse, elicited clear and summating calcium-transients (Figure 5 A); each transient decayed considerably faster (τ ≈ 50 ms, Figure 5 B) than fluorescence signals correlated with inhibition or hyperpolarization from baseline in normal saline (Figure 3 A). Third, hyperpolarizing current injection caused no further reduction in fluorescence (Figure 5 A); this suggests that part of the elevated baseline calcium is due to non-inactivating voltage-gated channels, and that blockade of nicotinic synapses results in a net PN hyperpolarization below the activation threshold for voltage-gated calcium entry. Indeed, large depolarizing current injection triggered OGB-1 signals from below spike threshold, at about −60 mV.
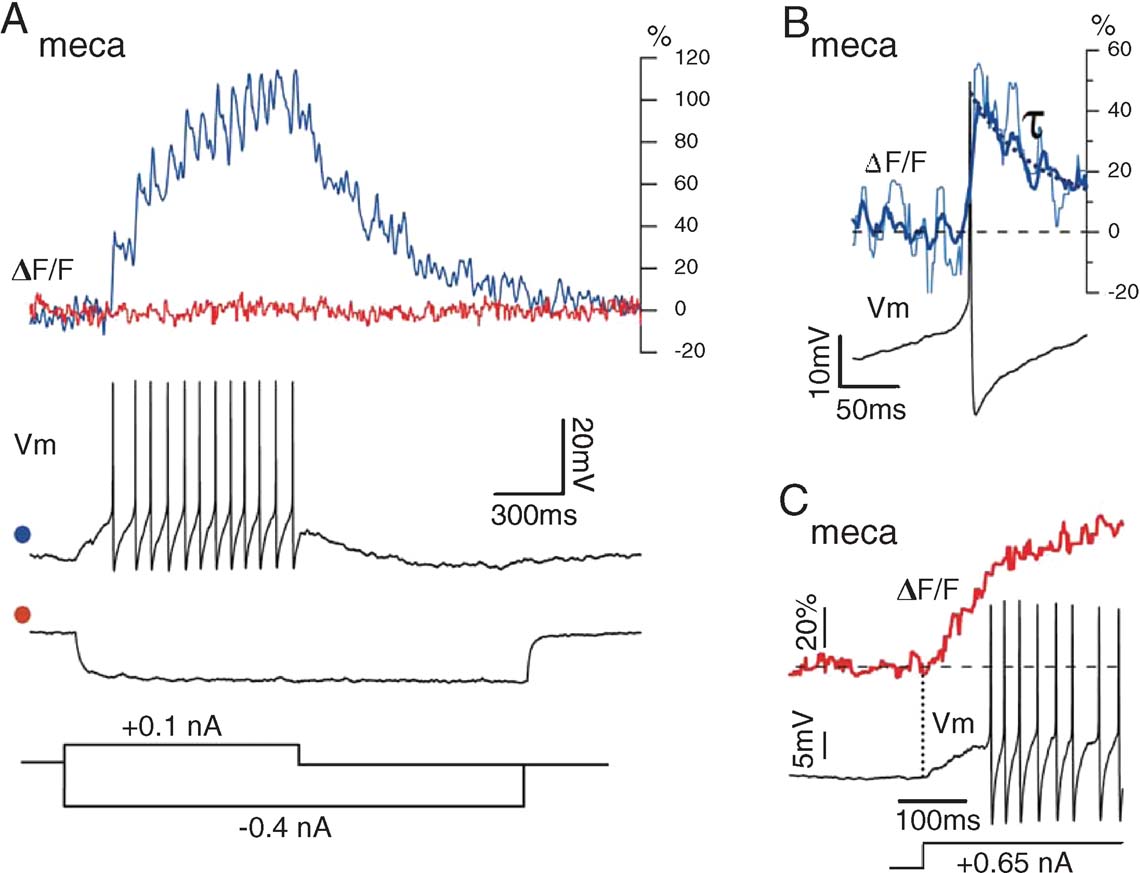
Figure 5. PN glomerular fluorescence after blockade of nicotinic synaptic input with mecamylamine. Odor delivery failed to depolarize the PN and baseline activity was close to 0 sp∕second. (A) Current-evoked spike trains lead to clear summation of F transients, but current-evoked hyperpolarization leads to no further decrease in F, indicating that baseline PN fluorescence in intact animals is elevated because of tonic synaptic depolarization. (B) Spike-evoked calcium transients (single event: thin line; spike-triggered average (STA) of seven events: thick line) with decay time constant (τ = 50 ± 7 ms). (C) Upon large current injection, causing fast PN depolarization, F increases prior to the first action potential, indicating low-voltage-gated calcium entry, consistent with high baseline fluorescence in intact animals.
We conclude that two spikes with a time interval > ∼50 ms are very easily detectable as OGB-1 fluorescence transients when PNs are held at moderately hyperpolarized potentials (> −60 mV). In in vivo recording conditions, however, synaptic background due to ORN activation raises the resting potential of PNs above calcium-channel activation threshold; at rest, mean OGB-1 fluorescence is around the midpoint of the indicator's dynamic range; from this baseline, single spike-related transients are thus compressed, and occur on a consistent synaptic background, due both to sub- and supra-threshold depolarizing events. With this information, our goal is now to estimate PN spike output from OGB-1 fluorescence signals.
Estimating firing rates from ΔF/F (t)
Our qualitative results indicate that ΔF/F (t) variations in PNs are influenced by at least three different factors: firing (Figures 3 and 5 ), subthreshold depolarization (Figures 4 and 5 ), and calcium clearance (Figure 4 A). Having access to simultaneously recorded voltage and fluorescence, we now investigate whether a PN's discharge can be extracted with reasonable precision from single trials using ΔF/F (t) recorded at a glomerulus. Building on previous experimental and modeling work with other neurons and systems (Helmchen et al., 1996 ; Wang, 1998 ), we assume that sustained firing rate can, over a reasonable range, be linearly related to intracellular calcium levels. We will now describe a simple method to derive a smoothed estimate of PN firing rate Rp(t) from ΔF/F (t). To this end, we use simple rules based on two PN-specific parameters (S and TC) and a single experiment-specific calibration, independent of the electrophysiological recording. Both parameters—S, a scaling factor related to average calcium entry caused by one action potential at the imaging site, and TC, the duration over which spike-evoked calcium summation appears not to be relevant—are biologically meaningful and were obtained from our experimental measurements.
Method summary. We first estimated, from a recorded PN, the minimum fluorescence at baseline (FB, measured in the absence of spike output). Because PNs recorded at rest and in vivo fire 2–5 sp∕second on average (Perez-Orive et al., 2002 ), the minimum fluorescence measured during several seconds of baseline generally provides a reasonable estimate of FB; FB can thus be estimated in the absence of electrical recording. Note that FB does not represent the lowest possible OGB-1 signal, but rather a rest position for the spike-independent components. After appropriate smoothing (100 ms kernel), we consider that ΔF/F (>FB) varies approximately linearly with Rp (always >0). Because a cessation of firing, due either to PN inhibition or to interruption of excitation, generally led to a decay of ΔF/F (t), we assume that any segment of ΔF/F (t) with a slope < 0 and a duration >TC represents a firing rate of 0. Our method thus sets all such segments of continuously decreasing ΔF/F (t) to FB. ΔF/F, so rectified, was then scaled linearly to Rp using the constant S. To reduce the false assignment of calcium variations due to subthreshold events to action potentials, we set a threshold on the estimated R(t) at a value roughly equal to the spontaneous neuron spiking rate (see exploration of parameters).
Demonstration. A demonstration of this procedure over a single trial (response segment from PN in Figure 3 , called PN4) is shown in Figure 6 A; using only ΔF/F (t) (red trace), we computed—as described above—a prediction (green trace) of the PN's smoothed firing rate and compared it to the firing rate profile calculated from the intracellular recording (blue trace). Note that ΔF/F (t) (red trace), either raw or simply thresholded at FB, did not predict firing output well. The scaling parameter S—kept constant once estimated—was the slope of the linear fit of X (measured firing rate) versus Y (unscaled predicted firing rate) (Figure 6 B), where X and Y were measured as in Figure 6 A, for a set of 5 PN-odor pairs. S, so calculated, was 1.2 (sp∕second)/% (Figure 6 B). A regression plot of X and Y after scaling is shown for PN4 in Figure 6 C.
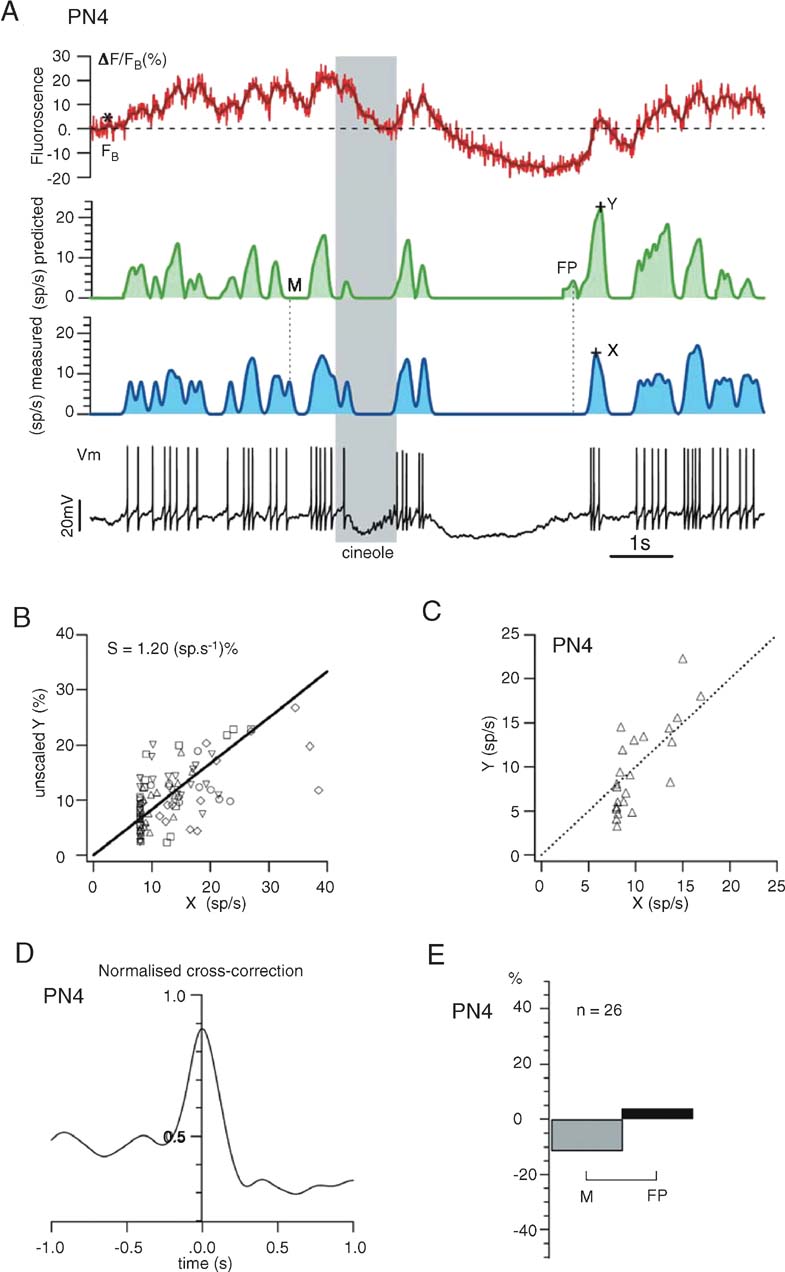
Figure 6. Prediction of one PNquotidns firing profile from its glomerular calcium signals alone. (A) Using the rules described in the text, we use the Gaussian-smoothed ΔF∕FB trace (dark red) to estimate the PNquotidns discharge with ∼50 ms resolution. Stippled line indicates FB (note that FB ≠ F0). Compare predicted, smoothed firing rate (green trace) with that calculated by 50-ms-Gaussian smoothing (blue trace) of actual spike discharge obtained from intracellular trace (Vm). X, Y: see B; M, FP: see E. (B) The proportionality constant S between firing rate and calcium-plateau, used as a fixed scaling parameter in our method (see text), was extracted from 5 PNs (16-second-long single trials, 1-second odor presentation), each exhibiting moderate firing rate modulations (below 40 sp∕second) upon stimulation. X and Y mark the spike-related peak amplitudes of, respectively, measured and predicted-smoothed firing rates (as illustrated in A). (C) Dispersion from assumed linearity of Y(X), shown for PN4. (D) Cross-correlation (normalized to autocorrelation of measured firing rate) between estimated and measured firing rates; this measure is used as a global accuracy estimator of our predictions: PN4 prediction captures almost 90% of the actual firing rate. A perfect prediction would yield a peak at 1.0. (E) Match between predicted and measured firing rate peaks was also assessed piecewise; percentage of missed (M) and false positive (FP) events was measured (see examples in A). FP events are less than 5% of the total number of real events (n).
We measured the accuracy of this method in two ways: first, we cross-correlated the predicted and measured firing rate profiles (after smoothing, Figure 6 D); in this example, our average estimate of PN4 firing rate from OGB-1 fluorescence was ∼80% of the actual one. Second, we counted M or FP events in the prediction. In the trace in Figure 6 A, for example, we illustrated one M and one FP event in our prediction. The proportions (in %) of such deviations relative to all real events are plotted in Figure 6 E.
Fine tuning. Figure 7 illustrates the reliability of our procedure with other PNs and odors. Again, the only experiment-specific parameter is FB, chosen as the minimum of ΔF/F (t) during baseline (i.e., before the odor pulse). Raw∕smoothed ΔF/FB(t) (red), predicted (green), and measured (blue) firing rate profiles are plotted, together with cross-correlation and error rates for 3 PN-odor pairs (PNs 5–7, single-trials). Correlations at dt = 0 were close to 0.9 and errors were balanced overall; except for a few M and FP spiking events, the time structure of the predicted running firing rates matched the real ones almost perfectly. We showed earlier, however, that subthreshold depolarizations occasionally generate OGB-1 signals comparable to those evoked by action potentials (Figure 4 D). Because the calcium signals corresponding to spiking and non-spiking events cannot be teased apart easily, we explored the use of a simple threshold (>FB), below which all corresponding calcium events would be counted as subthreshold (0 sp∕second). Because PN-mean firing rates at baseline vary between 2 and 5 sp∕second across PNs, any threshold value within that range would generate most errors during baseline; we considered this acceptable because our goal is to reconstruct PN response profiles, not baseline activity, with maximum accuracy. Figure 8 shows the effect of varying this threshold on firing rate estimates (green) with two PNs selected for illustration because they respectively represent extremes of subthreshold electrical activity and spiking activity at rest. Our goal was to choose a single threshold value so as to minimize error rates (low M and FP) and maximize reconstruction accuracy (high correlations), over all PNs. The effect of threshold on error rates is plotted for both PNs; while a high threshold of 8 sp∕second was optimal for PN8, a threshold of 2 sp∕second was best for PN9. A threshold of 4 sp∕second was found to provide the best average predictions over all PNs.
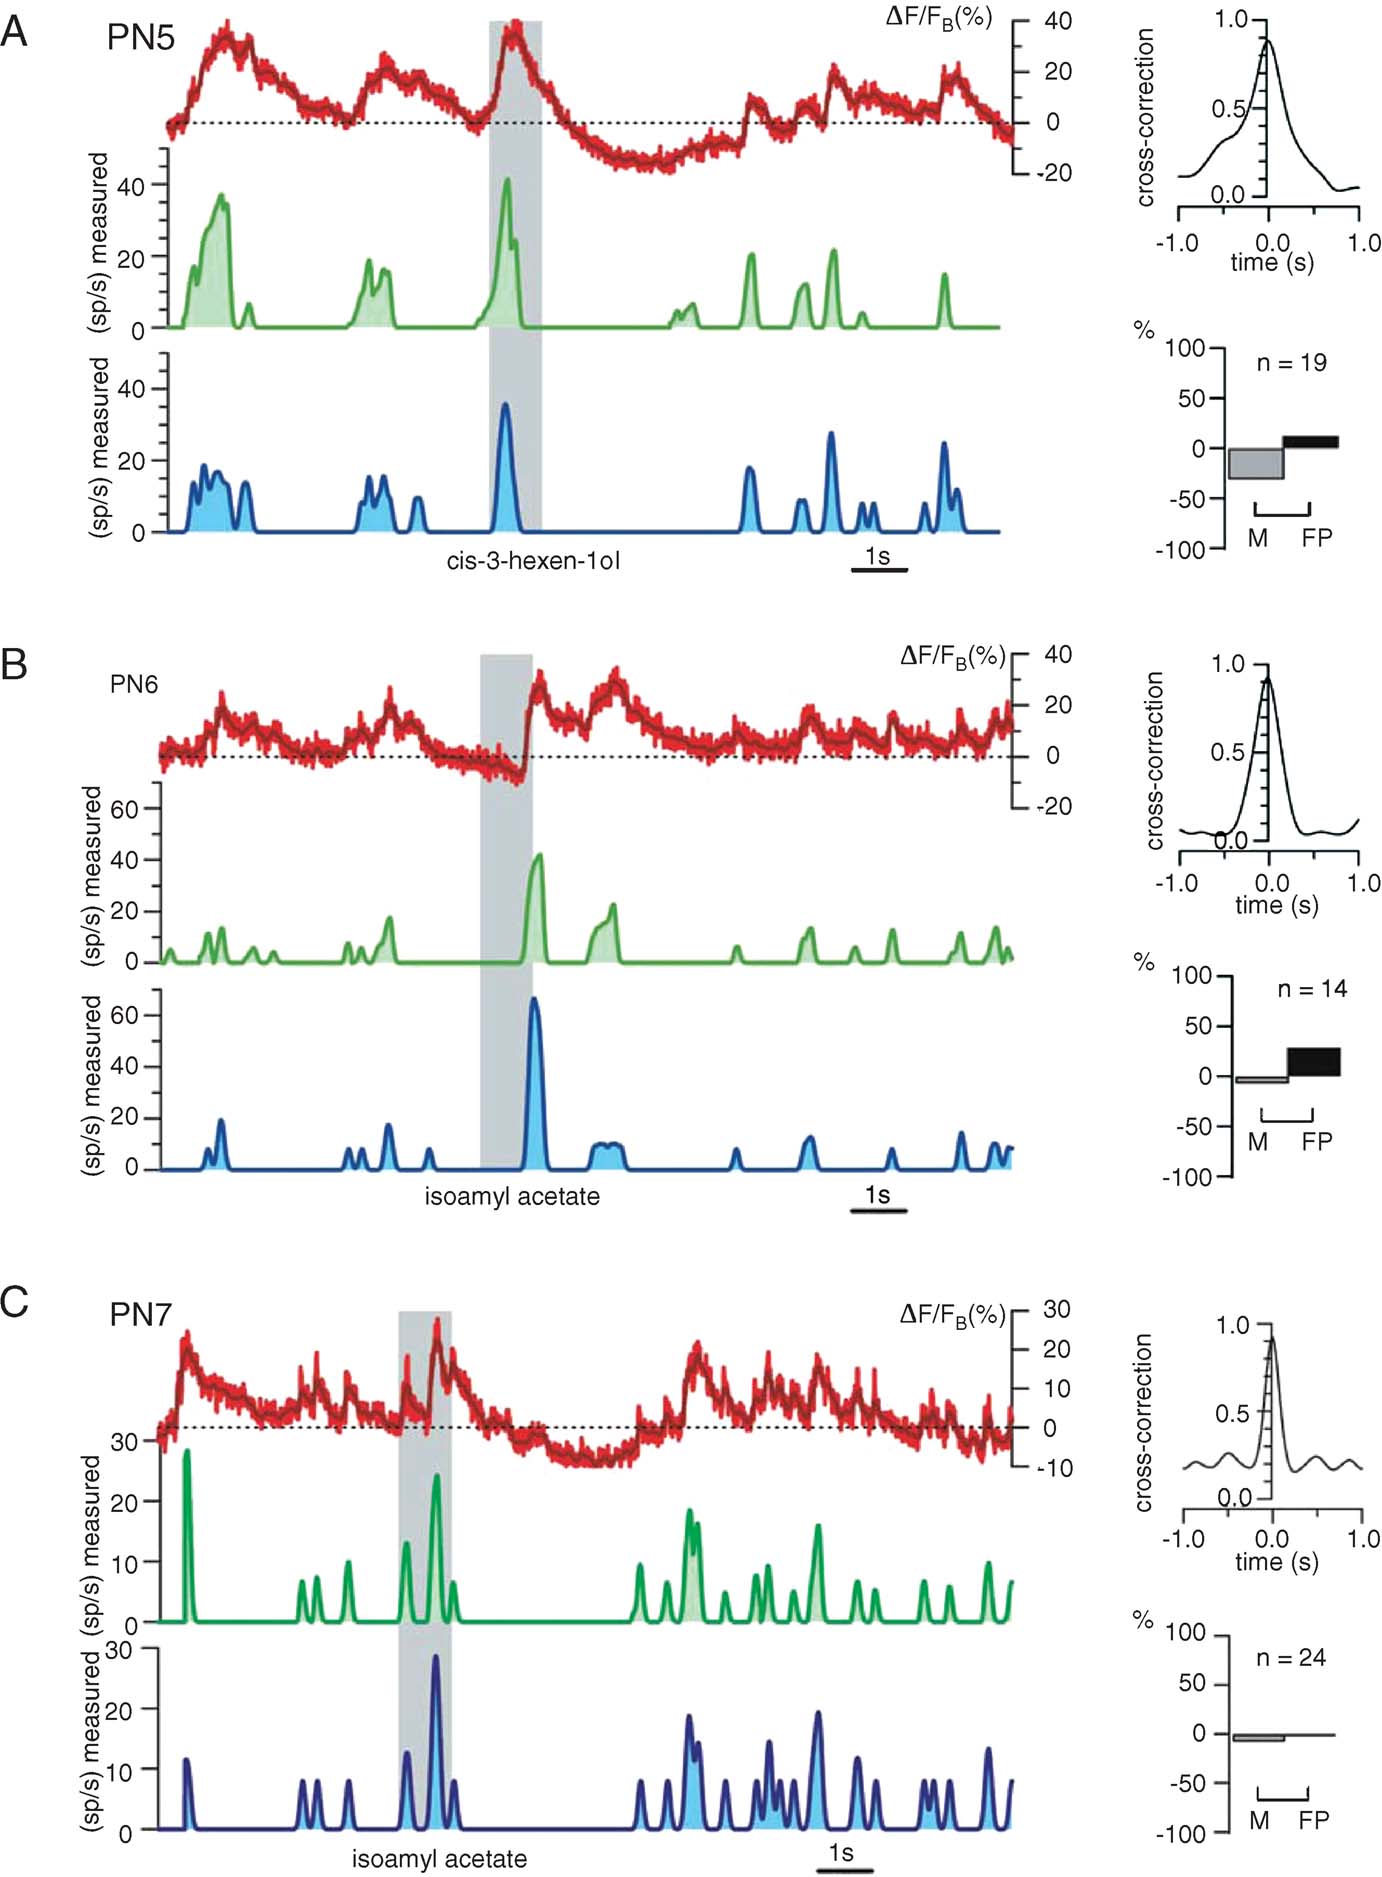
Figure 7. Firing rate prediction from ΔF∕F as applied to three different PNs. (A–C) Left: raw and smoothed (red and dark red) fluorescence traces (ΔF∕FB), predicted (smoothed) firing rate (green), measured (smoothed) firing rate (blue). Right: assessment of match between estimated and measure rates; top: normalized cross-correlation; bottom: proportions of missed and false positive events. In each example, 15 seconds of 24-second-long, single trials are shown. The only experiment-specific parameter is FB (dashed lines), measured as minimum calcium signal before the odor presentation; FB thus requires no manipulation of membrane potential, and is not the same as F0. All other parameters (S, Tc, and the threshold; see text and next figure) are fixed and identical for all. Note high accuracy for predicted firing for PN7 and small false positive percentage for all three examples.
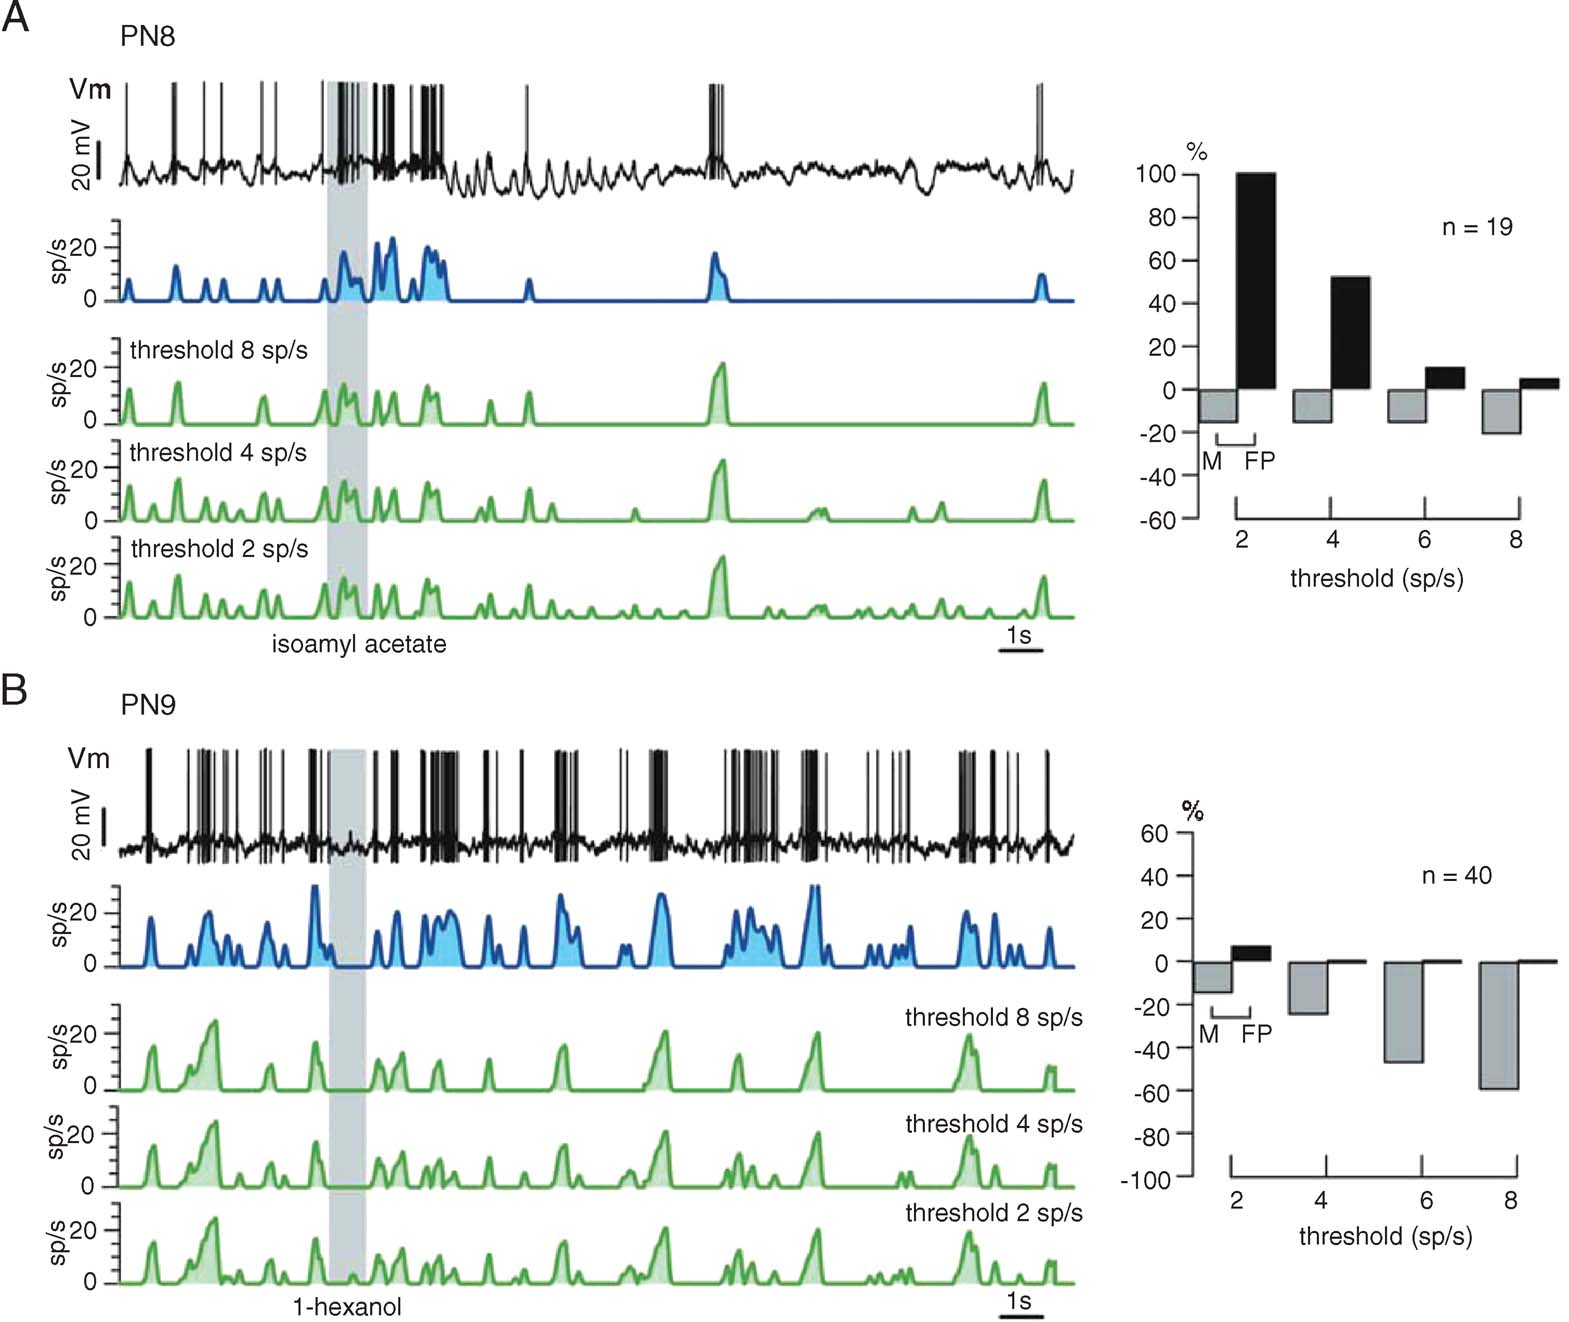
Figure 8. Empirical assessment of firing threshold value (see text) that minimizes the sum of missed and false positive events (M + FP). Different thresholds are tested (green traces) and compared with the firing rate profile (blue) measured. The PNs in A and B are chosen because they illustrate two extremes of PN activity patterns (A: sparse firing, large subthreshold potential variations; B: high and variable resting activity). Because the threshold is a fixed parameter, it should be optimized such that reconstruction accuracy is maximized over all PNs. (A) Following odor presentation, PN8 undergoes many successive subthreshold potential variations, leading to a large proportion of false positive events in the prediction from ΔF∕F. A threshold of 8 sp∕second would be optimal for this neuron. (B) By contrast, PN9 displays a high and irregular spike discharge both at rest and after odor stimulation, causing very few false positive events. A high threshold, however, leads to many missed events. A threshold of 2 sp∕second would be optimal for this neuron. After similar analysis with several PNs, the threshold parameter was set at 4 sp∕second; this value represents a trade-off between missing and erroneously detecting spiking events, when assessed over a large span of PN firing patterns.
Finally, we examine the relevance of PN discharge statistics to the accuracy of our procedure. The transform we propose relies on a few approximations (smoothing, mean slope, and threshold), best adapted to particular firing regimes. We thus examined the reliability of our firing rate estimation with many PNs and multiple stimuli—each evoking a different response pattern (Figure 9 ). The example in Figure 9 A illustrates the responses of one PN to six different odors (single trials): the OGB-1 signal is plotted in red, and the predicted and measured firing rates are shown in green and blue, respectively. The accuracy of these estimates varies between 80 and 90% (Figure 9 B). Measured over 9 PNs and 21 PN-odor pairs, the mean correlation was 81% (Figure 9 C).
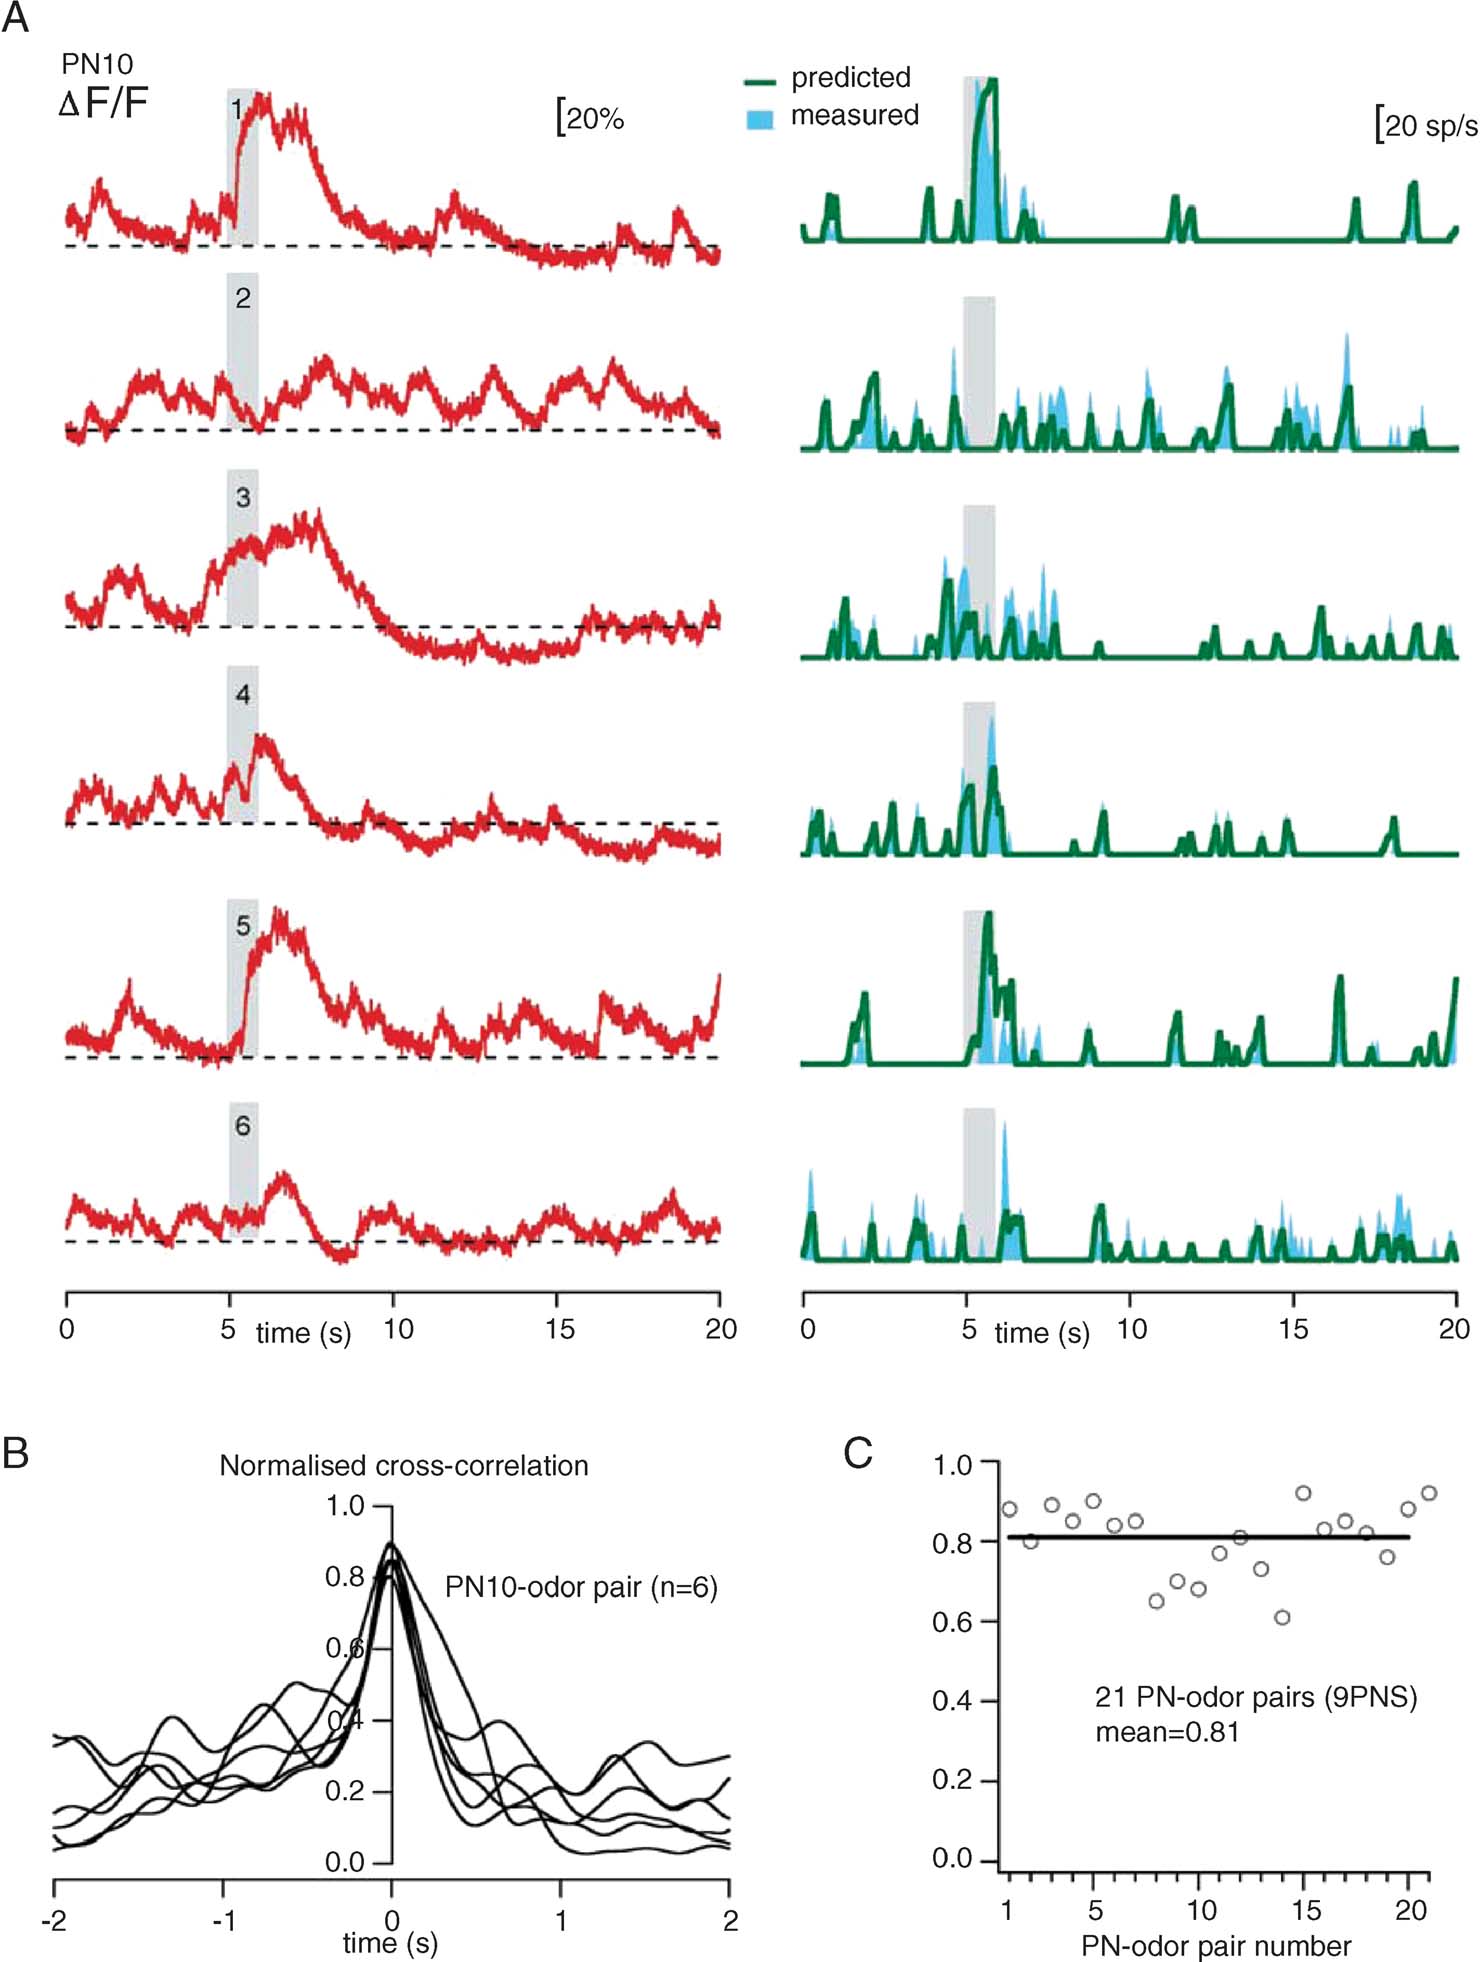
Figure 9. Reliability of firing-rate prediction over various stimuli and response patterns. (A) Comparison of predicted (green) and measured (cyan) smoothed firing rates. All plots are from single-trials, with the same PN (PN10), and six odors (1: cis-3-hexen-1-ol, 50%; 2:1-hexanol, 50%; 3: benzaldehyde, 50%; 4: benzaldehyde, 0.5%; 5: isoamylacetate, 50%; 6: isoamylacetate, 0.5%). Corresponding raw fluorescence traces (red) are juxtaposed, to emphasize the difference between calcium signals and spike discharge. (B) Normalized cross-correlations between predicted and measured (50 ms-Gaussian smoothing) rates for the six trials in A. Peak correlations are between 0.80 and 0.90. (C) Measure of peak cross-correlation (at dt = 0, as in B) for 21 PN-odor pairs calculated with 9 PNs. These correlations are calculated over the entire duration of each trial, and thus represent both stimulus-evoked and spontaneous activity, as shown in A. In all cases, the only trial-specific parameter is FB (minimum fluorescence during pre-stimulus baseline); all other parameters are fixed and identical (see text).
Discussion
Somatic calcium signals combined with simultaneous cell-attached recordings have been used more recently in vivo in anesthetized animals to identify temporally sparse (∼1 Hz) spontaneous activity of neuron ensembles (Kerr et al., 2005 ). Because activity was restricted to single action potentials or short bursts, a simple template-matching method applied to the calcium recordings successfully extracted spike times with good accuracy; a simple linear relationship between calcium elevation and action potential number (with a maximum at about 4) for moderate interspike intervals was experimentally established and used to extract spike time series during sparse bursting events.
More recently, Yaksi and Friedrich (2006) developed a method to extract spiking activity from soma calcium signals, using a more complex deconvolution approach. This method, used on populations of adult zebrafish MCs stimulated with odors, is based on the assumptions that (1) spike-evoked calcium transients are the dominant source of calcium elevation, (2) each action potential gives rise to a stereotyped calcium transient with mono-exponential decay over time, and (3) calcium summation caused by a train of action potentials is described well by a simple convolution of a mono-exponential kernel with the spike-train. Calcium signals were recorded at MC somata with Rhod-2, a moderate affinity indicator (Kd ∼ 570 nM); calcium kinetics appeared to be relatively slow (single-action potential decay time >1 second), and calcium variations appeared to be related only to action potentials. When recorded spike trains and reconstructions were compared, Yaksi and Friedrich's approach gave very good firing rate reconstructions (∼85%), with image sampling rates of ∼30 Hz. These reconstructions were done while MC baseline activity (typically 5–10 Hz) had been suppressed by hyperpolarizing current injection; the thresholding problem caused by a non-zero baseline activity is thus similar to the one we faced (see below).
In the present study, we examined the predictability of PN-spike output from calcium signals recorded at high sampling rate (line-scan, 500–750 Hz) from glomerular dendrites with a high-affinity indicator (OGB-1, Kd ∼ 200 nM). In each glomerulus, individual PNs receive direct cholinergic input from ORNs (Homberg et al., 1995 ) and make cholinergic output to LNs (Drosophila: Ng et al., 2002; Wilson et al., 2004). We found that PN-dendrite OGB-1 signals are fast (single-spike decay time ∼ 50 ms) after blockade of nicotinic synaptic input, but slower and more variable (e.g., non-stereotyped decay times across multiple glomeruli of a single PN) in intact in vivo conditions. We also determined that OGB-1 signals are not exclusively correlated with action potentials, a likely consequence of the indicator's affinity. We developed simple rules to predict firing patterns from imaging data with ∼80–90% mean accuracy. The errors made in our prediction originated from two main causes: (i) an imprecise evaluation of the fluorescence levels (FB) that correspond to 0 action potential; this evaluation might be improved by recording longer periods of baseline activity; (ii) more importantly, a deviation from the assumed linearity between ΔF/F and firing rates, due to nonlinear summation of spike-related events (mostly at high rates) or to the superposition of subthreshold and spike-dependent components. We suspect that the combination of these two components, presumably non-linear, is mainly responsible for the variance of the scaling factor S (Figure 7 B). A calcium indicator with a lower affinity than OGB-1 but similar unbinding rate would likely help diminish the weight of the subthreshold components.
We now compare our approach to the deconvolution method proposed by Yaksi and Friedrich (2006) , which is, to our knowledge, the most relevant work in the interpretation of calcium imaging data to extract firing activity.
Computation time
Our algorithm is, by contrast to deconvolution, computationally trivial; it can thus be applied at low cost to long calcium recordings regardless of sampling rate. For a single 24 second-trial sampled at 500 Hz, the calculation time on MatLab 7.0 running with Pentium(R) IV1.50 GHz processor is less than 1 second, data-loading time included.
Noise
Because, in practice, indicator concentrations must be kept as low as possible to minimize their influence on neuronal function, S∕N ratios are usually low, especially so if averaging is excluded (single trials, high temporal resolution). Deconvolution, like all inverse problems, is very sensitive to noise; Yaksi and Friedrich (2006) thus applied a clever but time-intensive local lowpass filtering on their 30 Hz-calcium traces. Our algorithm performed well with a simple three-point median filter on 500 Hz-line scans.
Calibrations
Our approach necessitated simultaneous voltage and calcium recordings from a few neurons to establish the three parameters needed for our prediction algorithm. These parameters are likely to vary with neuron types and preparations. In many cases, such simultaneous calcium and electrical recordings may be difficult to obtain in vivo. On the other hand, the calibration procedure could be done in intact, in vivo conditions, thus providing information about the transform's parameters for neurons in their natural state, in the absence of any artificial manipulation.
Assumptions
We made no assumption on the waveform and time constant of calcium-signal decays (we rarely observed in our data a mono-exponential decay of the calcium signal after a cessation of firing).
Spatial sampling
A great strength of Yaksi and Friedrich's (2006) approach is the high density of their spatial sampling: they could image activity in tens to hundreds of neurons quasi-simultaneously, after extracellular application of the indicator, as pioneered by Stosiek et al., 2003 . Our approach now should be tested under similar conditions.
Conclusion
Using a simple algorithm and minimal calibration, we estimated with good accuracy the smoothed firing rates of principal sensory neurons from dendritic calcium signals. By examining carefully the relationship between calcium and spiking, we found that, while decipherable, the relationship between the two is not a simple linear scaling, even after appropriate thresholding; sources of possible error are many, illustrating the need for care in using calcium imaging as a proxy for electrophysiology. In many insects (moth, honey bee, cockroach, fly) the glomerular structure of the antennal lobes is highly ordered (Couto et al., 2005 ; Fishilevich and Vosshall, 2005 ; Galizia et al., 1999 ), usually apparent, and easily accessible for imaging techniques. Previous work (Carlsson et al., 2005 ; Sachse and Galizia, 2002 ) showed that many PNs-glomeruli can be labeled simultaneously with dextran-based calcium indicators injected in an axon tract. Genetic calcium indicators are now also available (Miesenbock and Kevrekidis, 2005 ; Miyawaki et al., 1999 ; Nakai et al., 2001 ; Pologruto et al., 2004 ; Reiff et al., 2005 ; Wang et al., 2003 , 2004 ) and thus usable in certain model systems. It is hoped that the algorithm we propose—as that developed by Yaksi and Friedrich (2006) —combined with increasingly optimized imaging techniques (Iyer et al., 2006 ; Roorda et al., 2004 ; Salome et al., 2006 ; Svoboda and Yasuda, 2006 ), will be useful to the investigation of electrical activity in large populations of neurons in vivo.
Conflict of Interest Statement
The authors declare that the research was conducted in the absence of any commercial or financial relationships that could be construed as a potential conflict of interest.
Acknowledgements
This work was supported by a gift from the Gimbel Fund, by grants from the National Institute for Deafness and other Communication Disorders, the National Science Foundation, the Swartz Foundation (G. L.), and by the French Fondation pour la Recherche Médicale (L. Moreaux). We are grateful to Vivek Jayaraman and Ofer Mazor for their generous help in programming, and to Nick Madison (BioRad) for his help during the construction of the microscope.
References
Bicker, G. (1999). Histochemistry of classical neurotransmitters in antennal lobes and mushroom bodies of the honeybee. Microsc. Res. Tech. 45, 174–183.
Brustein, E., Marandi, N., Kovalchuk, Y., Drapeau, P., and Konnerth, A. (2003). “In vivo” monitoring of neuronal network activity in zebrafish by two-photon Ca(2+) imaging. Pflugers Arch. 446, 766–773.
Buck, L., and Axel, R. (1991). A novel multigene family may encode odorant receptors: a molecular basis for odor recognition. Cell 65, 175–187.
Carlsson, M. A., Knusel, P., Verschure, P. F., and Hansson, B. S. (2005). Spatio-temporal Ca2+ dynamics of moth olfactory projection neurones. Eur. J. Neurosci. 22, 647–657.
Charpak, S., Mertz, J., Beaurepaire, E., Moreaux, L., and Delaney, K. (2001). Odor-evoked calcium signals in dendrites of rat mitral cells. Proc. Natl. Acad. Sci. USA 98, 1230–1234.
Clyne, P. J., Warr, C. G., Freeman, M. R., Lessing, D., Kim, J., and Carlson, J. R. (1999). A novel family of divergent seven-transmembrane proteins: candidate odorant receptors in Drosophila. Neuron 22, 327–338.
Couto, A., Alenius, M., and Dickson, B. J. (2005). Molecular, anatomical, and functional organization of the Drosophila olfactory system. Curr. Biol. 15, 1535–1547.
Delaney, K., Davison, I., and Denk, W. (2001). Odour-evoked [Ca2+] transients in mitral cell dendrites of frog olfactory glomeruli. Eur. J. Neurosci. 13, 1658–1672.
Denk, W., and Svoboda, K. (1997). Photon upmanship: why multiphoton imaging is more than a gimmick. Neuron 18, 351–357.
Denk, W., Strickler, J. H., and Webb, W. W. (1990). Two-photon laser scanning fluorescence microscopy. Science 248, 73–76.
Dragoi, G., and Buzsaki, G. (2006). Temporal encoding of place sequences by hippocampal cell assemblies. Neuron 50, 145–157.
Egelhaaf, M., and Borst, A. (1995). Calcium accumulation in visual interneurons of the fly: stimulus dependence and relationship to membrane potential. J. Neurophysiol. 73, 2540–2552.
Fishilevich, E., and Vosshall, L. B. (2005). Genetic and functional subdivision of the Drosophila antennal lobe. Curr. Biol. 15, 1548–1553.
Fried, H. U., Fuss, S. H., and Korsching, S. I. (2002). Selective imaging of presynaptic activity in the mouse olfactory bulb shows concentration and structure dependence of odor responses in identified glomeruli. Proc. Natl. Acad. Sci. USA 99, 3222–3227.
Friedrich, R. W., and Korsching, S. I. (1997). Combinatorial and chemotopic odorant coding in the zebrafish olfactory bulb visualized by optical imaging. Neuron 18, 737–752.
Galizia, C. G., Sachse, S., Rappert, A., and Menzel, R. (1999). The glomerular code for odor representation is species specific in the honeybee Apis mellifera. Nat. Neurosci. 2, 473–478.
Goldberg, F., Grunewald, B., Rosenboom, H., and Menzel, R. (1999). Nicotinic acetylcholine currents of cultured kenyon cells from the mushroom bodies of the honey bee Apis mellifera. J. Physiol. 514(Pt 3), 759–768.
Hallem, E. A., Ho, M. G., and Carlson, J. R. (2004). The molecular basis of odor coding in the Drosophila antenna. Cell 117, 965–979.
Hammer, M., and Menzel, R. (1998). Multiple sites of associative odor learning as revealed by local brain microinjections of octopamine in honeybees. Learn. Mem. 5, 146–156.
Heisenberg, M. (1998). What do the mushroom bodies do for the insect brain? An introduction. Learn. Mem. 5, 1–10.
Helmchen, F., and Waters, J. (2002). Ca2+ imaging in the mammalian brain in vivo. Eur. J. Pharmacol. 447, 119–129.
Helmchen, F., Imoto, K., and Sakmann, B. (1996). Ca2+ buffering and action potential-evoked Ca2+ signaling in dendrites of pyramidal neurons. Biophys. J. 70, 1069–1081.
Helmchen, F., Svoboda, K., Denk, W., and Tank, D. W. (1999). In vivo dendritic calcium dynamics in deep-layer cortical pyramidal neurons. Nat. Neurosci. 2, 989–996.
Homberg, U., Hoskins, S. G., and Hildebrand, J. G. (1995). Distribution of acetylcholinesterase activity in the deutocerebrum of the sphinx moth Manduca sexta. Cell Tissue Res. 279, 249–259.
Iyer, V., Hoogland, T. M., and Saggau, P. (2006). Fast functional imaging of single neurons using random-access multiphoton (RAMP) microscopy. J. Neurophysiol. 95, 535–545.
Kerr, J. N., Greenberg, D., and Helmchen, F. (2005). Imaging input and output of neocortical networks in vivo. Proc. Natl. Acad. Sci. USA 102, 14063–14068.
Laurent, G. (2002). Olfactory network dynamics and the coding of multidimensional signals. Nat. Rev. Neurosci. 3, 884–895.
Laurent, G., and Davidowitz, H. (1994). Encoding of olfactory information with oscillating neural assemblies. Science 265, 1872–1875.
Laurent, G., Seymour-Laurent, K. J., and Johnson, K. (1993). Dentritic excitability and a voltage-gated calcium current in locust nonspiking local interneurons. J. Neurophysiol. 69, 1484–1498.
Laurent, G., Wehr, M., and Davidowitz, H. (1996). Temporal representations of odors in an olfactory network. J. Neurosci. 16, 3837–3847.
Mazor, O., and Laurent, G. (2005). Transient dynamics versus fixed points in odor representations by locust antennal lobe projection neurons. Neuron 48, 661–673.
Miesenbock, G., and Kevrekidis, I. G. (2005). Optical imaging and control of genetically designated neurons in functioning circuits. Annu. Rev. Neurosci. 28, 533–563.
Miyawaki, A., Griesbeck, O., Heim, R., and Tsien, R. Y. (1999). Dynamic and quantitative Ca2+ measurements using improved cameleons. Proc. Natl. Acad. Sci. USA 96, 2135–2140.
Mombaerts, P., Wang, F., Dulac, C., Chao, S. K., Nemes, A., Mendelsohn, M., Edmondson, J., and Axel, R. (1996). Visualizing an olfactory sensory map. Cell 87, 675–686.
Nakai, J., Ohkura, M., and Imoto, K. (2001). A high signal-to-noise Ca(2+) probe composed of a single green fluorescent protein. Nat Biotechnol 19, 137–141.
Ohki, K., Chung, S., Ch'ng, Y. H., Kara, P., and Reid, R. C. (2005). Functional imaging with cellular resolution reveals precise micro-architecture in visual cortex. Nature 433, 597–603.
Perez-Orive, J., Mazor, O., Turner, G. C., Cassenaer, S., Wilson, R. I., and Laurent, G. (2002). Oscillations and sparsening of odor representations in the mushroom body. Science 297, 359–365.
Pologruto, T. A., Yasuda, R., and Svoboda, K. (2004). Monitoring neural activity and [Ca2+] with genetically encoded Ca2+ indicators. J. Neurosci. 24, 9572–9579.
Pouzat, C., Mazor, O., and Laurent, G. (2002). Using noise signature to optimize spike-sorting and to assess neuronal classification quality. J. Neurosci. Methods 122, 43–57.
Reiff, D. F., Ihring, A., Guerrero, G., Isacoff, E. Y., Joesch, M., Nakai, J., and Borst, A. (2005). In vivo performance of genetically encoded indicators of neural activity in flies. J. Neurosci. 25, 4766–4778.
Roorda, R. D., Hohl, T. M., Toledo-Crow, R., and Miesenbock, G. (2004). Video-rate nonlinear microscopy of neuronal membrane dynamics with genetically encoded probes. J. Neurophysiol. 92, 609–621.
Sachse, S., and Galizia, C. G. (2002). Role of inhibition for temporal and spatial odor representation in olfactory output neurons: a calcium imaging study. J. Neurophysiol. 87, 1106–1117.
Salome, R., Kremer, Y., Dieudonne, S., Leger, J. F., Krichevsky, O., Wyart, C., Chatenay, D., and Bourdieu, L. (2006). Ultrafast random-access scanning in two-photon microscopy using acousto-optic deflectors. J. Neurosci. Methods 154, 161–174.
Sargolini, F., Fyhn, M., Hafting, T., McNaughton, B. L., Witter, M. P., Moser, M. B., and Moser, E. I. (2006). Conjunctive representation of position, direction, and velocity in entorhinal cortex. Science 312, 758–762.
Smetters, D. K., Majewska, A., and Yuste, R. (1999). Detecting action potentials in neuronal populations with calcium imaging. Methods 18, 215–221.
Siapas, A. G., Lubenov, E. V., and Wilson, M. A. (2005). Prefrontal phase locking to hippocampal theta oscillations. Neuron 46, 141–151.
Sobel, E., and Tank, D. W. (1994). In vivo Ca2+ dynamics in a cricket auditory neuron: an example of chemical computation. Science 263, 823–826.
Spors, H., Wachowiak, M., Cohen, L. B., and Friedrich, R. W. (2006). Temporal dynamics and latency patterns of receptor neuron input to the olfactory bulb. J. Neurosci. 26, 1247–1259.
Stopfer, M., and Laurent, G. (1999). Short-term memory in olfactory network dynamics. Nature 402, 664–668.
Stosiek, C., Garaschuk, O., Holthoff, K., and Konnerth, A. (2003). In vivo two-photon calcium imaging of neuronal networks. Proc. Natl. Acad. Sci. USA 100, 7319–7324.
Svoboda, K., and Yasuda, R. (2006). Principles of two-photon excitation microscopy and its applications to neuroscience. Neuron 50, 823–839.
Svoboda, K., Denk, W., Kleinfeld, D., and Tank, D. W. (1997). In vivo dendritic calcium dynamics in neocortical pyramidal neurons. Nature 385, 161–165.
Tsien, R. Y. (1999). Monitoring cell calcium. In Calcium as a Cellular Regulator, E. Carafoli, C. Klee, eds. (New York, Oxford University Press), pp. 28–54.
Vosshall, L. B., Wong, A. M., and Axel, R. (2000). An olfactory sensory map in the fly brain. Cell 102, 147–159.
Wachowiak, M., and Cohen, L. B. (2001). Representation of odorants by receptor neuron input to the mouse olfactory bulb. Neuron 32, 723–735.
Wang, J. W., Wong, A. M., Flores, J., Vosshall, L. B., and Axel, R. (2003). Two-photon calcium imaging reveals an odor-evoked map of activity in the fly brain. Cell 112, 271–282.
Wang, X. J. (1998). Calcium coding and adaptive temporal computation in cortical pyramidal neurons. J. Neurophysiol. 79, 1549–1566.
Wang, Y., Guo, H. F., Pologruto, T. A., Hannan, F., Hakker, I., Svoboda, K., and Zhong, Y. (2004). Stereotyped odor-evoked activity in the mushroom body of Drosophila revealed by green fluorescent protein-based Ca2+ imaging. J. Neurosci. 24, 6507–6514.
Yaksi, E., and Friedrich, R. W. (2006). Reconstruction of firing rate changes across neuronal populations by temporally deconvolved Ca2+ imaging. Nat. Methods 3, 377–383.
Yi, R., Chu, K. K., and Mertz, J. (2006). Graded-field microscopy with white light. Opt. Express 14, 5191–5200.
Keywords: locust, olfaction, projection neuron, two-photon microscopy, calcium imaging, Oregon Green BAPTA-1, electrophysiology, spiking activity
Citation: Laurent Moreaux and Gilles Laurent (2007). Estimating firing rates from calcium signals in locust projection neurons in vivo. Front. Neural Circuits 1:2. doi: 10.3389/neuro.04/002.2007
Received: 9 August 2007;
Paper pending published: 17 September 2007;
Accepted: 15 October 2007;
Published online: 2 November 2007
Edited by:
Rafael Yuste, Columbia University, New York City, USAReviewed by:
Steve M. Potter, Georgia Institute of Technology, Atlanta, USA; Rafael Yuste, Columbia University, New York City, USACopyright: © 2007 Moreaux, Laurent. This is an open-access article subject to an exclusive license agreement between the authors and the Frontiers Research Foundation, which permits unrestricted use, distribution, and reproduction in any medium, provided the original authors and source are credited.
*Correspondence: Gilles Laurent, Division of Biology, California Institute of Technology, 139-74, Pasadena, CA 91125, USA. e-mail:bGF1cmVudGdAY2FsdGVjaC5lZHU=