1
Department of Physiology, Feinberg School of Medicine, Northwestern University, Chicago, IL, USA
2
Northwestern University Interdepartmental Neuroscience Program, Northwestern University, Chicago, IL, USA
Layer 5 pyramidal neurons comprise an important but heterogeneous group of cortical projection neurons. In motor-frontal cortex, these neurons are centrally involved in the cortical control of movement. Recent studies indicate that local excitatory networks in mouse motor-frontal cortex are dominated by descending pathways from layer 2/3 to 5. However, those pathways were identified in experiments involving unlabeled neurons in wild type mice. Here, to explore the possibility of class-specific connectivity in this descending pathway, we mapped the local sources of excitatory synaptic input to a genetically labeled population of cortical neurons: YFP-positive layer 5 neurons of YFP-H mice. We found, first, that in motor cortex, YFP-positive neurons were distributed in a double blade, consistent with the idea of layer 5B having greater thickness in frontal neocortex. Second, whereas unlabeled neurons in upper layer 5 received their strongest inputs from layer 2, YFP-positive neurons in the upper blade received prominent layer 3 inputs. Third, YFP-positive neurons exhibited distinct electrophysiological properties, including low spike frequency adaptation, as reported previously. Our results with this genetically labeled neuronal population indicate the presence of distinct local-circuit phenotypes among layer 5 pyramidal neurons in mouse motor-frontal cortex, and present a paradigm for investigating local circuit organization in other genetically labeled populations of cortical neurons.
Cortical mechanisms of motor control involve the ensemble activity of pyramidal neurons in motor and premotor areas of frontal cortex. Although pyramidal neurons in all layers in motor cortex are long-range projection neurons, those in layer 5 are of particular interest. Whereas layer 2/3 and 6 neurons project, respectively, to primarily cortical and thalamic targets, pyramidal neurons in layer 5 send axonal projections to major subcortical motor systems, including the corticospinal (“pyramidal”) and “extrapyramidal” stations such as basal ganglia, red nucleus, pons, and more (Keller, 1993
; Phillips and Porter, 1977
; Schieber, 2001
). The highly divergent nature of long-range outputs from layer 5 neurons in motor cortex prompts the question of how similar or diverse their inputs are. Since local pyramidal neurons account for a large fraction of all inputs, elucidating the local circuit organization is a key step toward understanding network-level mechanisms governing the input–output operation of layer 5 pyramidal neurons in motor-frontal cortex (Keller, 1993
).
The laminar layout of the excitatory network of pyramidal neurons in mouse motor-frontal cortex was recently surveyed in a study from our laboratory using a photostimulation approach (Weiler et al., 2008
). Those mapping results showed that the local circuit in this agranular cortical area is dominated by descending layer 2/3 → 5 pathways, a projection that is also prominent in other cortical areas (e.g. Douglas and Martin, 2004
; Otsuka and Kawaguchi, 2008
; Petreanu et al., 2007
; Schubert et al., 2001
; Thomson and Lamy, 2007
). However, only unlabeled pyramidal neurons were recorded, and neuronal “identity” was assigned solely on the basis of somatic position along the radial axis of the cortex (i.e., parallel to the apical dendrites). An obvious next step is to determine the local circuit organization of pyramidal neurons identified not only by the precise position of the soma along the radial axis, but by other parameters that allow their unambiguous identification as a class (Molnar and Cheung, 2006
; Molyneaux et al., 2007
). At least from an experimental perspective, this would facilitate targeting specific neuronal classes for investigation.
One promising approach to tackling the complexity of motor cortex circuits is to study genetically labeled subclasses of neocortical neurons. In interneuron research, the availability of lines with genetically labeled populations of interneurons has facilitated study of the roles of cortical inhibitory neurons in information processing (e.g. Chattopadhyaya et al., 2004
; Ma et al., 2006
; Oliva et al., 2000
). For excitatory neurons, the commercially available YFP-H line (Feng et al., 2000
) is among the most widely studied lines (e.g. Dombeck et al., 2007
; Grutzendler et al., 2002
; Niu et al., 2004
; Schaefer et al., 2005
; Zhang et al., 2005
). In these mice, YFP is expressed under control of the thy-1 promoter in a variety of cell types throughout the nervous system (Feng et al., 2000
). In neocortex, expression is restricted to a subset of layer 5 pyramidal neurons (Feng et al., 2000
; Sugino et al., 2006
).
In this study we used a tool for electrophysiologically mapping synaptic circuits, laser scanning photostimulation (LSPS) (Callaway and Katz, 1993
), to study the local circuit organization of YFP-positive motor-frontal cortex pyramidal neurons in brain slices prepared from YFP-H mice.
We used animals from an in-house breeding colony of YFP-H mice (C57Bl/6 background; strain B6.Cg-Tg(thy-1-YFPH)2Jrs/J; Jackson Laboratory) (Feng et al., 2000
). Procedures for animal care and experimentation followed Northwestern University, Society for Neuroscience, and NIH guidelines, and were approved by the Northwestern University Institutional Animal Care and Use Committee.
The methods for slice preparation, electrophysiological recording, and LSPS have been described in detail previously (Weiler et al., 2008
). Brain slices (0.3 mm thickness) were prepared from mice of either gender at 3–4 weeks of age. In preliminary experiments, slice angles were optimized for preservation of the apical dendritic arbors of pyramidal neurons, as readily indicated by epifluorescence imaging of the YFP-positive layer 5 neurons; i.e., the slice plane was parallel to the apical dendrites and the radial axis of the neocortex in the area of interest (motor-frontal cortex). We primarily used off-sagittal slices, as described previously (see Rocco and Brumberg, 2007
for a related slice preparation). Some recordings (∼20%) were done in coronal slices; however, no systematic differences were observed between sagittal and coronal data, and they were therefore pooled. Slices were cut in chilled choline-based solution, transferred to artificial cerebrospinal fluid (ACSF) to incubate for 30 min at 35°C, and maintained at 22°C thereafter until use. Individual slices were transferred to the recording chamber of an upright microscope equipped with optics for LSPS microscopy (Shepherd and Svoboda, 2005
; Shepherd et al., 2003
). Slices were bathed with ACSF containing MNI-glutamate (0.2 mM, Tocris), MgCl2 and CaCl2 (4 mM each) to dampen neuronal excitability, and CPP (5 μM, Tocris) to block NMDA currents. YFP-positive neurons were identified using epifluorescence optics and patched with video-assisted bright-field infrared optics. Patch electrodes contained potassium-based intracellular solution (128 mM KCH3SO3, 4 mM MgCl2, 10 mM HEPES, 10 mM phosphocreatine, 4 mM ATP, 0.4 mM GTP, 3 mM ascorbate). The blue excitation light used to visualize YFP did not cause detectable photolysis of caged glutamate, as monitored by whole-cell recording during prolonged illumination.
Synaptic input maps were measured in voltage-clamp mode at a holding potential of −70 mV, near the empirically determined reversal potential for GABAergic conductances. Signals were filtered at 4 KHz and sampled at 10 KHz. The mapping grid was a 16-by-16 array with 0.1-mm spacing. Software tools were used to align the top row of the grid with the pia, and to center the grid horizontally over the soma. The grid covered the full thickness of the cortex and a total area of ∼2 mm2 around the soma. We used Ephus software, a Matlab-based suite of programs for general-purpose electrophysiology and data I/O (freely available online at http://svobodalab.cshl.edu/software_main.html
), to control data acquisition including patch clamp and LSPS protocols.
Map traces were analyzed off-line to calculate the mean synaptic current over a short post-stimulus time window (50 ms), and these data arrays were color-coded for display as pixelated synaptic input maps. Direct responses – large, short-latency responses occurring at sites were the laser beam directly stimulated dendrites of the recorded neurons – were excluded from analyses, and rendered as black pixels in displayed maps. For each cell, maps from two to three trials were averaged. Individual neurons’ maps were pooled by group to obtain population-averaged maps.
For each recorded neuron, we used a bright-field image, captured at the time of mapping, to measure the locations of the soma along a line extending radially from the pia to the white matter. We used these data to calculate the normalized soma position, defined as the fractional distance of the soma between the pia (defined as zero) and white matter (defined as 1).
For electrophysiological characterizations, after delivering standard electrophysiological stimulus protocols for determining recording parameters and spike patterns, spike train responses were recorded in current clamp mode evoked by depolarizing current injections. Spike frequency adaptation was measured using prolonged current steps sufficient to evoke a spiking at ∼10 Hz. The average adaptation index for YFP-negative and YFP-positive neurons was calculated as [mean instantaneous frequency at 0.7–1.0 s]/[mean instantaneous frequency at 0.05–0.2 s].
To estimate radial distributions of YFP-positive neurons, we captured epifluorescence images of slices (using a 4 × objective lens) and analyzed these by two methods. First, we calculated the relative signal intensities along the radial (pia-to-white matter) axis by horizontally projecting the pixel data for an appropriate motor-frontal cortex region of interest (∼0.2 mm in width and spanning the full cortical depth vertically). We normalized the x data of these vectors to the pia and white matter, and the y data to the peak. Second, we marked the locations of YFP-expressing somata in the same set of images, generated histograms from these, and again normalized these vectors in both dimensions. High-resolution images of YFP-positive neurons were obtained using a two-photon laser scanning microscope (Prairie Technologies, Inc.) equipped with a high numerical aperture, intermediate magnification objective lens (20×, n.a. 0.95, Olympus).
Double-Layered Radial Distribution of YFP-Positive Neurons in Motor-Frontal Cortex
Brain slices were prepared using off-sagittal slice angles that provided slices containing both motor-frontal neocortex (M1) anteriorly and somatosensory neocortex (barrel cortex, S1) posteriorly (Figure 1
A). Our first observation on examining these slices with epifluorescence imaging was that in motor-frontal cortex there appeared to be a double blade of labeled neurons in layer 5, with more labeled cells in the upper blade than in the lower (Figure 1
B). This contrasted with somatosensory cortex where the cells occupied a radially more restricted region as a single blade, as described previously (Figure 1
A). High-resolution imaging with 2-photon fluorescence microscopy confirmed that the YFP-positive neurons exhibited somatodendritic morphologies characteristic of thick-tufted layer 5 pyramidal neurons (Figure 1
C).
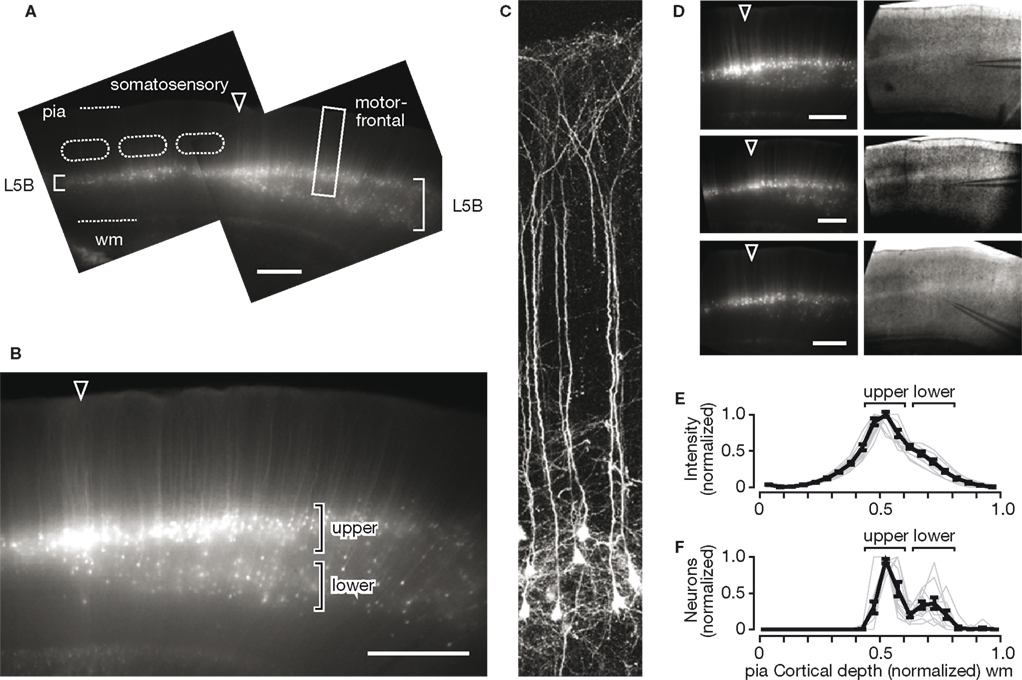
Figure 1. Bimodal laminar distribution of YFP-positive neurons in motor-frontal cortex. (A) Epifluorescence image of an off-sagitally slice prepared from a YFP-H animal, showing characteristic double blade of YFP-positive neurons in motor-frontal cortex. The pia and border between cortex and white matter (wm) are indicated by dashed lines. Primary somatosensory cortex (S1 barrel cortex) is to the left, with layer 4 barrels outlined (dashed lines). Motor-frontal cortex is to the right, and the frontoparietal border is indicated by the arrowhead ( ). Scale bar is 0.5 mm (also for other panels). Note greater radial extent of labeled neurons in layer 5B (L5B) of motor-frontal compared to somatosensory areas. (B) High-magnification view from another slice, showing the radially bimodal distribution of YFP-positive neurons in upper and lower blades in motor-frontal cortex. (C) High-resolution image of YFP-positive neurons in motor-frontal cortex [from another slice, location approximately as indicated by rectangular box in (A)]. Neurons were imaged in vitro with 2-photon microscopy. (D) Examples of epifluorescence images of slices with corresponding bright-field images. Recording electrodes were positioned on cells in upper layer 5. (E) Estimation of radial distributions of YFP-positive neurons in motor-frontal cortex. Thin gray lines are the intensity profiles from individual slices, and the thick black line shows the mean (±s.e.m., n = 11 slices). The approximate locations of the upper and lower blades of YFP-positive neurons in motor-frontal cortex are indicated. (F) Same as (E), but based on the numbers and locations of YFP-positive somata as identified by visual inspection of the same set of images.
). Scale bar is 0.5 mm (also for other panels). Note greater radial extent of labeled neurons in layer 5B (L5B) of motor-frontal compared to somatosensory areas. (B) High-magnification view from another slice, showing the radially bimodal distribution of YFP-positive neurons in upper and lower blades in motor-frontal cortex. (C) High-resolution image of YFP-positive neurons in motor-frontal cortex [from another slice, location approximately as indicated by rectangular box in (A)]. Neurons were imaged in vitro with 2-photon microscopy. (D) Examples of epifluorescence images of slices with corresponding bright-field images. Recording electrodes were positioned on cells in upper layer 5. (E) Estimation of radial distributions of YFP-positive neurons in motor-frontal cortex. Thin gray lines are the intensity profiles from individual slices, and the thick black line shows the mean (±s.e.m., n = 11 slices). The approximate locations of the upper and lower blades of YFP-positive neurons in motor-frontal cortex are indicated. (F) Same as (E), but based on the numbers and locations of YFP-positive somata as identified by visual inspection of the same set of images.Examination of slices prepared from different animals (Figure 1
D) showed that the double-blade distribution in motor-frontal cortex was a consistent feature in this line, albeit with somewhat variable densities of labeled neurons in the lower blade. Also, the bifurcation of the single-layered distribution into a double-layered distribution always occurred at the border between the somatosensory and motor-frontal cortices. To obtain a rough quantitative estimate of the radial distributions of YFP-positive neurons, we projected the epifluorescence images horizontally (Figure 1
E). This showed that the peak intensity, corresponding to the YFP-positive neuronal somata in the upper blade, occurred at a fractional distance of approximately 0.5 along the normalized radial (vertical, laminar) axis, with pia defined as 0 and white matter (wm) as 1. The lack of a clear second peak corresponding to the somata in the lower was probably due to the high signal arising from the high density of dendrites of YFP-positive neurons across layer 5, and the broader radial distribution of lower-blade YFP-positive neurons. Therefore, we further analyzed these images by marking the locations of YFP-positive somata, and plotting these data as histograms that were normalized for distance and amplitude (Figure 1
F). This again showed a peak at the same location (normalized distance ∼0.5), but also demonstrated the bimodal nature of the radial distribution of the YFP-positive neurons. It also confirmed the impression that YFP-positive neurons were more abundant in the upper blade as in the lower (by a factor of 2.6, p < 0.05, t-test comparison of values at the upper versus lower peaks seen in the plot in Figure 1
F).
LSPS Mapping of Local Excitatory Inputs to YFP-Positive Neurons
We next used glutamate uncaging and LSPS to map the local topography of excitatory pathways originating from pyramidal neurons and forming connections onto individual layer 5 neurons, as detected by whole cell patch-clamp recording in voltage-clamp mode (Figure 2
A). We used the same stimulus and recording parameters previously used in a study of unlabeled pyramidal neurons located in all layers in wild type mice (Weiler et al., 2008
). Under these conditions, which include NMDA blockade and elevated divalent cations (to dampen excitability and plasticity), the recorded synaptic inputs appear on average to be events arising from directly presynaptic neurons (i.e., monosynaptic) that mostly fire a single action potential in response to photostimulation. Moreover, at a single photostimulation site the number of neurons activated is on the order of ∼100, distributed in a small volume of neuropil (radius estimated to be in the range of 50–100 μm). Although both excitatory and inhibitory neurons are activated, by recording at the reversal potential for inhibitory conductances the excitatory events can be isolated. While this does not preclude the possibility that concurrent inhibitory currents in some other way affected our measurements of excitatory events, we expect these effects to be small, particularly as the YFP types differed in topography, not in input strength alone. (For further discussion of this and related issues regarding interpretation of LSPS data, see Supplementary Methods in Weiler et al., 2008
). An example of a collection of LSPS traces, arrayed as a map, is shown for a YFP-positive layer 5 neuron located in the upper blade (Figure 2
B).
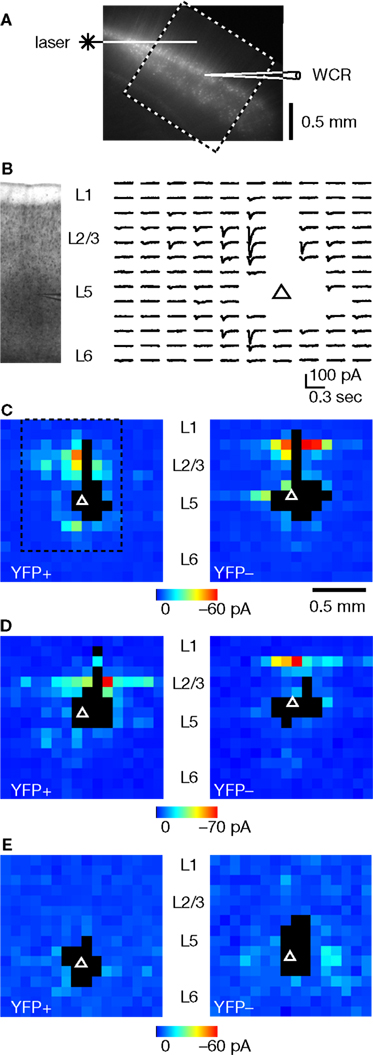
Figure 2. Examples of LSPS maps of excitatory synaptic inputs to YFP-positive and YFP-negative layer 5 neurons. (A) Depiction of recording arrangement, illustrating laser beam, mapping area (dashed boxed), and recording electrode. (B) A portion of a typical LSPS trace map, showing synaptic responses evoked at different sites around the neuron ( , soma). Gaps are where traces were excluded due to direct dendritic stimulation; such sites are rendered as black pixels in maps. Image on left shows bright-field appearance of slice. (C) Example of input maps for a pair of YFP-positive (left) and YFP-negative (right) neurons in upper layer 5, from the same slice. The dashed box indicates the pixels corresponding to the traces shown in (B). The color bar applies to both maps. (D) Another example; note predominance of layer 3 input to the YFP-positive neuron, and layer 2 input to the YFP-negative neuron. (E) Examples of maps for neurons in lower layer 5.
, soma). Gaps are where traces were excluded due to direct dendritic stimulation; such sites are rendered as black pixels in maps. Image on left shows bright-field appearance of slice. (C) Example of input maps for a pair of YFP-positive (left) and YFP-negative (right) neurons in upper layer 5, from the same slice. The dashed box indicates the pixels corresponding to the traces shown in (B). The color bar applies to both maps. (D) Another example; note predominance of layer 3 input to the YFP-positive neuron, and layer 2 input to the YFP-negative neuron. (E) Examples of maps for neurons in lower layer 5.Layer 5 neurons at approximately the same radial location (high in layer 5B, in the vertical zone containing the upper blade of YFP-positive neurons) consistently showed differences in input map features depending on the YFP status of the cell. In particular, YFP-positive neurons tended to get input from low in layer 2/3 (e.g. layer 3), whereas YFP-negative neurons received strongest inputs from high in layer 2/3 (e.g. layer 2) (Figures 2
C,D). In some cases, these descending input pathways arose from narrow horizontal strata (Figure 2
D).
For YFP-positive and YFP-negative neurons located in the lower blade, where the density of YFP-positive neurons appeared lower and more variable (see Figure 1
), input map topography appeared more diverse. These deeper neurons of either YFP type received most of their inputs from layer 5 or 6, and few from layer 2/3 (Figure 2
E).
For quantitative analysis, we pooled the maps of upper-blade layer 5 neurons by YFP phenotype, and computed an average map for each group (Figure 3
A). The average map for YFP-positive neurons (n = 17) showed that the strongest inputs arose from locations in lower layer 2/3, or layer 3. In contrast, and as described previously for unlabeled pyramidal neurons at this radial location (Weiler et al., 2008
), YFP-negative neurons received their strongest inputs from upper layer 2/3, or layer 2. We also compared these data by subtracting the YFP-positive map from the YFP-negative map, and by plotting the vertical profiles calculated by averaging along map rows (Figure 3
B). For the upper-blade neurons, these analyses revealed a radially interdigitating pattern of inputs for the two YFP phenotypes: YFP-positive neurons exhibited peaks of input both from the deeper portions of both layer 2/3 and 5, while YFP-negative neurons received peaks of input from the upper portions of both layer 2/3 and 5 (Figure 3
B). In an additional analysis that included neurons in both blades, we plotted the average input from specific map rows to each neuron (Figure 4
A,B). Neither YFP-positive nor YFP-negative neurons in the lower blade received strong inputs from sites in layer 2/3 (Figure 4
C).
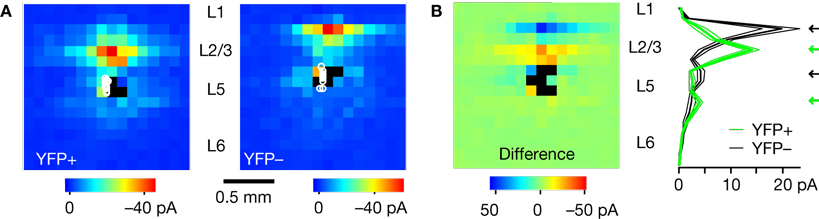
Figure 3. Comparison of excitatory input topography for YFP-positive and YFP-negative neurons. Only neurons in upper layer 5 were included in the analysis. (A) Average synaptic input maps for YFP-positive (n = 17 cells) and YFP-negative neurons (n = 11 cells). (B) Difference map, calculated by subtracting the YFP-negative map from the YFP-positive map. Plot on right shows the vertical profiles of the maps in (A) (thick and thin lines represent mean ± s.e.m., respectively), obtained by projecting the array data horizontally (i.e., averaging along rows). Note radially alternating sources of input (black and green arrows) to the two cell types.
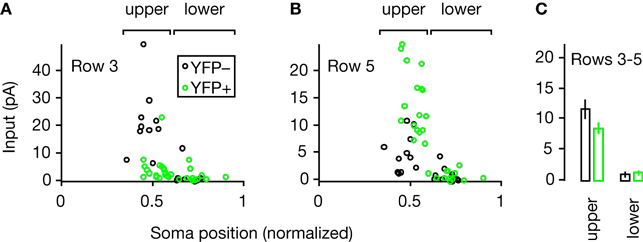
Figure 4. Plots of average strength of inputs from different map rows, as a function of the normalized soma positions of the YFP-positive and YFP-negative neurons. Brackets indicate the upper and lower blades of YFP-positive neurons. (A) Average strength of inputs from row 3 (≈ layer 2) for each neuron. (B) Average strength of inputs from row 5 (≈ layer 3) for each neuron. (C) Comparison of average strength of inputs from rows 3–5 (≈ layer 2/3) for upper- versus lower-blade neurons.
Electrophysiological Properties of YFP-Positive Neurons
We tested whether YFP-positive neurons also exhibited distinct electrophysiological properties, in addition to their distinct local circuit phenotypes. We did not find significant differences between YPF-positive (n = 24) and YFP-negative (n = 19) neurons in basic electrophysiological parameters, including resting membrane potential (YFP+, −62 ± 5 mV; YFP−, −62 ± 4 mV; mean ± s.d.; p > 0.05, t-test), input resistance (YFP+, 153 ± 90 MΩ; YFP−, 145 ± 63 MΩ; mean ± s.d.; p > 0.05, t-test), or capacitance (YFP+, 127 ± 80 mV; YFP−, 139 ± 64 mV; mean ± s.d.; p > 0.05, t-test).
However, we expected a difference in spike frequency adaptation, based on a previous report describing a non-adapting spike train pattern associated with YFP-positive neurons in several brain regions (Sugino et al., 2006
; see also Miller and Nelson, 2006
). We used current clamp mode to record membrane voltage during prolonged current steps, observing spike trains that in YFP-positive neurons showed sustained (non-adapting) firing rates and in YFP-negative neurons showed decelerating (adapting) firing patterns (Figure 5
A, inset). To compare the two phenotypes quantitatively, we used the spike latency data to extract instantaneous spike rates for each spike after the first spike in a train, which we then binned to obtain mean values and error estimates (Figures 5
A,B). These analyses showed a significant difference between the two phenotypes: compared to their spike rates early in trains, YFP-positive neurons showed slightly increasing spike frequencies at the end of trains and YFP-negative neurons showed spike rate slowing (Figure 5
B).
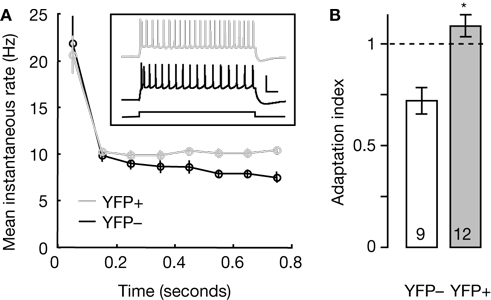
Figure 5. Comparison of spike frequency adaptation in YFP-positive and YFP-negative neurons. (A) Spike latencies were used to calculate instantaneous firing rates for the neurons in each group, and these were binned in 100-ms bins for averaging. The plot shows the mean (±s.e.m.) instantaneous firing rate as a function of time after step onset. Inset shows representative examples of spike patterns of YFP-positive (gray trace) and YFP-negative (black trace) neurons evoked by depolarizing current steps. Scale bars, 0.2 s, 50 mV. (B) Average adaptation index for YFP-negative (open) and YFP-positive (gray) neurons. The group averages were significantly different (*, p < 0.005, t-test). Numbers in bars show sample size.
In this study we used an in vitro photostimulation-based circuit mapping approach to characterize the local excitatory connections onto YFP-positive neurons in layer 5 in motor cortex of YFP-H mice, comparing them to YFP-negative neighboring neurons.
On examining slices prepared from YFP-H mice we observed that YFP-positive neurons were distributed as a double blade in motor-frontal cortex, with a greater abundance of fluorescent cells in the upper blade (Figure 1
). The transition from a single to a double blade of labeled cells occurred at the border between granular (somatosensory barrel cortex) and agranular (motor-frontal) neocortex. By implication, because the labeled cells are located in layer 5B in somatosensory cortex, the equivalent layer in motor-frontal cortex (where lamination is less distinct than in granular cortex) is apparently considerably thicker. An expansion of layer 5B in motor-frontal cortex was also suggested on the basis of the bright-field appearance of layers in slices (Weiler et al., 2008
). In his landmark study of mouse cortical architectonics, Caviness emphasized that layer 5 in motor-frontal cortex (area 6) appears particularly wide (Caviness, 1975
). Additional evidence for thickened layer 5 can be gleaned from images of the cortical distribution of molecular markers for layer 5 pyramidal neurons (e.g. Arlotta et al., 2005
; Molyneaux et al., 2005
).
A second finding was that the YFP-positive neurons in the upper blade preferentially received excitatory inputs from layer 3. In contrast, a layer 2 predominant pattern was observed for YFP-negative neurons (Figures 2 and 3
). Thus, layer 2/3 → 5 pathways appear to comprise at least two distinct parallel pathways. In our previous sample of unlabeled neurons, layer 2 → 5 descending inputs were strongest on average, but for some individual cells the layer 3 → 5 inputs were stronger, and the connectivity matrix for the excitatory network included strong layer 3 → 5 connections (Weiler et al., 2008
). Vertical (interlaminar) pathways have been described previously in primate motor cortex (Gatter et al., 1978
), and Kaneko and colleagues have provided evidence (in cat and rat) that the inputs to layer 5 corticospinal neurons are relatively strong from layer 3 and weak from layer 2 (Cho et al., 2004
; Kaneko et al., 1994a
,b
, 2000
), consistent with the patterns we observed here.
In this regard it is interesting that YFP-expressing neurons share some properties with corticospinal neurons (Sugino et al., 2006
). Indeed, a preliminary report suggests considerable overlap between the populations of YFP-positive and corticospinal neurons based on retrograde labeling of the latter in YFP-H mice (Miller and Nelson, 2006
). However, the overlap is only partial, and our sample of YFP-positive neurons most likely contained a mixture of several pyramidal subpopulations as defined by their long-distance axonal projections. In terms of their local circuit organization, YFP-positive neurons were not a homogeneous group, but showed systematic differences depending on the radial soma positions. Thus, our findings in general support the notion that labeled neurons in thy-1 strains represent subpopulations that are quite distinct but nevertheless functionally heterogeneous (Berglund et al., 2006
; Feng et al., 2000
).
The functional significance of the parallel pathway organization reported here is unclear, but may relate to hodological differences between neurons in upper versus lower layer 2/3. In the primate cortex, the former tend to project ipsilaterally and the lower contralaterally (Jones and Wise, 1977
). In rodents, this arrangement is not clearly established (Mitchell and Macklis, 2005
; Wise and Jones, 1976
; Yorke and Caviness, 1975
), but there is evidence for parallel organization at the level of ascending excitatory inputs to layer 2/3 of somatosensory cortex – in particular, for paralemniscal (thalamic posterior nucleus → cortical layer 5A → layer 2) and lemniscal (thalamic ventrobasal nucleus → layer 4) pathways (e.g. Bureau et al., 2006
; Shepherd and Svoboda, 2005
; Shepherd et al., 2005
). Whether this organization pertains to mouse motor cortex is not clear. In cat motor cortex, a distinction has been made between deeper layer 2/3 neurons that receive monosynaptic somatosensory cortical input and send monosynaptic outputs to corticospinal neurons, and more superficial layer 2/3 neurons receiving polysynaptic cortical input and connecting weakly with corticospinal neurons (Kaneko et al., 1994a
,b
). A similar scheme has been proposed for rat motor cortex based on layer 2/3 neurons’ axonal branching patterns (Cho et al., 2004
). These previous studies together with the present findings provide a framework to guide further studies of parallel pathways within the cortical motor control system.
A third finding was that YFP-positive neurons also exhibited distinct intrinsic properties, in the form of non-adapting spike trains (Figure 3
). As noted, non-adapting firing patterns were anticipated based on previous studies of YFP-positive neurons in several brain areas of YFP-H mice, including cingulate cortex, hippocampus, and somatosensory cortex (Sugino et al., 2006
). Also, a preliminary report indicates that YFP-positive neurons in motor cortex even exhibit an “accelerating” firing pattern in response to depolarizing current steps (Miller and Nelson, 2006
). Heterogeneous firing properties have been reported for rat corticospinal cells, including “regular spiking” neurons that were distinguished from “adapting” neurons based on their ability to sustain a constant firing rate during prolonged steps of depolarizing current (Tseng and Prince, 1993
). An important area for future investigation is to understand how highly specific circuits and intrinsic properties act in concert to shape the output of the local network and influence downstream elements in the motor system.
The possibility of transgenesis-related artifacts in these mice is difficult to control for, and could in principle affect neuronal function at a variety of levels such as gene transcription (e.g. insertional effects) or protein expression (e.g. related to high cytosolic YFP concentrations). Pathological effects have not previously been identified in the brain in these mice (Feng et al., 2000
; Miller and Nelson, 2006
; Sugino et al., 2006
). However, a recent study demonstrates higher rates of late onset distal axonal swellings in the spinal cords of adult YFP-H mice compared to controls (Bridge et al., 2007
). Notably, differences between YFP and non-YFP mice were not observed in motor cortex, among other CNS areas (Bridge et al., 2007
). Nevertheless, we cannot exclude the possibility that high YFP expression levels contributed somehow to the local-circuit phenotypes observed here.
Recently, many laboratories have begun exploiting the favorable labeling characteristics of the thy-1 YFP-H line of mice by crossing them with other transgenic lines of interest (e.g. Beirowski et al., 2004
; Brendza et al., 2003
; Niu et al., 2004
; Schaefer et al., 2005
; Stanwood et al., 2005
; Zhang et al., 2005
). Our characterization of the local excitatory circuit organization of YFP-expressing layer 5 pyramidal neurons in motor-frontal cortex of YFP-H mice presents a starting point for synaptic circuit studies in which YFP-H mice are crossed with other transgenic lines that are of particular interest for cortical circuit organization in this part of the motor system. For example, the experimental paradigm described here could potentially be used to assess synaptic circuit pathophysiology in motor-frontal cortex of transgenic mice models for corticospinal motor neuron degeneration (Hazan et al., 1999
; Pasinelli and Brown, 2006
; Yang et al., 2001
). Our study also serves as a paradigm for investigating pyramidal neuron classes in motor cortex identified by other methods, particularly retrograde labeling.
The authors declare that the research was conducted in the absence of any commercial or financial relationships that could be construed as a potential conflict of interest.
We thank J. Grutzendler for YFP-H mice, and D. Wokosin for assistance with 2-photon microscopy. We thank M. Hooks, K. Svoboda, and N. Weiler for comments on a draft. This work was supported by NIH training grants (to CTA, PLS, and LW) and research grants from the Whitehall Foundation and NIH (to GS).
Brendza, R. P., O’Brien, C., Simmons, K., McKeel, D. W., Bales, K. R., Paul, S. M., Olney, J. W., Sanes, J. R., and Holtzman, D. M. (2003). PDAPP; YFP double transgenic mice: a tool to study amyloid-beta associated changes in axonal, dendritic, and synaptic structures. J. Comp. Neurol. 456, 375–383.
Hazan, J., Fonknechten, N., Mavel, D., Paternotte, C., Samson, D., Artiguenave, F., Davoine, C. S., Cruaud, C., Durr, A., Wincker, P., Brottier, P., Cattolico, L., Barbe, V., Burgunder, J. M., Prud’homme, J. F., Brice, A., Fontaine, B., Heilig, B., and Weissenbach, J. (1999). Spastin, a new AAA protein, is altered in the most frequent form of autosomal dominant spastic paraplegia. Nat. Genet. 23, 296–303.
Yang, Y., Hentati, A., Deng, H. X., Dabbagh, O., Sasaki, T., Hirano, M., Hung, W. Y., Ouahchi, K., Yan, J., Azim, A. C., Cole, N., Gascon, G., Yagmour, A., Ben-Hamida, M., Pericak-Vance, M., Hentati, F., and Siddique, T. (2001). The gene encoding alsin, a protein with three guanine-nucleotide exchange factor domains, is mutated in a form of recessive amyotrophic lateral sclerosis. Nat. Genet. 29, 160–165.