1
Department of Neurology, David Geffen School of Medicine at UCLA, Los Angeles, CA, USA
2
Doctoral Program, New York University, New York, NY, USA
3
Neuroscience Inter-Departmental Program, David Geffen School of Medicine at UCLA, Los Angeles, CA, USA
4
Department of Neurobiology, David Geffen School of Medicine at UCLA, Los Angeles, CA, USA
Cajal–Retzius (CR) neurons play a critical role in cortical neuronal migration, but their exact fate after the completion of neocortical lamination remains a mystery. Histological evidence has been unable to unequivocally determine whether these cells die or undergo a phenotypic transformation to become resident interneurons of Layer 1 in the adult neocortex. To determine their ultimate fate, we performed chronic in vivo two-photon imaging of identified CR neurons during postnatal development in mice that express the green fluorescent protein (GFP) under the control of the early B-cell factor 2 (Ebf2) promoter. We find that, after birth, virtually all CR neurons in mouse neocortex express Ebf2. Although postnatal CR neurons undergo dramatic morphological transformations, they do not migrate to deeper layers. Instead, their gradual disappearance from the cortex is due to apoptotic death during the second postnatal week. A small fraction of CR neurons present at birth survive into adulthood. We conclude that, in addition to orchestrating cortical layering, a subset of CR neurons must play other roles beyond the third postnatal week.
More than a century after their discovery (Ramón y Cajal, 1890
; Retzius, 1893
), Cajal–Retzius (CR) neurons remain mysterious cells surrounded by controversy (Soriano and Del Rio, 2005
). CR neurons are amongst the earliest born neurons in the neocortex, around embryonic day (E) 10–11 in the mouse (Hevner et al., 2003
), but their exact site of origin remains contentious. Recent evidence suggests that the vast majority of CR neurons are most likely generated at E10–12 in three locations: the cortical hem (Takiguchi-Hayashi et al., 2004
; Garcia-Moreno et al., 2007
), the septum and the ventral pallium (Bielle et al., 2005
). They subsequently migrate tangentially to cover the whole cortical mantle, but CR neurons from different sources may eventually populate distinct cortical regions (Bielle et al., 2005
). These different CR subtypes could play distinct roles in the developing cortex, perhaps through region-specific properties.
The exact fate of CR neurons is a second subject of ongoing debate. Cells with the typical CR morphology are difficult to find in the adult cortex. One theory is that they undergo a morphological change, which renders them unrecognizable as CR cells, in order to become resident interneurons in adult neocortex (Parnavelas and Edmunds, 1983
; Sarnat and Flores-Sarnat, 2002
), but this is controversial (Derer and Derer, 1990
). Others have proposed that the decrease in CR neuron density is caused by dilution from the expansion of the cortex during development, without a clear morphological transformation (Marin-Padilla, 1990
). Still, most recent evidence points to a totally different hypothesis, namely that many CR neurons undergo cell death (Derer and Derer, 1990
). In rodents, signs of CR neuron degeneration begin in the second postnatal week, as evidenced by retraction of thin appendages from their main dendrite, swelling of the endoplasmic reticulum and darkening of the cytoplasm (Derer and Derer, 1990
; del Rio et al., 1995
). As many as 75% of those present at birth may disappear before P10–P14 (del Rio et al., 1995
; Soda et al., 2003
). However, the exact fraction of CR neurons that persist in Layer (L) 1 of adult neocortex has never been calculated because this would require time-lapse in vivo imaging of identified CR neurons over time.
To investigate the fate of CR neurons, we used chronic time-lapse in vivo two-photon microscopy in the Ebf2-GFP GFP reporter mouse line from postnatal day (P) 3 to adulthood. We demonstrate that this line specifically labels all CR neurons in the postnatal cerebral cortex. We also show that only a small fraction of these cells survives into adulthood, while the rest die by apoptosis. Those that survive undergo subtle morphological transformations.
Animals
All the procedures described in this study were approved by the University of California Chancellor’s Animal Research Committee. We used male and female mice of the C57Bl/6J strain. Ebf2-GFP BAC transgenic mice were engineered through the GENSAT project (Gong et al., 2003
). We obtained frozen Ebf2-GFP embryos from the Mutant Mouse Regional Resource Centers
1
and implanted them at UCLA. Genotypes were confirmed by PCR analysis (following recommended MMRRC protocols) of DNA extracted from tail samples taken at the time of weaning, or from ear samples obtained at P2.
Materials
All materials were purchased from Sigma-Aldrich (St. Louis, MO, USA) unless otherwise stated.
Immunohistochemistry
Mice at various postnatal ages (P2–P13) were perfused intracardially with 4% paraformaldehyde (PF) in 0.1 M phosphate buffer; brains were harvested and postfixed overnight in 4% PF. For studies in embryonic tissue, pregnant Ebf2-GFP dams were perfused at E14 with 4% PF and their embryos carefully dissected and fixed overnight in 4% PF. All brains were then mounted on 3% low melting point agarose and blocked for slicing. Next, 40 μm-thick slices were cut with a vibratome (VT 1000, Leica Microsystems Inc., Bannockburn, IL, USA) in a tangential plane parallel to the plane of imaging, and processed for standard fluorescence immunocytochemistry. As primary antibodies, we used a polyclonal goat anti-reelin (1:500; R&D Systems, Minneapolis, MN, USA) and a rabbit anti-GABA (1:4,000; Sigma, St. Louis, MO, USA). As secondary antibodies, we used donkey anti-goat Alexa-594 (1:1,000; Invitrogen, Carlsbad, CA, USA), goat anti-rabbit-FITC (1:400; Jackson Immunoresearch Labs, West Grove, PA, USA), and goat anti-rabbit Alexa-594 (1:1,000; Invitrogen, Carlsbad, CA, USA).
Electrophysiology
Acute brain slices (300 μm-thick) were cut on a vibratome (VT 1000, Leica) and placed on a chamber maintained at 32–35°C on the stage of an upright Olympus BX50WI microscope (Olympus, Melville, NY, USA). Slices were submerged in ACSF containing (in mM): 126 NaCl, 3 KCl, 1 MgSO4, 1.14 NaH2PO4, 2 CaCl2, 26 NaHCO3, and 10 dextrose, perfused at a rate of 2–4 ml/min, and bubbled with 95% O2/5% CO2. CR neurons and interneurons in L1 were identified using GFP fluorescence and differential interference contrast optics, respectively, using a 40×/0.9 NA water immersion objective (Olympus). Glass microelectrodes (4–6 MΩ) for patch-clamp recordings were filled with internal solution containing (in mM): 130 K-gluconate, 10 Na-gluconate, 10 HEPES, 10 phosphocreatine, 4 Mg-ATP, 0.3 GTP, 4 NaCl, and 0.02 Alexa-594. Recordings were performed using whole-cell technique in current-clamp configuration with a patch-clamp amplifier (Multiclamp, Molecular Devices, Sunnyvale, CA, USA).
Window Surgery
Chronic glass-covered cranial windows were implanted as recently described (Mostany and Portera-Cailliau, 2008
; Holtmaat et al., 2009
). Mice were anesthetized with isoflurane (1.5% via nose cone) and placed on a stereotaxic frame over a warm water re-circulating blanket. A 2–3 mm diameter craniotomy (depending on the animal’s age) was performed with a pneumatic dental drill, centered over the right hemisphere, ∼1–2 mm lateral to the midline and 1–2 mm caudal to bregma. A sterile 3 mm glass cover slip was gently laid over the dura mater (without using agarose) and glued to the skull with cyanoacrylate-based glue. Dental acrylic was then applied throughout the skull surface and the edges of the cover slip. For the youngest animals (<P7), special care was employed to avoid spreading the dental cement across bony sutures, to ensure that bone growth proceeded normally. A titanium bar (0.125′ × 0.375′ × 0.05′) was embedded in the dental acrylic to secure the mouse onto the stage of the microscope for imaging. Mice recover nicely from the surgery and behave indistinguishably from unoperated littermates. When we implant windows at P3, we only image the mice until P8 because beyond that point some mice do not gain weight as fast as their unoperated littermates (presumably because skull growth is restricted by the head cap). When we implant windows at P7, we can image mice chronically until the window becomes opaque due to bone growth, which typically begins around P30–P35, though some mice can be imaged for months.
High Resolution In Vivo Two-Photon Imaging
Two-photon imaging began after a recovery period of >2 h. Mice were anesthetized with isoflurane and immobilized on the stage of the microscope. In vivo images of GFP-expressing neurons were acquired with a custom-built two-photon microscope, using a Chameleon Ultra II Ti:sapphire laser (Coherent Inc., Santa Clara, CA, USA) running at ∼ 910 nm. The objective (40× 0.8 NA) and trinoc are from Olympus (Tokyo, Japan), galvanometer mirrors from Cambridge Technologies (Lexington, MA, USA), scan lens from ThorLabs (Newton, NJ, USA), photomultiplier tubes from Hamamatsu (Hamamatsu City, Japan), and filters and dichroics from Semrock (Rochester, NY, USA). Image acquisition was achieved with ScanImage software (Pologruto et al., 2003
), written in MATLAB (MathWorks, Natick, MA, USA). Imaging sessions typically last 60–90 min, after which the mice were returned to their cage. Mice usually wake up within a few minutes after stopping the flow of anesthesia. For low magnification panoramic views of CR neurons, we obtained four to six overlapping stacks that were later tiled together in Neurolucida (Microbrightfield, MBF Bioscience, Williston, VT, USA), a program used to trace neuronal processes in 3-D within stacks of images (see below). Each stack was collected at 1× ScanImage zoom (∼320 μm × 320 μm, 512 × 512 pixels) and consisted of ∼32–40 slices, 3 μm apart (to encompass all of L1), or at 2× zoom (2 μm apart). The same regions of interest were located at every imaging session using the unique superficial vasculature pattern on the surface of the brain as a reference (Holtmaat et al., 2009
).
Analysis
Two-photon image stacks were loaded onto the Neurolucida confocal module and individual CR neurons were assigned specific labels in 3D. For the youngest animals (e.g., P3–P6), due to the high density of CR neurons, we started by counting CR neurons at the older age in a temporal series. Next, we analyzed the previous imaging time point, counting all additional CR neurons that were present at that time point but which were absent on the following day. We repeated this strategy until we had counted all the cells present on the first day of imaging. For statistical comparisons of CR cell density and survival we used a one-way ANOVA with a Bonferroni post hoc test. Significance was set at p < 0.05 and all data are presented as the mean ± standard error of the mean (SEM).
Recent work has identified early B-cell factor 2 (Ebf2) as a marker of CR neurons originating from the ventral pallium, but perhaps not those from the cortical hem (Yamazaki et al., 2004
; Hanashima et al., 2007
). We used Ebf2-GFP transgenic mice (GENSAT
2
) because the available online data suggested that they express GFP in cells of L1 in postnatal cortex, and that those cells exhibit the typical morphology of CR neurons, making this line ideally suited for chronic in vivo imaging.
In the Ebf2-GFP line, we confirmed that all the cells in L1 that express GFP are tadpole-shaped (Figure 1
). The oval-shaped cell bodies of these GFP+ neurons, as well as their axons and dendrites, are located within L1, another feature of CR neurons. From their principal dendrite emerge several smaller branches that course apically toward the pial surface (Figure 1
D) and are studded with spines (Figure 1
E). These are the unique morphological attributes that were used originally to define CR neurons (Ramón y Cajal, 1890
; Retzius, 1893
; Derer and Derer, 1990
; Marin-Padilla, 1990
, 1998
; Radnikow et al., 2002
). GFP+ cells in Ebf2 mice retained this morphology throughout postnatal development (see also Figures 4 and 5
).
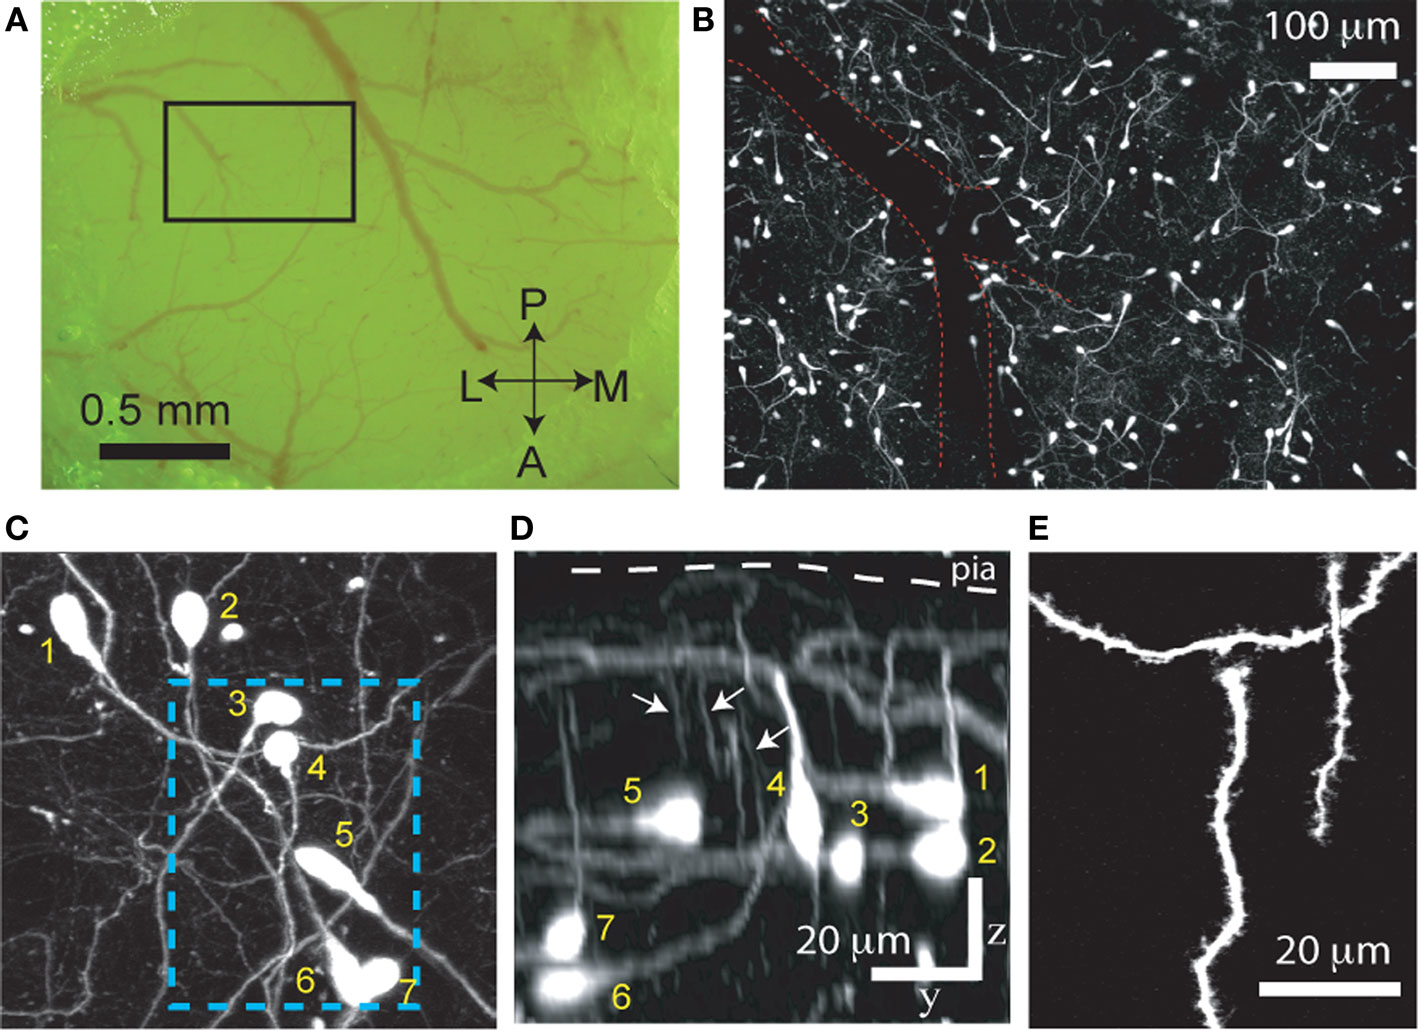
Figure 1. GFP+ cells in Ebf2 mice display the typical morphological features of Cajal–Retzius neurons. (A) Photomicrograph of the cranial window taken through the ocular of the two-photon microscope. A two-photon image of the boxed region is shown in panel (B). A, anterior; P, posterior; M, medial; L, lateral. (B) Low magnification two-photon image of GFP+ cells in somatosensory cortex of a P8 Ebf2-GFP mouse. The image is a composite maximum intensity projection (MIP) of six stacks, each consisting of 30–35 slices, 3 μm apart. An overlying dural vessel (red outline) partially obscures some of the fluorescence. (C) Higher magnification two-photon image (MIP of 57 slices, 2 μm apart) demonstrating that GFP-expressing cells have an oval cell body and a single (or sometimes two) main dendrite. The boxed region is shown in higher magnification in panel (E). (D) Side view (y–z projection) of the same image stack shown in panel (C) (scale bar also applies to (C)). Note that the main dendrite in CR neurons is oriented parallel to the pial surface with smaller secondary dendrites (arrows) that course up toward the pia (white arrows). Their axons are confined to layer 1 (not seen). (E) Higher magnification view of CR neuron dendritic spines in the boxed region in (B). This is a “best” projection of five optical slices, in which distracting processes (e.g., dendrites and axons of other CR neurons) have been digitally removed in Photoshop only for display purposes (Holtmaat et al., 2005
). The morphological features shown in panels (B–E) define CR neurons.
Using immunohistochemistry with antibodies against reelin we found that virtually all Ebf2-GFP+ cells (>95%) also express reelin throughout postnatal development (Figures 2
A,B). In addition, shortly after birth (P2), the overwhelming majority (97%) of reelin+ cells in L1 of these mice are GFP+. Later in development, other cells appear in L1 that express reelin but do not express GFP, but they have a very different morphology. For example, at P6 only 40% of reelin+ cells are also GFP+, and at P13 this number drops to 19% (Figure 2
B, yellow line). The remaining reelin+ cells have larger, rounder somas, and lack the typical tadpole shape of CR neurons (Figure 2
A, white arrows). These cells, but not GFP+ cells, express GABA (Figure 2
C) and thus, most likely represent L1 interneurons. Importantly, during the first two postnatal weeks the vast majority (>97%) of reelin+ cells that had the unique CR morphology were GFP+, suggesting that in the cortical regions we imaged, practically all CR neurons express Ebf2. CR neurons in Ebf2 mice were widely distributed in all cortical regions that we examined, including motor, somatosensory and visual cortices (not shown).
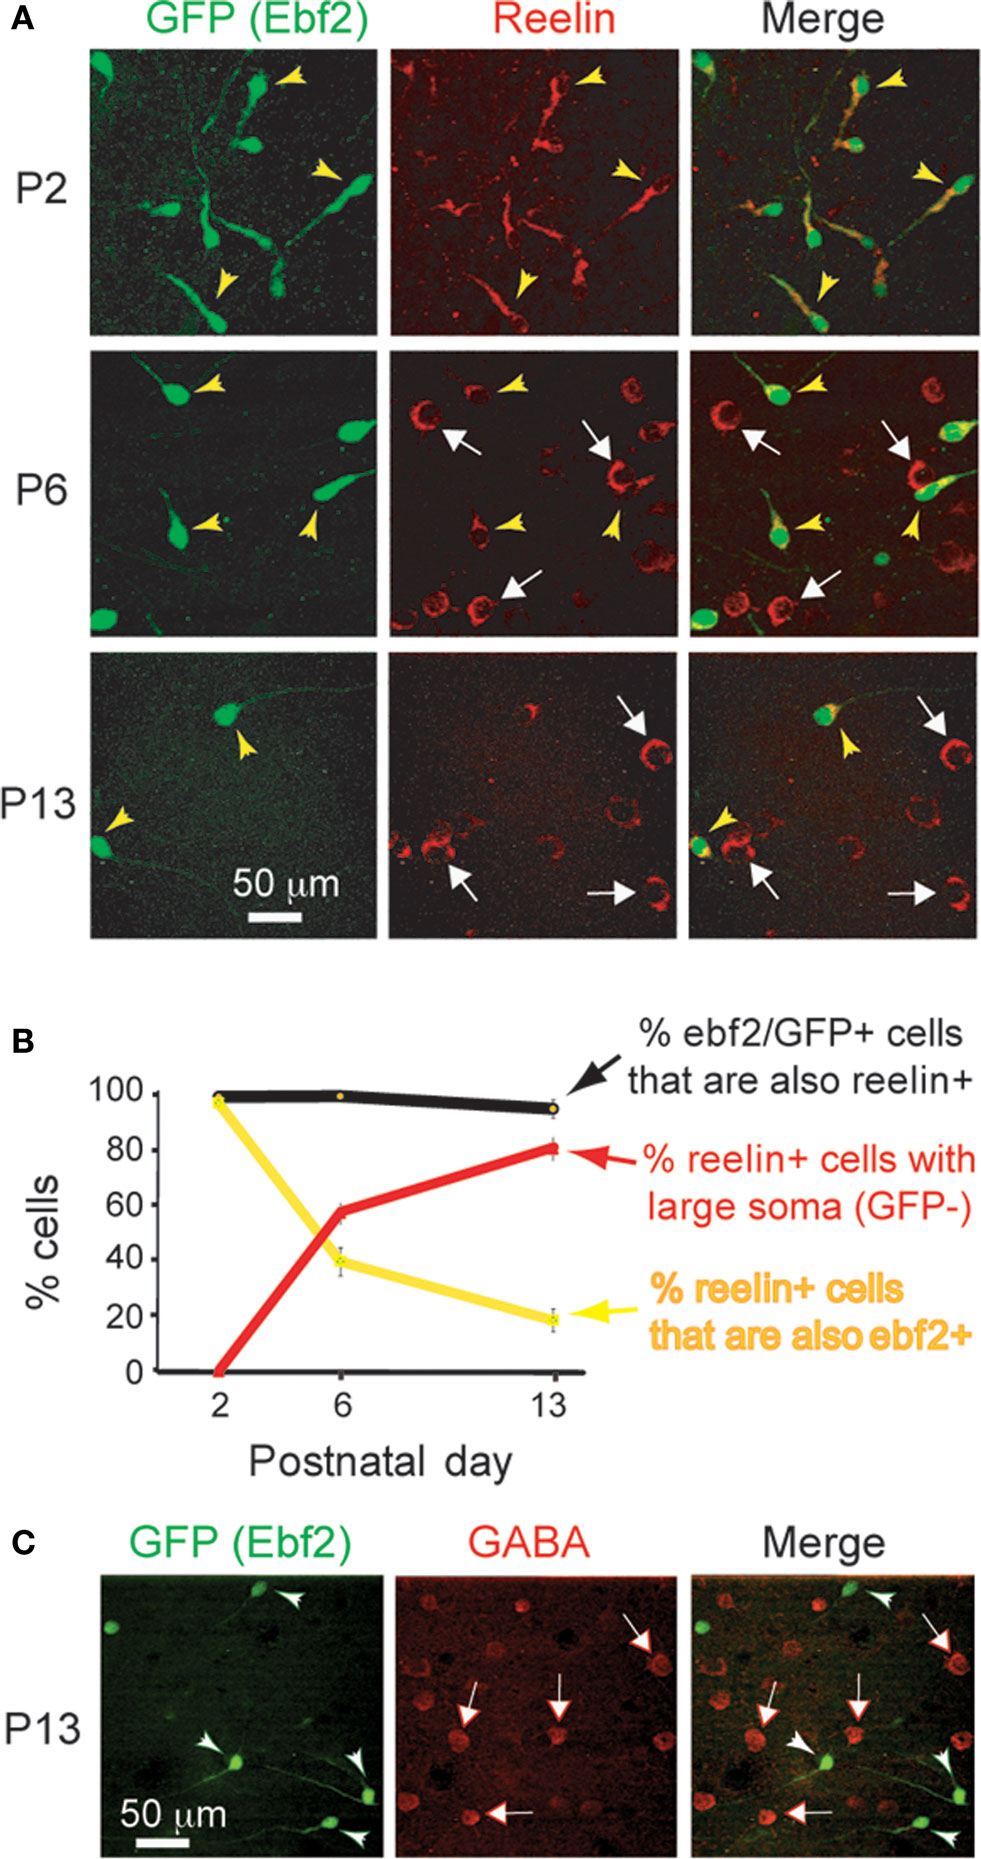
Figure 2. GFP+ cells in Ebf2 mice express reelin. (A) Tangential sections cut through L1 of somatosensory cortex of fixed brains from Ebf2 mice at P2, P6 and P13, stained with antibodies to reelin (red), and then imaged with two-photon microscopy (green: native GFP fluorescence). (B) Quantitative analysis of the correspondence of immuno-reactivity for reelin and GFP expression throughout postnatal development. (C) Sections were also immuno-stained for GABA (red). GFP+ cells (arrowheads) do not express GABA; none of the GABA+ cells (white arrows) have a CR morphology. We also performed immunohistochemistry with anti-reelin and anti-GABA antibodies in wild-type mice and found that none of the reelin+ cells that were tadpole shaped express GABA (not shown).
To further characterize the identity of GFP+ cells in these Ebf2 reporter mice, we performed patch-clamp recordings of GFP+ (n = 5) and GFP− (n = 9) cells in L1 (Figure 3
) at P6–P8. Ebf2-GFP+ cells were regular spiking neurons that showed inactivation, accommodation and a large sag in the hyperpolarizing response (Figure 3
C), which are characteristic of CR neurons (Radnikow et al., 2002
; Soda et al., 2003
). In contrast, GFP− cells had rounder and larger cell bodies with many thin dendrites that originate radially from the soma (Figure 3
B; see also white arrows in Figure 2
A), and the electrophysiological signature of fast spiking interneurons (Figure 3
D). Therefore, we conclude that GFP+ cells in Ebf2-GFP mice have the morphological, molecular and electrophysiological characteristics of CR neurons.
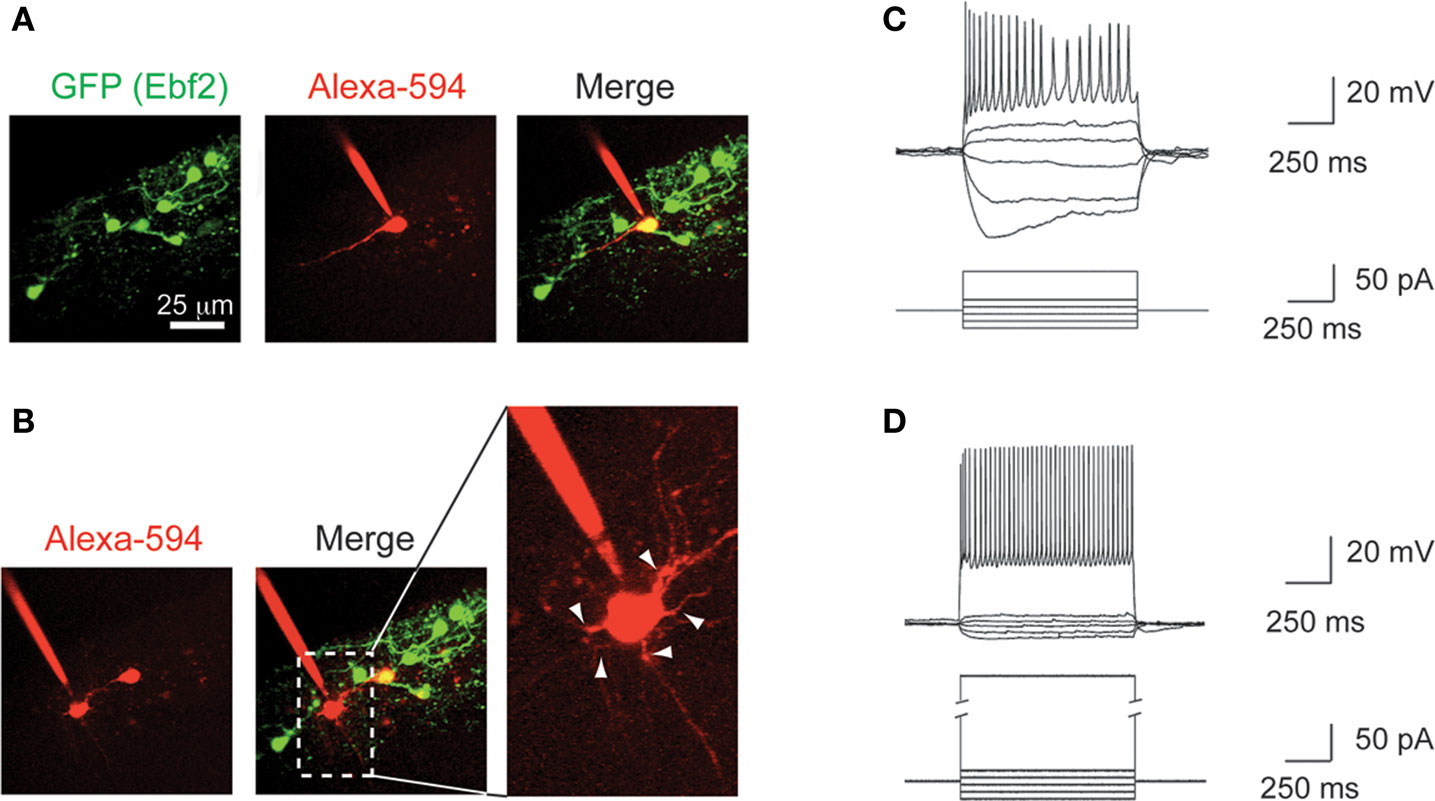
Figure 3. GFP+ cells in Ebf2 mice display the typical electrophysiological properties of Cajal–Retzius neurons. (A) GFP+ cells in layer 1 of a P8 Ebf2 mouse were targeted for patch-clamp recordings and filled intracellularly with Alexa-594 (red) in acute coronal brain slices. (B) In the same slice, a GFP− cell was also targeted for recording; Inset: note that many thin dendrites (arrowheads) emanate radially from the rounder and larger soma of this cell (akin to the cells labeled by white arrows in Figures 2
A,C). (C) Current clamp recording of a typical GFP+ cell showing broad action potentials with adaptation and a sag in the hyperpolarizing response, characteristic of CR neurons. (D) Current clamp recording of a fast spiking interneuron in L1. Current injection scale: −25, −15, −5, +5, +15, and +55 pA (C) or 255 pA (D).
To unequivocally prove whether the disappearance of CR neurons is caused by dilution, cell death or migration to deeper cortical layers, we imaged Ebf2-GFP mice (n = 17) chronically with in vivo two-photon microscopy from P3 to adulthood (Figures 4
A–C). We then analyzed two-photon image stacks to track re-identifiable CR neurons and quantify their numbers over time (Figure 4
D). We find that the density of CR neurons is relatively stable between P3–P4 and P7 (5,460 ± 460 cells/mm3 at P3–P4 vs. 5,399 ± 694 cells/mm3 at P7), but then drops significantly between P7 and P14 (568 ± 157 cells/mm3 at P14; p < 0.05; one-way ANOVA with Bonferroni post hoc test), and finally stabilizes somewhat after P20 (e.g., 283 ± 27 cells/mm3 at P22 and 203 ± 48 cells/mm3 at P33). In the end, only <3.5% of CR neurons that are present at P3–P7 can be found after the fourth postnatal week. Interestingly, survival fraction plots (Figures 4
E,F) indicate that the rate of disappearance of CR neurons is not constant throughout postnatal development: CR neuron loss was fastest at P11–P13 (56.6 ± 5.5%), compared to P7–P9 (73.4 ± 3.3%) or P18–P22 (85.9 ± 1.6%; p < 0.05; one-way ANOVA with Bonferroni post hoc test). When CR neurons survive past the second postnatal week, they are much more likely to survive into adulthood (Figures 4
B–F). In fact, >50% of cells found at P18–P22 survive until the sixth postnatal week (Figures 4
D,E).
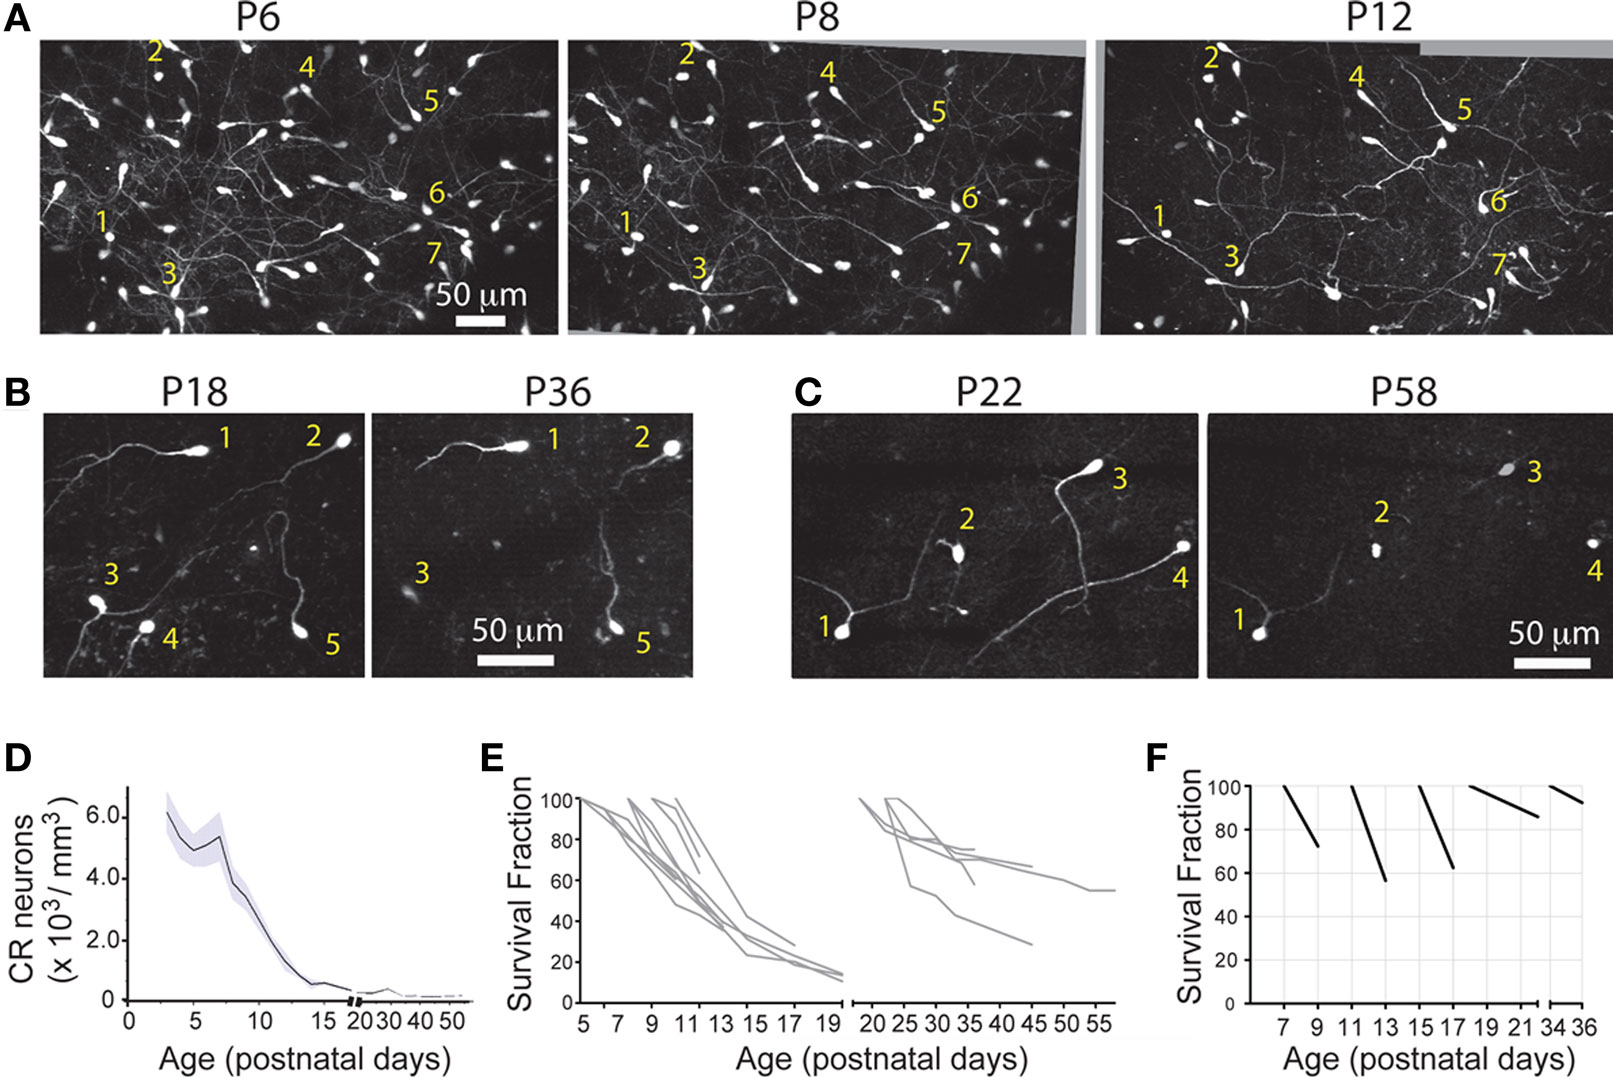
Figure 4. Quantitative analysis of CR cell counts and disappearance rates in Ebf2 mice. (A) Time-lapse in vivo two-photon imaging of GFP+ CR neurons in a single Ebf2 mouse at P6, P8 and P12. In each animal we followed the fate of a large number of CR neurons in slightly overlapping stacks that we tiled together (due to the growth of the brain, the field of view underwent some degree of rotation and expansion over time). Seven representative CR neurons are indentified with numbers in all three images. (B) In this example, CR neurons were imaged chronically from P18 to P36. (C) Example of a mouse in which CR neurons were imaged chronically from P22 to P58. The images at the P36 (B) and P58 time points are dimmer because bone growth beneath the glass-covered window has partially obscured the neurons. Please note also that many CR neurons that survive into the second postnatal month tend to lose their principal dendrite and their cell bodies become rounder. (D) CR cell density throughout postnatal development. (E) Survival fraction (% CR neurons retained over subsequent imaging sessions) throughout postnatal development. Gray lines represent data from a single animal imaged chronically. Data for this graph came from a total of 1,660 CR neurons from 17 different mice imaged on at least two separate time points. (F) 2- or 4-day survival fractions across different postnatal ages. Animals/cells analyzed: three mice from P7 to P9 (437 cells), three mice from P11 to P13 (158 cells), three mice from P15 to P17 (62 cells), two mice from P18 to P22 (35 cells), five mice from P22 to P26 (86 cells), and two mice from P34 to P36 (36 cells). All images in panels (A–C) are MIPs of ∼28–35 slices, 3 μm apart.
Our time-lapse imaging over the second postnatal week, when the largest loss of CR neurons occurs, showed numerous CR neurons undergoing morphological features of apoptosis (Kerr et al., 1972
), as evidenced by the accumulation of round cellular debris (Figures 5
A,C). Experiments using short intervals between image sessions (3–4 h) provided a timeline for apoptotic cell death of CR neurons: the whole process appears to take less than 6 h (Figure 5
B).
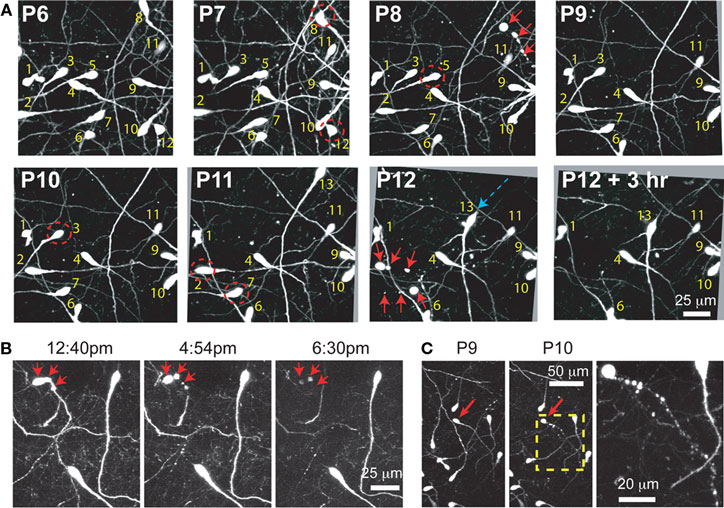
Figure 5. Time-lapse imaging in Ebf-GFP mice confirms the death of identified CR neurons by apoptosis. (A) Serial imaging of an Ebf2-GFP mouse with in vivo two-photon microscopy to re-identify the location of individual CR neurons from P6 to P12. All images are MIPs of 30 slices, 2 μm apart. Note that CR neurons exhibit slight movements of the soma in the xy plane (blue arrow shows a large single day retraction of the soma of cell 13), but do not migrate over longer distances in the xy or z planes. Note also the disappearance of CR neurons 2, 3, 5, 7, 8, and 12 (red dashed circles). In many cases we “caught” the death of CR neurons by apoptosis (red arrows at P8 and P12). Some images were rotated slightly for alignment due to brain expansion throughout development. (B) Apoptosis of CR neurons occurs quickly (<6 h), as shown in this example at P15. Note that GFP expression persists until the time of the death. (C) Additional example of chronic in vivo two-photon imaging of apoptotic death of a CR neuron at P19-P10. Images are MIPs of 10–20 slices 2–3 μm apart.
To further confirm the mechanism of cell death we stained neocortical slices from perfusion-fixed Ebf2 mice with anti-caspase 3 antibodies and demonstrate colocalization of this apoptotic marker and CR neurons at various stages of degeneration (Figure 6
). Our time-lapse imaging experiments also showed that most CR neurons undergo changes in cell shape, including retraction of the cell body toward the main dendrite (Figure 5
A, blue arrow; Figure 7
).
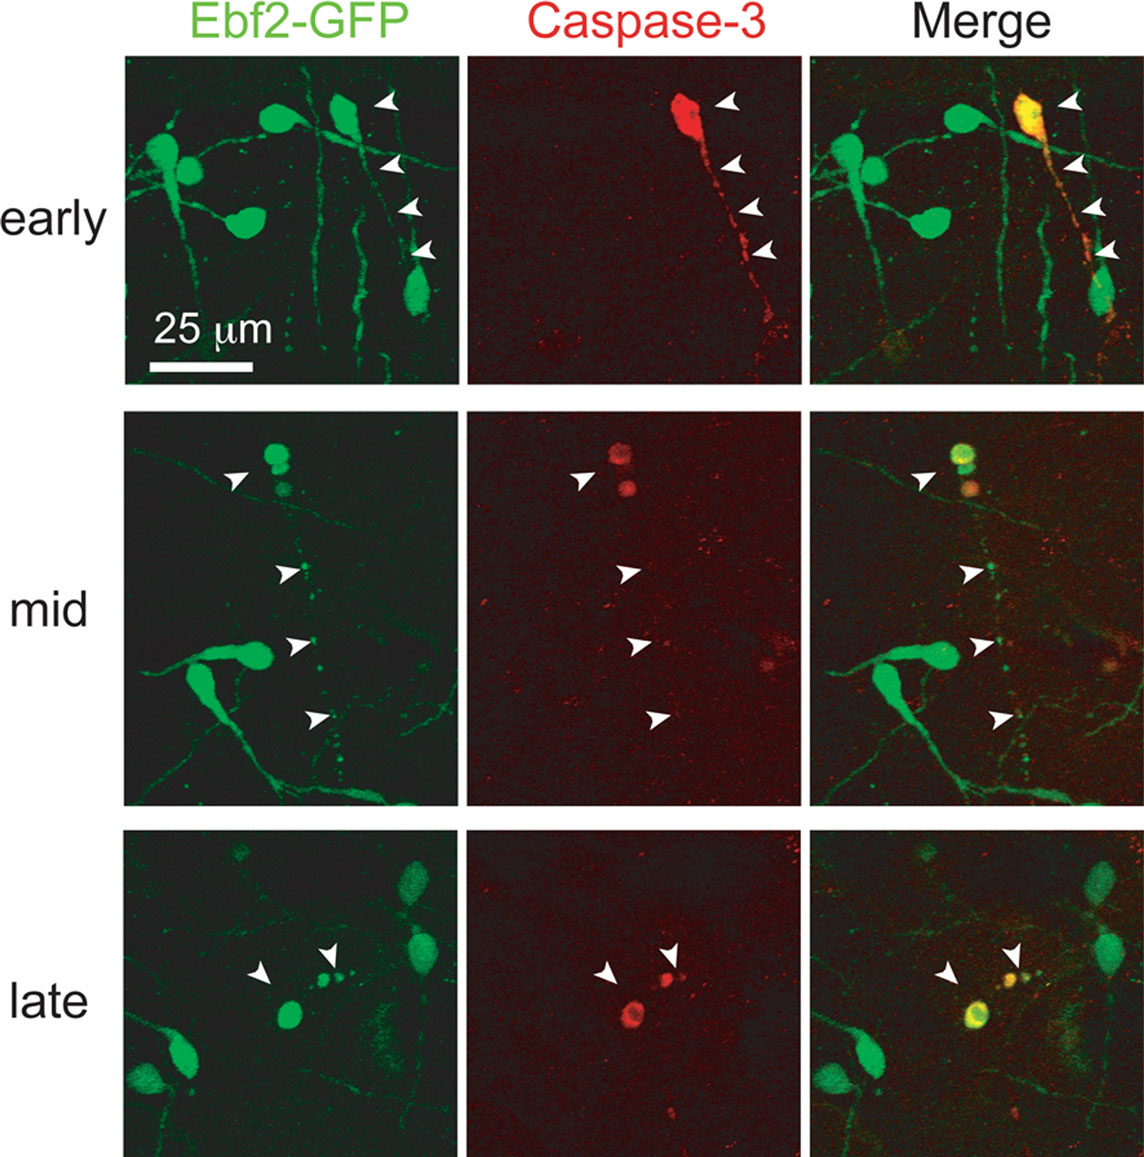
Figure 6. Caspase-3 expression within dying CR neurons. Colocalization between activated caspase-3 (red) and Ebf2-GFP expression in dying CR neurons. Tangential sections through layer 1 of the neocortex of perfusion-fixed Ebf2-GFP mice at P8-P10 were stained with antibodies against activated caspase-3 and imaged with two-photon microscopy. Note how caspase-3 is expressed in the cytoplasm of dying CR neurons at the earliest stages of degeneration (top row), when CR neurons appear normal and maintain their tadpole morphology, as well as in late stages of cell death (bottom row), when only apoptotic bodies can be identified. Images are maximum intensity projections of 10–12 slices, 3 μm apart.
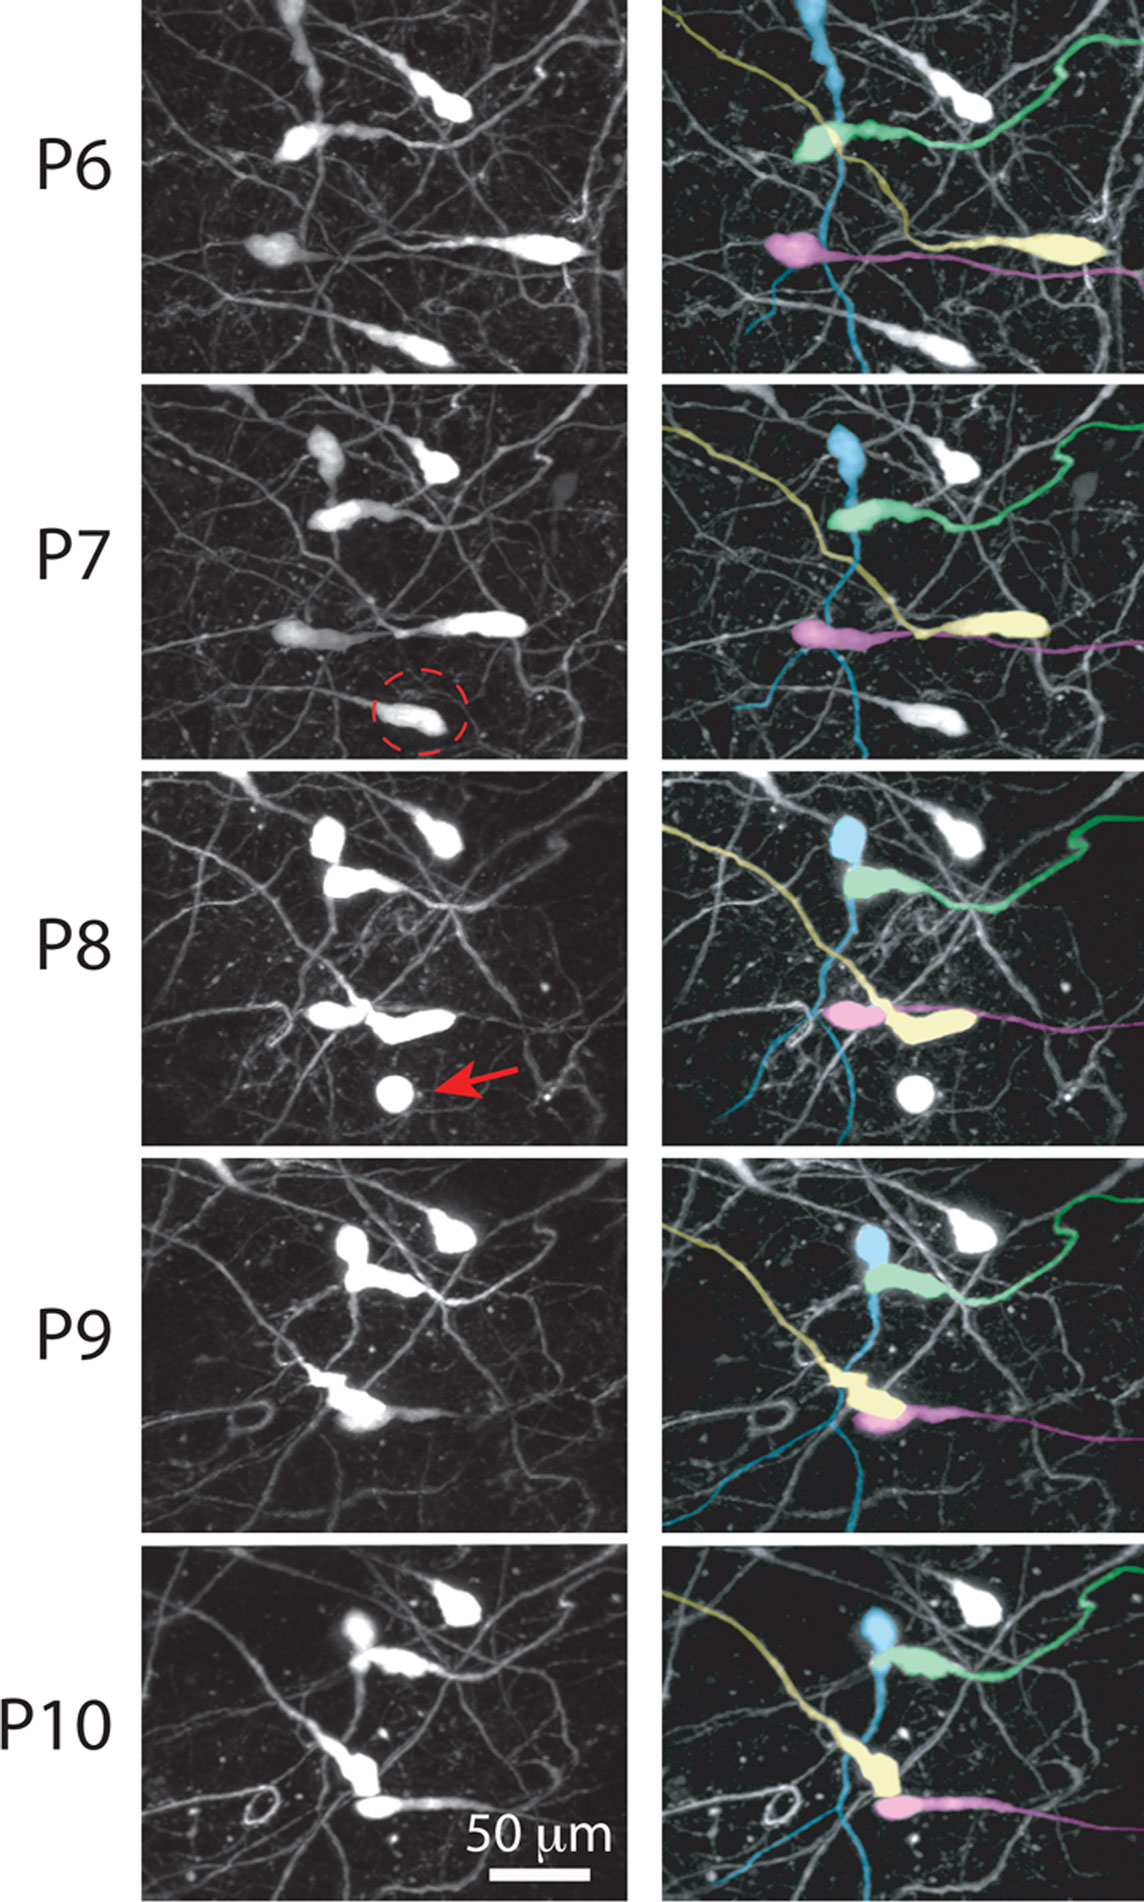
Figure 7. Retraction of CR neuron somata during early postnatal development. Left: in vivo two-photon time-lapse imaging of CR neurons in an Ebf2-GFP mouse from P6 to P10. A neuron at P7 (dashed circle) is seen undergoing apoptosis at P8 (red arrow). Right: same image sequence, in which four individual CR neurons are color-coded, to help visualize the retraction of cell bodies. Some somata (e.g., yellow cell) retract >100 μm.
We used in vivo two-photon microscopy to follow the fate of CR neurons in the postnatal mouse brain. Our study identifies Ebf2-GFP mice as an important tool to study CR neuron lineage and function within the postnatal brain. Most importantly, our data have resolved an important and long-lasting controversy regarding cause of the gradual disappearance of these cells. We find that the overwhelming majority of CR neurons present around the time of birth die by apoptosis during the second postnatal week, and very few (<3%) survive to adulthood. Therefore, the lower density of CR neurons in the adult cortex is not explained by dilution, migration or morphological transformation.
There are several reasons why we believe that cell migration or downregulation of the Ebf2 promoter cannot explain the disappearance of CR neurons. First, we provide, for the first time, evidence that CR neurons tracked throughout postnatal development eventually die by apoptosis (Figures 5 and 6
). Second, although we observed movement of the cell body of many CR neurons (usually retraction into the proximal dendrite compartment; Figure 7
), migration of entire cells over large distances (i.e., tens or hundreds of micrometer) was never observed. Lastly, we consider it very unlikely that any significant downregulation of Ebf2 occurs, because: (1) CR neurons express GFP up to the point that they die; (2) levels of GFP expression were relatively stable throughout postnatal development, even when CR neurons survived to 2 months of age (Figure 4
); and (3) We do not observe a gradual increase in the number of reelin+/GFP− cells with a CR morphology between P6 and P13, which corresponds to the time of rapid disappearance of Ebf2-expressing CR neurons.
The best understood function of CR neurons is in cortical lamination. The cells secrete reelin (Ogawa et al., 1995
; Rice and Curran, 2001
) to orchestrate neuronal migration in cortical structures in an “inside first – outside last” pattern (Caviness Jr., 1982
). In the last decade, several lines of evidence have demonstrated that some CR neurons survive well beyond the period of cortical lamination (del Rio et al., 1996
; Soda et al., 2003
; Portera-Cailliau et al., 2005
). Here, we provide accurate numbers for the density of CR neurons throughout postnatal development. We also demonstrate that a small percentage of CR neurons survive from P3 into adulthood (Figure 4
), confirming the notion that CR neurons must play additional roles besides their known involvement in neuronal migration. Recent studies showing phenotypic variability (Radnikow et al., 2002
; Soda et al., 2003
) and multiple origins of CR neurons (Bielle et al., 2005
; Garcia-Moreno et al., 2007
) support the hypothesis that these cells could evolve to assume multiple roles throughout cortical development. So far, however, such functions remain a mystery, with few exceptions, such as regulating the identity and function of radial glia (Super et al., 2000
).
It remains somewhat puzzling that, although any cell type could have evolved to secrete reelin and help organize neocortical layers, this role is played by neurons. This suggests that if CR cells have additional functions, they would play such roles as neurons that may influence cortical network activity. Indeed, CR neurons are capable of firing action potentials well into the second postnatal week (Radnikow et al., 2002
; Soda et al., 2003
) and are spontaneously active (Schwartz et al., 1998
; Aguilo et al., 1999
; Soda et al., 2003
). Furthermore, gap junctions exist between CR and pyramidal neurons (Radnikow et al., 2002
) and CR neurons are known to fire synchronously (Soda et al., 2003
). Lastly, we previously demonstrated that axon tips of CR neurons have large growth cones and continue to grow during postnatal development (Portera-Cailliau et al., 2005
). This means that CR neurons are healthy and presumably able to make new synapses well beyond the end of neuronal migration. Together, these data imply that CR neurons could influence network activity in ensembles of pyramidal neurons through both chemical and electrical synapses. In rodent neocortex, the second postnatal week when CR neurons disappear corresponds to a time of rapid synaptogenesis, during which the number of synapses rises rapidly (Micheva and Beaulieu, 1996
). Intriguingly, this developmental period also coincides with a time when the activity of pyramidal neurons undergoes a dramatic desynchronization (Golshani et al., 2009
; Rochefort et al., 2009
). Because the main synaptic target of CR axons is the terminal dendritic tufts of all pyramidal neurons in the neocortex, it is possible that CR neurons might also regulate synaptogenesis, the complexity of dendritic arbors of pyramidal neurons, or the decorrelation of neocortical network activity.
It is important to note that reelin is not an ideal marker of CR neurons because, although all CR neurons express reelin, reelin is also expressed in many other cortical cells, not just in L1 (Alcantara et al., 1998
; Meyer et al., 1998
). In that sense, the identification of a mouse line that expresses GFP in all postnatal CR neurons is noteworthy, as future studies using these mice (e.g., gene expression profiling) may help to determine whether a subset of CR cells manifest important roles as functional neurons integrated in neocortical circuits. This mouse line may also help resolve the ongoing debate regarding the origin of these cells. Whether Ebf2 is a marker of only a subset of CR neurons during embryonic development will await future lineage studies. Given the evidence that links CR neurons and reelin to schizophrenia, epilepsy, bipolar disorder and lissencephaly (Hong et al., 2000
; Fatemi, 2001
; Costa et al., 2002
), these efforts may eventually shed light into the mechanisms of these devastating neuropsychiatric disorders.
Carlos Portera Cailliau conceived the project and designed the experiments. Tara G. Chowdhury, Jessica C. Jimenez, Jamee M. Bomar, Alberto Cruz-Martin, Jeffrey P. Cantle and Carlos Portera-Cailliau performed the experiments. Tara G. Chowdhury, Jessica C. Jimenez, Jamee M. Bomar, and Carlos Portera-Cailliau analyzed the data. Carlos Portera-Cailliau made the figures and wrote the manuscript. All authors contributed to editing the manuscript.
The authors declare that the research was conducted in the absence of any commercial or financial relationships that could be construed as a potential conflict of interest.
We thank Dr. Amaya Miquelajauregui Graf for valuable comments on the manuscript, James Anstey for help with immunohistochemistry, and members of the Portera-Cailliau laboratory for helpful discussions. This work was supported by grants from the NIH/NICHD, NIH-MARC, and the March of Dimes Foundation, and by the generous support of the Fu-Hsing and Jyu-Yuan Chen Family Foundation.
Holtmaat, A., Bonhoeffer, T., Chow, D. K., Chuckowree, J., De Paola, V., Hofer, S. B., Hubener, M., Keck, T., Knott, G., Lee, W. C., Mostany, R., Mrsic-Flogel, T. D., Nedivi, E., Portera-Cailliau, C., Svoboda, K., Trachtenberg, J. T., and Wilbrecht, L. (2009). Long-term, high-resolution imaging in the mouse neocortex through a chronic cranial window. Nat. Protoc. 4, 1128–1144.
Holtmaat, A. G. D., Wilbrecht, L., Karpova, A., Portera-Cailliau, C., Burbach, B., Trachtenberg, J. T., and Svoboda, K. (2005). Long-term high-resolution imaging of neurons in the neocortex in vivo. In Imaging in Neuroscience and Development: A Laboratory Manual, R. Yuste and A. Konnerth, eds (Cold Spring Harbor, NY, Cold Spring Harbor Laboratory Press), pp. 627–638.