


- 1 Dominick P. Purpura Department of Neuroscience, Albert Einstein College of Medicine, USA
- 2 Departments of Neurology and Pathology (Neuropathology), Albert Einstein College of Medicine, USA
Adoptive transfer experimental autoimmune encephalomyelitis (AT-EAE) is an inflammatory demyelination that recapitulates in mouse spinal cord (SC) the human multiple sclerosis disease. We now analyze previously reported cDNA array data from age-matched young female adult control and passively myelin antigen-sensitized EAE mice with regard to organizational principles of the SC transcriptome in autoimmune demyelination. Although AT-EAE had a large impact on immune response genes, broader functional and chromosomal gene cohorts were neither significantly regulated nor showed significant changes in expression coordination. However, overall transcriptional control was increased in AT-EAE and the proportions of transcript abundances were perturbed within each cohort. Striking likenesses and oppositions were identified in the coordination profiles of genes related to myelination, calcium signaling, and inflammatory response in controls that were substantially altered in AT-EAE. We propose that up- or down-regulation of genes linked to those targeted by the disease could potentially compensate for the pathological transcriptomic changes.
Introduction
Experimental autoimmune encephalomyelitis (EAE), a well-established animal model that recapitulates many clinical and pathophysiological aspects of multiple sclerosis (MS, Baranzini et al., 2005 ) is a T-cell-mediated inflammatory demyelinating disease of the central nervous system (CNS). Like MS, EAE is physiologically characterized by disturbed axonal conduction leading to motor and sensory impairment. Pathological findings in both MS and EAE include infiltration of activated peripheral inflammatory cells into the CNS, loss of myelin and oligodendrocytes, edema, and axonal damage. Astrocytic hypertrophy and astrogliotic scarring are also prominent features of both MS and EAE, and these changes in astrocytes may contribute to conditions that lead to lasting axonal damage, oligodendrocytic loss, and insufficient or absent remyelination. Adoptive transfer (AT-) EAE is induced by injecting myelin antigen-sensitized T-cells obtained from previously immunized syngeneic donor animals. Although more laborious, this form of EAE has a highly synchronous onset and disease course (Mokhtarian et al., 1984 ; Pitt et al., 2000 ). In AT-EAE, myelin basic protein reactive T-cells initiate an immune attack against CNS myelin, characterized by cytokine production and cell death.
There is a rich literature regarding gene expression changes both during normal development and differentiation of myelinating cells (e.g., D'Antonio et al., 2006 ; Garbay et al., 1998 ; Gokhan et al., 2005 ; Jiang et al., 2005 ) and also the changes that occur acutely (within a day), delayed (within a week), and chronically (several weeks and longer thereafter) following spinal cord (SC) injury (e.g., Carmel et al., 2001 ; Di Giovanni et al., 2003 , see also comprehensive overview in Bareyre and Schwab, 2003 ). Genomic effects of SC injury have also been compared with other conditions related to CNS demyelinating disease such as MS (e.g., Lock et al., 2002 ; Lock and Heller, 2003 ) and mouse-EAE (e.g., Matejuk et al., 2003 ; Xu et al., 2003 ). Moreover, several studies have shown altered expression of genes responsible for myelination in a variety of CNS pathologies (e.g., Haroutunian et al., 2007 ; Kumar et al., 2006 ).
This report extends the analysis of our previously published cDNA microarray study (Brand-Schieber et al., 2005 ) in which we compared the transcriptomes of SC from female syngeneic, age-matched control and AT-EAE SJL∕J mice at the peak of clinical disability (clinical index 4 = hind- and front-limb paralysis). The disease was induced by injecting MBP-primed immune cells into syngeneic recipients. We reported that, compared to healthy controls, SC of AT-EAE mice at the peak of disability displayed axonal dystrophy, extensive infiltration of the lumbar ventral white matter with CD11β-immunoreactive monocytes, and a threefold decrease in mRNA encoding the gap junction protein connexin43 (Gja1, connexin43, Cx43).
A subset of 3776 distinct genes with known protein products whose expression levels were adequately quantified in all arrays and averaged for all quantifiable spots probing the same gene, was selected for further analysis reported in this paper. In order to test the hypothesis that coordinated expression with Cx43 might account for some of the observed altered patterns of gene expression, we have compared the coordination profile of Gja1 to those of the immune response and myelination genes.
Materials and Methods
Data set
Briefly, 60 µg total RNA, extracted in trizol from each set of two SC of control (C) and AT-EAE (E) mice was reverse transcribed into cDNA using fluorescent dUTPs [Cy3-dUTP (green, g) or Cy5-dUTP (red, r)]. The labeled cDNAs were hybridized overnight at 50°C with four 27 k cDNA microarrays produced by the Microarray Facility of the Albert Einstein College of Medicine (http://129.98.70.229/ ) in the combinations: C1(r)C2(g), C3(r)C4(g), E1(r)E2(g), E3(r)E4(g) (“multiple yellow” strategy, see Iacobas et al., 2006a ). The images were acquired and primarily analyzed with GenePix™ Pro 4.1 software (http://www.axon.com/ ) then normalized according to our in-house developed algorithm. The input data for subsequent analyses were the ratios between the normalized net red∕green fluorescence of that spot and the average total net red∕green fluorescence of all valid spots in the slide.
The microarray study was performed according to the standards of the Microarray Gene Expression Data Society (MGED) and data complying with the “Minimum Information About Microarray Experiments” (MIAME, Brazma et al., 2001 ) have been deposited in the National Center for Biotechnology Information Gene Expression Omnibus database (http://www.ncbi.nlm.nih.gov/geo ) as series GSE2446.
Detection of significant regulation
We considered a gene as significantly regulated in AT-EAE SC compared to control if the absolute fold change >1.5× and the p-value of the heteroscedastic t-test (two-sample unequal variance) applied to the means of the background subtracted normalized fluorescence values in the four biological replicas of the compared transcriptomes was <0.05. Following previously published procedures (Iacobas et al., 2007a ; Iacobas et al., 2007b ), we have also tested whether large groups of genes sharing same chromosomal location or encoding functionally similar proteins (hereafter termed cohorts) exhibit specific interactions that might regulate and∕or perturb the cohort expression profile. Thus, a gene cohort was considered as significantly regulated if the average expression level of the composing genes was changed by factor larger than 1.5 and the p-value with the Bonferroni adjustment applied to multiple comparisons (Draghici, 2003 ; Iacobas et al., 2005a ; Stekel, 2003 ) was less than 0.05. The expression of a gene cohort was considered as significantly perturbed if the standard deviation of the fold changes within that group exceeded 1.5. High standard deviation is interpreted as indicating that the proportions of transcript abundances within the cohort were considerably altered, thereby potentially introducing “bottlenecks” in pathway dynamics by perturbed transcriptomic “stoichiometry” (Iacobas et al., 2007a ; Iacobas et al., 2007b ) which may also change the probability distribution of their outcomes. As in previous papers (Iacobas et al., 2005a ; Iacobas et al., 2007a ; Iacobas et al., 2007b ), the genes were again classified in the following functional cohorts: CSD, Cell cycle, shape, differentiation, death; CYT, cytoskeleton; ENE, energy metabolism; JAE, cell junction, adhesion, extracellular matrix; RNA, RNA processing; SIG, cell signaling; TIC, transport of small molecules and ions into or out of the cells; TRA, transcription; TWC, transport of ions∕molecules within the cells; UNK, function not yet assigned.
Variability of transcript abundance and TRA control
The relative estimated (TRA) variability (REV) and the gene expression stability (GES) of both control and experimental specimens were computed as previously described (Iacobas et al., 2003 ). Since basic transcriptional mechanisms are expected to be similar in a homogeneous set of mice, whereas the local conditions may differ from mouse to mouse, lower REV values are interpreted as indicating lower sensitivity to the local conditions, most probably resulting from increased TRA control, while higher REV values indicate reduced TRA control. Therefore, GES scores reveal the priorities of control over the transcript abundance, with GES = 100 indicating the most stably expressed gene (highest priority in transcript abundance control) and GES = (100∕number of quantified genes) the least controlled gene. We organized a database containing the REV and GES values in both conditions and identified the genes for which the system preserved or significantly changed the priorities of TRA control in AT-EAE mice. Both analyses of expression variability and TRA control were extended to the cohorts of genes to test whether the average variability of the cohort was significantly changed in AT-EAE, and whether patterns of hierarchy in expression control among cohorts (significantly different average GES values) were altered in AT-EAE.
TRA coordination
In order to gain insight into whether expression of individual genes is linked to each other so that the protein amounts would respect the “stoichiometry” of the biochemical reactions, we performed analysis of TRA coordination using the pair-wise Pearson correlation coefficient between sets of expression levels in biological replicas (procedure in Iacobas et al., 2005a ) of both individual genes and gene cohorts to detect specific interactions that may be responsible for perturbation of functional pathways induced by the AT-EAE. At 5% statistical significance, two genes were considered as synergistically expressed if the Pearson correlation coefficient ρij > 0.9 , antagonistically expressed if ρij > −0.9, and independently expressed if |ρij| > 0.05. For each gene, we determined the synergome, antagome, and exclusome (i.e., sets of synergistically, antagonistically, or independently expressed partners of a given gene), as well as the coordination profile (i.e., the set of the correlation coefficients between expression levels of that gene and each other gene in the biological replicas). Together, the synergome and the antagome of a gene forms its expressome. From the point of view that genes whose protein products work together in functional pathways should be coordinately expressed (Iacobas et al., 2007b ), the expressome of a gene indicates the extent of the transcriptomic network related to that gene, while its exclusome indicates the delimitations of this network with respect to other networks. Finally, we compared the coordination profiles of selected genes by computing their overlap (OVL), an indicator ranging from −100 to 100% (Iacobas et al., 2007b ), with high positive values indicating likeness, high negative values opposition, and values close to zero indicating neutrality of the coordination profiles. We termed the gene pairs with OVL > 80 or OVL < −80 as “see-saw” partners (Iacobas et al., 2007a ).
Results
Expression regulation
As previously reported (Brand-Schieber et al., 2005 ), we found 1433 regulated genes, encompassing all functional classes and located on all chromosomes, thereby indicating a high degree of complexity of the transcriptomic alterations induced by AT-EAE. Affected pathways were identified using GenMapp and MappFinder database searches (http://www.genemapp.org/ ; Dahlquist et al., 2002 ; Doniger et al., 2003 ). High up-regulated genes were associated with immune and defense response, moderate up-regulated genes were associated with the proinflammatory response, antigen presentation and processing, immune cell migration, and endosome transport. Low (but still significant) up-regulation included genes related to cholesterol metabolism and cytokine biosynthesis. As antigen presentation and cytokine biosynthesis are components of the immune response, our analysis reveals that these related pathways are up-regulated to a major extent in EAE. Most prominently down-regulated GO categories included heterochromatin, acid phosphatase, cytoplasm organization and biogenesis, mitochondrial inner membrane presequence translocase, regulation of coagulation and chemokine, and cytokine-mediated signaling (zinc finger CCCH-type containing 15, Zc3h15 and suppressor of cytokine signaling 5, Socs5).
We found that no single cohort of genes (open bars in Figures 1 A and 1 B) with regard to chromosomal location or function of the encoded protein was entirely regulated unidirectionally, up- and down-regulations of individual genes being roughly balanced within each cohort. An example is shown in Figure 1 C for part of the subcategory JAE. However, this balance did not extend to the subcohorts: for example, the expression levels of 54 of 56 significantly regulated genes (96%) related to immune response (part of the JAE cohort, see Table 1 ) showed significant increases, with histocompatibility 2 class II antigen A alpha (H2-Aa) exhibiting the highest fold change (26.4×).
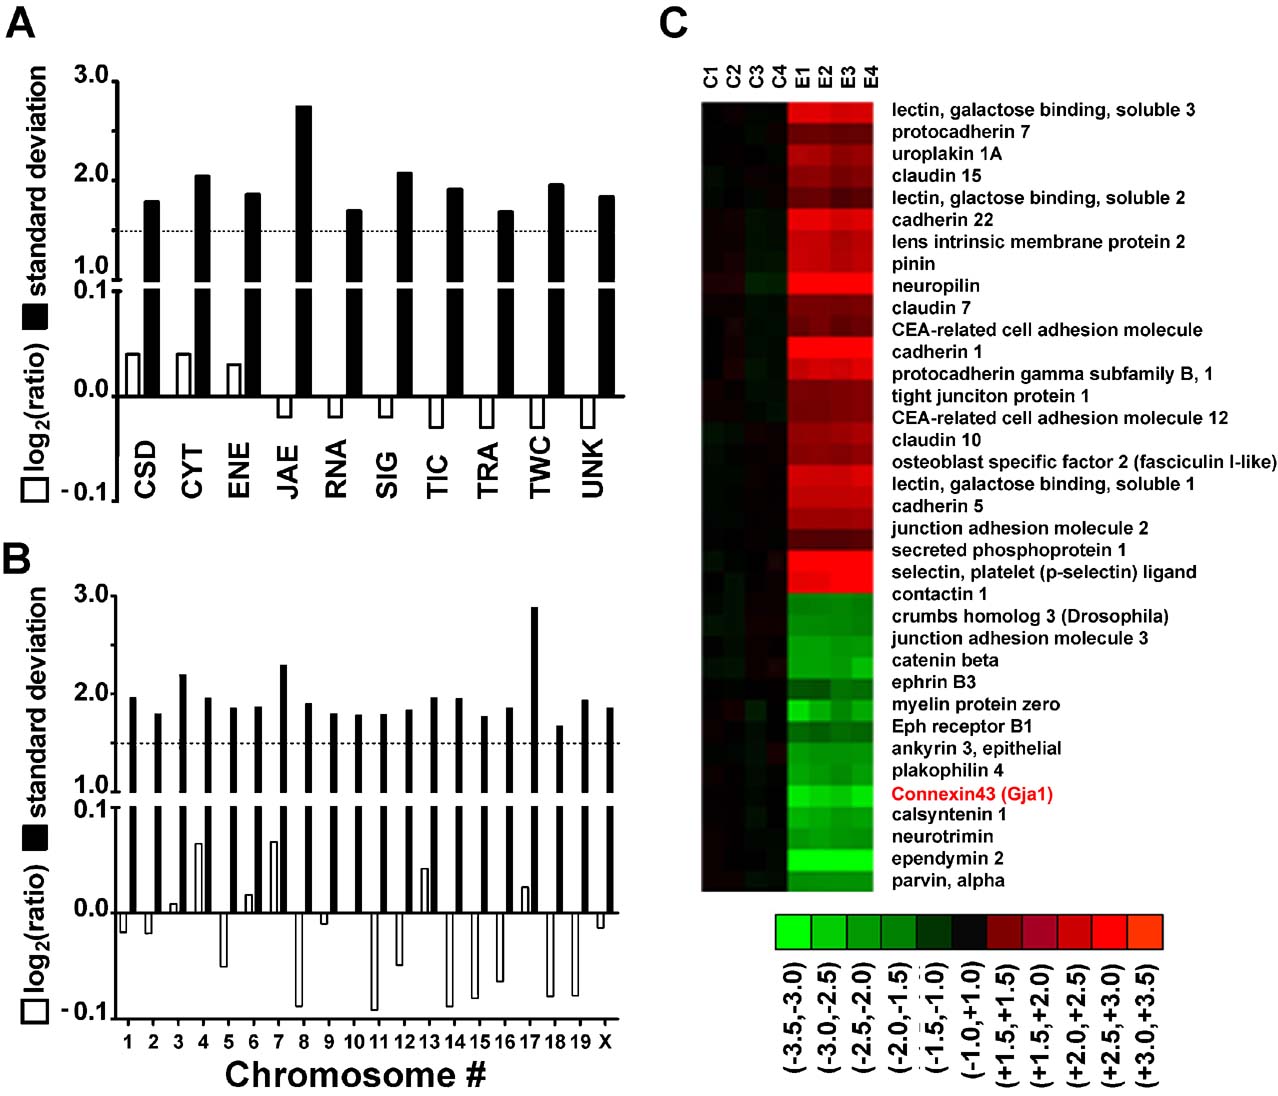
Figure 1. Expression regulation of gene cohorts in AT-EAE mouse spinal cord. A–B. Log2ratios (negative for down-regulation) and standard deviation of expression ratios of gene cohorts sharing the same molecular function (A) or chromosomal location (B). Note that while the average fold change was less than 1.5 for all cohorts, the standard deviation of the fold change exceeded 1.5. Highest standard deviations were obtained for JAE genes and for those located on chromosome 17. (C) Heatmap of the regulated JAE-J genes. C1–C4 = logratios in the four controls, E1–E4 = logratios in the four AT-EAE mice. All logratios were computed with respect to the average expression level in control mice. Red∕green∕black color indicates up∕down∕no regulation in the respective set. Note both the reproducibility (green, red, or black color for all four sets of the same condition) and the variability (non-uniform nuance of the color) of the gene expression patterns among the animals of the same condition.
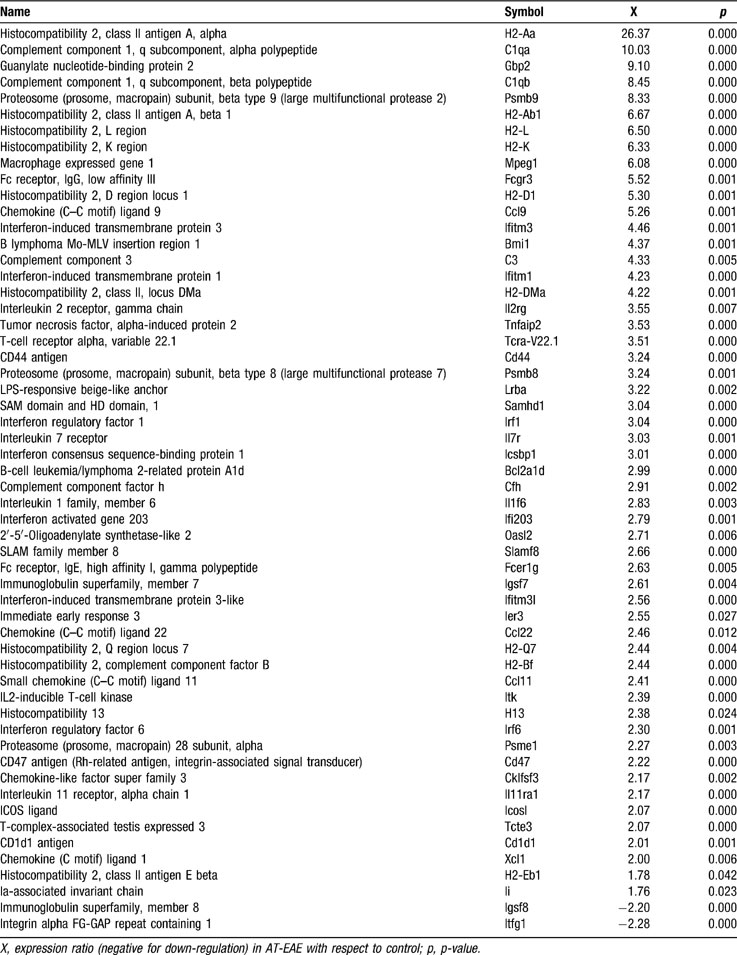
Table 1. Regulation of immune response genes in AT-EAE spinal cord.
Similarity of the regulomes of AT-EAE SC and Cx43 null brain
Since Cx43 was down-regulated in AT-EAE SC by about threefold, we checked whether this alteration of Cx43 expression had similar effects on other genes as observed in Cx43 null brain (Iacobas et al., 2005a ), where significantly regulated genes were also located on all chromosomes and encoded proteins of all major functional categories, extending beyond those that might be expected to depend on junctional communication. Indeed, we found substantial OVL between the regulomes of AT-EAE SC and that of Cx43 null brain with respect to their controls (part of which are listed in Table 2 ), with 84% of the 585 significantly altered genes in both samples exhibiting the same type of regulation.
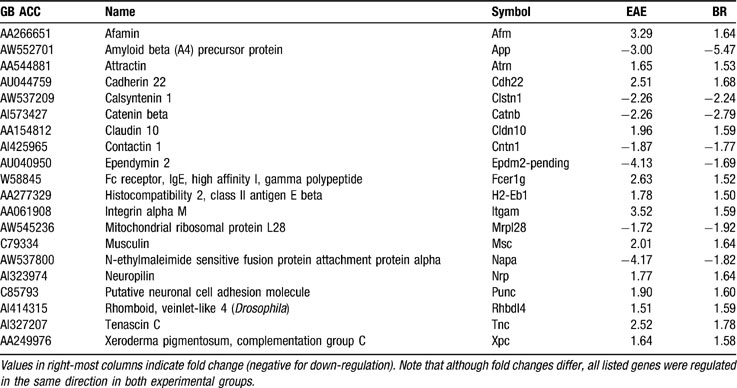
Table 2. Representative examples of significantly regulated JAE genes in EAE spinal cord (EAE) and in Cx43 null brain (BR).
Regulation of expression variability
Figure 1 C illustrates the variability of gene expression among animals of the same condition (note the non-uniform color nuances in the heatmap representation). We found that the overall TRA variability increased from 42.5% in the control mice to 49.7% in the AT-EAE mice, indicating a significant (p < 0.0001) loss of the overall TRA control in the diseased mice. This observation of overall increased variability in EAE mice compared to controls was robust for all functional cohorts (Figure 2 A) and all chromosomal locations (Figure 2 B) with a slight bias toward CYT genes, perhaps reflecting the ongoing alterations in the tissue of these animals. However, both control and EAE specimens had uniform control stringencies among functional categories (Figure 2 C) and chromosomal locations (not shown) as indicated by the roughly uniform distributions of the GES scores.
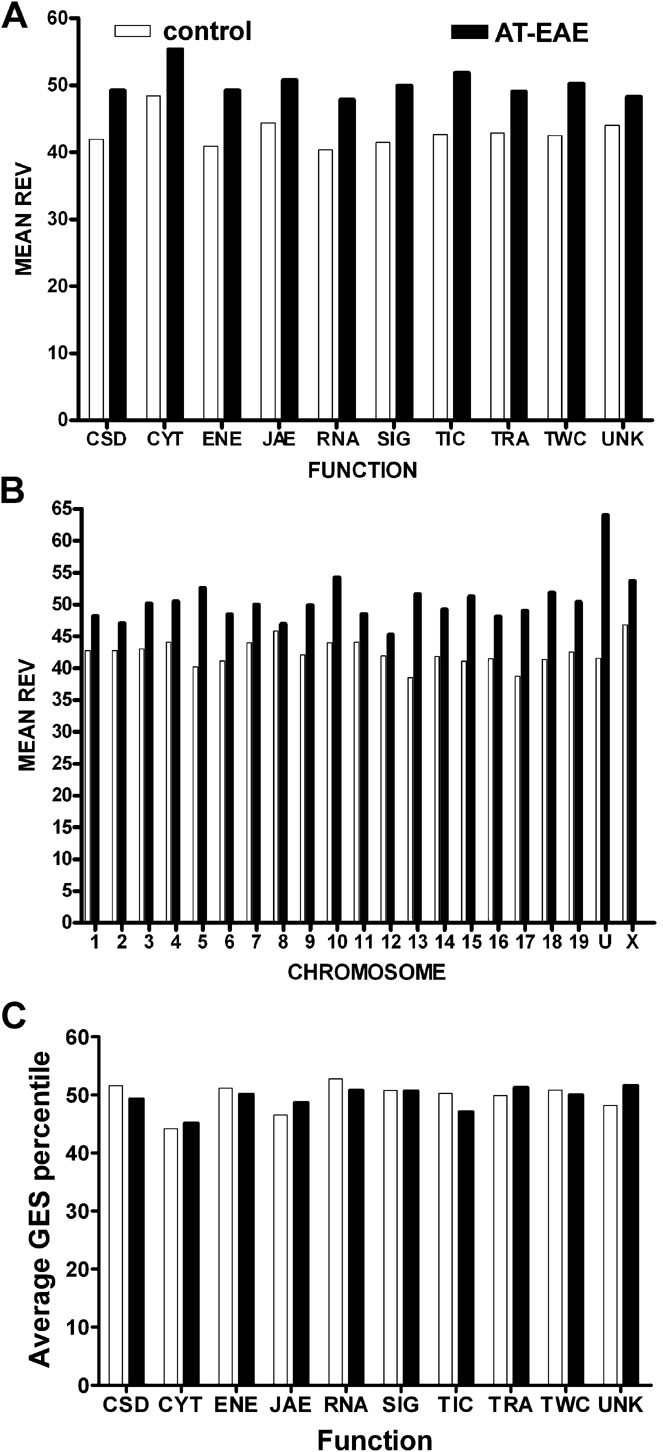
Figure 2. Regulation of the mean relative expression variability (REV) of gene cohorts sharing the same molecular function (A) or chromosomal location (B) in spinal cords of AT-EAE mice compared to control mice. (C) Average gene expression stability (GES) of functional gene cohorts. Note the uniformity of the two REV distributions both among functional classes: REV(C) = (42.9 ± 2.3)%, REV(E) = (50.2 ± 2.3)% and among chromosomes: REV(C) = (42.5 ± 2.1)%, REV(E) = (49.7 ± 2.3)% and that all functional and chromosomal cohorts became less stably expressed (higher REV) in AT-EAE mice, with the highest increments in the transport into cell (23.8%) and chromosome 13 (34.1%). Cytoskeleton genes were the most unstably expressed in both conditions. Observe the quasi-uniform distribution of GES values among functional categories for both control and AT-EAE specimens.
Table 3 presents examples of very stably and very unstably expressed genes in the control mice that significantly preserved or changed their stability classes in AT-EAE mice.
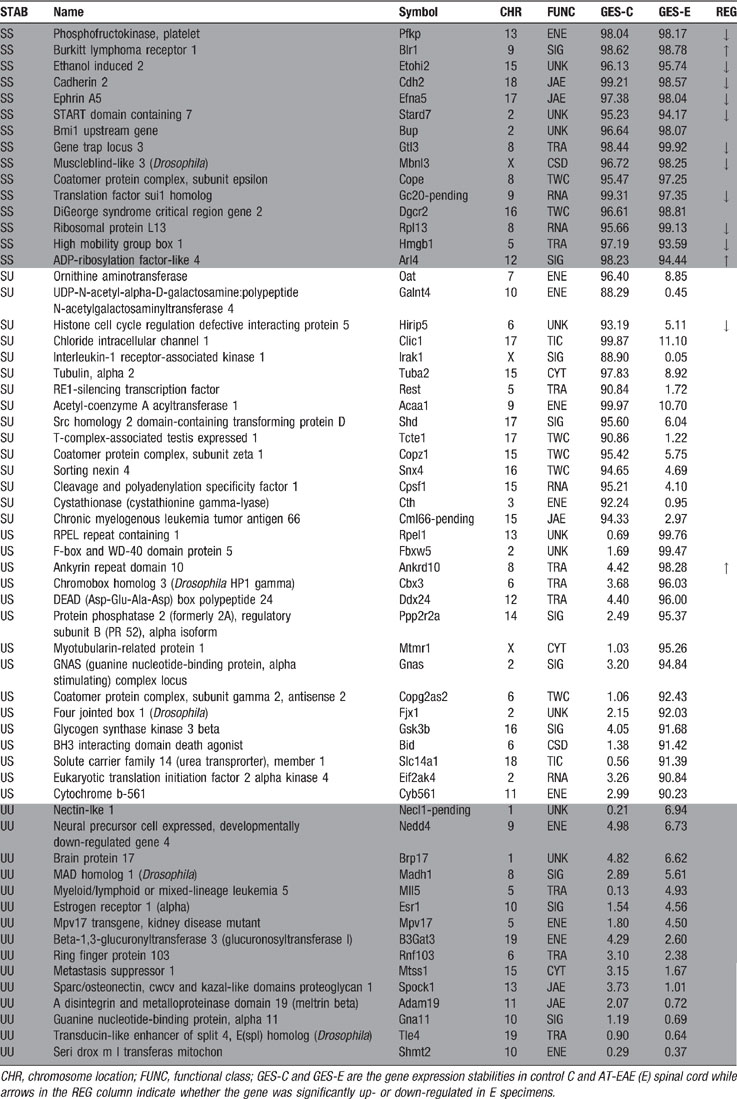
Table 3. Examples of genes that conserved (SS and UU in STAB column) or significantly changed (SU and US in STAB column) their stability or instability in AT-EAE spinal cord with respect to controals.
TRA coordination
The average gene in control SC was found to be synergistically expressed with 467 genes (i.e., 12.4% of 3776), antagonistically expressed with 401 (10.6 %), and independently expressed with 231 (6.1%). As illustrated in Figure 3 A, these numbers were not significantly altered in the AT-EAE mice: average synergome size = 436 (11.5%), antagome = 397 (10.6%), and exclusome = 241 (6.4%). However, the networks of genes that were connected to one another were markedly altered, as indicated by the lack of correlation between the control and AT-EAE expressomes and exclusomes. In both conditions, we found remarkably bimodal distributions of coordination frequencies (Figure 3 B).
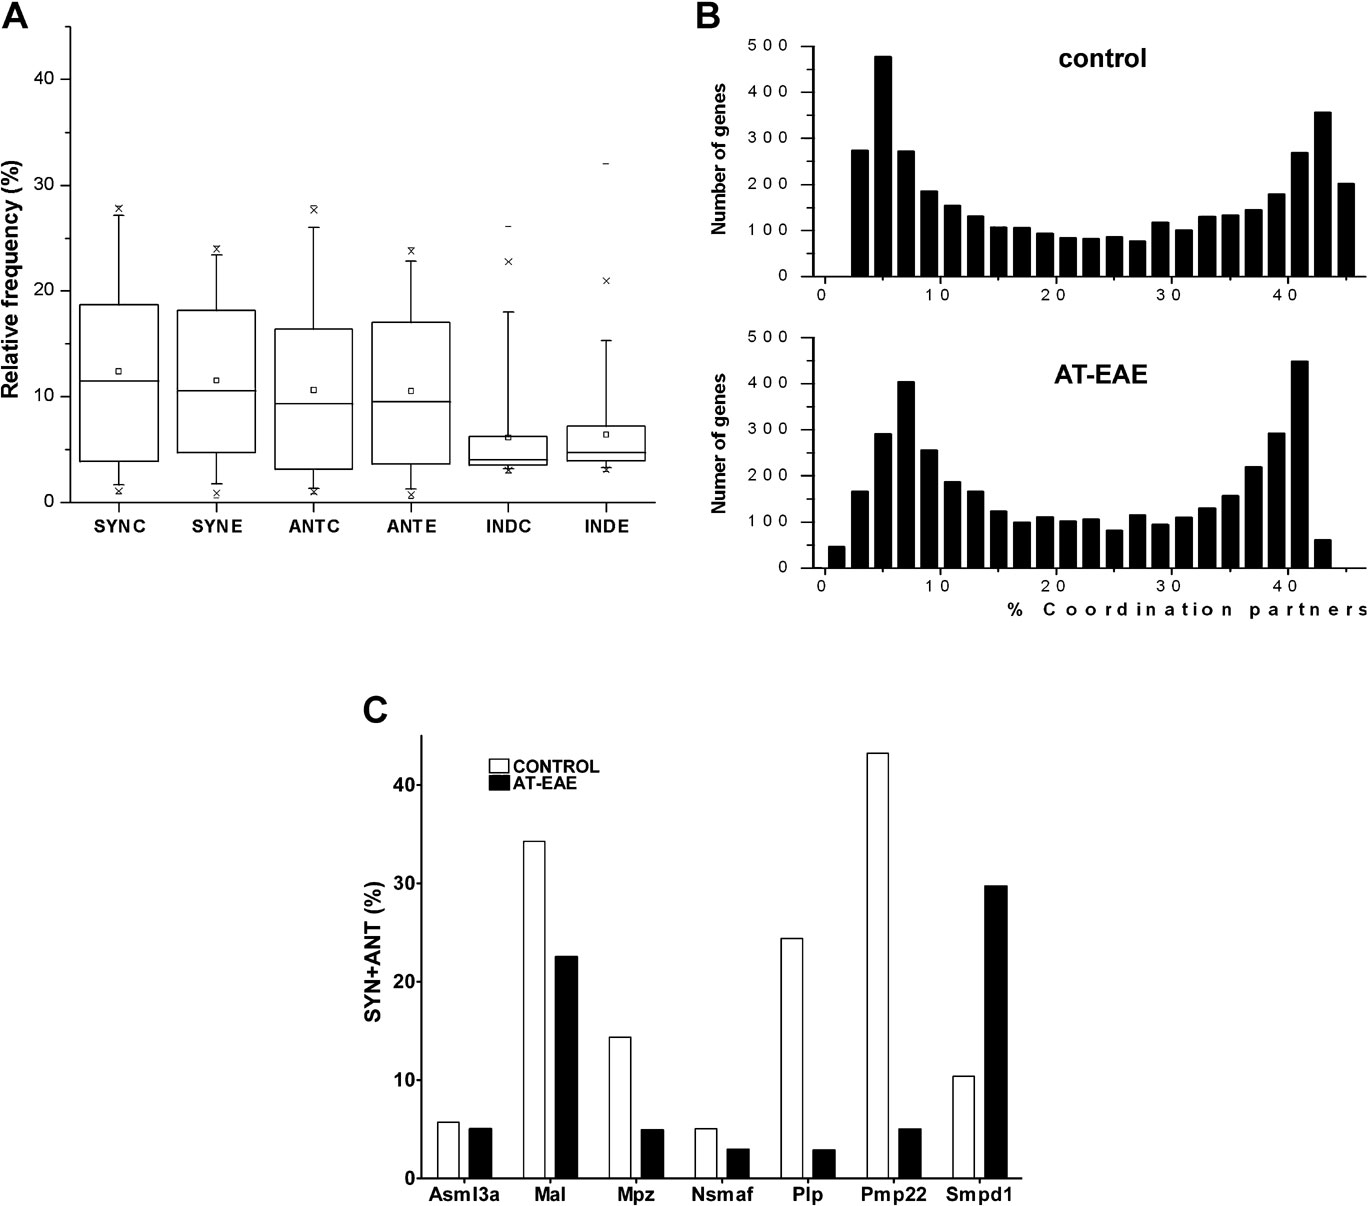
Figure 3. Transcription coordination. (A) The 95% confidence intervals of the percentages of synergistically (Syn), antagonistically (Ant), and independently (Ind) expressed gene pairs in spinal cord of control (C) and AT-EAE (E) mice. Note that the intervals remained practically unchanged in AT-EAE. (B) Histograms of the expression coordinations (SYN + ANT) in control and AT-EAE spinal cord. Note the two modal distributions in both conditions, with two distinct groups of genes: one group in which most genes are coordinately expressed with 4–8% of the other genes and the second group in which most genes are coordinately expressed with 40–44% of the other genes. (C) Examples in which percentages of statistically significant coordination partners of myelination genes differed between control and AT-EAE spinal cords. Chk, choline kinase; Fyn, Fyn proto-oncogene; Hmgcr, 3-hydroxy-3-methylglutaryl-coenzyme A reductase; Mal, myelin and lymphocyte protein T-cell differentiation protein; Mpz, myelin protein zero; Nsmaf, neutral sphingomyelinase activation-associated factor; Pdgfra, platelet derived growth factor receptor alpha polypeptide; Pdgfrb, platelet derived growth factor receptor beta polypeptide; Pdgfrl, platelet-derived growth factor receptor-like; Plp, proteolipid protein; Pmp22, peripheral myelin protein; Qk, quaking; Scd1, stearoyl-coenzyme A desaturase 1; Scd2, stearoyl-coenzyme A desaturase 2; Smpd1, sphingomyelin phosphodiesterase 1 acid lysosomal; Smpdl3a, sphingomyelin phosphodiesterase acid-like 3A.
Some genes exhibited very low numbers of coordinated partners as compared to the average gene; for example, T-complex-associated testis expressed 3 (Tcte3) and P2rx3 have expressomes covering only 2.4 and 2.5% of the sampled transcriptome. In contrast, other genes had large numbers of coordinated partners, such as Spastin (Spast) with an expressome of 45.3% of the transcriptome, and ATP synthase H+ transporting mitochondrial F1 complex gamma polypeptide 1 (Atp5c1), whose expressome encompassed 45.2% of the transcriptome. A large diversity of coordination degrees was found among the genes involved in myelination. Thus, Pmp22 was coordinately expressed with over 43% of the selection, while Nsmaf was coordinated with only 5% of the selection (Figure 3 C).
Although coordination of the average gene was not significantly changed in AT-EAE mice, the coordinations within gene cohorts were markedly affected. Thus, the coordination of 13 out of 16 quantified genes related to myelination decreased significantly, while the coordination of stearoyl-coenzyme A desaturases 1 and 2 (Scd1, Scd2) and sphingomyelin phosphodiesterase 1, acid lysosomal (Smpd1) increased significantly.
When the average coordination degree was computed for gene cohorts, we found rather uniform distributions with regard to chromosomal location and functional categories in control as well as in AT-EAE samples (Figures 4 A–4 D), similar to our findings in brain of the nenatal mouse (Iacobas et al., 2007a ). If both coordination and variability of gene expression reflect control mechanisms to promote transcriptome stability, we might expect that these parameters would be mathematically related. Indeed, we found that the coordination decreased exponentially with the expression control (GES), a robust observation for both conditions (Figures 4 E and 4 F).
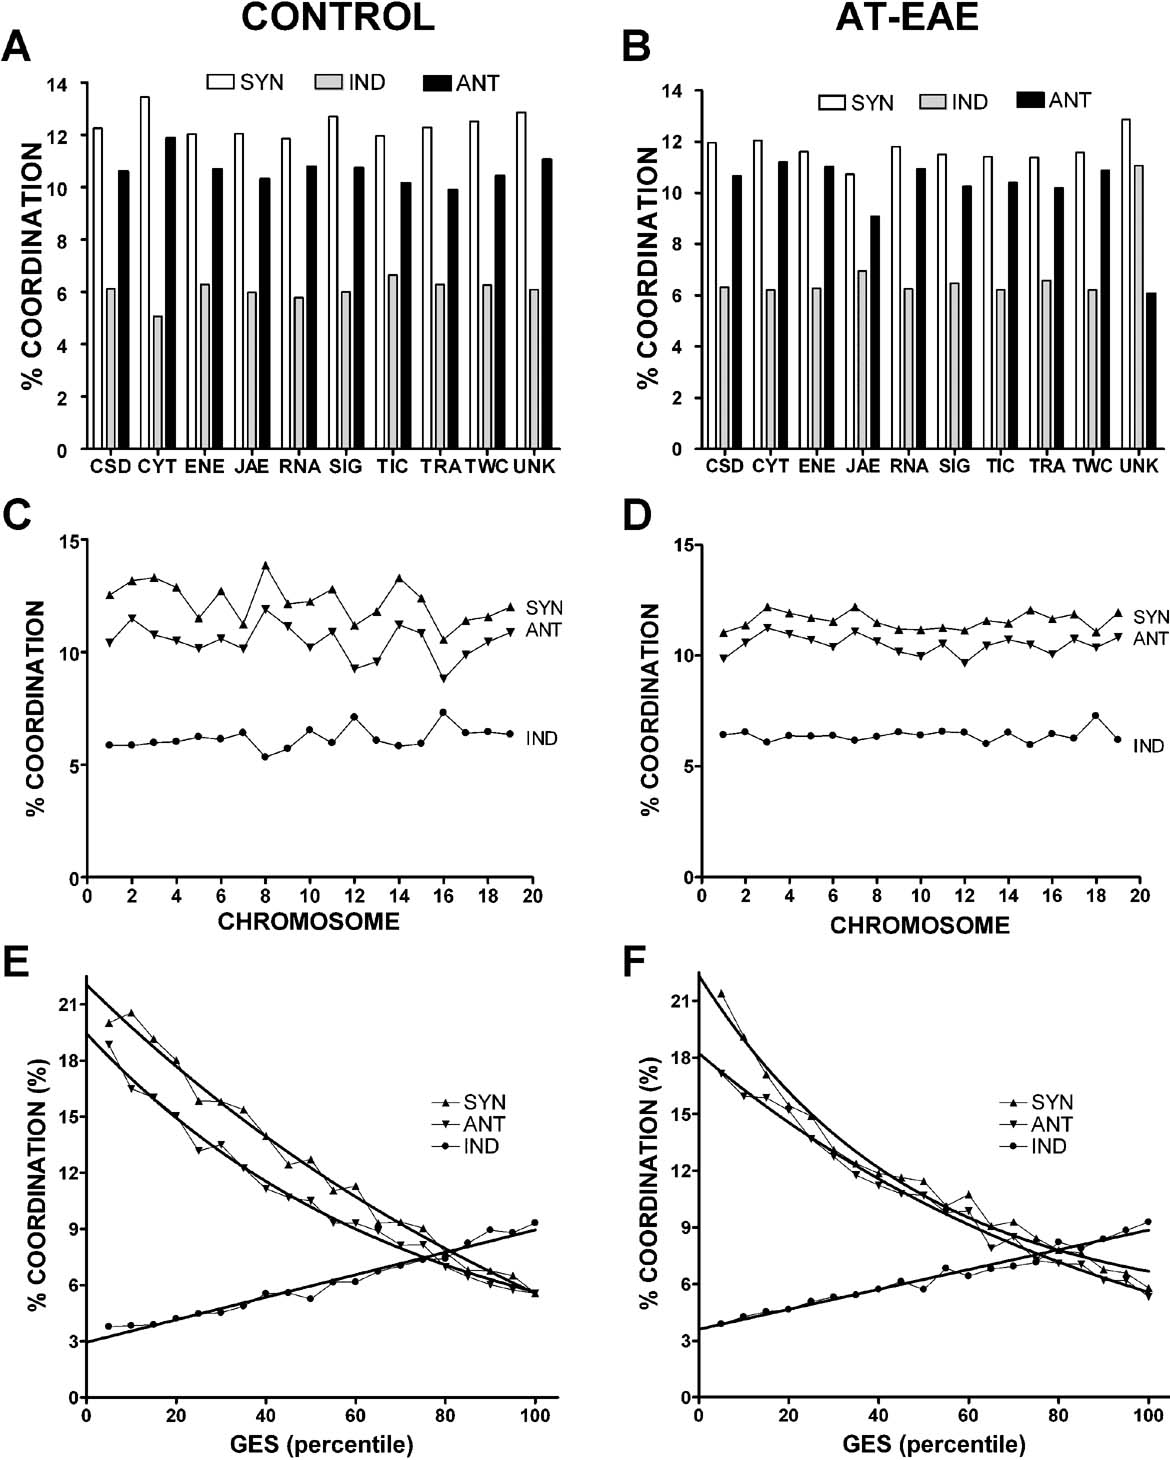
Figure 4. Average percentages of synergistically (Syn), antagonistically (Ant), and independently (Ind) expressed gene pairs in functional categories (A and B), chromosomes (C and D) and GES percentiles for control (A, C, E) and AT-EAE (B, D, F) spinal cords. Note the quasi-uniform distributions of the percentages in functional categories and chromosomal locations in both conditions, the not-significant alteration of the percentages in AT-EAE mice and the inverse exponential relationship between synergistic and antagonistic coordination and expression stability (GES percentile).
Table 4 presents the genes with the largest and the smallest synergomes, antagomes, and exclusomes in control SC and the corresponding values in AT-EAE mice, while Table 5 presents the sizes of the synergomes, antagomes, and exclusomes of the quantified immune response genes in controls.
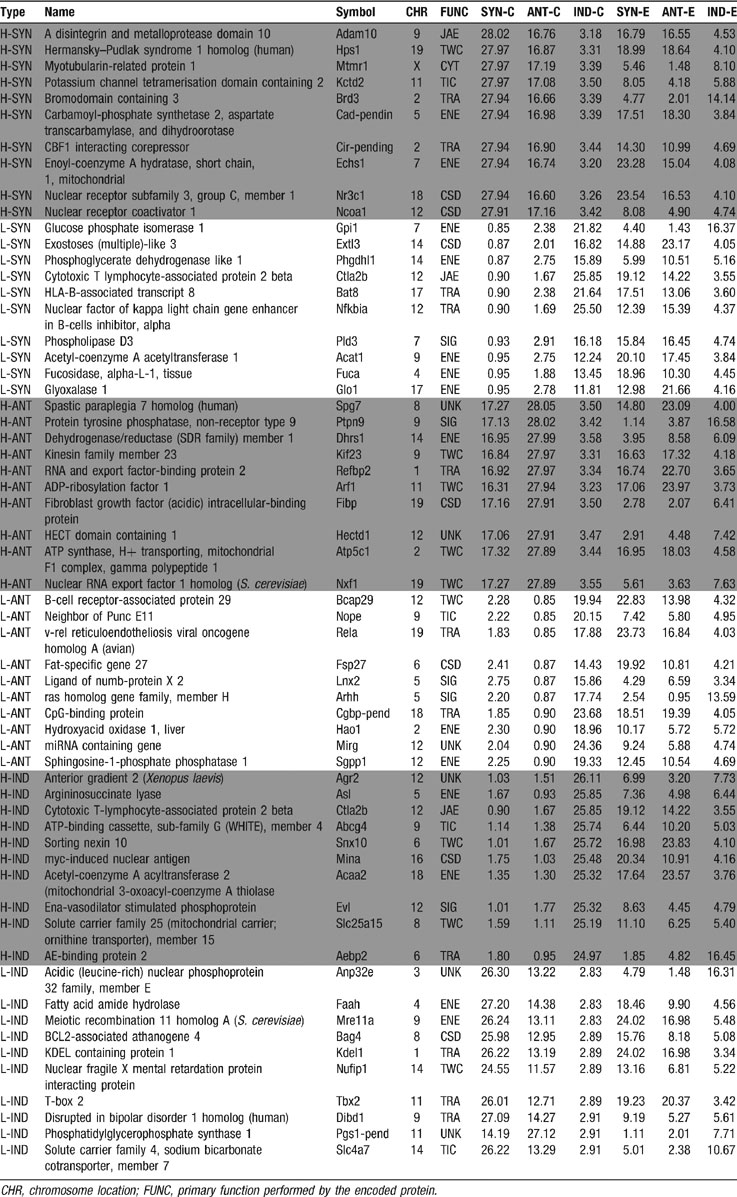
Table 4. Examples of genes with high (H) and low (L) percentages of synergistic (SYN), antagonistic (ANT), and independent (IND) expression partners within the control (c) spinal cord and the corresponding values for AT-EAE (E) mice.
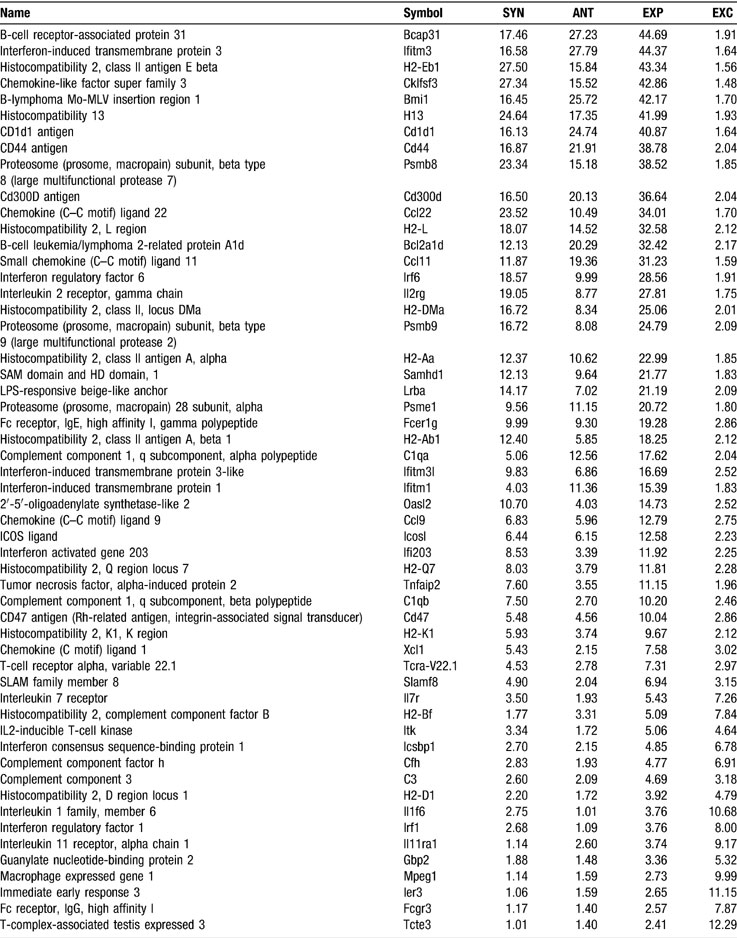
Table 5. The extent of the synergomes (SYN), antagomes (ANT), expresomes (EXP = SYN + ANT), and exclusomes (EXC) of the immune response genes in the control spinal cord.
Table 6 presents examples of genes that preserved or significantly changed the expressome size in AT-EAE SC. Thus, the B-cell receptor-associated protein 31 (Bcap31), that is preferentially associated with the membrane antigen receptor IgD (Adachi et al., 1996 ) maintained its high coordination degree in both conditions, whereas other genes showed substantial alterations in coordinated expression.
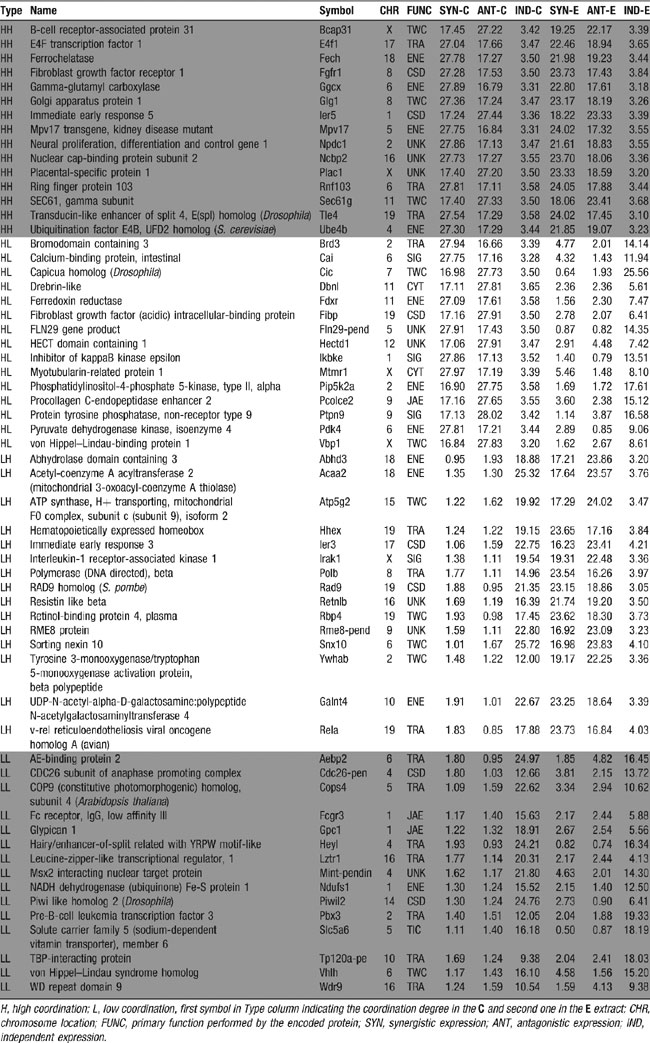
Table 6. Examples of genes that preserved (HH and LL) or significantly changed (HL and LH) the coordination (SYN + ANT) degree in AT-EAE (E) spinal cord as compared to controls (c).
Transcriptomic “see-saws”
We compared the coordination profiles of selected genes involved in immune response, myelination, and calcium signaling by computing their OVL. The rationale for selecting these genes was that EAE is a rodent immune-cell-mediated inflammatory demyelinating disease and that calcium signaling (Iacobas et al., 2006b ) is directly related to myelination (Butt, 2006 ; Fields, 2006 ). Although as expected, the coordination see-saws were exceptions, as most gene pairs exhibited neutral coordination profiles; in all functional categories, we identified genes with striking likeness or opposition, as illustrated for Pmp22 in Figure 5 in controls. Figure 5 illustrates also how the “see-saw” partnership (here of Pmp22) in control SC was altered by disease.
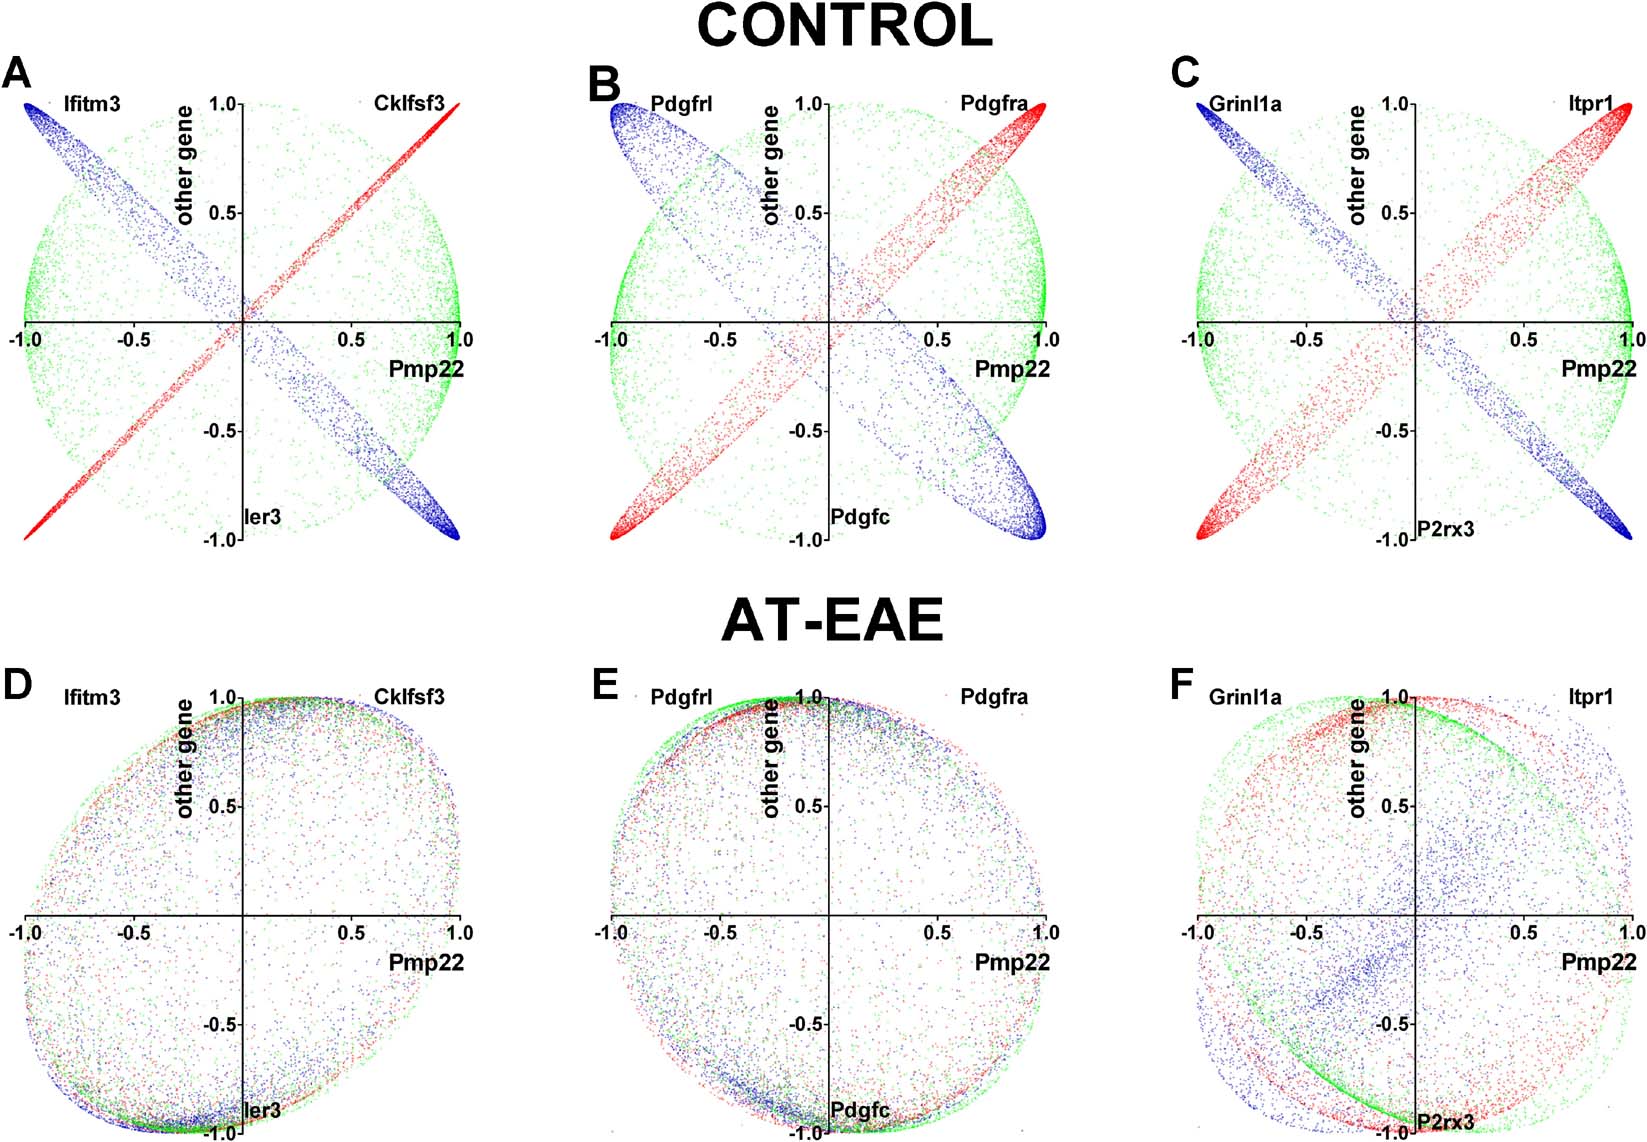
Figure 5. See-saw partners of peripheral myelin protein (Pmp22) in control spinal cord and alteration by AT-EAE. (A and D) Immune response partners. (B and E) Platelet derived growth factors. (C and F) Calcium signaling genes. The correlation coefficients of the indicated genes with each other gene were plotted against those of Pmp22 with each other gene. In controls, red color indicates likeness, green neutrality, and blue opposition. The table presents the overlap (OVL) of the coordination profiles in both conditions. Note that the AT-EAE turned the significant similarity and opposition of the coordination profiles into neutrality. Cklfsf3, chemokine-like factor super family 3; Ifitm3, interferon-induced transmembrane protein 3; Ier3, immediate early response 3; Pdgfra, platelet derived growth factor receptor, alpha polypeptide; Pdfrl, platelet-derived growth factor, receptor-like; Pdgfc, platelet-derived growth factor, C polypeptide; Itpr1, inositol 1,4,5-triphosphate receptor 1; Grinl1a, glutamate receptor, ionotropic, N-methyl D-aspartate-like 1A; P2rx3, purinergic receptor P2X, ligand-gated ion channel, 3. The overlap scores (OVL) of the Pmp22 in the two conditions were:

Table 7 lists the most strikingly similar or opposite see-saw partners within genes responsible for myelination, calcium signaling, and immune response. The pair H2-DMa: Psmb9 (histocompatibility 2, class II, locus DMa: proteosome (prosome, macropain) subunit, beta type 9 (large multifunctional protease 2)) has the highest likeness, while the pair Scd2:Plcl2 (stearoyl-coenzyme A desaturase 2: phospholipase C-like 2) has the highest opposition as coordination profiles. Pmp22 shared with Pdgfra 956 of its 1039 synergistic partners and 561 of its 593 antagonistic partners, and with Itpr1 929 synergistic and 522 antagonistic partners. In addition, 667 synergistic partners of Pmp22 are antagonistic for Pdgfrl and 979 are antagonistic for Grinl1a, while 442 antagonistic partners of Pmp22 are synergistic for Pdgfrl and 557 are synergistic for Grinl1a. The values of the OVL in legend of Figure 5 confirmed the higher similarity and opposition of the coordination profiles of the illustrated genes.
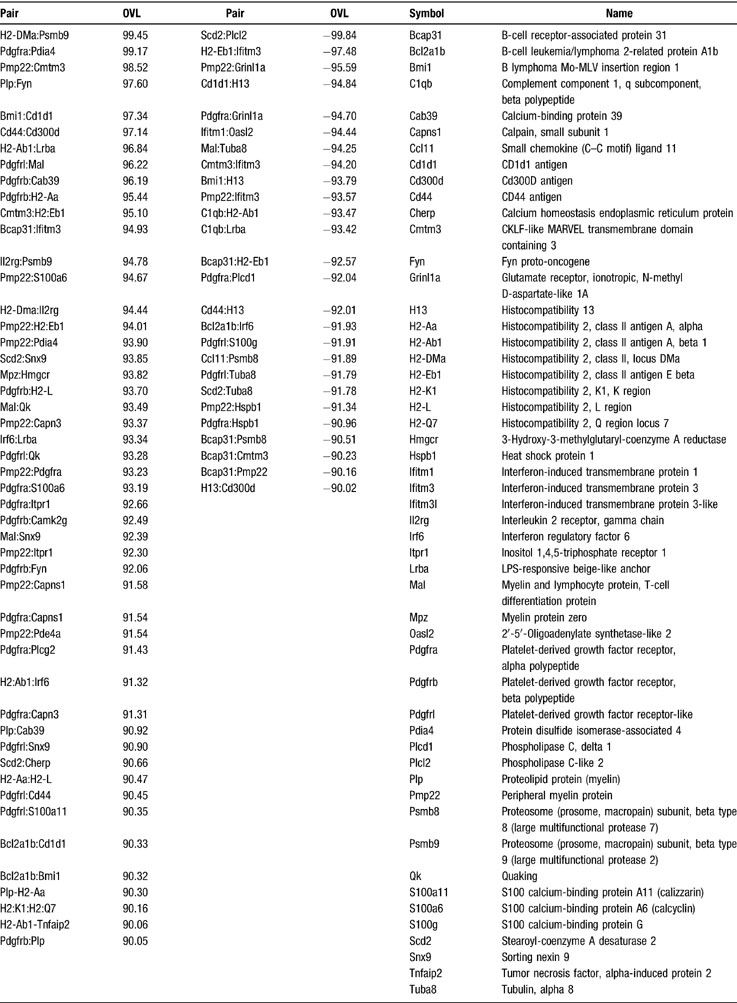
Table 7. The most like (OVL > 90) and opposite (OVL < -90) see-saw partners among genes involved in myelination (MYE), calcium signaling (CAS), and immune response (IRS) in spinal cord of adult control female mice.
Discussion
Confirmation of array data
Our microarray data are in surprisingly high qualitative agreement with those previously obtained by another group on SC of spontaneous EAE mice through the use of Affymetrix arrays (where some regulations were confirmed by qRT-PCR; Matejuk et al., 2003 ). As illustrated in Table 8 , when common hits were compared between data sets, only 2 of 40 genes (granulin and mevalonate diphospho decarboxylase) showed opposite regulation. Even though magnitudes of expression changes varied between these studies, this qualitative OVL is remarkable, given reports of poor correlations between results provided by different microarray platforms even for the same extracts (e.g., Knudtson et al., 2002 ).
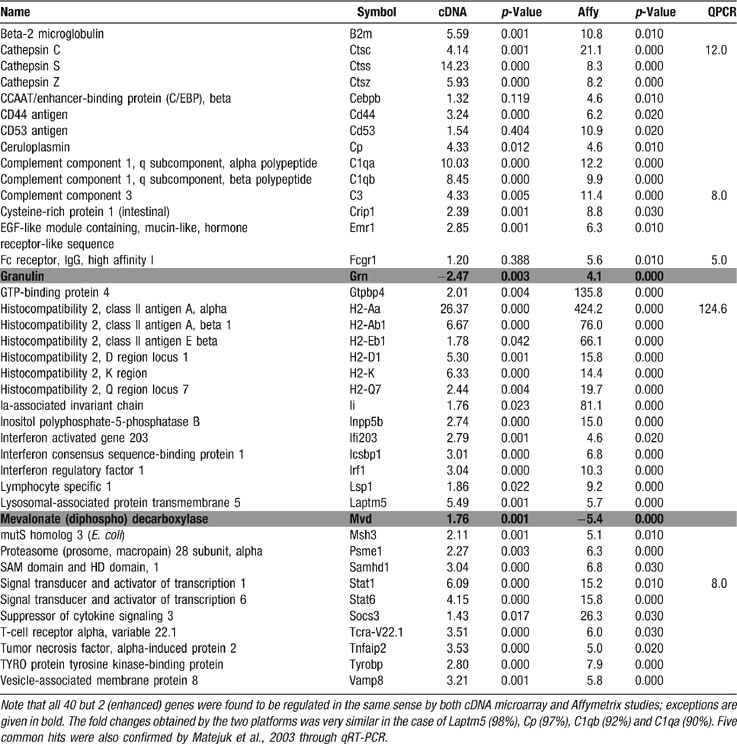
Table 8. Common hits for EAE spinal cord in this study and that by Matejuk et al., (13) obtained through Affymetrix (Affy) and qRT-PCR (QPCR) techniques.
Connexin43 is a key gene of the SC transcriptome
The remarkable OVL between the regulomes of AT-EAE SC and Cx43 null brain indicates that in pathological conditions in which Cx43 is regulated a subset of the altered transcriptome may be attributable to the alteration in Cx43. This finding provides additional support for the hypothesis that Cx43 is a node of gene expression regulation, where its expression is closely tied to that of many other genes (Iacobas et al., 2007a ; Iacobas et al., 2007b ; Spray and Iacobas, 2007 ). Although mechanisms responsible for the regulation of other genes by Cx43 expression remain to be completely understood, they likely include regulation of signal molecule exchange between coupled cells and binding to Cx43 cytoplasmic domains of molecules with TRA factor activity (see Kardami et al., 2007 ).
Gene cohorts were perturbed but not regulated
Cohort analysis of quantified genes has the advantage of providing both manageable and statistically significant ontological information. The expression analysis of gene cohorts is significantly more accurate than that of individual genes due to averaging of technical noise in expression levels of individual genes. In addition, it provides a measure of tendency toward particular patterns of expression. Although we found that no gene cohort was significantly regulated in AT-EAE SC with respect to control (due to a rough balance between up- and down-regulation of individual genes), all cohorts were significantly perturbed, meaning that the disease significantly altered the proportions of transcript abundances within each cohort. Presumably, these “stoichiometric” perturbations contribute to phenotypic alterations that lead to neurological impairment in AT-EAE, including the inflammation, demyelination, axonal damage, and cell death that are associated with infiltration of myelin-specific inflammatory Th1 CD4+ T-cells and, subsequently, activated monocytes into the CNS (Ercolini and Miller, 2006 ). Interestingly, the highest perturbation was that of JAE genes and chromosome 17 due to the up-regulation of all nine histocompatibility 2 genes involved in immune defense response that were quantified (H2-Aa, H2-Ab1, H2-Eb1, H2-Dma, H2-Bf, H2-D1, H2-K, H2-L, H2-Q7), consistent with the inflammatory nature of the disease. Remarkably, mouse chromosome 17 has the largest homology with human chromosome 6p21, the locus containing the major histocompatibility complex known to influence susceptibility to MS (Yeo et al., 2007 ).
AT-EAE SC has a loose control of gene expression
Since AT-EAE represents a massive immunological response resulting in gross tissue changes, we examined whether this condition altered the overall inter-animal gene expression variability as compared to healthy mice, expecting that AT-EAE mice would have greater variability due to differences in disease status or in immune attack. Indeed, although for 44.3% of the studied genes the TRA variability decreased, the overall REV value increased from 42.5% in the control mice to 49.7% in the AT-EAE mice, indicating a significant (p < 0.0001) loss of the overall TRA control in the diseased mice. In addition, the sets of REV values in the two conditions were independent (ρ < 10−23) suggesting that multiple mechanisms may contribute to alter the TRA control stringency of individual genes.
Among the most stably expressed genes in control SC whose expression was not affected by AT-EAE was cadherin 2 (Cdh2), which is required for regulating presynaptic function at glutamatergic synapses (Jungling et al., 2006 ). In contrast, interleukin-1 receptor-associated kinase 1 (Irak1), critical for the induction of EAE as well as for the activation and expansion of autoreactive T-cells (Deng et al., 2003 ), was very stably expressed in control but became very unstably expressed in AT-EAE, in line with the dynamic nature of the inflammatory process in the disease.
AT-EAE remodels the expression coordination network in SC
The coordination analysis revealed complex interlinkages of gene expression in both control and AT-EAE SC and that the pathology not only alters expression of individual genes but also perturbs functional pathways and rearranges transcriptomic interlinkages However, AT-EAE did not change significantly the average extents of the synergomes, antagomes, and exclusomes, in contradiction with what we have observed in Cx43 null brain were the expressome sizes diminished by more than 20% with respect to the wildtype brain (Iacobas et al., 2007a ).
Adam10, the disintegrin and metalloprotease that modulates the cell adhesion role of Pcdh gamma (Reiss et al., 2006 ) displayed the largest synergome (28.0%), while spastic paraplegia 7 homolog (Spg7), encoding a protein involved in anterograde axon cargo transport (Ferreirinha et al., 2004 ), had the largest antagome (28%). Remarkably, peripheral myelin protein (Pmp22) was found to be the most coordinately expressed gene involved in myelination (43.2%), while neutral sphingomyelinase activation-associated factor (Nsmaf) was found to be the least coordinated (5.0%). The very large expressome of Pmp22 is consistent with its role in mediating the interaction of Schwann cells with the extracellular environment (Amici et al., 2006 ; Amici et al., 2007 ; Berger et al., 2006 ) and the consequences of its misexpression in generating a family of hereditary peripheral neuropathies (Amici et al., 2007 ; Sereda and Nave, 2006 ).
Among the genes responsible for the immune response, interferon-induced transmembrane protein 3 (Ifitm3), involved in the negative regulation of cell proliferation (Ropolo et al., 2004 ), had the largest expressome (44.4%) and Fc receptor IgG low affinity III (Fcgr3) the smallest (2.5%). Ifitm3 also displayed the largest antagome (27.8%), while histocompatibility 2 class II antigen E beta (H2-Eb1), involved in antigen processing via MHC class II (Alfonso et al., 2001 ), had the largest synergome (27.5%). Immediate early response 3 (Ier3) appeared to have the largest exclusome (11.2%). Complex gene–gene interactions within the inflammatory pathway have also been reported by other groups. For example, Motsinger et al., 2007 explored 51 single nucleotide polymorphisms (SNPs) in 36 candidate genes within the inflammatory pathway, finding that multi-locus models successfully predicted MS disease risk with high accuracy.
The bimodal distributions of the expressome sizes of SC in both control and disease (Figure 3 B), was more prominent than that found in the brain (Iacobas et al., 2005a ), and suggest the existence of two categories of genes in terms of coordinations with other genes.
The perspective of “see-saw” partnership
The redundancy provided by similar or opposite coordination profiles may offer the possibility to compensate for functional effects of alteration in gene expression through regulation of interlinked partners. The striking similarity or opposition with regard to coordination profile of Pmp22 with genes such as Pdgfra and Pdgfrl (Figure 5 B) may explain why some of the Pdgf genes have been reported to act individually and∕or cooperatively in spontaneous remyelination (Murtie et al., 2005 ). A particularly interesting result of our study was the finding of strikingly similar or opposite partners of Pmp22 in the immune response gene cohort (Cklfsf3 and Ifitm3, Figure 5 A), intercellular calcium signaling (inositol 1,4,5-triphosphate receptor 1 (Itpr1) and glutamate receptor ionotropic N-methyl D-aspartate-like 1A (Grinl1a)) (Figure 5 C). Itpr1 is responsible for calcium mobilization from the endoplasmic reticulum calcium stores (Iacobas et al., 2006b ), while Grinl1a allows calcium ions from the extracellular space to diffuse into the cell when activated by glutamate. The existence of these “see-saw” partners of myelination genes suggests the possibility of correcting myelin defects through stimulating or inhibiting genes responsible for calcium signaling and immune response due to their similar or opposite interlinkage with thousands of genes. These relations between the coordination profiles can be substantially altered in pathological conditions as presented in Figures 5D–5F . These findings of network alterations add a novel concept to expression analysis, in which gene expression profiles can be considered not only by whether expression of genes in a similar functional pathway are affected, but also with regard to how their linkage to one another is altered in a disease state.
We have previously reported (Brand-Schieber et al., 2005 ) that the gene encoding the gap junction protein Cx43, the most abundant connexin expressed in astrocytes, was among the down-regulated genes in AT-EAE, a result recently confirmed in a guinea pig model of EAE (Roscoe et al., 2007 ). We concluded that in addition to damage of myelinating glia, altered astrocyte connectivity is a prominent feature of inflammatory demyelination. In order to test the hypothesis that coordinated expression with Cx43 might account for some of the observed altered patterns of gene expression, we have compared the coordination profile of Gja1 to those of the immune response and myelination genes quantified in this experiment. Thus, the coordination profile of Gja1 had a remarkable likeness with those of: histocompatibility 2 Q region locus 7 (H2-Q7, OVL = 87.4%), Psmb9 (OVL = 84.8%), H2-DMa (OVL = 84.5%), interleukin 2 receptor gamma chain (Il2rg, OVL = 83.6%), myelin protein zero (Mpz, OVL = 82.4%), complement component 1 q subcomponent beta polypeptide (C1qb, OVL = 81.6%), and proteolipid protein (myelin) (Plp, OVL = 75.5%). These associations may suggest that the consequences of altered Cx43 expression in damaged SC, evoked by endogenous mechanisms after traumatic SCI (Theriault et al., 1997 ) might be compensated by overexpression of these other genes. In this regard, we particularly highlight the myelination genes Mpz and Plp because of the prevalence of white matter disturbance in oculodentodigital dysplasia syndrome (Loddenkemper et al., 2002 ), which is caused by dysfunctional Cx43 mutations (Shibayama et al., 2005 ). As a corollary of this hypothesis, we might predict that pro-myelinating treatments would result in increased Cx43 expression in SC. Such a result has been recently reported as a consequence of treatment with two drugs in a guinea pig model of EAE (Roscoe et al., 2007 ).
Conclusion
We found that AT-EAE had a strong impact on the transcriptomic organization of the SC, perturbing most of the functional pathways, relaxing the TRA control, and altering the expression coordination of numerous genes, including those involved in myelination, immune response, and calcium signaling. In addition, identification of what we termed “see-saw” partners may provide alternative therapeutic targets for specific gene-related diseases.
Conflict of Interest Statement
The authors declare that the research was conducted in the absence of any commercial or financial relationships that could be construed as a potential conflict of interest.
Acknowledgements
We are grateful to Dr. Elimor Brand-Schieber (AECOM) who generated the AT-EAE mice for the initial study (Brand-Schieber et al., 2005), which served as the source for the microarray data further analyzed here. We also thank Dr. Celia Brosnan (AECOM) for critical reading of the manuscript. This work was supported by the NIH grants: P01 HD032573, RO1 NS041282, RO1 NS41023, and RO1 NS052245.
References
Adachi, T., Schamel, W. W., Kim, K. M., Watanabe, T., Becker, B., Nielsen, P. J., and Reth, M. (1996). The specificity of association of the IgD molecule with the accessory proteins BAP31∕BAP29 lies in the IgD transmembrane sequence. EMBO J. 15, 1534–1541.
Alfonso, C., Han, J. O., Williams, G. S., and Karlsson, L. (2001). The impact of H2-DM on humoral immune responses. J. Immunol. 167, 6348–6355.
Amici, S. A., Dunn, W. A., Jr.Murphy, A. J., Adams, N. C., Gale, N. W., Valenzuela, D. M., Yancopoulos, G. D., and Notterpek, L. (2006). Peripheral myelin protein 22 is in complex with alpha6beta4 integrin, and its absence alters the Schwann cell basal lamina. J. Neurosci. 26, 1179–1189.
Amici, S. A., Dunn, W. A., Jr.and Notterpek, L. (2007). Developmental abnormalities in the nerves of peripheral myelin protein 22-deficient mice. J. Neurosci. Res. 85, 238–249.
Baranzini, S. E., Bernard, C. C., and Oksenberg, J. R. (2005). Modular transcriptional activity characterizes the initiation and progression of autoimmune encephalomyelitis. J. Immunol. 174, 7412–7422.
Bareyre, F. M., and Schwab, M. E. (2003). Inflammation, degeneration and regeneration in the injured spinal cord: insights from DNA microarrays. Trends Neurosci. 26, 555–563.
Berger, P., Niemann, A., and Suter, U. (2006). Schwann cells and the pathogenesis of inherited motor and sensory neuropathies (Charcot-Marie-Tooth disease). Glia 54, 243–257.
Brand-Schieber, E., Werner, P., Iacobas, D. A., Iacobas, S., Beelitz, M., Lowery, L., Spray, D. C., and Scemes, E. (2005). Connexin43, the major gap junction protein of astrocytes, is down regulated in inflamed white matter in an animal model of multiple sclerosis. J. Neurosci. Res. 80, 768–808.
Brazma, A., Hingamp, P., Quackenbush, J., Sherlock, G., Spellman, P., Stoeckert, C., Aach, J., Ansorge, W., Ball, C. A., Causton, H. C., Gaasterland, T., Glenisson, P., Holstege, F. C., Kim, I. F., Markowitz, V., Matese, J. C., Parkinson, H., Robinson, A., Sarkans, U., Schulze-Kremer, S., Stewart, J., Taylor, R., Vilo, J., and Vingron, M. (2001). Minimum information about a microarray experiment (MIAME)-toward standards for microarray data. Nat. Genet. 29, 365–371.
Butt, A. M. (2006). Neurotransmitter-mediated calcium signalling in oligodendrocyte physiology and pathology. Glia 54, 666–675. Review.
Carmel, J. B., Galante, A., Soteropoulos, P., Tolias, P., Recce, M., and Young, W. (2001). Gene expression profiling of acute spinal cord injury reveals spreading inflammatory signals and neuron loss. Physiol. Genomics 7, 201–213.
Dahlquist, K. D., Salomonis, N., Vranizan, K., Lawlor, S. C., and Conklin, B. R. (2002). GenMAPP, a new tool for viewing and analyzing microarray data on biological pathways. Nat. Genet. 31, 19–20.
D'Antonio, M., Michalovich, D., Paterson, M., Droggiti, A., Woodhoo, A., Mirsky, R., and Jessen, K. R .(2006). Gene profiling and bioinformatic analysis of Schwann cell embryonic development and myelination. Glia 53, 501–515.
Deng, C., Radu, C., Diab, A., Tsen, M. F., Hussain, R., Cowdery, J. S., Racke, M. K., and Thomas, J. A. (2003). IL-1 receptor-associated kinase 1 regulates susceptibility to organ-specific autoimmunity. J. Immunol. 170, 2833–2842.
Di Giovanni, S., Knoblach, S. M., Brandol, I. C., Aden, S. A., Hoffman, E. P., and Faden, A. I. (2003). Gene profiling in spinal cord injury shows role of cell cycle in neuronal death. Ann. Neurol. 53, 454–468.
Doniger, S. W., Salomonis, N., Dahlquist, K. D., Vranizan, K., Lawlor, S. C., and Conklin, B. R. (2003). MAPPFinder: using Gene Ontology and GenMAPP to create a global gene-expression profile from microarray data. Genome Biol. 4, R7.
Draghici, S. (2003). Data analysis tools for DNA microarrays (Boca Raton∕London∕New York∕Washington DC, Chapman & Hall).
Ercolini, E. M., and Miller, S. D. (2006). Mechanisms of immunopathology in murine models of central nervous system demyelinating disease. J. Immunol. 176, 3293–3298. Review.
Ferreirinha, F., Quattrini, A., Pirozzi, M., Valsecchi, V., Dina, G., Broccoli, V., Auricchio, A., Piemonte, F., Tozzi, G., Gaeta, L., Casari, G., Ballabio, A., and Rugarli, E. I. (2004). Axonal degeneration in paraplegin-deficient mice is associated with abnormal mitochondria and impairment of axonal transport. J. Clin. Invest. 113, 231–242.
Fields, R. D. (2006). Nerve impulses regulate myelination through purinergic signalling. Novartis Found. Symp. 276, 148–158; discussion, 158–161, 233–237, 275–281. Review.
Garbay, B., Boiron-Sargueil, F., Shy, M., Chbihi, T., Jiang, H., and Kamholz, J. (1998). Regulation of oleoyl-CoA synthesis in the peripheral nervous system: demonstration of a link with myelin synthesis. J. Neurochem. 71, 1719–1726.
Gokhan, S., Marin-Husstege, M., Yung, S. Y., Fontanez, D., Casaccia-Bonnefil, P., and Mehler, M. F. (2005). Combinatorial profiles of oligodendrocyte-selective classes of transcriptional regulators differentially modulate myelin basic protein gene expression. J. Neurosci. 25, 8311–8321.
Haroutunian, V., Katsel, P., Dracheva, S., Stewart, D. G., and Davis, K. L. (2007). Variations in oligodendrocyte-related gene expression across multiple cortical regions: implications for the pathophysiology of schizophrenia. Int. J. Neuropsychopharmacol. 10, 565–573.
Iacobas, D. A., Urban, M., Iacobas, S., Scemes, E., and Spray, D. C. (2003). Array analysis of gene expression in connexin43 null astrocytes. Physiol. Genomics 15, 177–190.
Iacobas, D. A., Iacobas, S., Urban-Maldonado, M., and Spray, D. C. (2005a). Sensitivity of the brain transcriptome to connexin ablation. Biochim. Biophys. Acta Biomembranes 1711, 183–196.
Iacobas, D. A., Fan, C., Iacobas, S., Spray, D. C., and Haddad, G. G. (2006a). Transcriptomic changes in developing kidney exposed to chronic hypoxia. Biochem. Biophys. Res. Commun. 349, 329–338.
Iacobas, D. A., Suadicani, S. O., Spray, D. C., and Scemes, E. (2006b). A stochastic 2D model of intercellular Ca2+ wave spread in glia. Biophys. J. 90, 24–41.
Iacobas, D. A., Iacobas, S., and Spray, D. C. (2007a). Connexin43 and the brain transcriptome of the newborn mice. Genomics 89, 113–123.
Iacobas, D. A., Iacobas, S., and Spray, D. C. (2007b). Connexin-dependent transcriptomic networks in mouse brain. Prog. Biophys. Mol. Biol. 94, 169–185.
Jiang, S., Avraham, H. K., Park, S. Y., Kim, T. A., Bu, X., Seng, S., and Avraham, S. (2005). Process elongation of oligodendrocytes is promoted by the Kelch-related actin-binding protein Mayven. J. Neurochem. 92, 191–203.
Jungling, K., Eulenburg, V., Moore, R., Kemler, R., Lessmann, V., and Gottmann, K. (2006). N-cadherin transsynaptically regulates short-term plasticity at glutamatergic synapses in embryonic stem cell-derived neurons. J. Neurosci. 26, 6968–6978.
Kardami, E., Dang, X., Iacobas, D. A., Nickel, B. E., Jeyaraman, M., Srisakuldee, W., Makazan, J., Tanguy, S., and Spray, D. C. (2007). The role of connexins in controlling cell growth and gene expression. Prog. Biophys. Mol. Biol. 94, 245–264.
Knudtson, K. L., Griffin, C., Brooks, A. I., Iacobas, D. A., Johnson, K., and Khitrov, G. (2002). Factors contributing to variability in DNA microarray results: the ABRF Microarray Research Group 2002 Study. J. Biomol. Tech. Posters on line. http://www.abrf.org/ResearchGroups/Microarray/EPosters/MARG_2002_Poster.pdf
Kumar, S., Mattan, N. S., and de Vellis, J. (2006). Canavan disease: a white matter disorder. Ment. Retard. Dev. Disabil. Res. Rev. 12, 157–165.
Lock, C. B., and Heller, R. A. (2003). Gene microarray analysis of multiple sclerosis lesions. Trends. Mol. Med. 9, 535–541.
Lock, C., Hermans, G., Pedotti, R., Brendolan, A., Schadt, E., and Garren, H. L. (2002). Gene-microarray analysis of multiple sclerosis lesions yields new targets validated in autoimmune encephalomyelitis. Nat. Med. 8, 500–508.
Loddenkemper, T., Grote, K., Evers, S., Oelerich, M., and Stogbauer, F. (2002). Neurological manifestations of the oculodentodigital dysplasia syndrome. J. Neurol. 249, 584–595.
Matejuk, A., Hopke, C., Dwyer, J., Subramanian, S., Jones, R. E., Bourdette, D. N., Vandenbark, A. A., and Offner, H. (2003). CNS gene expression pattern associated with spontaneous experimental autoimmune encephalomyelitis. J. Neurosci. Res. 73, 667–678.
Mokhtarian, F., McFarlin, D. E., and Raine, C. S. (1984). Adoptive transfer of myelin basic protein-sensitized T cells produces chronic relapsing demyelinating disease in mice. Nature 309, 356–358.
Motsinger, A. A., Brassat, D., Caillier, S. J., Erlich, H. A., Walker, K., Steiner, L. L., Barcellos, L. F., Pericak-Vance, M. A., Schmidt, S., Gregory, S., Hauser, S. L., Haines, J. L., Oksenberg, J. R., and Ritchie, M. D. (2007). Complex gene-gene interactions in multiple sclerosis: a multifactorial approach reveals associations with inflammatory genes. Neurogenetics 8, 11–20.
Murtie, J. C., Zhou, Y. X., Le, T. Q., Vana, A. C., and Armstrong, R. C. (2005). PDGF and FGF2 pathways regulate distinct oligodendrocyte lineage responses in experimental demyelination with spontaneous remyelination. Neurobiol. Dis. 19, 171–182.
Pitt, D., Werner, P., and Raine, C. S. (2000). Glutamate excitotoxicity in a model of multiple sclerosis. Nat. Med. 6, 67–70.
Reiss, K., Maretzky, T., Haas, I. G., Schulte, M., Ludwig, A., Frank, M., and Saftig, P. (2006). Regulated ADAM10-dependent ectodomain shedding of gamma-protocadherin C3 modulates cell-cell adhesion. J. Biol. Chem. 281, 21735–21744.
Ropolo, A., Tomasini, R., Grasso, D., Dusetti, N. J., Cerquetti, M. C., Iovanna, J. L., and Vaccaro, M. I. (2004). Cloning of IP15, a pancreatitis-induced gene whose expression inhibits cell growth. Biochem. Biophys. Res. Commun. 319, 1001–1009.
Roscoe, A., Messersmith, E., Meyer-Franke, A., Wipke, S. J., and Karlik, S. J. (2007). Connexin 43 gap junction proteins are up-regulated in remyelinating spinal cord. J. Neurosci. Res. 85, 945–953.
Sereda, M. W., and Nave, K. A. (2006). Animal models of Charcot-Marie-Tooth disease type 1A. Neuromolecular Med. 8, 205–216.
Shibayama, J., Paznekas, W., Seki, A., Taffet, S., Jabs, E. W., Delmar, M., and Musa, H. (2005). Functional characterization of connexin43 mutations found in patients with oculodentodigital dysplasia. Circ. Res. 96, e83–e91.
Spray, D. C., and Iacobas, D. A. (2007). Organizational principles of the connexin-related brain transcriptome. J. Membr. Biol. 218, 39–47.
Theriault, E., Frankenstein, U. N., Hertzberg, E. L., and Nagy, J. I. (1997). Connexin43 and astrocytic gap junctions in the rat spinal cord after acute compression injury. J. Comp. Neurol. 382, 199–214.
Xu, L., Hilliard, B., Carmody, R. J., Tsabary, G., Shin, H., Christianson, D. W., and Chen, Y. H. (2003). Arginase and autoimmune inflammation in the central nervous system. Immunology 110, 141–148.
Yeo, T. W., De Jager, P. L., Gregory, S. G., Barcellos, L. F., Walton, A., Goris, A., Fenoglio, C., Ban, M., Taylor, C. J., Goodman, R. S., Walsh, E., Wolfish, C. S., Horton, R., Traherne, J., Beck, S., Trowsdale, J., Caillier, S. J., Ivinson, A. J., Green, T., Pobywajlo, S., Lander, E. S., Pericak-Vance, M. A., Haines, J. L., Daly, M. J., Oksenberg, J. R., Hauser, S. L., Compston, A., Hafler, D. A., Rioux, J. D., and Sawcer, S. (2007). A second major histocompatibility complex susceptibility locus for multiple sclerosis. Ann. Neurol. 61, 228–236.
Keywords: autoimmune demyelination, calcium signaling, chemokines, cytokines, EAE, inflammatory response, multiple sclerosis, myelination
Citation: Dumitru A. Iacobas, Sanda Iacobas, Peter Werner, Eliana Scemes and David C. Spray (2007). Alteration of transcriptomic networks in adoptive-transfer experimental autoimmune encephalomyelitis. Front. Integr. Neurosci. 1:10. doi: 10.3389/neuro.07/010.2007
Received: 10 October 2007;
Paper pending published: 13 December 2007;
Accepted: 3 December 2007;
Published online: 30 December 2007.
Edited by:
Sidney A. Simon, Duke University Medical Center, USAReviewed by:
Sidney A. Simon, Duke University, USAOscar Alzate, Duke University Medical Center, USA
Copyright: © 2007 Iacobas, Iacobas, Werner, Scemes and Spray. This is an open-access article subject to an exclusive license agreement between the authors and the Frontiers Research Foundation, which permits unrestricted use, distribution, and reproduction in any medium, provided the original authors and source are credited.
*Correspondence: Dumitru Andrei Iacobas, Dominick P. Purpura Department of Neuroscience, Albert Einstein College of Medicine, Bronx, NY 10461, USA. e-mail:ZGlhY29iYXNAYWVjb20ueXUuZWR1