


- 1 Department of Otorhinolaryngology – Head and Neck Surgery, University of Pennsylvania School of Medicine, Philadelphia, PA, USA
- 2 Department of Neuroscience, University of Pennsylvania School of Medicine, Philadelphia, PA, USA
- 3 Laboratoire Psychologie de la Perception, Paris, France
- 4 Department of Psychology, University of British Columbia, Vancouver, BC, Canada
- 5 Center for Studies in Physics and Biology, Rockefeller University, New York, NY, USA
Many natural signals, including environmental sounds, exhibit scale-invariant statistics: their structure is repeated at multiple scales. Such scale-invariance has been identified separately across spectral and temporal correlations of natural sounds (Clarke and Voss, 1975; Attias and Schreiner, 1997; Escabi et al., 2003; Singh and Theunissen, 2003). Yet the role of scale-invariance across overall spectro-temporal structure of the sound has not been explored directly in auditory perception. Here, we identify that the acoustic waveform from the recording of running water is a self-similar fractal, exhibiting scale-invariance not only within spectral channels, but also across the full spectral bandwidth. The auditory perception of the water sound did not change with its scale. We tested the role of scale-invariance in perception by using an artificial sound, which could be rendered scale-invariant. We generated a random chirp stimulus: an auditory signal controlled by two parameters, Q, controlling the relative, and r, controlling the absolute, temporal structure of the sound. Imposing scale-invariant statistics on the artificial sound was required for its perception as natural and water-like. Further, Q had to be restricted to a specific range for the sound to be perceived as natural. To detect self-similarity in the water sound, and identify Q, the auditory system needs to process the temporal dynamics of the waveform across spectral bands in terms of the number of cycles, rather than absolute timing. We propose a two-stage neural model implementing this computation. This computation may be carried out by circuits of neurons in the auditory cortex. The set of auditory stimuli developed in this study are particularly suitable for measurements of response properties of neurons in the auditory pathway, allowing for quantification of the effects of varying the statistics of the spectro-temporal statistical structure of the stimulus.
Introduction
The efficient coding hypothesis postulates that the brain evolved to efficiently process natural inputs by adapting to the statistics of natural scenes (Attneave, 1954; Barlow, 1961), and the organization and functions of sensory pathways in many cases reflect the environmental statistics (Field, 1987; Olshausen and Field, 1996; Simoncelli and Olshausen, 2001; Vinje and Gallant, 2002; Felsen et al., 2005; Woolley et al., 2005; Rodriguez et al., 2010), leading to their efficient representation (Atick, 1992; Rieke et al., 1995; Nelken et al., 1999; Sigman et al., 2001; Escabi et al., 2003; Garcia-Lazaro et al., 2006; Smith and Lewicki, 2006; Butts et al., 2007; Atencio et al., 2008; Lesica and Grothe, 2008; Holmstrom et al., 2010; Rodriguez et al., 2010). Linking the structure of a natural signal to its perceptual correlate is essential for understanding sensory neural processing (Sigman et al., 2001). In any natural visual scene there are many objects of different sizes; furthermore the apparent size of an object, and even whether it is visible in the scene or is occluded by others, changes with distance to the subject (Ruderman and Bialek, 1994; Balboa et al., 2001). Visual scenes thus have scale-invariance induced both by the varying sizes of objects as well as by their varying relationships to the viewer. In contrast, in the auditory world, weaker forms of self-similarity have been identified in natural sounds. Loudness modulations in natural sounds follow 1/f spectrum (Voss and Clarke, 1975; Voss, 1978). More detailed analysis showed that within a single frequency band, the temporal structure of a natural environmental sound obeys scale-invariant statistics (Voss and Clarke, 1975; Voss, 1978; Attias and Schreiner, 1997; Nelken et al., 1999; De Coensel et al., 2003; Singh and Theunissen, 2003; Garcia-Lazaro et al., 2006; McDermott et al., 2009, 2011; Rodriguez et al., 2010), exhibiting short-range and long-range correlations. An interesting parallel observation is that the structure of the filters which form the optimal basis for sparse representation of natural sounds exhibit scale-invariance in their relation between the bandwidth and the frequency (Lewicki, 2002; Garcia-Lazaro et al., 2006; Smith and Lewicki, 2006). These forms of self-similarity in the signal have been shown to have a neural correlate, as neurons in the ascending auditory system respond preferentially to sounds exhibiting scale-invariant features across the frequency and frequency modulation spectrum (Escabi and Read, 2005; Rodriguez et al., 2010). This analysis suggests that the auditory system may be tuned to detect scale-invariant statistical features in the structure of natural sounds.
We examined whether, for environmental sounds, scale-invariance is manifested not only within temporal modulations within distinct spectral channels, but also across spectro-temporal channels, and whether such statistical structure is perceptually prominent. We first probed the statistical composition of the sound of running water, and found that water sounds exhibit scale-invariance across the full spectro-temporal spectrum. The statistical make-up of the sound of running water was thus characterized by a single parameter, Q, reflecting the temporal scaling parameter relative to the center frequency of the specific spectral channel. We postulated that the auditory system may use Q in representing information about natural environmental sounds. Through a psychophysical study, we probed whether imposing the constraint of self-similarity on an otherwise random signal, and changing Q, is readily identified perceptually. In fact, Q served as a key parameter in judging a sound as natural. We propose a neural implementation of determination of Q based on the known circuitry of the auditory cortex. Furthermore, the set of the auditory stimuli developed in this study are amenable for measurements of receptive fields of auditory neurons, under varying statistical structure of the auditory stimulus.
Materials and Methods
Gammatone Transform
Gammatone transform was computed by projecting the waveform of the sound onto a gammatone filterbank (Eq. 1). The gammatone transform is widely used to approximate the transformation of a sound into spectral bands at the cochlear stage (Goblick and Pfeiffer, 1969; Depireux et al., 2001):

where y(t) is the signal, Gn is the gammatone transform in frequency band n, f is the center frequency, τ is the delay time and Q is the bandwidth or cycle constant of decay. The center frequency of the gammatone filters, fn, was logarithmically distributed between 400 and 22000 Hz over 50 values. The probability distribution of the square of the amplitude of the gammatone transform was computed for the histogram for f = 1, 2, 4, 8, 12, 16, and 20 kHz.
Phase-Surrogate Signal
Phase-surrogate signal was computed in Matlab by taking the Fast Fourier transform of the signal, multiplying the phases of all datapoints by random numbers, and taking a reverse Fast Fourier transform. Under this transformation, the resulting signal has the exact same power spectrum as the original, but the temporal relations between the components are randomized.
Power Spectrum
The power spectrum of water and surrogate water sounds was computed in Matlab using the pwelch function, based on Welch’s averaged, modified periodogram method for sound sampled at 192 kHz, with 1024 datapoints window.
Generative Model of Random Chirp Stimuli
A random chirp stimulus, y(t) was generated as a sum of gammatone chirps, which were uniformly distributed in time with a specific rate r (Eq. 2):

where each chirp xi, modeled as a gammatone function, with parameters amplitude ai, frequency fi, onset time τi, and cycle constant of decay Qi, drawn at random from distinct probability distributions.
Amplitude, ai, was determined as 1/x + h where h = 0.01 and x is drawn from a uniform distribution between 0 and fi/Qi; frequency, fi, was randomly uniformly distributed in log-frequency space, between 400 and 20000 Hz; time, τi, was uniform random with mean rate r that varied over four values: 53, 534, 5340, and 15300 chirps/Octave/second; and cycle constant of decay, Q, was identical for all chirps, and was varied from 0.2 to 8 (0.2, 0.5, 0.8, 1, 1.5, 2, 3.1, 4, 8) across experimental conditions. The resulting waveform was normalized to give the same loudness (measured by computing the SD of the signal) across all values of r and Q.
Control Stimuli
For control experiment 1, sounds were generated in which the cycle constant of decay of the chirp scaled proportionally to the frequency of the chirp for three conditions: Qi = 0.1*fi; Qi = 0.01*fi; Qi = 0.001*fi. For control experiment 2, sounds were generated in which the frequency of the chirp was drawn from a uniform linear distribution. For control experiment 3, sounds were generated in which the frequency range was restricted between 1 and 10 kHz, or 3 and 7 kHz.
Recording
Sound of a tropical brook was recorded at El Yunque tropical forest in Puerto Rico and the sound of a stream was recorded in Tulsa, OK using a calibrated B&K quarter-inch freefield microphone and TASCAM portable recorder at a sampling rate 192 kHz for over 10–20 min each.
Psychophysics
The following test sounds were presented in experiment 1 and experiment 2: in experiment 1, the original recording of a brook and 4 modified versions with different playback rates, and in experiment 2, random chirp stimuli (Eq. 2), 4 values of r and 10 values of Q, a recording of a stream, and the 6 control sounds. These sounds were cut to 7 s, and presented in interleaved order to 30 adult human subjects (26 females, 4 males, mean age: 24.7 years, range: 20–36 years). The order of presentation was counterbalanced across participants. The subjects were instructed to rate the sounds as unnatural or natural on a scale from 1 (most unnatural) to 7 (most natural). If their rating was above 4, they were asked for a verbal, qualitative description of the sound. Participants were tested individually in a quiet room. A computer displayed the instructions, delivered the sounds and recorded participants’ responses. Participants listened to the sounds through high-quality Sennheiser HD 515 or HD 555 headphones.
Statistics
A one-way ANOVA test with Dunnett’s post hoc correction for 47 comparisons was used for pair-wise statistical comparisons between participants’ responses to synthetic sound and the average rating of the original brook and stream recordings. A one-way, repeated measures ANOVA with factor Speed (1/4×, 1/2×, 1×, 2×, 4×) was conducted for the different playback rates of the brook (Figure 1) sounds and a two-way, repeated measures ANOVA with factors Rate (53/530/5300/12000) and Q (0.2/0.5/0.8/1/1.5/2/2.5/3.1/4/8) was performed over the responses to the synthetic sounds generated using the model. Kolmogorov–Smirnov test was used to assay for normality of the data prior to using parametric tests. For responses to 80% of the sample sounds, the Kolmogorov–Smirnov showed that normality could not be rejected at significance level of p < 0.05.
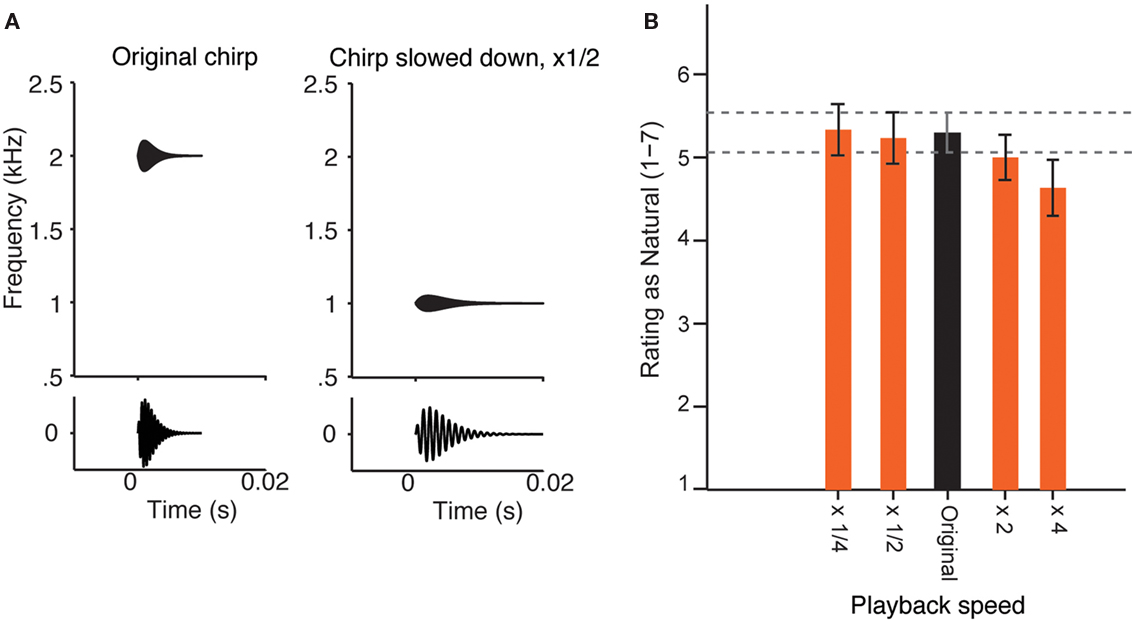
Figure 1. Perception of the sound of running water as natural does not change at varied playback speed. (A) Diagram of the change of a simple sound, when its playback speed is slowed down twofold. Top: frequency–temporal envelope of a sample chirp. Bottom: chirp sound waveform. Left: Original sound. Right: Sound slowed down by a factor of 2. Note that the sound becomes longer and its center frequency is decreased by a factor of 2. (B) Experiment 1. Mean ratings by 30 adult human subjects of the recording of a natural brook, played back at five different speeds (×1/4 slowed down by a factor of 4; ×1/2 slowed down by a factor of 2; Original; ×2 accelerated by a factor of 2; ×4 accelerated by a factor or 4), on the scale from 1 (most unnatural) to 7 (most natural). Error bars = SEM. There was no significant effect of speed on the rating in a one-way ANOVA [F(4, 26) = 1.030, n.s.)], and the pair-wise comparison with Dunnett correction for multiple comparisons did not reveal any significant differences between mean ratings of sounds with varying speed of playback and the original recording.
Cyclic Template Model
We modeled stage 1 of the model, deconvolution of the incoming signal from a single channel input for f = 1000 Hz and Q = 2 (rate 1). The deconvolving filter was computed as a two-sided time derivative of the envelope of the gammatone function (Eq. 1), for Q = 0.5, 2, and 8. The signal was 70 s long. The information rate between the original and the deconvolved signal was computed as the lower bound following the standard methods (Borst and Theunissen, 1999; Geffen et al., 2009):

where Ps(f) is the power of the input signal y(t) and Pe(f) is the power of the normalized prediction error between the convolved signal, zQ(t) and y(t).
Results
The Sound of Running Water is Perceived as Natural When Played Back at Different Speeds
Here, we report a novel form of acoustic self-similarity, which is directly related to the perception of an artificially generated acoustic waveform as a natural sound. We first show that an ethologically relevant sound, the sound of running water, does not change its perceptual quality at a range of scales. This means that the sound waveform is scale-invariant in its temporal structure not only within distinct spectral channels (as shown previously), but also across spectral channels.
Experiment 1
Testing the perception of a sound at different scales was achieved by modifying the playback speed of the waveform, without introducing any other transformations, except for loudness normalization (Figure 1A). Listeners rated a high-resolution recording of a tropical brook as natural or unnatural on a scale from 1 (most unnatural) to 7 (most natural; Figure 1B). The naturalness rating of the recording did not change significantly with playback speed over a 16-fold range (from four times attenuated to four times accelerated), although there was a small trend toward unnaturalness when the sound was played back at four times the speed. The subjects were also asked to describe the sounds verbally/qualitatively if they rated them as four or higher, and their descriptions corresponded to water-like sounds (see Materials and Methods).
When a sound is played back at a different speed, its spectro-temporal structure is modified dramatically: for example, when a sound is decelerated twofold, its frequency content shifts down by an octave, and the amplitude modulations are decelerated within each channel by a factor of two (Figure 1A, example for a chirp with one central frequency). If, as observed (Figure 1B), such a transformation is perceptually invariant, it means that the relative time course of the modulations within each spectral channel of the original signal must scale relative to the frequency. The statistical dependence of such a signal at some frequency, ω, in time, τ, denoted by the function Z(ω, τ), has to obey a simple relationship (Eq. 4):

where λ is the scaling factor and α is the scaling exponent. We postulated that the perceptually relevant features in the structure of the water sound obey Eq. 4.
The Structure of the Sound of Running Water is Self-Similar
First, we verified that, for a wide range of frequencies, the power spectrum of the signal obeyed a power law statistic, as expected for a self-similar signal. The spectral power of the natural brook in fact scaled inversely with the frequency (Figure 2).
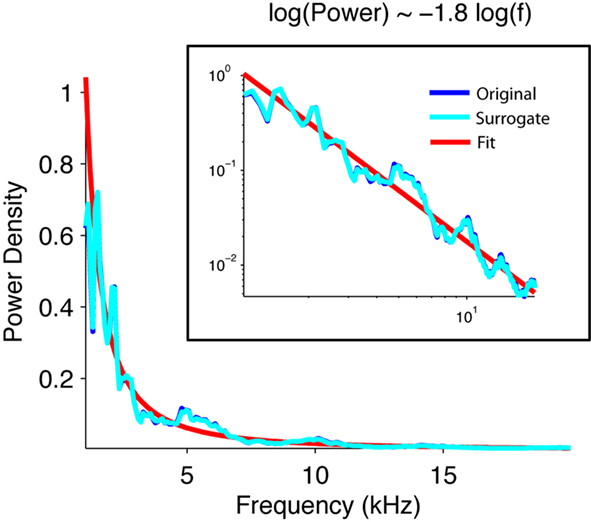
Figure 2. The power density of the acoustic waveform of water scales inversely with frequency. Normalized power density of the waveform of the original brook recording (blue), its phase-surrogate transform (cyan), and a linear fit (red). The surrogate was computed as an inverse Fourier transform of the Fourier transform of the signal whose phases were randomized. Note that the power spectrum scales with the inverse of the frequency 1.8.
We next examined whether the secondary statistical structure of the signal also obeyed scale-invariant relation. Comparing the signal to its phase-randomized surrogate revealed sharp peaks in the original signal, which were absent in the surrogate (Figure 3A). This showed that the original signal contained a secondary statistical structure, which differed from a random distribution with the same power spectrum (provided by the phase-surrogate signal). We transformed the sound into a spectro-temporal representation by using a gammatone transform, used to approximate the transformation of a sound into spectral bands at the cochlear stage (Goblick and Pfeiffer, 1969; Depireux et al., 2001; Eq. 1). This transformation also demonstrated that the sharp peaks present in the original could be attributed to its higher order statistical structure (Figure 3B). As a linear operator, the gammatone transform preserves scale-invariance in the transformed signal. We next analyzed the distribution of the amplitude fluctuations within spectral bands of this transform. For any given frequency band, the signal had a punctate distribution in time, exhibiting a high number of high-amplitude events (Figures 3B,C), and resulting in a powerlaw relation in the histogram of the amplitudes (Figure 3C, inset). The scaling exponent was preserved across a range of frequencies (−2.41 ± 0.09 SEM between 1 and 20 kHz; Figure 3C). If the phase relation in the running water signal were removed in the surrogate version (as the resulting sound resulted in Gaussian noise), the sharp peaks disappeared (Figure 3B, red line), and the amplitude histogram took a log-linear shape, as expected of a Gaussian signal (Figure 3C, dotted lines). The comparison to the phase-surrogate signal demonstrates that it is the cross-spectral structure of the recorded sound that results in the punctate distribution. We next compared this distribution normalized not by the SD within each channel, but by the center frequency of the transform (Figure 3D). We observed that the histogram probability distribution, when scaled by the center frequency of the transform, overlapped almost exactly at large values for a range of center frequencies of the gammatone transform (from 1 to 20 kHz; Figure 3D, inset). This meant that the structure of the signal within each spectral band matched, further obeying Eq. 4, and establishing the fractal character of this sound waveform.
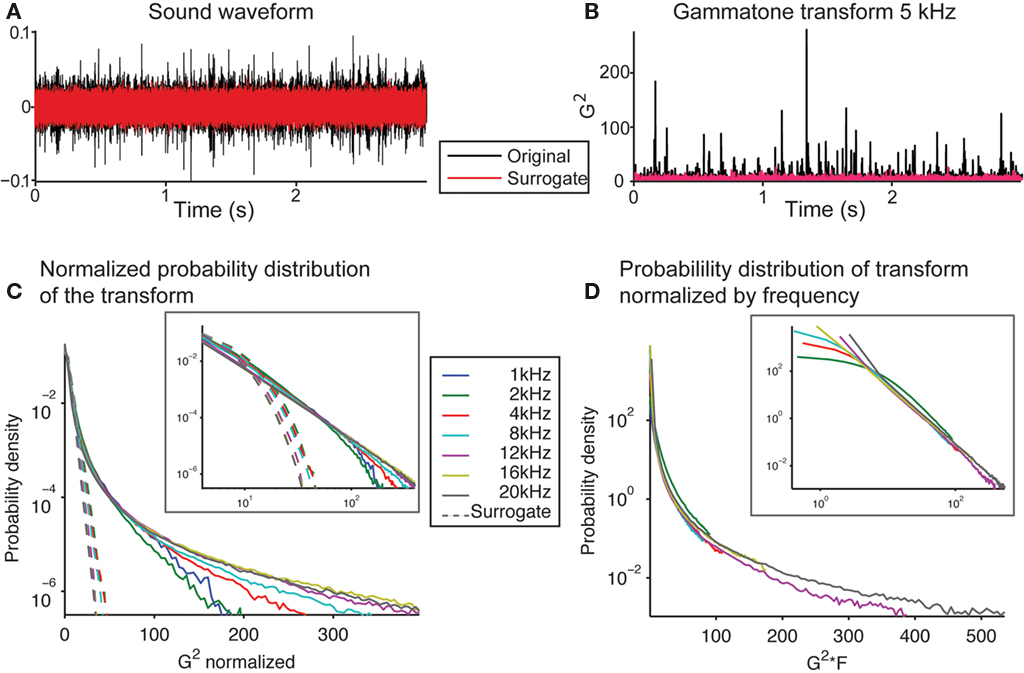
Figure 3. The soundwave of the recording of running water is characterized by rare high-amplitude events across spectral bands. (A) Waveform of the recording of the brook (black) and of the phase-randomized surrogate signal (red). (B) Squared gammatone transform of the signal (black) and its surrogate (red) at 5 kHz (Eq. 1). (C) Histogram of the power of the gammatone transform of the original recording and the surrogate signal at frequencies between 1 and 20 kHz, normalized by the SD. Note the long tails at high values of the power of the gammatone transform revealed for the original recording. The histogram for the surrogate signal follows a log-linear relation, which is expected of a Gaussian signal. (Inset depicts the same data on log–log scale). (D) Histogram of the non-normalized power of the gammatone transform of the original recording and the surrogate signal at frequencies between 1 and 20 kHz, scaled by the center frequency of the transform. Note that these histograms overlap closely for the full range of frequencies for large values. (Inset depicts the same data on a log–log scale).
An Artificial Sound is Perceived as Natural and Water-Like if Constructed as a Self-Similar Signal
Experiment 2
To analyze which aspects of the statistics of the recorded water sound corresponded to perceptual changes, we next created a library of synthetic sounds, whose parameters could be varied systematically and tested psychophysically. The basic structure of the synthetic sound, which we call the “random chirp stimulus,” y(t), consisted of a superposition of gammatone enveloped chirps (Eq. 2; Figure 4A, inset depicts two chirps with different center frequency).
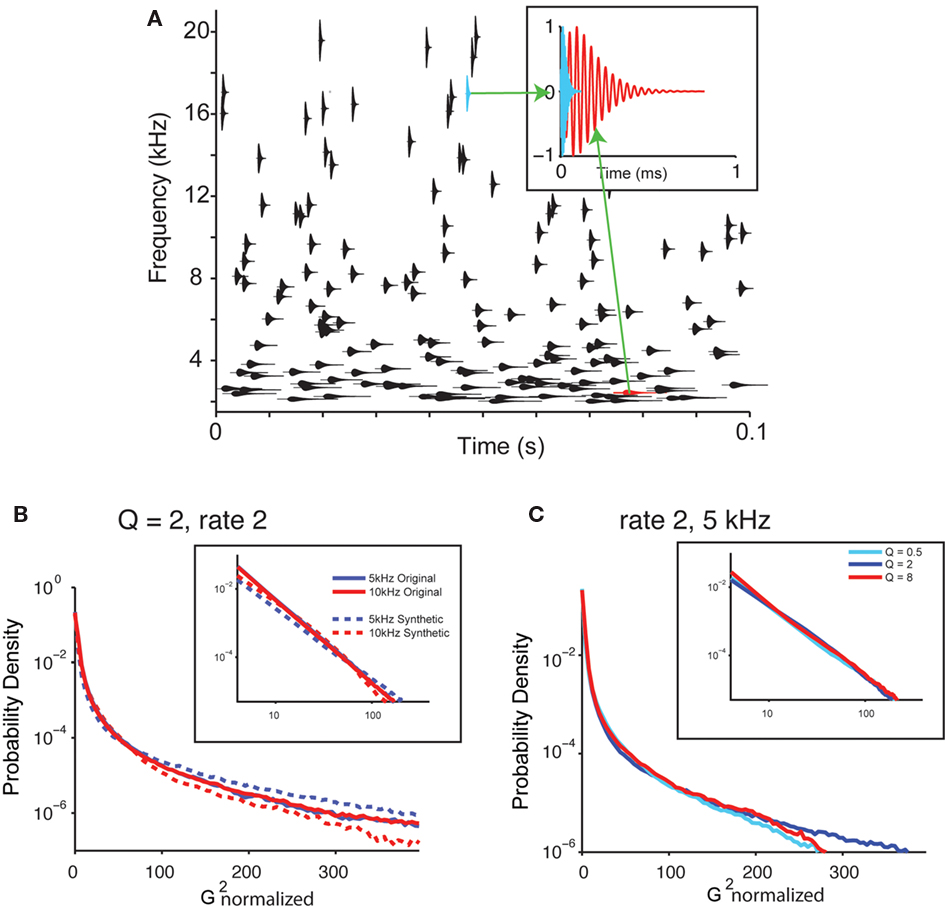
Figure 4. Synthetic sounds capture the statistics of natural sounds. (A) A diagram of the generative model of the water sounds. The sound is composed of superposition of individual chirp-like sounds. Each chirp sound has a sinusoid enveloped in a gammatone and is characterized by its frequency, amplitude, and the cycle constant of decay. The gammatone envelope for each chirp if depicted, centered on the center frequency of the chirp. Its height depicts the bandwidth of the chirp. x-coordinate denotes its time. Top insets: shape of two characteristic chirps at different frequencies. (B) Histogram of power of gammatone transform for the original recording and the synthetic sounds (Q = 2, rate 2; same as in Figure 3C). (C) Histogram of power of gammatone transform for the synthetic sounds with varying Q (Q = 0.5, 2, and 8, rate 2; same as in Figure 3C).
The values for these parameters for each chirp were drawn from random distributions. To make the resulting signal y(t) obey Eq. 4, three conditions were imposed on the distribution of the parameters: The timing of occurrence of the chirps was taken as a Poisson process with a varying rate, r; the frequency of the chirps was drawn from a uniform log-frequency distribution; the cycle constant of decay, Q, was the same for all chirps (such that the chirps each had the same number of cycles). Further, to make the signal punctate within each spectral band, the amplitude distribution of the chirps was drawn from an inverse square distribution (see Materials and Methods). Such dependence corresponds to the attenuation of sound from uniformly distributed point sources across a two-dimensional space with distance to the listener. The probability of the sound having the same maximum amplitude was kept constant across all frequency channels and Q values. The random chirp stimulus mimicked the structure of the naturally recorded sound (Figures 4B,C), as the histogram of the amplitude of the gammatone transform exhibited similar long tails and powerlaw relation at a range of frequencies for the synthetic sound for different Q values (Figures 4B,C).
Adult listeners rated these synthetic sounds as sounding as natural as a recording of the natural sound of running water source. This observation held for a broad but restricted range of the two parameters controlling the structure of the synthetic sound (Figures 5A–D). The sounds were presented to the subjects in brief segments (7 s), and subjects were asked to rate them on a 7-point scale ranging from unnatural (1) to natural (7), just like the brook recordings. We tested the ratings of sounds produced using 4 different chirp rates and 10 different Q values, and compared them to the average rating of two natural recordings of water sources. Among the parameters tested, the intermediate chirp rate and intermediate Q values produced the most natural rating (Figures 5A–D). In general, the dependence of naturalness rating on Q followed a bell-shaped relation and dropped off to significantly lower levels for Q > 3.1 and Q < 1 for the range of rates tested. Only the values of Q had a significant effect on participants’ naturalness ratings [F(9,21) = 4.958, p < 0.0001 in a two-way, repeated measures ANOVA]. The rate of chirps had no significant main effect on perception, although it showed a trend toward significance, [F(3,27) = 2.746, p = 0.062], and it didn’t interact with Q [F(27,3) = 3.380, n.s.]. Subjects were also asked to describe the sound source of the synthetic sounds if they rated the sounds at a naturalness value 4 or greater. Their descriptions ranged from a dripping tap to a roaring stream, confirming that our generative model yields a superordinate category of sounds that are perceived as “water.”
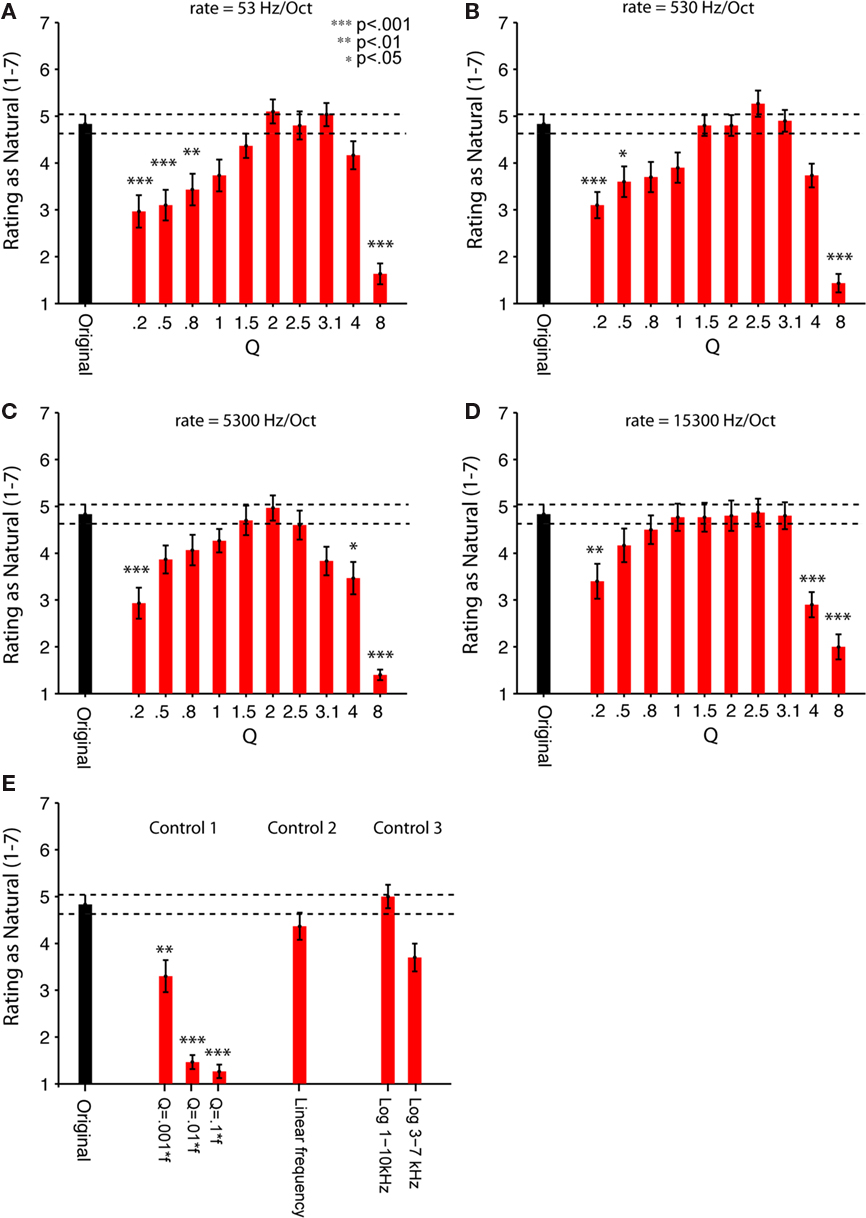
Figure 5. Human listeners rate the synthetic scale-invariant sounds as natural as the original water recordings. Psychophysical measurements of perception of the natural and synthetic sounds (sample sound files used in the experiments are available as Supplementary Material). Thirty adult human subjects were asked to rate the natural and synthetic sounds on a scale from 1 (most unnatural) to 7 (most natural). (A–E) Original (black bar): Average rating of two natural recordings (brook and stream). (A–D) Experiment 2. Synthetic (red bars): ratings of synthetic sounds, consisted of superposition of chirps, whose frequency was uniformly distributed in log-frequency space. Q varied between 0.2 and 8. (A) Rate 1 = 53. (B) Rate 2 = 530. (C) Rate 3 = 5300. (D) Rate 4 = 15300 Hz/octave. (E) Control experiment 1. Rating of control synthetic sounds, where the cycle decay constant scaled inversely with frequency of each chirp, for Q = 0.1f, 0.01f, 0.001f. Control experiment 2. Rating of control synthetic sounds, where the frequency of the chirps was drawn from a uniform linear distribution (“Linear Frequency”). Control experiment 3: Rating of 2 control synthetic sounds, where the frequency of the chirps was restricted to a subband of frequencies, either 1–10 kHz (“Log 1–10 kHz”) or 3–7 kHz (“Log 3–7 kHz”). Error bars = SEM. To evaluate the contributions of chirp rate and Q to the perception of naturalness, a two-way, repeated measures ANOVA was performed on data in (A–D), revealing the significant main effect of Q [F(9, 21) = 4.958, p < 0.0001]. There was no significant effect of rate, or interactions between the rate and Q parameters. Stars indicate significance of the pair-wise comparisons between rating of each synthetic sound and the original sound, multiple comparisons (n = 47) corrected using one-sided (less than control) Dunnett’s adjustment (***p < 0.001; **p < 0.01; *p < 0.05). See “Table S2 in Supplementary Material” for a table of significant p-values.
Our generative sound model had two major assumptions: the chirp frequency was drawn from a broad logarithmically uniform distribution; and the cycle constant of decay for each chirp was held constant. Both of these assumptions were required for the scale-invariance the sound structure. We tested whether these assumptions contributed to the perception of sound as natural with three control experiments (Figure 5E).
Control experiment 1
To make the signal self-similar, the length of each chirp was originally scaled inversely with the frequency, keeping the number of cycles in each chirp constant, independent of the center frequency. In Control experiment 1, we tested perception of sounds, which were composed of chirps, whose time length was kept the same regardless of frequency (their cycle constant scaled proportionally to the frequency). These stimuli are similar to the random pip stimuli developed in measurement of auditory receptive fields. For all values of the time constant of decay tested, these sounds were perceived as significantly less natural than the self-similar synthetic sounds, almost reaching the lowest rating possible (Figure 5E). This result shows that the perception of “naturalness” in this synthetic sound stems from the comparison of the temporal structure of the stimulus across spectral bands in terms of the number of cycles, rather than absolute timing, and that structure, here characterized by Q, must be the same across spectral channels.
Control experiments 2 and 3
In Control experiments 2 and 3, we tested whether changing the power spectrum of the sound from 1/f to a linear or log-linear distribution affected the perception of the sound as natural. We found that the shape of the power spectrum had little effect on the perception of the sound as natural. In Control experiment 2, sounds generated with chirps whose frequency was drawn from a linear frequency distribution were perceived slightly less natural than the recording or the corresponding logarithmic frequency sound, but not significantly so. In Control experiment 3, restricting the range of the frequencies to a narrow band (3–7 kHz), but not to a wider band (1–10 kHz), had only a trend toward reducing the naturalness rating of the sounds (Figure 5E; Table 1). Thus, the relative power across spectral bands is less important for perceiving this sound as natural than the relative temporal structure of the chirps across spectral channels.
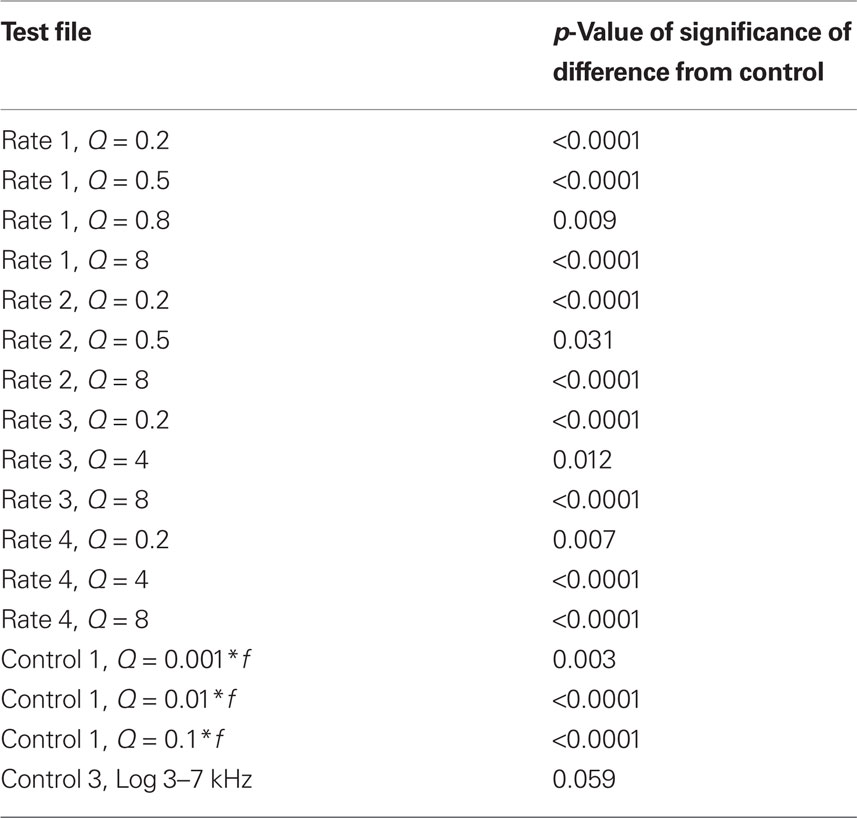
Table 1. Table of significant p-values for pair-wise comparison with one-sided multiple comparison Dunnett correction for data in Figure 4 after one-way ANOVA.
Discussion
Generative Model of Scale-Invariant Sounds
We found that an artificial sound composed of randomly spaced chirps spanning a wide range of frequencies resulted in a perception of a natural water-like sound, if the temporal structure of each chirp scaled relative to its center frequency, for a restricted range of Q values. Our generative model of water sounds provides a considerable, yet constructive simplification as compared to the previous generative models of water sounds. The previous models had been based on constructing an approximation to the sound produced by the physical effect of the impact of the air bubbles in water (Leighton and Walton, 1987; van Den Doel, 2004). The sound produced by individual gas bubbles in water had been modeled as a damped oscillation, followed by an effect of the impact of the cavity in the water formed by rising bubble (Minnaert, 1933; Leighton et al., 1990), resulting in a complex waveform for a single bubble sound. Our model differs from the previous models because identifying an overarching statistical principle of scale-invariance allows us to dramatically reduce the number of parameters that describe the full structure of the generated sound. The gammatone chirp that we used as the basic unit in the synthetic sound represents an approximation of the sound produced by a single bubble. However, as the synthetic sounds generated using simple gammatone chirps fully replicate the naturalness perception of the original, the specifics of the shape of the chirp produced by the kernel appear to be less important than their distribution. Our study shows that the perception of the overall sound is dominated by the temporal statistics within and across spectral bands, which follow a temporally based scale-invariant relation.
Model of Cyclo-Spectral Template Matching
How does the auditory system integrate information about the chirps into a percept of water? Our study suggests that the water sound may be identified by two computations: (1) activation of the channels encoding the dominant Q value of the sound for each spectral band, and (2) template representation of the characteristic Q value across spectral bands, averaged over time (Figure 6A).
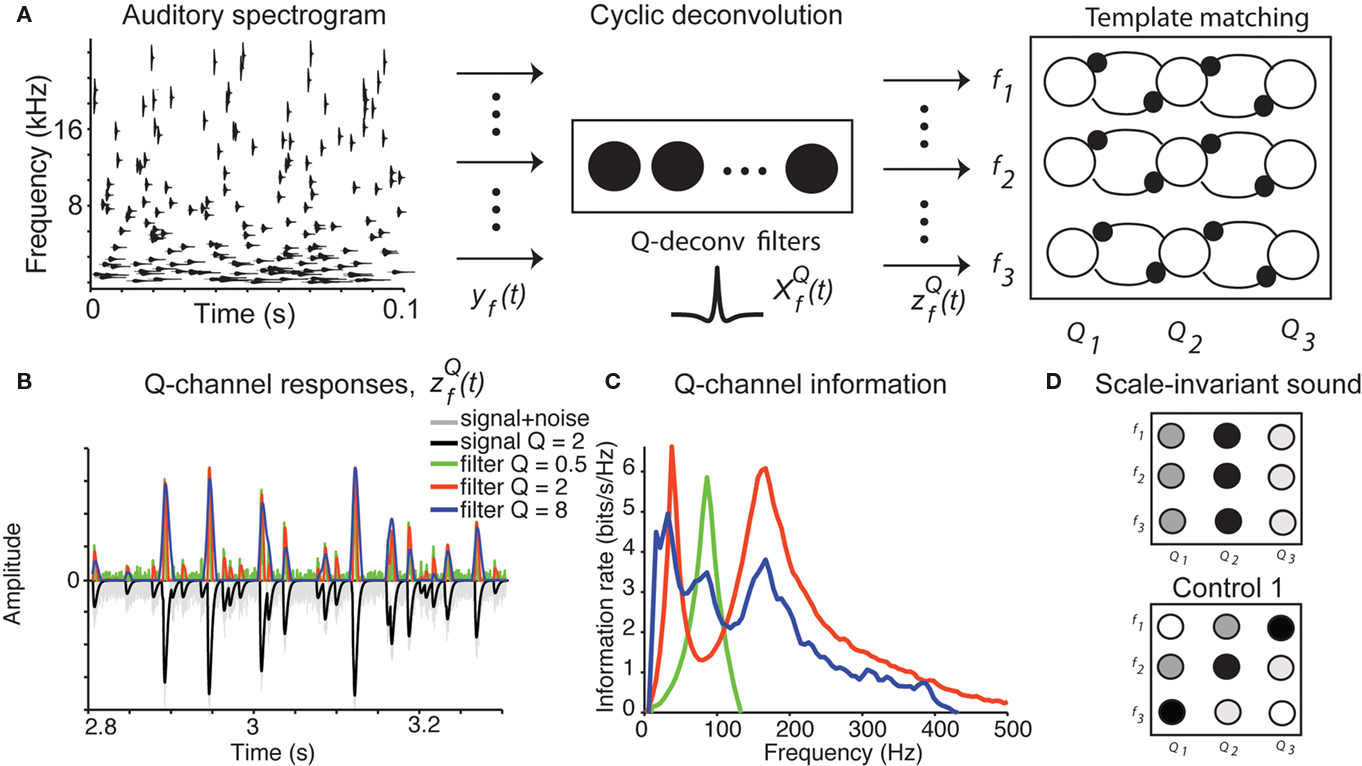
Figure 6. Cyclo-spectral template matching model. (A) An overview of the model. The incoming sound waveform is transformed into a spectro-temporal representation at the early auditory stages. In stage 1, the signal within each spectral channel is passed through a filterback of deconvolution filters of varying Q,  constructed as two-sides derivatives of the gammatone function. In the last stage, through lateral inhibition, the most active Q based channel is enhanced and averaged over time. (B) The output of the stage 2 of the model of an input signal (black trace, inverted for clarity of figure) with f = 1000 Hz, Q = 2, rate 1 with 10% Gaussian noise (gray trace, inverted for clarity of figure) for
  with Q = 0.5 (green trace), 2 (red trace), and 8 (blue trace). The convolution of the input and
  was normalized by the maximum value and half-wave rectified. The output for the filter with Q = 2 captures all the peaks present in the original signal, while the output for the filter with Q = 8 smoothes over neighboring peaks, and output for filter with Q = 0.5 misses the peaks because of the noise. (C) The deconvolving filter with matching Q relays the most information about the original signal. The information rate of the output of stage 2 of the model as in (B). Note that the red trace (Q = 2) depicts a greater information content transmitted by the matching deconvolving filter. The green trace (Q = 0.5) exhibits most power in the noise band. The blue trace (Q = 8) exhibits lower information than the red trace over all frequency bands. (D) Examples of cyclo-spectral templates: Predicted mean activation of cyclo-spectral (Q–f) channels. Sounds with constant Q across spectral bands, such as the naturally perceived sounds with Q = 2, will activate predominantly the channels of the same Q across spectral channels. Sounds from control 1, composed of chirps whose temporal structure is constant, activate the channels with varying Q across spectral bands: Q will be higher for higher frequencies.
Step 1: Cyclic deconvolution of the auditory spectrogram
At the first stage, the envelope of the fluctuations of the sound waveform within each spectral band is convolved with a bank of triphasic filters of varying Q values, implemented as a two-sided derivative of the gammatone function,  This computation may be achieved through the successive stages of integration and local inhibition within the primary auditory cortex. The output, y(f, t, Q) reproduces the original signal from a signal contaminated with broadband noise if the mean Q statistics of the input matches that of the filter. We modeled this processes for a single channel with f = 1000 Hz and Q = 2 (r = 0.07) (Figures 6B,C). The input signal, with added Gaussian broadband noise (10% maximum amplitude of signal), was then passed through three deconvolving filters,
  for f = 1000 Hz and Q = 0.5, 2, and 8. The resulting output most accurately captured the peaks in the input and captured most information in the relevant frequency bands for
  The output
  was dominated by noise, whereas using a wider filter,
  merged neighboring peaks (Figure 5B). The information rate of the output with respect to the input (Eq. 3, Geffen et al., 2009) was greatest for
  (Figure 6C, red trace). exhibited the greatest amount of information in the noise band (around 100 Hz), whereas
  exhibited information in the broad band, but less information than
  The resulting output of representation provides a sparse representation of the auditory waveform (Smith and Lewicki, 2006; Hromadka et al., 2008). The deconvolving filter performs essentially the sparsening computation, which was previously implemented through a matching pursuit algorithm (Smith and Lewicki, 2006).
Step 2: Template matching
To create a template of representation of the sound statistics in the cyclo-spectral space, a sharpening stage is introduced (Figure 6A). Through lateral inhibition between neighboring Q-channels, the responses of the maximally activated Q channel are enhanced, while the activity of the network is averaged over time. The resulting 〈Z(f, Q)〉t representation is similar to the computation of an auto-correlation width for each spectral channel, in units of cycles. In this representation, the water sound corresponds to a “line”: units encoding the same Q value across frequencies should be activated the strongest (Figure 6D). On the other hand, the control sounds 1, which are composed of chirps of constant duration across frequencies, will correspond to a diagonal line. To detect a vertical column activated in 〈Z(f, Q)〉t, a downstream unit or network of units, which receive inputs from channels with the same Q, is required. The potential stage for this computation may be localized to the association auditory cortices, in which average neuronal activity is correlated with the spectro-temporal coherence in the stimulus (Overath et al., 2008). For natural sounds, which contain large noise components, this computation should occur after a de-noising stage, in which the sound object is separated from other sound sources and background noise (Asari et al., 2006; Hromadka and Zador, 2009).
Auditory Cortex Responds Strongest to Stimuli with Natural Statistics
Several recent works show that as a population, neurons in the ascending auditory pathway should be activated strongest by sounds identified as “most natural” here. The spectro-temporal receptive field (STRFs) of a neuron in the ascending auditory system may be characterized by the preferred spectral and temporal modulation frequency, as well as the bandwidth of the spectral and temporal modulation frequency. In the temporal domain, imposing 1/f temporal statistics over the stimulus evoked an increase in discharge of neurons in the primary auditory cortex (O’Connor et al., 2005; Garcia-Lazaro et al., 2006). Further, neural tuning properties of neurons in the IC adapt to match the statistics of the stimulus (Lesica and Grothe, 2008). For a representative large population of neurons in the IC, most of the neurons’ spectro-temporal bandwidth matched the predicted Q range (Rodriguez et al., 2010), and thus, a larger proportion of neurons in the IC is expected to fire in response to these sounds. Finally, sounds whose temporal scale was proportional to the frequency, in the range that we identified, evoked the highest firing rate in neurons in the primary auditory cortex (O’Connor et al., 2005). A stream of chirps of a particular frequency and Q value will predominantly activate the central auditory neurons whose receptive fields exhibit the corresponding relationship between the spectral and temporal modulation frequency bandwidth. Thus, stage 1 of the cyclo-spectral template matching (CTM) model may be implemented within the primary auditory cortex, and further, the auditory cortex will be most strongly activated by the subset of stimuli that were judged as most natural in our study. The distribution in tuning properties may be used to construct a wiring scheme, which would lead to selection of the inputs to neurons in the downstream area selective for a particular Q across spectral channels: a natural sound will activate neurons with the same Q together, and thus strengthen their connections to the downstream neurons. Imposing a lateral inhibitory circuit on the downstream neurons would allow them to distribute the Q value selectivity to different neurons. The identified pattern of neuronal connectivity would lead to a representation of bandwidth-limited, yet spectrally broadly tuned neurons.
Cyclic Computation Across Spectral Bands
The resulting computation from the cyclical template matching model may be likened to the global comparison of the properties of the sound on timescales relative to the frequency – a computation in terms of the number of cycles, rather than absolute timing. The stimuli developed for the psychophysical experiments in this study may be used in electrophysiological studies to explore the pattern of activation of neurons in the auditory cortex, whose receptive field is sensitive to different Q values, and to identify downstream targets of neurons with similar Q tuning properties. This computation may further facilitate both the encoding of a natural auditory scene, and the detection of a source against a background, as the droplets with a common Q statistics are pulled together in a coherent stream.
Generalization to Other Natural Sounds
Although our analysis is restricted to a subset of natural sounds, namely running water, a mechanism for comparing the structure of the sound across spectral bands in terms of cycles, rather than absolute timing, may be useful in processing other types of natural sounds. As the second-order statistics and the basis of optimal filters for sparse encoding of environmental sounds match closely those of human speech (Singh and Theunissen, 2003; Smith and Lewicki, 2006), the comparison of the temporal dynamics across frequencies in terms of the relative number of cycles may be relevant for natural sound processing and speech encoding (Turner and Sahani, 2008; McDermott et al., 2009).
A Novel Library of Stimuli for Receptive Field Mapping
The random chirp stimuli, implemented here in psychophysical studies, may be readily used to measure the response properties, such as the STRFs, of neurons in the auditory pathway under varying statistical constraints. The random chirp stimuli, generated using Eq. 1, are composed of chirps that are randomly distributed in log-frequency and time. As such, these sounds are similar to the standard random pip stimuli previously developed for the measurement of STRFs (Blake and Merzenich, 2002; Gourevitch and Eggermont, 2008). The crucial difference is that pips at different frequencies have the same temporal duration, whereas chirps at different frequencies have the same number of cycles, and thus scale in their temporal length relative to their central frequency. Stimuli for control experiment 1 were constructed similar to the random pip stimuli. Random pip stimuli have been particularly useful to identify the effect of auditory density on processing of the local features of the auditory waveform in the inferior colliculus and the primary auditory cortex. To compute the STRFs of an auditory neuron, using the random pip stimuli, one performs reverse-correlation between the firing rate of the neuron and the matrix composed of frequency and timing of each pip. As the number of the pips was increased to change the spectro-temporal density of the signal, STRF of an auditory neuron was computed and compared across different statistical condition (Blake and Merzenich, 2002; Gourevitch and Eggermont, 2008).
Our study, however, (Figure 5), shows that the random chirp stimuli we constructed (experiment 2) are perceived as significantly more natural than the random pip stimuli (control experiment 1). Since the receptive fields of neurons in the ascending auditory pathway change with changing statistical structure of the stimuli (Hsu et al., 2004; Woolley et al., 2005; Atencio et al., 2008; Sharpee et al., 2008), using a set of stimuli which mimic the natural statistics of the environment in computing the receptive fields of these neurons may be advantageous for predicting the responses of neurons to natural sounds. Evidence suggests that neurons in the primary auditory cortex are particularly responsive to stimuli with high contrast (Blake and Merzenich, 2002). The sharp onset of the chirp in the random chirp stimulus may thus strongly entrain neurons in the auditory cortex, while remaining within a natural statistical regime. Furthermore, as in this study, during electrophysiological recordings, the Q statistic may be modified for the entire stimulus set, and thus the effect of Q on encoding of local spectro-temporal response properties of neurons may be examined.
To compute the STRFs of an auditory neuron, from its firing rate, r(t), in response to a random chirp stimulus, y(t), the following procedure is used. The stimulus is represented as frequency-time matrix, S. Sij is constructed as a sum of the amplitudes of chirps at the specific frequency ωi and with onsets within the timebin τj:

the response is constructed from the firing rate of the neuron binned into defined time bins. The receptive field is computed through reverse-correlation between the response and the signal following standard methods (see, for example Geffen et al., 2007, 2009; Calabrese et al., 2011). Details on the implementation of this algorithm and application to neural data will appear in a forthcoming manuscript.
Conclusion
In conclusion, we have shown that the natural sound of running water exhibits a temporal self-similarity across spectral channels, and this self-similarity is the key factor, which is used to discriminate natural and unnatural sounds in auditory perception. Our study points to the importance of examining the temporal structure of natural sounds on timescales relative to the spectral frequency. We developed a novel library of auditory stimuli, random chirp stimuli, whose scale-invariant parameters may be directly controlled. These stimuli are perceived as natural for a range of statistical parameters, and unnatural for another range of the parameters. Thus, they may prove useful in studies designed to determine the STRFs properties of neurons in the auditory pathway and the effect of varying the temporal structure of the sound on the way the auditory system represent the environment.
Conflict of Interest Statement
The authors declare that the research was conducted in the absence of any commercial or financial relationships that could be construed as a potential conflict of interest.
Acknowledgments
The authors thank Mayte Suarez-Farinas, Xaq Pitkow, Andrea Hasenstaub, Daniel Butts, and the members of the Magnasco laboratory for helpful comments on the manuscript and Joshua MacDermott, Eero Simoncelli, and William Bialek for useful discussions. Dr. Maria Neimark Geffen is the recipient of the Burroughs Wellcome Career Award at the Scientific Interface. This work was also partially supported by the post-doctoral fellowship from the Center for Studies in Physics and Biology at Rockefeller University and the Raymond and Beverly Sackler Fellowship to Maria Neimark Geffen; the ANR Jeune Chercheur Grant No. 21373 to Judit Gervain; and grants from NSERC, CIFAR, and the James S. McDonnell Foundation to Janet F. Werker.
Supplementary Material
The Supplementary Material for this article can be found online at http://www.frontiersin.org/Integrative_Neuroscience/10.3389/fnint.2011.00015/abstract
Sound Files
These sound files were used in the psychophysical measurements.
Movie S1. Brook_n.wav – original recording of the brook used in Figures 1B, 3, and 5 as control.
Movie S2. Brook_surro.wav – phase-randomized surrogate of the original brook recording used in Figure 3B.
Movie S3. X_r2_0.5_n.wav : random chirp stimulus used in Figure 5B with rate 2 and Q = 0.5 value.
Movie S4. X_r2_2.5_n.wav : random chirp stimulus used in Figure 5B with rate 2 and Q = 2.5 value. Q = 2.5 corresponds to the most natural rated sound.
Movie S5. X_r2_8_n.wav : random chirp stimulus used in Figure 5B with rate 2 and Q = 8 value.
Movie S6. Control1_2.wav: Control 1 sound used in Figure 5E rate 2, Q = 0.01f.
References
Asari, H., Pearlmutter, B. A., and Zador, A. M. (2006). Sparse representations for the cocktail party problem. J. Neurosci. 26, 7477–7490.
Atencio, C. A., Sharpee, T. O., and Schreiner, C. E. (2008). Cooperative nonlinearities in auditory cortical neurons. Neuron 58, 956–966.
Atick, J. J. (1992). Could information theory provide an ethological theory of sensory processing? Network 3, 213–251.
Attias, H., and Schreiner, C. E. (1997). Temporal low-order statistics of natural sounds. Adv. Neural Inf. Process. Syst. 9, 27–33.
Balboa, R. M., Tyles, C. W., and Grzywacz, N. M. (2001). Occlusions contribute to scaling in natural images. Vision Res. 41, 955–964.
Barlow, H. B. (1961). “Possible principle underlying the transformation of sensory messages,” in Sensory Communication, ed. W. A. Rosenblith (Cambridge, MA: MIT Press), 217–234.
Blake, D. T., and Merzenich, M. M. (2002). Changes of AI receptive fields with sound density. J. Neurophysiol. 88, 3409–3420.
Borst, A., and Theunissen, F. E. (1999). Information theory and neural coding. Nat. Neurosci. 2, 947–957.
Butts, D. A., Weng, C., Jin, J., Yeh, C. I., Lesica, N. A., Alonso, J. M., and Stanley, G. B. (2007). Temporal precision in the neural code and the timescales of natural vision. Nature 449, 92–95.
Calabrese, A., Schumacher, J. W., Schneider, D. M., Paninski, L., and Woolley, S. M. (2011). A generalized linear model for estimating spectrotemporal receptive fields from responses to natural sounds. PLoS ONE 6, e16104. doi: 10.1371/journal.pone.0016104
De Coensel, B., Botteldooren, D., and De, M. T. (2003). 1/f noise in rural and urban soundscapes. Acta Acust. United Ac. 89, 287–295.
Depireux, D. A., Simon, J. Z., Klein, D. J., and Shamma, S. A. (2001). Spectro-temporal response field characterization with dynamic ripples in ferret primary auditory cortex. J. Neurophysiol. 85, 1220–1234.
Escabi, M., and Read, H. (2005). Neural mechanisms for spectral analysis in the auditory midbrain, thalamus, and cortex. Int. Rev. Neurobiol. 70, 207–252.
Escabi, M. A., Miller, L. M., Read, H. L., and Schreiner, C. E. (2003). Naturalistic auditory contrast improves spectrotemporal coding in the cat inferior colliculus. J. Neurosci. 23, 11489–11504.
Felsen, G., Touryan, J., Han, F., and Dan, Y. (2005). Cortical sensitivity to visual features in natural scenes. PLoS Biol. 3, e342. doi: 10.1371/journal.pbio.0030342
Field, D. J. (1987). Relations between the statistics of natural images and the response properties of cortical cells. J. Opt. Soc. Am. A 4, 2379–2394.
Garcia-Lazaro, J. A., Ahmed, B., and Schnupp, J. W. (2006). Tuning to natural stimulus dynamics in primary auditory cortex. Curr. Biol. 16, 264–271.
Geffen, M. N., de Vries, S. E. J., and Meister, M. (2007). Retinal ganglion cells can rapidly change polarity from off to on. PLoS Biol. 5, e65–e65. doi: 10.1371/journal.pbio.0050188
Geffen, M. N., Broome, B. M., Laurent, G., and Meister, M. (2009). Neural encoding of rapidly fluctuating odors. Neuron 61, 570–586.
Goblick, T. J. J., and Pfeiffer, R. R. (1969). Time-domain measurements of cochlear nonlinearities using combination click stimuli. J. Acoust. Soc. Am. 46, 924–938.
Gourevitch, B., and Eggermont, J. J. (2008). Spectro-temporal sound density-dependent long-term adaptation in cat primary auditory cortex. Eur. J. Neurosci. 27, 3310–3321.
Holmstrom, L. A., Eeuwes, L. B., Roberts, P. D., and Portfors, C. V. (2010). Efficient encoding of vocalizations in the auditory midbrain. J. Neurosci. 30, 802–819.
Hromadka, T., Deweese, M. R., and Zador, A. M. (2008). Sparse representation of sounds in the unanesthetized auditory cortex. PLoS Biol. 6, e16. doi: 10.1371/journal.pbio.0060016
Hromadka, T., and Zador, A. M. (2009). Representations in auditory cortex. Curr. Opin. Neurobiol. 19, 430–433.
Hsu, A., Woolley, S. M., Fremouw, T. E., and Theunissen, F. E. (2004). Modulation power and phase spectrum of natural sounds enhance neural encoding performed by single auditory neurons. J. Neurosci. 24, 9201–9211.
Leighton, T. G., and Walton, A. J. (1987). An experimental study of the sound emitted from gas bubbles in a liquid. Eur. J. Phys. 8, 98–104.
Leighton, T. G., Wilkinson, M., Walton, A. J., and Field, J. E. (1990). Studies of non-linear bubble oscillations in a simulated acoustic field. Eur. J. Phys. 11, 352–358.
Lesica, N. A., and Grothe, B. (2008). Efficient temporal processing of naturalistic sounds. PLoS ONE 3, e1655. doi: 10.1371/journal.pone.0001655
McDermott, J. H., Oxenham, A. J., and Simoncelli, E. P. (2009). “Sound texture synthesis via filter statistics,” in IEEE Workshop on Applications of Signal Processing to Audio and Acoustics, New Paltz, NY.
McDermott, J. H., Wrobleski, D., and Oxenham, A. J. (2011). Recovering sound sources from embedded repetition. Proc. Natl. Acad. Sci. U.S.A. 108, 1188–1193.
Minnaert, M. (1933). On musical air bubbles and the sounds of running water. Philos. Mag. 16, 235–248.
Nelken, I., Rotman, Y., and Bar Yosef, O. (1999). Responses of auditory-cortex neurons to structural features of natural sounds. Nature 397, 154–157.
O’Connor, K. N., Petkov, C. I., and Sutter, M. L. (2005). Adaptive stimulus optimization for auditory cortical neurons. J. Neurophysiol. 94, 4051–4067.
Olshausen, B. A., and Field, D. J. (1996). Emergence of simple-cell receptive field properties by learning a sparse code for natural images. Nature 381, 607–609.
Overath, T., Kumar, S., von Kriegstein, K., and Griffiths, T. D. (2008). Encoding of spectral correlation over time in auditory cortex. J. Neurosci. 28, 13268–13273.
Rieke, F., Bodnar, D. A., and Bialek, W. (1995). Naturalistic stimuli increase the rate and efficiency of information transmission by primary auditory afferents. Proc. Biol. Sci. 262, 259–265.
Rodriguez, F. A., Chen, C., Read, H. L., and Escabi, M. A. (2010). Neural modulation tuning characteristics scale to efficiently encode natural sound statistics. J. Neurosci. 30, 15969–15980.
Ruderman, D. L., and Bialek, W. (1994). Statistics of natural images: scaling in the woods. Phys. Rev. Lett. 73, 814–817.
Sharpee, T. O., Miller, K. D., and Stryker, M. P. (2008). On the importance of static nonlinearity in estimating spatiotemporal neural filters with natural stimuli. J. Neurophysiol. 99, 2496–2509.
Sigman, M., Cecchi, G. A., Gilbert, C. D., and Magnasco, M. O. (2001). On a common circle: natural scenes and Gestalt rules. Proc. Natl. Acad. Sci. U.S.A. 98, 1935–1940.
Simoncelli, E. P., and Olshausen, B. A. (2001). Natural image statistics and neural representation. Annu. Rev. Neurosci. 24, 1193–1216.
Singh, N. C., and Theunissen, F. E. (2003). Modulation spectra of natural sounds and ethological theories of auditory processing. J. Acoust. Soc. Am. 114, 3394–3411.
Turner, R. E., and Sahani, M. (2008). Modeling natural sounds with modulation cascade processes. Adv. Neural Inf. Process Syst. 20, 1–8.
van Den Doel, K. (2004). “Physically-based models for liquid sounds,” in Proceedings of the ICAD 04 – Tenth Meeting of the Intervational Conference on Auditory Display, ICAD04–1, Sydney.
Vinje, W. E., and Gallant, J. L. (2002). Natural stimulation of the nonclassical receptive field increases information transmission efficiency in V1. J. Neurosci. 22, 2904–2915.
Keywords: auditory, perception, scale-invariance, psychophysics, coherence, temporal adaptation, receptive field
Citation: Geffen MN, Gervain J, Werker JF and Magnasco MO (2011) Auditory perception of self-similarity in water sounds. Front. Integr. Neurosci. 5:15. doi: 10.3389/fnint.2011.00015
Received: 16 March 2011;
Paper pending published: 06 April 2011;
Accepted: 22 April 2011;
Published online: 11 May 2011.
Edited by:
Sidarta Ribeiro, Edmond and Lily Safra International Institute of Neuroscience of Natal, BrazilReviewed by:
Mariano Sigman, Universidad de Buenos Aires, ArgentinaAdriano BL Tort, Edmond and Lily Safra International Institute of Neuroscience of Natal, Brazil
Copyright: © 2011 Geffen, Gervain, Werker and Magnasco. This is an open-access article subject to a non-exclusive license between the authors and Frontiers Media SA, which permits use, distribution and reproduction in other forums, provided the original authors and source are credited and other Frontiers conditions are complied with.
*Correspondence: Maria N. Geffen, Department of Otorhinolaryngology – Head and Neck Surgery, Department of Neuroscience University of Pennsylvania School of Medicine, 5 Ravdin, 3400 Spruce Street, Philadelphia, PA 19104, USA. e-mail:bWdlZmZlbkBtZWQudXBlbm4uZWR1