 Bob Jacobs1*
 Nicholas L. Johnson1
 Devin Wahl1
 Matthew Schall1Busisiwe C. Maseko2Albert Lewandowski3
 Mary A. Raghanti4Bridget Wicinski5
 Camilla Butti5
 William D. Hopkins6
 Mads F. Bertelsen7Timothy Walsh8John R. Roberts8
 Roger L. Reep9
 Patrick R. Hof5
 Chet C. Sherwood10
 Paul R. Manger2
- 1Laboratory of Quantitative Neuromorphology, Psychology, Colorado College, Colorado Springs, CO, USA
- 2Faculty of Health Sciences, School of Anatomical Sciences, University of the Witwatersrand, Johannesburg, South Africa
- 3Cleveland Metroparks Zoo, Cleveland, OH, USA
- 4Department of Anthropology, Kent State University, Kent, OH, USA
- 5Fishberg Department of Neuroscience and Friedman Brain Institute, Icahn School of Medicine at Mount Sinai, New York, NY, USA
- 6Division of Developmental and Cognitive Neuroscience, Yerkes National Primate Research Center, Atlanta, GA, USA
- 7Center for Zoo and Wild Animal Health, Copenhagen Zoo, Frederiksberg, Denmark
- 8Smithsonian National Zoological Park, Washington, DC, USA
- 9Department of Physiological Sciences, University of Florida, Gainesville, FL, USA
- 10Department of Anthropology, The George Washington University, Washington, DC, USA
A corrigendum on
Comparative neuronal morphology of the cerebellar cortex in afrotherians, carnivores, cetartiodactyls, and primates
by Jacobs, B., Johnson, N. L., Wahl, D., Schall, M., Maseko, B. C., Lewandowski, A., et al. (2014) Front. Neuroanat. 8:24. doi: 10.3389/fnana.2014.00024
There was a typographical error in Table 2 of Jacobs et al. (2014) as one partial row of data is repeated. Specifically, for Vol., the values for the Clouded Leopard Stellate cells are repeated in place of the Granule cells. For the Clouded Leopard Granule cells, the values should NOT be the following:
Mean = 691.9, SD = 222.2, L95% = 247.4, U95% = 1136.4.
Instead, these values should be:
Mean = 51.4, SD = 32.9, L95% = −14.4, U95% = 117.3.
None of the corrections are in bold font.
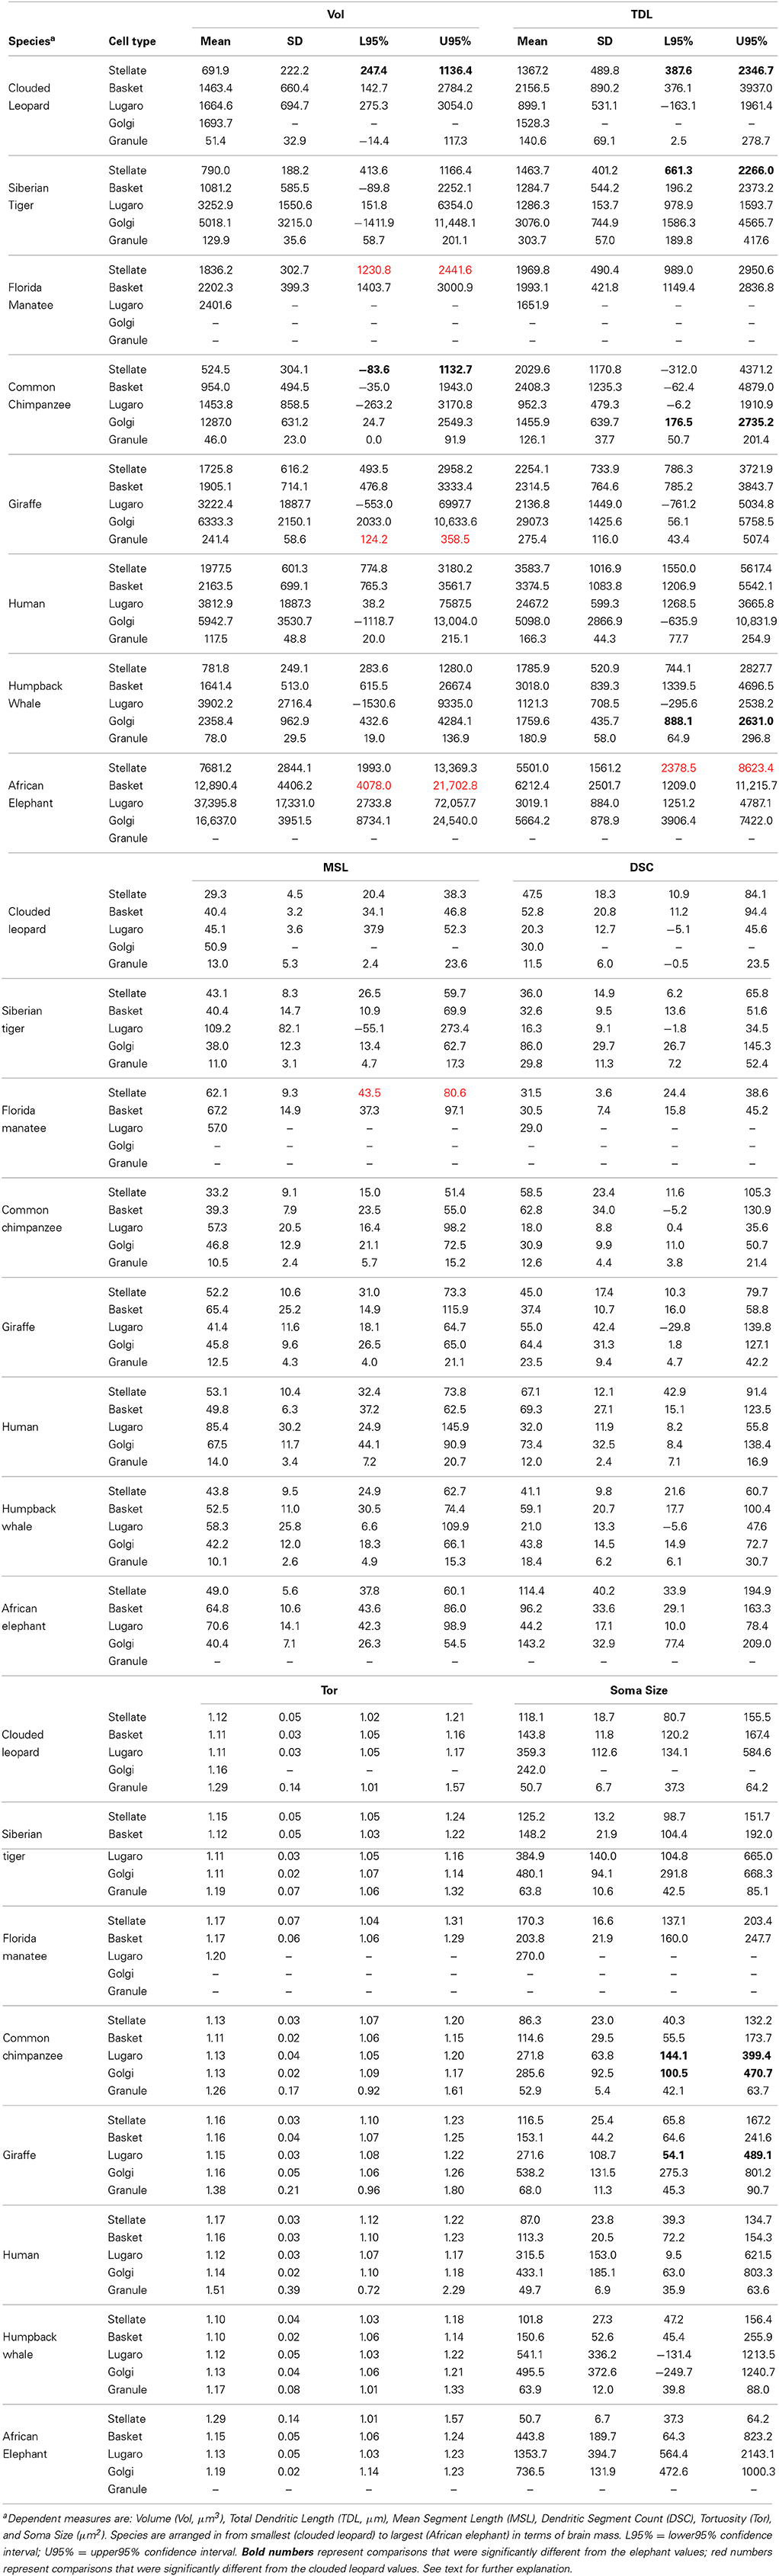
Table 2. Dendritic measures and soma size for each neuronal type across speciesa.
Conflict of Interest Statement
The authors declare that the research was conducted in the absence of any commercial or financial relationships that could be construed as a potential conflict of interest.
Keywords: dendrite, morphometry, Golgi method, brain evolution, cerebellum
Citation: Jacobs B, Johnson NL, Wahl D, Schall M, Maseko BC, Lewandowski A, Raghanti MA, Wicinski B, Butti C, Hopkins WD, Bertelsen MF, Walsh T, Roberts JR, Reep RL, Hof PR, Sherwood CC and Manger PR (2014) Corrigendum: Comparative neuronal morphology of the cerebellar cortex in afrotherians, carnivores, cetartiodactyls, and primates. Front. Neuroanat. 8:69. doi: 10.3389/fnana.2014.00069
Received: 02 June 2014; Accepted: 27 June 2014;
Published online: 23 July 2014.
Edited and reviewed by: Suzana Herculano-Houzel, Universidade Federal do Rio de Janeiro, Brazil
Copyright © 2014 Jacobs, Johnson, Wahl, Schall, Maseko, Lewandowski, Raghanti, Wicinski, Butti, Hopkins, Bertelsen, Walsh, Roberts, Reep, Hof, Sherwood and Manger. This is an open-access article distributed under the terms of the Creative Commons Attribution License (CC BY). The use, distribution or reproduction in other forums is permitted, provided the original author(s) or licensor are credited and that the original publication in this journal is cited, in accordance with accepted academic practice. No use, distribution or reproduction is permitted which does not comply with these terms.
*Correspondence:YmphY29ic0Bjb2xvcmFkb2NvbGxlZ2UuZWR1