 Rodrigo S. Kazu1,2
 Bruno Mota
 Paul R. Manger
 Suzana Herculano-Houzel
- 1Instituto de Ciências Biomédicas, Universidade Federal do Rio de Janeiro, Rio de Janeiro, Brazil
- 2Instituto Nacional de Neurociência Translacional, CNPq/MCT, São Paulo, Brazil
- 3Microbrightfield Biosciences, Burlington, VT, USA
- 4Instituto de Física, Universidade Federal do Rio de Janeiro, Rio de Janeiro, Brazil
- 5School of Anatomical Sciences, University of the Witwatersrand, Johannesburg, South Africa
A Corrigendum on
Cellular scaling rules for the brain of Artiodactyla include a highly folded cortex with few neurons
by Kazu, R. S., Maldonado, J., Mota, B., Manger, P. R., and Herculano-Houzel, S. (2014). Front. Neuroanat. 8:128. doi: 10.3389/fnana.2014.00128
It has come to our attention that some of the data presented in Table 1, on the mass, numbers of neurons and densities of brain structures in Artiodactyla, required minor corrections. Specifically, while the legend informed that total values for the cerebral cortex included the hippocampus (as in our previous studies), we recently realized that values for the hippocampus had in four cases been included in the rest of brain, not cerebral cortex, in Table 1, and had failed to be included for Damaliscus. There were a few other minor mistakes in the table that are now also corrected in Table 1 below.
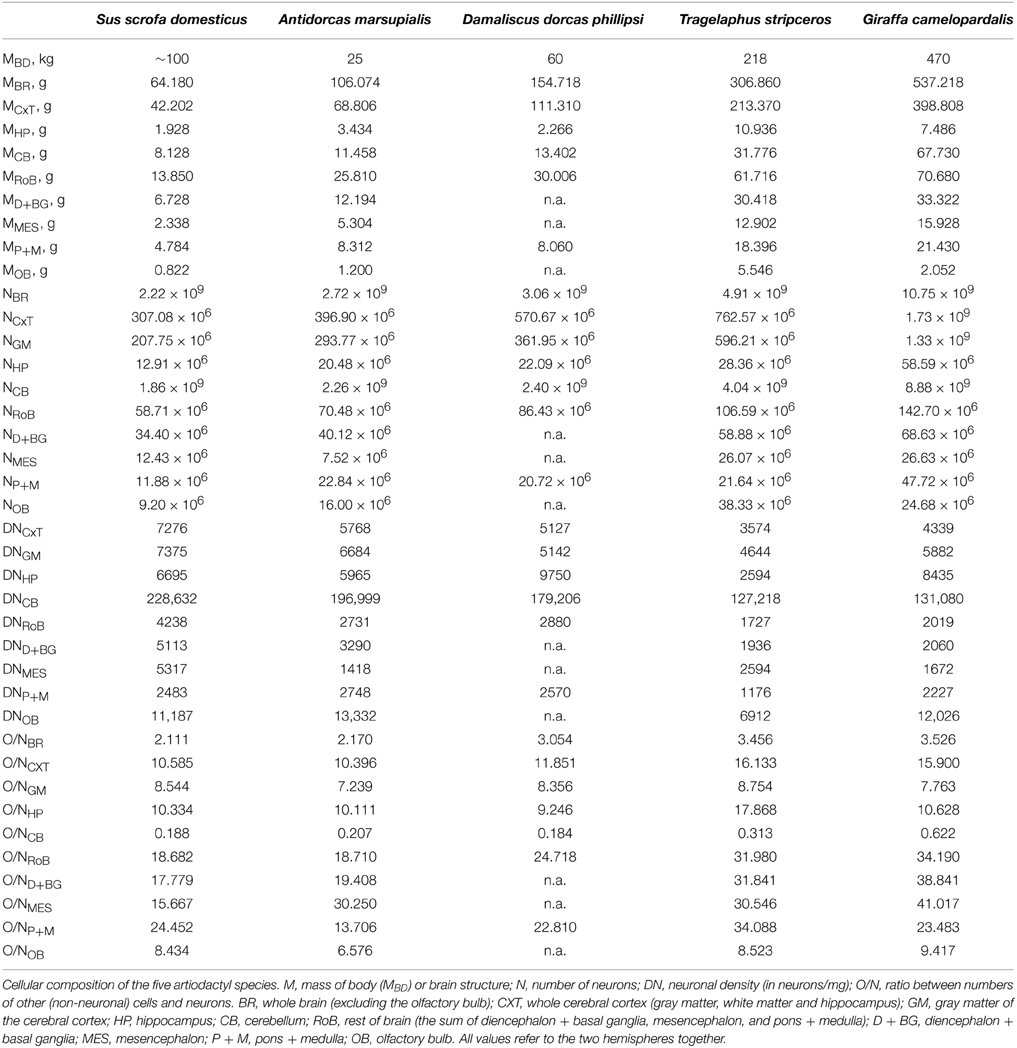
Table 1. Cellular composition of Artiodactyla brains.
While these corrections do not modify in any way the conclusions of the paper, some of the power exponents reported were influenced in minor, non-significant ways. Those corrected power exponents are also provided below.
Corrections in text:
p. 4 – Brain mass varies 8.4-fold, number of brain neurons varies 4.8-fold.
Corrected relationships and power functions:
p. 4, Figure 3A – Brain mass increases as a power function of body mass with a small exponent of 0.548 ± 0.038 (p = 0.0048).
p. 4, Figure 3C – The total number of brain neurons increases as a power function of body mass with an exponent of 0.448 ± 0.115 (p = 0.0598).
p. 5 – The relative mass of the rest of brain does not decrease significantly with increasing brain mass (Spearman correlation, ρ = −0.800, p = 0.1041).
p. 7 – The cerebral cortex has only 15.7 ± 0.8% of all brain neurons, despite representing 69.5 ± 1.8% of brain mass, and the rest of brain, which accounts for 19.6 ± 1.8% of brain mass, has only 2.3 ± 0.3% of all brain neurons.
p. 7, Figure 4A – Total brain mass varies as a power function of its number of neurons with an exponent of 1.288 ± 0.215 (r2 = 0.923, p = 0.0093).
p. 7, Figure 4B – The relationship between the mass of the cerebral cortex and its number of neurons has an exponent of 1.303 ± 0.154 (p = 0.0035) including the giraffe, and 1.721 ± 0.123 (r2 = 0.990, p = 0.0051) excluding the giraffe.
p. 7, Figure 4D – The mass of the rest of brain scales as a power function of its number of neurons across artiodactyls with an exponent of 1.850 ± 0.303 (r2 = 0.925, p = 0.0089).
p. 7, Figure 5A – The relationship between mass of each brain structure (cerebral cortex, cerebellum and rest of brain) and number of other (non-neuronal) cells can be described as a single power function of exponent 0.859 ± 0.047 (p < 0.0001).
p. 7, Figure 5B – Whole brain mass varies as a similar function of numbers of other cells across artiodactyls (exponent 0.986 ± 0.089, p = 0.0016) (…) and all clades together (exponent, 1.040 ± 0.020, p < 0.0001).
p. 8 – Neuronal density in the cerebral cortex (gray + white matter + hippocampus) varies between 3574 neurons/mg in the greater kudu to 7276 neurons/mg in the pig (…) and in the rest of brain, from 1727 neurons/mg in the greater kudu to 4238 neurons/mg in the pig. p. 9, Figure 6A – Neuronal density in the artiodactyl cerebral cortex (minus the giraffe) decreases with increasing cortical mass, as a power function of exponent −0.425 ± 0.041 (p = 0.0093).
p. 9, Figure 6A – In the rest of brain, neuronal density also decreases significantly as a power function of increasing structure mass (exponent, −0.500 ± 0.082, p = 0.0089).
p. 10, Figure 7 – The O/N ratio varies between 0.184 (in the blesbok cerebellum) and 34.190 (in the giraffe rest of brain). The O/N ratio varies within the cortical gray matter alone between 7.2 and 8.8 across species.
p. 10, Figure 7B – The O/N ratio varies as a common power function of neuronal density across all artiodactyl structures with an exponent of −1.087 ± 0.032 (p < 0.0001).
p. 10 – The addition of artiodactyl structures does not change the exponent significantly (−0.935 ± 0.021, p < 0.0001).
p. 11 – N/A is 2–6 times smaller in artiodactyls (19,902 ± 1253 neurons/mm2) than in primates.
p. 11, Figure 8C – Cortical surface area increases with numbers of neurons raised to an exponent of 1.362 ± 0.094 across artiodactyls (p = 0.0047).
p. 11 – Gray matter thickness increases with number of cortical neurons raised to the power of 0.630 ± 0.089 in artiodactyls (minus the giraffe; p = 0.0192).
p. 13 – Predictions for cetaceans: The prediction is given by the equation NCXT = e17.168±0.053. M0.633±0.024CXT.
p. 14 – Using the cortical volume given (…) we predict the cerebral cortex (…) to be composed of 1.14, 1.99, 2.44, and 3.56 billion neurons, respectively.
Conflict of Interest Statement
The authors declare that the research was conducted in the absence of any commercial or financial relationships that could be construed as a potential conflict of interest.
Keywords: evolution, brain size, number of neurons, gyrification, cell size
Citation: Kazu RS, Maldonado J, Mota B, Manger PR and Herculano-Houzel S (2015) Corrigendum: Cellular scaling rules for the brain of Artiodactyla include a highly folded cortex with few neurons. Front. Neuroanat. 9:39. doi: 10.3389/fnana.2015.00039
Received: 02 March 2015; Accepted: 12 March 2015;
Published: 26 March 2015.
Edited and reviewed by: Patrick R. Hof, Icahn School of Medicine at Mount Sinai, USA
Copyright © 2015 Kazu, Maldonado, Mota, Manger and Herculano-Houzel. This is an open-access article distributed under the terms of the Creative Commons Attribution License (CC BY). The use, distribution or reproduction in other forums is permitted, provided the original author(s) or licensor are credited and that the original publication in this journal is cited, in accordance with accepted academic practice. No use, distribution or reproduction is permitted which does not comply with these terms.
*Correspondence: Suzana Herculano-Houzel,c3V6YW5haGhAZ21haWwuY29t