 Abdelkrim Khadir1†
 Sina Kavalakatt1†
 Preethi Cherian1Samia Warsame1
 Jehad Ahmed Abubaker1Mohammed Dehbi2
 Ali Tiss1*
- 1Research Division, Dasman Diabetes Institute, Kuwait City, Kuwait
- 2Diabetes Research Centre, Qatar Biomedical Research Institute, Hamad Bin Khalifa University, Qatar Foundation, Doha, Qatar
Heat shock protein 60 (HSP60) is a key protein in the crosstalk between cellular stress and inflammation. However, the status of HSP60 in diabetes and obesity is unclear. In the present study, we investigated the hypothesis that HSP60 expression levels in the adipose tissue of human obese adults with and without diabetes are different and physical exercise might affect these levels. Subcutaneous adipose tissue (SAT) and blood samples were collected from obese adults with and without diabetes (n = 138 and n = 92, respectively, at baseline; n = 43 for both groups after 3 months of physical exercise). Conventional RT-PCR, immunohistochemistry, immunofluorescence, and ELISA were used to assess the expression and secretion of HSP60. Compared with obese adults without diabetes, HSP60 mRNA and protein levels were decreased in SAT in diabetic obese together with increased inflammatory marker expression and glycemic levels but lower VO2 Max. More interestingly, a 3-month physical exercise differentially affected HSP60 expression and the heat shock response but attenuated inflammation in both groups, as reflected by decreased endogenous levels of IL-6 and TNF-α. Indeed, HSP60 expression levels in SAT were significantly increased by exercise in the diabetes group, whereas they were decreased in the non-diabetes group. These results were further confirmed using immunofluorescence microscopy and anti-HSP60 antibody in SAT. Exercise had only marginal effects on HSP60 secretion and HSP60 autoantibody levels in plasma in both obese with and without diabetes. Physical exercise differentially alleviates cellular stress in obese adults with and without diabetes despite concomitant attenuation of the inflammatory response.
Introduction
Obesity and type 2 diabetes (T2D) are global public health problems affecting both people’s quality of life and socioeconomics around the globe (1). The pathophysiology of these metabolic diseases is closely linked, with the resulting insulin resistance (IR) as the cause of several health comorbidities (2). IR has been demonstrated to be associated with various micro- and macrovascular complications (3). However, in obesity, the risk for these complications differs among individuals, as a significant proportion of obese people are metabolically healthy (4). Thus, the degree of metabolic dysregulation is a determinant of future complications in obese people.
The heat shock response (HSR) is a major stress adaptation mechanism that prevents insults to tissues, through a set of highly conserved proteins called heat shock proteins (HSPs) (5, 6). Some members of HSP are ubiquitously expressed, whereas others are expressed upon stress insults highlighting the critical role of HSP in maintaining cellular homeostasis. HSP can also be released into the circulation and exert an immune-stimulatory effect by interacting with pattern recognition receptors, such as toll-like receptors, and consequently activate the host inflammatory response (7, 8). Previous research demonstrated that HSR is attenuated in patients with T2D; in particular, heat shock protein 72 (HSP72) expression was decreased in patients with diabetes (9). Moreover, HSP72 induction resulted in protective effects in humans with diabetes and diabetic animal models (10, 11). Specifically, HSP72 induction led to improved lipid accumulation in the liver and adipose tissue, reduced inflammatory signals, and improved insulin sensitivity. By contrast, we recently observed increased expression of major HSPs, including HSP72, in both adipose tissue and blood cells from obese people without diabetes (12). This finding suggests that in this population the HSR can resolve metabolic stresses attributable to obesity, thus highlighting differences in molecular pathophysiology between obese subjects with and without diabetes even though both conditions are associated with IR.
Another key member of the HSR, HSP60, is notable for its ability as mediator of immunity in several inflammatory diseases such as cancer, atherosclerosis, adjuvant arthritis, obesity, and diabetes (13, 14). HSP60 is mainly a mitochondrial chaperone, but its translocation to the cytosol and cell membrane and secretion into blood have been reported (15). Furthermore, the ability of HSPs to induce different stress-related responses according to their subcellular localization has been reported (16). It is reported that circulating HSPs can have immunostimulating or immunosuppressive effects, in an apparently contradictory effect, depending on the context and types of interacting partners (17–20). Accumulating evidence suggests that circulating HSP60 may contribute to cardiovascular disease associated with diabetes, supporting earlier observations regarding the association between HSP60 and atherosclerosis (13, 21). Recent findings demonstrated that autoimmunity to HSP60 contributes to metabolic dysregulation in a murine obesity model, which were partially reversed by HSP60 peptide treatment (22). In contrast, human HSP60 displayed protective effects against adjuvant arthritis and contributed to remission in juvenile idiopathic arthritis in humans (14). Likewise, another recent study revealed that HSP60 promotes tissue regeneration and wound healing by regulating inflammation in animal models such as db/db mice and zebrafish (23). Furthermore, HSPs, including HSP60 and its derived peptides, can protect allografts from Ischemia–reperfusion injury and improved graft survival through IL-10 induction (24). Finally, in a recent study morbid obese have displayed a sustainable decrease in circulating HSP60 levels after bariatric surgery intervention concomitantly with a decrease in CRP but not in IL-6 (25). However, the biological significance of extracellular HSP60 remains to be elucidated. Intracellular HSP60 has a complex function, given that it inhibits caspase-3 but facilitates the maturation of pro-caspase-3 to its active form (13). Furthermore, HSP60 is implicated in mitochondrial biogenesis, and this capacity to promote the folding of mitochondrial proteins appears crucial for its cytoprotective function (26).
Conversely, it was reported that HSP60 levels are decreased in the heart but increased in the kidneys and liver of diabetic rats, thus highlighting the tissue specificity of the alteration of HSP expression in diabetes (27). However, the effect of different degrees of adiposity and related IR on variations in intra- and extracellular HSP levels across individuals and its influence on metabolic diseases remain to be clarified. Therefore, this study was designed to investigate the status of HSP60 in obese subjects with and without diabetes and assess the effects of physical activity on its levels in these two groups.
Materials and Methods
Study Population
The study consisted of obese (30 kg/m2 ≤ BMI < 40 kg/m2) adult men (n = 120) and women (n = 110) (non-diabetes group, n = 138; diabetes group, n = 92). Informed written consent was obtained from all subjects before their participation in the study, which was approved by the Review Board of Dasman Diabetes Institute and conducted in line with principles of the Declaration of Helsinki. Participants who performed any physical exercise within the last 6 months prior to study entry and those with prior histories of major illness or the use of medications and/or supplements known to influence body composition or bone mass were excluded from the study. The physical, clinical, and biochemical characteristics of the participating subjects are shown in Table 1.
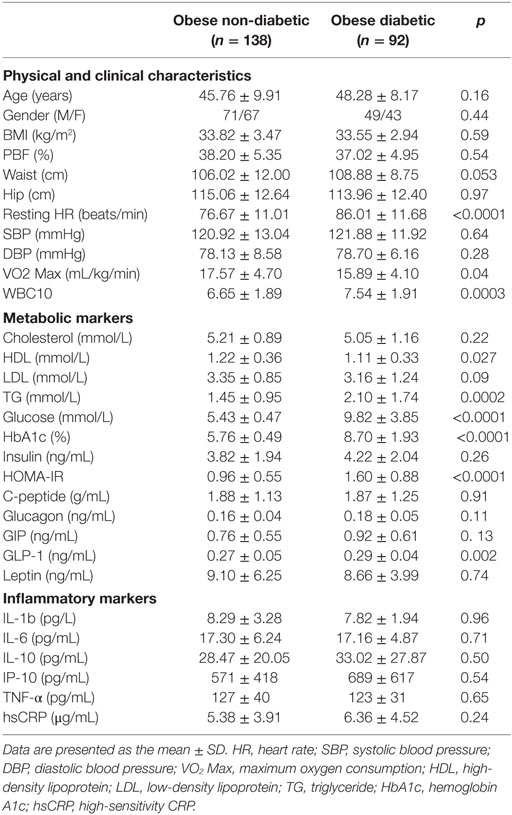
Table 1. Physical, clinical, and biochemical characteristics of the subjects at baseline.
Exercise Protocol and Anthropometric Measurements
All eligible subjects were enrolled in a supervised exercise program at the Fitness and Rehabilitation Center (FRC) of the Dasman Diabetes Institute as previously reported (28). Briefly, prior to exercise, each subject underwent an initial physical assessment to determine his or her maximum heart rate (max HR) as well as his or her response to aerobic exercise as measured by the maximum oxygen consumption (VO2 Max). The exercise regimen involved a combination of moderate-intensity aerobic exercise and resistance training using either a treadmill or stationary bicycle. Each exercise session included 10-min warm-up and cooldown steps at 50–60% max HR and 40 min of the prescribed exercise program at 65–80% max HR. For the duration of the 3-month period, participants exercised three times per week. All sessions were supervised by qualified fitness professionals at FRC to ensure that participants reached and maintained the recommended HR range. Anthropometric measurements were taken at baseline and after 3 months of exercise, and the intensity and duration of exercise as well as blood pressure were recorded for each session. Whole-body composition was determined using an IOI 353 Body Composition Analyzer (Jawon Medical, Seoul, Korea).
Blood and Tissue Sampling
Venous peripheral blood and subcutaneous adipose tissue (SAT) biopsies were obtained at baseline and after 3 months of exercise. Plasma samples were prepared using EDTA Vacutainer tubes, aliquoted, and stored at −80°C. Subcutaneous superficial adipose tissue biopsies (approximately 0.5 g) were obtained from the periumbilical area via surgical biopsy after local anesthesia. Once removed, each biopsied tissue was rinsed in cold PBS, divided into four pieces, and stored appropriately until assayed.
Blood Inflammatory and Metabolic Markers
Glucose and lipid profiles were measured using a Siemens Dimension RXL chemistry analyzer (Diamond Diagnostics, Holliston, MA, USA). Hemoglobin A1c (HbA1c) levels were determined using the Variant™ device (BioRad, Hercules, CA, USA). Insulin and high-sensitivity CRP (hsCRP) levels were determined using a Mercodia Insulin ELISA Kit (Mercodia AB, Uppsala, Sweden) and an hsCRP ELISA kit (Biovendor, Asheville, NC, USA), respectively. Plasma levels of inflammatory and metabolic markers were measured using bead-based multiplexing technology on a Bioplex-200 system (BioRad). All of the aforementioned assays were performed according to the manufacturers’ instructions. The Homeostatic Model Assessment of Insulin Resistance (HOMA-IR) index was calculated using the following formula: HOMA-IR = (glucose × insulin)/22.5.
Immunohistochemistry (IHC) and Immunofluorescence (IF)
Formalin-fixed, paraffin-embedded SAT sections were used for IHC and IF investigations as described previously (12, 28). Anti-HSP60 (Enzo LifeSciences, Inc., Lausen, Switzerland), anti-TNF-α (Abcam, Inc., Cambridge, MA, USA), and anti-IL-6 antibodies (Novus Biologicals, LLC, Littleton, CO, USA) were used for IHC. Quantification of the IHC data was performed using ImageScope software version 11.1 (Aperio, Vista, CA, USA) as previously reported (12). For IF staining, tissue sections were incubated with an Alexa Fluor® 488-conjugated anti-HSP60 antibody (Bioss Inc., Woburn, MA, USA). DAPI was used at 0.05% for nuclear staining. The sections were analyzed using a Zeiss LSM 710 confocal laser-scanning microscope, and fluorescent images of the representative areas of the adipose tissue were photographed using a × 40 objective.
Quantitative Real time (qRT)-PCR
Total RNA was extracted from frozen adipose tissue using an RNeasy Lipid Tissue Mini Kit (Qiagen, Inc., Valencia, CA, USA). cDNA was synthesized from total RNA samples using High Capacity cDNA Reverse Transcription Kits (Applied Biosystems, Foster City, CA, USA). Conventional qRT-PCR was performed on a Rotor Gene Q-100 system using SYBR Green normalized to GAPDH (Qiagen). The relative gene expression between the groups was assessed using the ΔΔCT method (29), and GAPDH was used as internal control for normalization. Primers used for validation are displayed in Table S1 in Supplementary Material.
Quantification of Circulating Proteins by ELISA
Plasma levels of HSP60 were measured by using a sandwich immunoassay EIA kit (ADI-EKS-600, Enzo, PA, USA). Plasma levels of anti-HSP60 IgG/A/M were measured using an ELISA kit (ADI-EKS-650, Enzo). Samples were diluted 1:2 before analysis for HSP60. After optimization, undiluted serum samples were used to measure anti-HSP60 IgG/IgA/IgM levels. All assays were performed according to the manufacturer’s instructions. Absorbance was measured at 450 nm on an H4 Synergy plate reader (Biotek, Winooski, VT, USA).
Statistical Analysis
Statistical analyses were performed using SPSS software (v22.0; SPSS Inc., Chicago, IL, USA). Unless otherwise stated, all descriptive statistics for the variables in the study were reported as the mean ± SD. Normality tests were run to assess the data distribution. A parametric t-test was used for variables with normal distributions to assess the significance of differences in means between the groups before exercise, whereas the Mann–Whitney non-parametric t-test was used for the skewed variables. A paired t-test was used to determine the significance of differences in means inside non-diabetic and diabetic groups before and after exercise. To evaluate the effect of groups and exercise intervention as well as their combination, we conducted two-way repeated measures analysis of variance (ANOVA). Effect sizes and homogeneity for ANOVA outcomes were examined using partial eta-squared, Box’s M test and Levene’s test of equality. For all analysis, differences were considered statistically significant at p < 0.05.
Results
Baseline Characteristics of the Study Population and the Effects of Physical Exercise
The anthropometric, clinical, and metabolic characteristics of the subjects are summarized in Table 1. There were no significant differences between the two groups regarding gender, age, waist or hip circumference, BMI, percent body fat (PBF), and blood pressure. Subjects in the diabetes group had a significantly higher resting HR and a significantly lower VO2 Max than those in the non-diabetes group. Concerning lipid profiles, the diabetes group had higher triglyceride (TG) levels but lower HDL levels, whereas total cholesterol and LDL levels were similar between the two groups. Although fasting blood glucose (FBG), HbA1c, and HOMA-IR values were significantly higher in the diabetes group, there was no difference between the two groups regarding serum insulin or C-peptide concentrations in the blood. Furthermore, GLP-1 levels were higher in the diabetes group (p = 0.02), whereas leptin, glucagon, and GIP levels were similar between the two groups. Finally, no significant difference was detected between the two groups concerning all inflammatory markers assayed (Table 1).
Physical exercise is considered the first-line non-pharmacologic treatment for preventing and managing lifestyle-related diseases. Our group and others have previously demonstrated the beneficial effects of physical exercise on the expression and secretion of stress proteins (12, 30). In this study, we performed a pairwise comparison of physical, clinical, and metabolic parameters in the diabetes and non-diabetes groups (n = 43, each) before and after physical exercise, the results of which are displayed in Tables 2 and 3, respectively. For the non-diabetes group, significant decreases were observed in adiposity markers (BMI, waist circumference, and PBF) after exercise (p ≤ 0.01). Likewise, we detected significant decreases in systolic and diastolic blood pressure (p < 0.01 and p < 0.05, respectively), along with an improvement of VO2 Max (p < 0.001). Furthermore, physical exercise decreased glycemic index markers such as insulin, HOMA-IR, and C-peptide values (p < 0.01, p = 0.05, and p < 0.05, respectively) in addition to a significant decrease in GIP levels (p = 0.005). Finally, our results revealed a trend toward increase for some circulating inflammation markers after physical exercise (Table 2). In the diabetes group, physical exercise had limited effects on physical parameters, as only waist circumference and VO2 Max were significantly improved (p < 0.05) (Table 3). However, superior improvements in metabolic markers were recorded in this group. Indeed, exercise significantly decreased metabolic markers such as cholesterol, HbA1c, C-peptide, glucagon, GIP, and GLP-1 levels (p < 0.05), whereas no effects were observed on inflammatory markers.
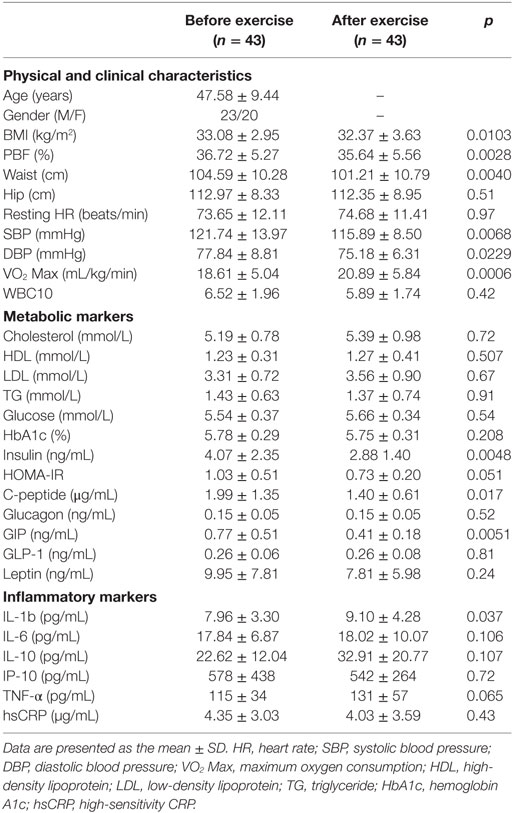
Table 2. Physical, clinical, and biochemical characteristics of obese subjects without diabetes before and after exercise.
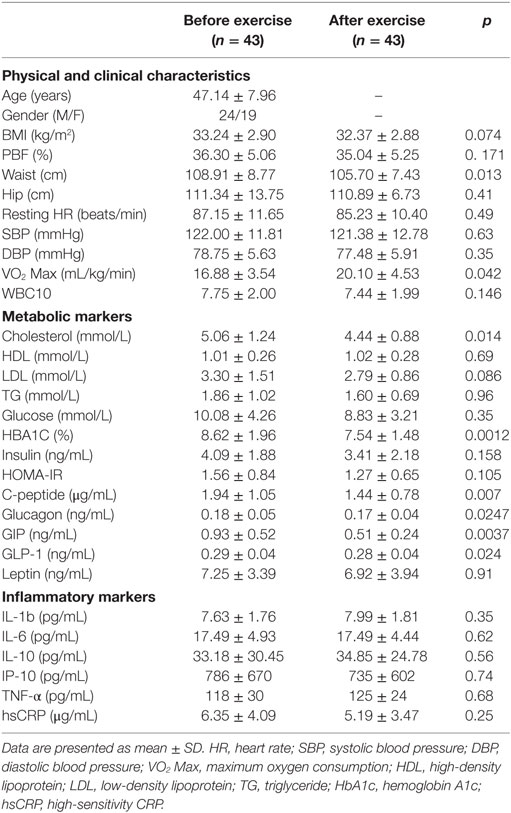
Table 3. Physical, clinical, and biochemical characteristics of the obese subjects with diabetes before and after exercise.
To further assess the effect of diabetes and exercise intervention as well as their combined effect, we used two-way ANOVA with repeated measures analysis. As displayed in Table 4, the separate effects of exercise and diabetes were in agreement with the results obtained using paired t-test in particular for adiposity and glycemic index markers. Interestingly, with ANOVA analysis, the exercise significantly increased circulating inflammatory markers (IL-1β, IL-6, TNF-α, and IL-10) and decreased WBC, while diabetes displayed significant effect on HR and TNF-α. The combined effect of both disease and intervention, however, did not show any significance for all analyzed markers except a borderline significance for VO2 Max.
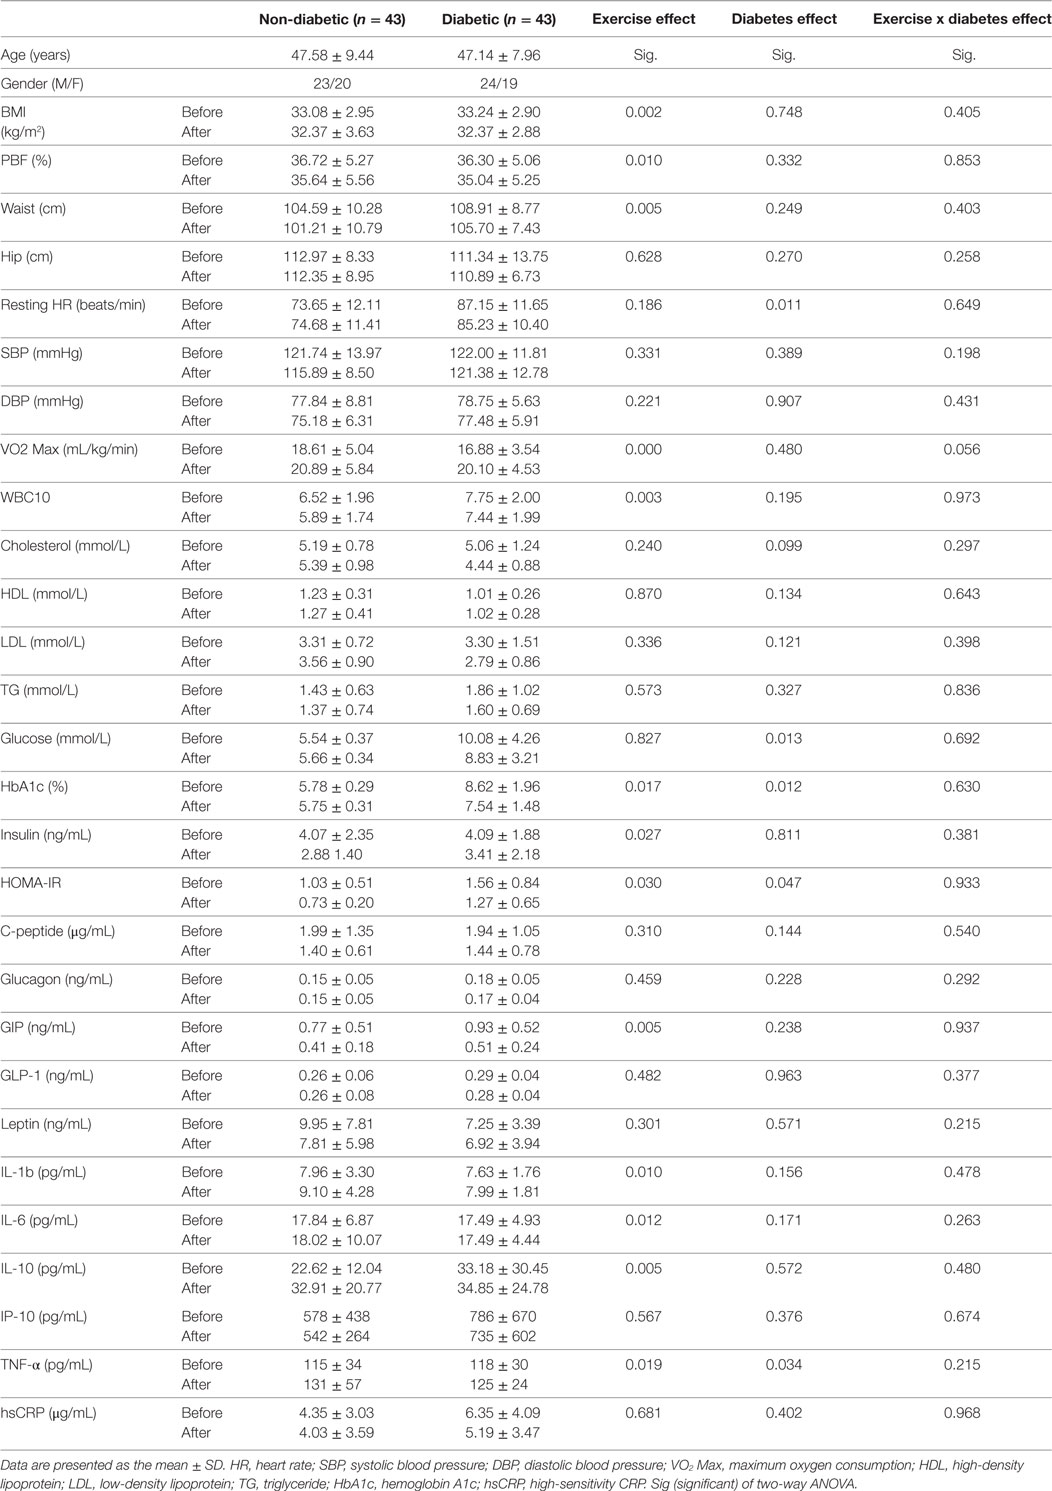
Table 4. Effect of diabetes and exercise on physical, clinical, and biochemical characteristics of the obese subjects using two-way ANOVA analysis.
HSP60 Differentially Expressed and Modulated by Physical Exercise in Obese Subjects with and without Diabetes
Decreased expression of HSPs, especially HSP72, has been widely reported in both human and animal models of IR and diabetes. By contrast, in previous work using SAT biopsies and PBMCs from obese patients without diabetes and their lean controls, we unexpectedly observed significant increases in HSP expression in obese subjects (12). As HSP60 is also involved in inflammation, a hallmark of diabetes, we assessed HSP60 expression levels in obese adults with and without diabetes. Our results revealed decreased expression of HSP60 at the protein (Figure 1A) and mRNA levels (Figure 1B) in SAT along with decreased HSP72 expression (Figure S1 in Supplementary Material) in the diabetes group. Using SAT and confocal IF microscopy, differential HSP60 patterns were confirmed between the groups (Figure 1C). Interestingly, the downregulation of HSP60 in adults with diabetes was concomitant with the increased expression of the tissue inflammatory cytokines produced by macrophage upon TLR or Th1 activation, IL-6 and TNF-α, as shown in Figure 2. HSP60 levels in blood serum were lower in the diabetes groups, whereas HSP60 autoantibody levels did not significantly differ between the two groups.
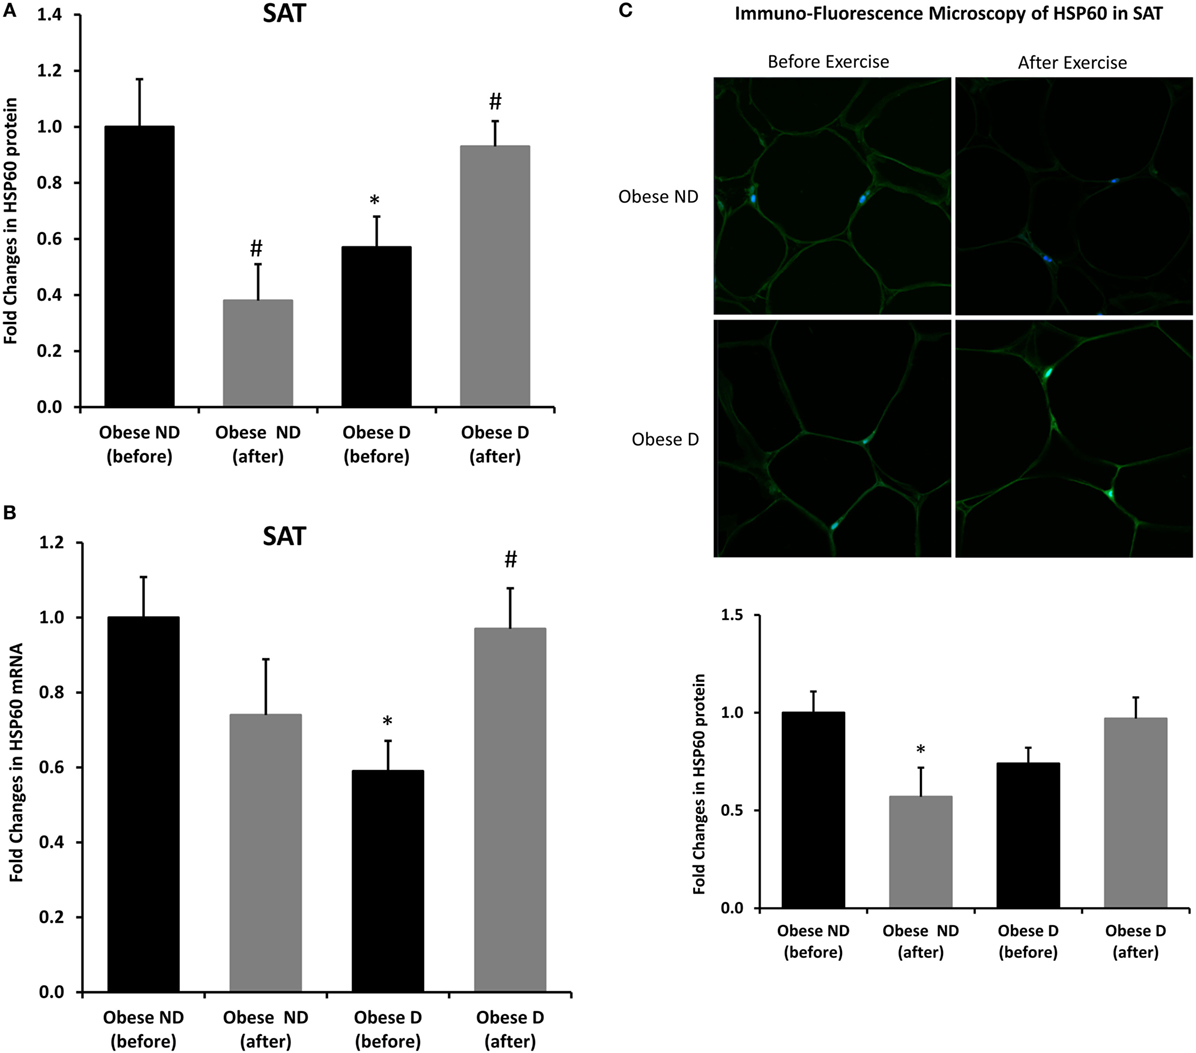
Figure 1. Decreased expression of HSP60 and modulation of its expression by exercise in the subcutaneous adipose tissue (SAT) of obese subjects with diabetes. (A) Immunohistochemical analysis of HSP60 expression in SAT sections from obese people without (ND) and with diabetes (D) before and after a 3-month physical exercise intervention (n = 10 for each group). (B) mRNA levels were measured by quantitative real-time PCR using SAT from obese subjects without (ND) and with diabetes (D) (n = 10 for each group) and normalized using GAPDH. Data are presented as fold changes in obese people with diabetes compared with the findings in the counterparts without diabetes. (C) Representative confocal immunofluorescence images illustrating HSP60 expression and localization in SAT from obese people without and with diabetes (n = 3 for each group). Densitometry quantification of the staining in SAT slides was performed as mentioned in Section “Materials and Methods.” The p-value was determined using the Mann–Whitney test for comparisons between the groups and using a paired t-test for intragroup comparisons before and after exercise. * denotes p < 0.05 between the diabetes and non-diabetes groups, and # denotes p < 0.05 between before and after exercise.
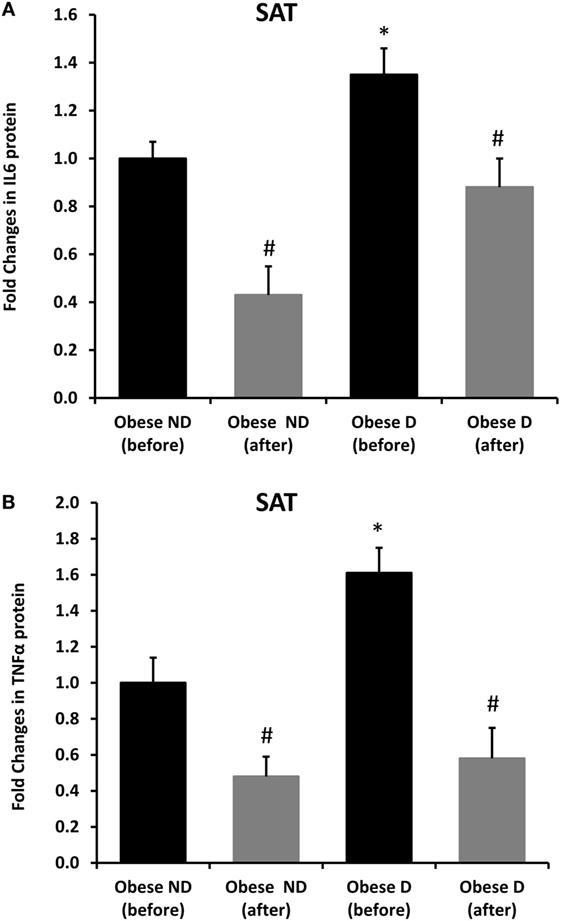
Figure 2. Increased inflammation and its modulation by exercise in the subcutaneous adipose tissue (SAT) of obese subjects with diabetes. Immunohistochemical analysis of (A) IL-6 and (B) TNF-α expression in SAT sections from obese people without (ND) and with diabetes (D) before and after 3 months of physical exercise (n = 10 for each group). Data are presented as fold changes in the diabetes group compared with the findings in the non-diabetes group. The p-value was determined using the Mann–Whitney test for comparisons between the diabetes and non-diabetes groups and using a paired t-test for intragroup comparisons before and after exercise. * denotes p < 0.05 between the diabetes and non-diabetes groups, and # denotes p < 0.05 between before and after exercise.
We further examined the effects of physical exercise on the expression and secretion of HSP60, and our results illustrated that exercise differentially affected HSP60 expression depending on the presence of diabetes. Indeed, HSP60 levels were increased in the diabetes group together with an increase in HSP72 levels, whereas clear decreases in IL-6 and TNF-α levels were noted in this group. However, an opposite pattern was observed in the non-diabetes group for HSP60 and HSP72, in addition to a decrease in inflammatory marker levels (Figures 1 and 2). Similarly, confocal IF microscopy confirmed the differential effect of physical exercise on HSP60 expression between the two groups. Finally, our physical exercise protocol did not significantly change the levels of circulating HSP60 and its autoantibodies in either study group, as shown in Figure 3. It is worth noting that the expression pattern of HSP60 was not related to gender as both males and females have shown similar trends for HSP60 levels in the SAT as well as in the blood before and after exercise intervention (data not shown).
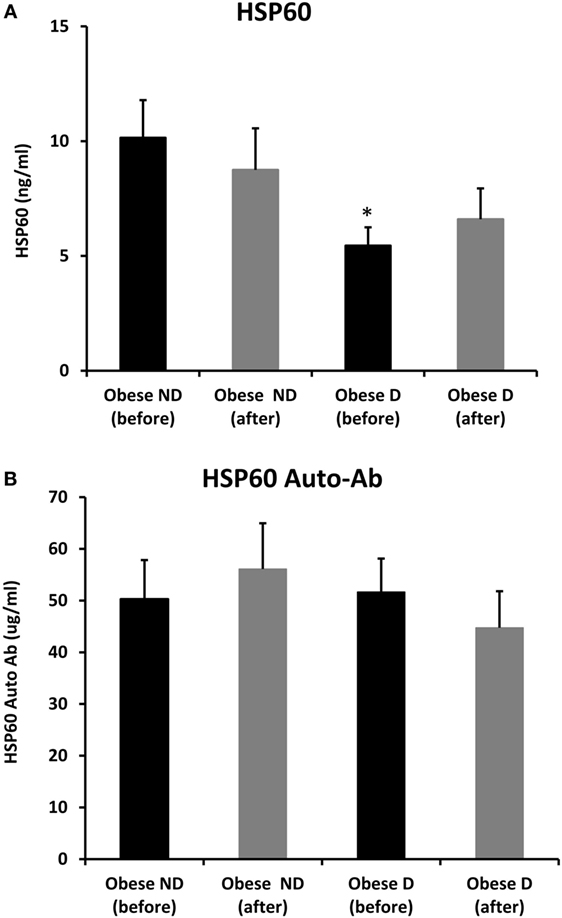
Figure 3. Secretion of HSP60 and HSP60 autoantibodies into blood. Circulating levels of (A) HSP60 protein and (B) HSP60 auto-Abs were measured by ELISA using plasma samples from obese people without (ND) and with diabetes (D) before and after a 3-month physical exercise intervention (n = 43 for each group). The p-value was determined using the Mann–Whitney test for comparisons between the diabetes and non-diabetes groups and using a paired t-test for intragroup comparisons before and after exercise. * denotes p < 0.05 between the diabetes and non-diabetes groups.
Discussion
Obese patients with diabetes have increased risks of morbidity and mortality compared with their non-diabetic counterparts, some of whom are metabolically healthy (31). HSP60 is a key protein involved in the crosstalk between metabolic stress and inflammation, as it participates in both the HSR and pro-inflammatory/anti-inflammatory processes. The aim of the present study was to assess the differential expression of HSP60 in the adipose tissue of obese adults with and without diabetes and its changes in response to physical exercise. Our main findings were as follows: (i) HSP60 levels were decreased in the diabetes group together with increased inflammatory and glycemic marker levels and lower fitness compared with the findings in the non-diabetes group; and (ii) moderate physical exercise differentially modulated HSP60 and HSR but attenuated inflammation in both groups, suggesting different beneficial effects between obese patients with and without diabetes.
The status of the HSR and differential expression of its major components between obese people with and without diabetes remain to be investigated, especially in adipose tissue. We previously reported that obesity increased the expression of HSR components in obese people without diabetes compared with their levels in normal-weight controls (12). Recently, we demonstrated that GRP78, another heat shock-induced chaperone participating in the unfolded protein response (UPR), was upregulated in obese people without diabetes, but its upregulation was more pronounced in obese people with diabetes (30). By contrast, other groups previously observed decreasing levels of HSPs in obese people (9, 11, 32, 33). However, these studies mainly used muscle tissue from obese people with diabetes and animal models, thus highlighting the possibility of tissue-specific expression patterns. In this study, in agreement with other findings, we found that HSP72 levels in SAT are clearly attenuated with a concomitant decrease in HSP60 expression in obese people with diabetes compared with the findings in obese people without diabetes. Another study illustrated that the ratio of HSP60 levels between visceral adipose tissue and SAT was higher in obese people with diabetes than in obese people without diabetes (34). This finding reflected either a decrease in HSP60 levels in SAT or an increase in its levels in visceral adipose tissue. Interestingly, in vivo and in vitro heat treatment differentially affected HSP expression patterns across adipose tissue depots, underscoring the fact that the HSR is also depot-specific (35). Moreover, Marker and colleagues (34) used primary adipocytes, and thus, differences in experimental procedures and types of samples, in this case biopsies versus primary cell culture, must be considered when attempting to reach a consensus concerning HSR response signaling. Moreover, our results indicated that blood HSP60 levels were lower in obese people with diabetes than in their counterparts without diabetes (Figure 3), in line with a previous report suggesting that lower blood HSP60 levels were associated with an increased diabetes risk in male patients (36). In our current study, we included both sexes, and our controls were obese people without diabetes. This attenuation in HSP60 expression and secretion into blood in obese people with diabetes might have resulted from chronic glucolipotoxicity rather than changes in insulin secretion. Indeed, our two study groups exhibited similar levels of insulin secretion markers (insulin and C-peptide), whereas people with diabetes exhibited higher glucose and TG levels despite receiving treatment for the disease. In support of this finding, we further compared HSP60 expression levels in SAT from lean people with and without diabetes using samples available from our previous study (12). Our results revealed that HSP60 levels were attenuated in lean subjects with diabetes along with increased expression of the inflammatory markers IL-6 and TNF-α, as observed in our obese subjects (Figure S2 in Supplementary Material). The fact that despite the clear increase in the levels of inflammatory markers in the adipose tissue of diabetic subjects, we have not observed significant difference in soluble inflammatory markers in the blood might be related to the treatment taken by the diabetic, known to impact cellular stress and inflammation (37). The WBC levels, however, were significantly higher in diabetic obese (Table 1) which supports further the hypothesis that inflammation is primarily cellular.
In obesity, an increased HSR is an adaptive response to chronic stress concomitant with increased local inflammation in SAT but not in the circulation (12). Similarly, obesity-induced inflammation could be an initial protective and adaptive mechanism in response to fat storage. Accordingly, inflammation is considered a catabolic process facilitating energy expenditure (38). In obese people with diabetes, however, the evidence illustrates that inflammation is worsened (39). This was explained by persistent oxidative stress due to glucolipotoxicity, hormone dysregulation, and inflammation, leading to downregulation of the HSR and the transcription factor HSF1 through a diverted UPR (40). In line with this finding, we previously reported an increased UPR in obese people with diabetes compared with the findings in their counterparts without diabetes (31). In this context, the association between HSP60 and diabetes is complex. Indeed, several lines of evidence suggest that HSP60 induces both pro-inflammatory and anti-inflammatory cytokines (41). It was reported that when HSP60 acts as a pro-inflammatory mediator, it plays a role in unresolved vascular inflammation, which is strongly associated with diabetes, thus highlighting the regulatory role of HSP60 in modulating the inflammatory processes in diabetes and linking mitochondrial stress to inflammation. Furthermore, reduced levels of HSP60 in diabetic patients might be reflective of lower mitochondrial content in adipose tissue and thus less mitochondrial biogenesis, required for adipogenesis and lipid metabolism. In support of this hypothesis, diabetic (db/db) mice displayed lower HSP60 and mitochondrial capacity than obese (ob/ob) mice and which were corrected by rosiglitazone, PPARγ agonist that alleviates IR and lowers glucose levels in type 2 diabetic rodents (42, 43) as well as in human patients (44). Finally, and due to its broad function, HSP60 may have a direct role in the development of IR as reported in mice with heterozygous deletion of HSP60, which displayed IR and reduced mitochondrial capacity, aside with increased inflammation (45).
Several observational studies reported a marked reduction in the incidence of diabetes among physically active individuals, suggesting that a healthy lifestyle remains an important non-pharmacologic intervention for preventing diabetes (46). One of the beneficial effects of exercise is the modulation of inflammation and metabolic stress (47). Thus, understanding the effect of exercise on the crosstalk between the HSR and inflammation in obesity and diabetes would clarify its molecular rationale. From this perspective, we investigated the effect of 3 months of exercise on HSP60 expression in our study population, and our results interestingly demonstrated that HSP60 expression was differentially modulated in SAT depending on the presence of diabetes. Our previous study revealed that in obese people, HSP expression was decreased relative to that in normal-weight controls (12). In the current study, we confirmed our previously published results, specifically for HSP60 and HSP72, using obese people without diabetes as a control group. However, in obese subjects with diabetes, exercise increased HSP60 and HSP72 levels. This upregulation was concomitant with decreased inflammation in the SAT of both groups due to the exercise intervention. The hypothesis regarding whether this differential response was due to greater compliance with the physical exercise protocol in one group or the inability of the other group to appropriately respond to the exercise training program was eliminated, as obviously, the effect was opposite and our exercise protocol was similarly prescribed to both groups under the supervision of experts at our FRC. Thus, the differential effects of physical exercise between the two groups might be explained by differences in metabolic flexibility and adaptation between the groups. Indeed, it was previously reported that the metabolism of free fatty acids (FFAs) during physical exercise was different between obese people with and without diabetes, as the utilization of plasma FFAs was reduced in the latter group (48). Moreover, people with diabetes exhibit increased flux of FFAs and glucose, which is associated with the excessive production of reactive oxygen species in adipocytes (49). These effects might lead to a decrease in the differentiation capacity of preadipocytes in subjects with diabetes, as previously reported (50), and thus a reduced response to physical exercise. Furthermore, we observed that exercise more effectively improved the expression of molecular markers of inflammation and metabolism in obese people without diabetes even though no major change in body weight was observed in either group. The fact that ANOVA analysis displayed significant increase in circulating inflammatory markers does not contradict the decreased levels of IL-6 and TNF-α in SAT. An initial increase of those circulating cytokines due to exercise has been suggested to be an adaptive process to exercise stress and highlighting the good side of a subclinical inflammation (38, 51). The beneficial effects of exercise are further supported by the decreased levels of WBC, known to be increased in diabetic and CVD subjects as previously reported (52).
As summarized in Figure 4, progression from a normal healthy status toward obesity and subsequently diabetes, increased fat accumulation, and metabolic dysregulation appears to be associated with the coordinated upregulation of the HSR and immune response in non-diabetic obese toward the development of an adaptive mechanism to cope with increased cellular stress. This HSR pattern is however reversed in diabetes, leading to an impaired response to exercise. A potential explanation of this differential effect is as follows: (i) in the case of obese without diabetes, exercise intervention has decreased the stress load on the SAT and the overall body and thus the HSR levels are attenuated, whereas (ii) in the case of obese with diabetes, the HSR as reflected by HSP60 is enhanced to cope with the persistent cellular dysregulated status despite the apparent decreased inflammation.
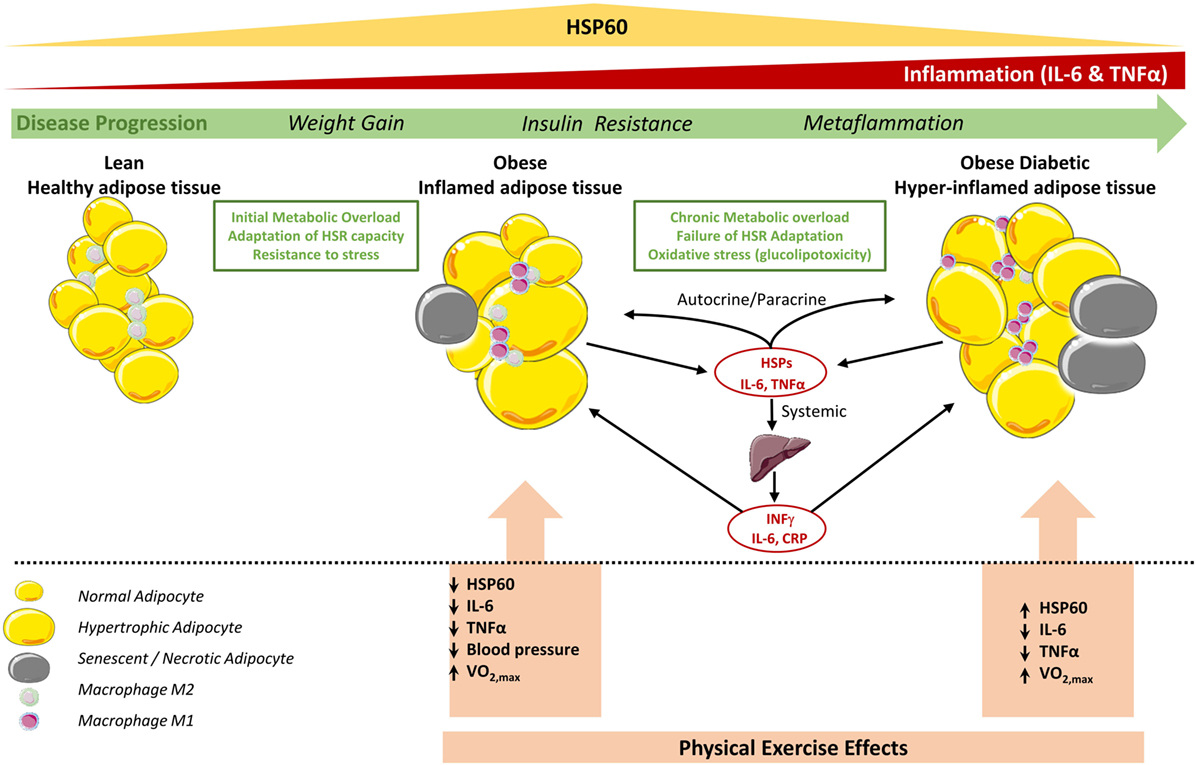
Figure 4. Status of HSP60 in subcutaneous adipose tissue (SAT) of obese subjects with and without diabetes and its modulation by physical exercise. In adipose tissue of lean subjects, most resident macrophages are M2 phenotype that contribute to insulin sensitivity. Metabolic overload and lack of physical activity increase body weight, hypertrophy of adipocytes, and number of M1 macrophages, which increase the secretion of pro-inflammatory cytokines such as TNF-α, IL-6 leading to obese inflamed adipose tissue. This contribute to the chronic subclinical metaflammation causing insulin resistance locally and probably in liver that amplifies the inflammation by secreting other pro-inflammatory mediators including IFNγ (53). At this stage, the HSR, in particular HSP60, levels are increased to cope with this cellular stress. However, in diabetic obese this metaflammation process is amplified due to high oxidative stress, which decreases mitochondrial function and HSP60 levels and finally a failure to control such hyper-inflamed adipose tissue. Regular physical exercise intervention decreases stress levels and inflammation in the adipose tissue for both diabetic and non-diabetic obese. While HSR is consequently decreased in non-diabetic obese subjects, in diabetic subjects, HSR and thus HSP60 are increased which might reflect an increase in mitochondrial capacity to reduce excessive metabolic stress. Cell pictures were adapted from Servier Medical Art.
Another potential explanation of the observed HSR in adipose tissue of obese subjects with diabetes would be linked to cell senescence and necrosis (Figure 4). For instance, those processes are known to amplify inflammation through attracting more monocytes and pro-inflammatory mediators into the SAT. It was also reported that adipose tissue of obese and diabetic patients display both compromised HSR in adipocytes as well as in hepatocytes where adipose tissue displayed cellular senescence that spreads to all the metabolic tissues thereby determining a failure to resolve inflammation (40, 54). Furthermore, our previous observation that HSPs expression in obese subjects was "unexpectedly" increased in relation to lean volunteers (12) might be just a question of timing context as the HSR is enhanced when the tissues are under homeostatic-threatening situations (early stages of T2DM in obese people) but this is progressively reversed with time or lifestyle intervention.
On the other hand and as expected, HbA1c levels were higher in obese subjects with diabetes (Tables 1–3) but the moderate exercise program was not able to reverse these levels. Indeed, HOMA-IR values, despite being higher in those subjects, indicated just a moderate level of IR (ranges: 0.84–3.27 and 0.81–1.88, in subjects with diabetes and without diabetes, respectively). In this regard, exercise reduced HOMA-IR levels in subjects without diabetes but not in those with diabetes (ranges after exercise: 0.38–1.08 and 0.81–2.66, respectively). These observations can be explained by the fact that there is great variability between different geographic areas in the threshold of HOMA-IR levels to define IR and that HOMA-IR does not adequately predict IR in all individuals, in particular, with confirmed diabetes. Furthermore, it is reported that HOMA-IR and insulin action do not clearly correlate, particularly in individuals with impaired glucose tolerance (55–57). Furthermore, the hypothesis that our subjects with diabetes were not so metabolically jeopardized could be ruled out as all our diabetic subjects were clinically confirmed with diabetes and most of them already for more than 5 years.
Finally, despite the clear differential HSR patterns between obese people with and without diabetes, our study had some limitations including the lack of access to visceral adipose tissue or hepatic function markers. Indeed, these tissues are more reflective of metabolic events, and people with diabetes are known to have more visceral and intramuscular fat than those without diabetes (58). Another limitation of our study was the absence of any diet intervention, which might have increased the efficacy of physical exercise. However, our subjects were instructed to maintain a stable diet during the 3-month exercise program, but we did not monitor their compliance. Moreover, we chose to study the direct effects of exercise alone because we believe that moderate exercise is an attractive behavioral approach to improve global health without drastic diet restriction. Further cellular work is also warranted to elucidate in details the source and the function of HSP60 in the SAT.
In summary, our data illustrated that obese subjects with diabetes had decreased expression and secretion of HSP60. This decrease in expression was reverted by physical exercise in parallel with decreased expression of inflammatory markers in SAT despite marginal changes in BMI. Our results provide further molecular evidence of the beneficial effects of physical exercise for restoring cellular stress defenses through improving HSR in diabetes.
Ethics Statement
Informed written consent was obtained from all subjects before their participation in the study, which was approved by the Review Board of Dasman Diabetes Institute and conducted in line with principles of the Declaration of Helsinki.
Author Contributions
AK, MD, and AT designed the study. AK and AT wrote the manuscript. AK, JA, MD, and AT supervised data collection and analysis. AK, MD, and AT revised the manuscript. SK, PC, and SW participated in data collection and analysis.
Conflict of Interest Statement
The authors declare that the research was conducted in the absence of any commercial or financial relationships that could be construed as a potential conflict of interest.
Acknowledgments
We would like to thank the Fitness and Rehabilitation Center and the Tissue Bank and Clinical Laboratory at the Dasman Diabetes Institute for their assistance throughout this study. The authors also thank Enago (www.enago.com) for the English language review.
Funding
This work was supported by the Kuwait Foundation for the Advancement of Sciences (grant number RA-2010-003).
Supplementary Material
The Supplementary Material for this article can be found online at http://www.frontiersin.org/articles/10.3389/fendo.2018.00016/full#supplementary-material.
Figure S1. Decreased expression of HSP72 and its modulation by exercise in the subcutaneous adipose tissue (SAT) of obese subjects with diabetes. Immunohistochemical analysis of HSP72 expression in SAT sections from obese people without (ND) and with diabetes (D) before and after a 3-month physical exercise intervention (n = 10 for each group). Data are presented as fold changes in the diabetes group compared with that in the non-diabetes group. The p-value was determined using the Mann–Whitney test for comparisons between the diabetes and non-diabetes groups and using a paired t-test for intragroup comparisons before and after exercise. * denotes p < 0.05 between the diabetes and non-diabetes groups, and # denotes p < 0.05 between before and after exercise.
Figure S2. Expression of HSP60, IL-6, and TNF-α in the subcutaneous adipose tissue (SAT) of lean subjects with diabetes. Representative confocal immunofluorescence images illustrating HSP60 (A), IL-6 (B), and TNF-α (C) expression and localization in SAT from lean people with and without diabetes (n = 3 for each group). Quantification of the staining in SAT slides was performed as mentioned in Section “Materials and Methods.”
References
1. Jaacks LM, Siegel KR, Gujral UP, Narayan KM. Type 2 diabetes: a 21st century epidemic. Best Pract Res Clin Endocrinol Metab (2016) 30:331–43. doi:10.1016/j.beem.2016.05.003
2. Templeman NM, Skovso S, Page MM, Lim GE, Johnson JD. A causal role for hyperinsulinemia in obesity. J Endocrinol (2017) 232:R173–83. doi:10.1530/JOE-16-0449
3. Paneni F, Beckman JA, Creager MA, Cosentino F. Diabetes and vascular disease: pathophysiology, clinical consequences, and medical therapy: part I. Eur Heart J (2013) 34:2436–43. doi:10.1093/eurheartj/eht149
4. Dobson R, Burgess MI, Sprung VS, Irwin A, Hamer M, Jones J, et al. Metabolically healthy and unhealthy obesity: differential effects on myocardial function according to metabolic syndrome, rather than obesity. Int J Obes (Lond) (2016) 40:153–61. doi:10.1038/ijo.2015.151
5. Westerheide SD, Morimoto RI. Heat shock response modulators as therapeutic tools for diseases of protein conformation. J Biol Chem (2005) 280:33097–100. doi:10.1074/jbc.R500010200
6. Voellmy R, Boellmann F. Chaperone regulation of the heat shock protein response. Adv Exp Med Biol (2007) 594:89–99. doi:10.1007/978-0-387-39975-1_9
7. Asea A, Rehli M, Kabingu E, Boch JA, Bare O, Auron PE, et al. Novel signal transduction pathway utilized by extracellular HSP70: role of toll-like receptor (TLR) 2 and TLR4. J Biol Chem (2002) 277:15028–34. doi:10.1074/jbc.M200497200
8. Johnson JD, Fleshner M. Releasing signals, secretory pathways, and immune function of endogenous extracellular heat shock protein 72. J Leukoc Biol (2006) 79:425–34. doi:10.1189/jlb.0905523
9. Kurucz I, Morva A, Vaag A, Eriksson KF, Huang X, Groop L, et al. Decreased expression of heat shock protein 72 in skeletal muscle of patients with type 2 diabetes correlates with insulin resistance. Diabetes (2002) 51:1102–9. doi:10.2337/diabetes.51.4.1102
10. Kavanagh K, Flynn DM, Jenkins KA, Zhang L, Wagner JD. Restoring HSP70 deficiencies improves glucose tolerance in diabetic monkeys. Am J Physiol Endocrinol Metab (2011) 300:E894–901. doi:10.1152/ajpendo.00699.2010
11. Chung J, Nguyen AK, Henstridge DC, Holmes AG, Chan MH, Mesa JL, et al. HSP72 protects against obesity-induced insulin resistance. Proc Natl Acad Sci U S A (2008) 105:1739–44. doi:10.1073/pnas.0705799105
12. Tiss A, Khadir A, Abubaker J, Abu-Farha M, Al-Khairi I, Cherian P, et al. Immunohistochemical profiling of the heat shock response in obese non-diabetic subjects revealed impaired expression of heat shock proteins in the adipose tissue. Lipids Health Dis (2014) 13:106. doi:10.1186/1476-511X-13-106
13. Cappello F, Marino Gammazza A, Palumbo Piccionello A, Campanella C, Pace A, Conway de Macario E, et al. Hsp60 chaperonopathies and chaperonotherapy: targets and agents. Expert Opin Ther Targets (2014) 18:185–208. doi:10.1517/14728222.2014.856417
14. Kim EY, Durai M, Mia Y, Kim HR, Moudgil KD. Modulation of adjuvant arthritis by cellular and humoral immunity to Hsp65. Front Immunol (2016) 7:203. doi:10.3389/fimmu.2016.00203
15. Grundtman C, Kreutmayer SB, Almanzar G, Wick MC, Wick G. Heat shock protein 60 and immune inflammatory responses in atherosclerosis. Arterioscler Thromb Vasc Biol (2011) 31:960–8. doi:10.1161/ATVBAHA.110.217877
16. Krause M, Heck TG, Bittencourt A, Scomazzon SP, Newsholme P, Curi R, et al. The chaperone balance hypothesis: the importance of the extracellular to intracellular HSP70 ratio to inflammation-driven type 2 diabetes, the effect of exercise, and the implications for clinical management. Mediators Inflamm (2015) 2015:249205. doi:10.1155/2015/249205
17. Pockley AG. Heat shock proteins, inflammation, and cardiovascular disease. Circulation (2002) 105:1012–7. doi:10.1161/hc0802.103729
18. Gulden E, Marker T, Kriebel J, Kolb-Bachofen V, Burkart V, Habich C. Heat shock protein 60: evidence for receptor-mediated induction of proinflammatory mediators during adipocyte differentiation. FEBS Lett (2009) 583:2877–81. doi:10.1016/j.febslet.2009.07.049
19. Marker T, Kriebel J, Wohlrab U, Habich C. Heat shock protein 60 and adipocytes: characterization of a ligand-receptor interaction. Biochem Biophys Res Commun (2010) 391:1634–40. doi:10.1016/j.bbrc.2009.12.104
20. Calderwood SK, Gong J, Murshid A. Extracellular HSPs: the complicated roles of extracellular HSPs in immunity. Front Immunol (2016) 7:159. doi:10.3389/fimmu.2016.00159
21. Wick G, Jakic B, Buszko M, Wick MC, Grundtman C. The role of heat shock proteins in atherosclerosis. Nat Rev Cardiol (2014) 11:516–29. doi:10.1038/nrcardio.2014.91
22. Selli ME, Wick G, Wraith DC, Newby AC. Autoimmunity to HSP60 during diet induced obesity in mice. Int J Obes (Lond) (2017) 41:348–51. doi:10.1038/ijo.2016.216
23. Pei W, Tanaka K, Huang S, Xu L, Liu B, Sinclair J, et al. Extracellular HSP60 triggers tissue regeneration and wound healing by regulating inflammation and cell proliferation. Regen Med (2016) 1:16013. doi:10.1038/npjregenmed.2016.13
24. Borges TJ, Lang BJ, Lopes RL, Bonorino C. Modulation of alloimmunity by heat shock proteins. Front Immunol (2016) 7:303. doi:10.3389/fimmu.2016.00303
25. Sell H, Poitou C, Habich C, Bouillot JL, Eckel J, Clement K. Heat shock protein 60 in obesity: effect of bariatric surgery and its relation to inflammation and cardiovascular risk. Obesity (Silver Spring) (2017) 25:2108–14. doi:10.1002/oby.22014
26. Voos W, Rottgers K. Molecular chaperones as essential mediators of mitochondrial biogenesis. Biochim Biophys Acta (2002) 1592:51–62. doi:10.1016/S0167-4889(02)00264-1
27. Atalay M, Oksala N, Lappalainen J, Laaksonen DE, Sen CK, Roy S. Heat shock proteins in diabetes and wound healing. Curr Protein Pept Sci (2009) 10:85–95. doi:10.2174/138920309787315202
28. Khadir A, Tiss A, Abubaker J, Abu-Farha M, Al-Khairi I, Cherian P, et al. MAP kinase phosphatase DUSP1 is overexpressed in obese humans and modulated by physical exercise. Am J Physiol Endocrinol Metab (2015) 308:E71–83. doi:10.1152/ajpendo.00577.2013
29. Livak KJ, Schmittgen TD. Analysis of relative gene expression data using real-time quantitative PCR and the 2(-Delta Delta C(T)) method. Methods (2001) 25:402–8. doi:10.1006/meth.2001.1262
30. Khadir A, Kavalakatt S, Abubaker J, Cherian P, Madhu D, Al-Khairi I, et al. Physical exercise alleviates ER stress in obese humans through reduction in the expression and release of GRP78 chaperone. Metabolism (2016) 65:1409–20. doi:10.1016/j.metabol.2016.06.004
31. Look ARG, Wing RR, Bolin P, Brancati FL, Bray GA, Clark JM, et al. Cardiovascular effects of intensive lifestyle intervention in type 2 diabetes. N Engl J Med (2013) 369:145–54. doi:10.1056/NEJMoa1212914
32. Gupte AA, Bomhoff GL, Touchberry CD, Geiger PC. Acute heat treatment improves insulin-stimulated glucose uptake in aged skeletal muscle. J Appl Physiol (2011) 110:451–7. doi:10.1152/japplphysiol.00849.2010
33. Rodrigues-Krause J, Krause M, O’Hagan C, De Vito G, Boreham C, Murphy C, et al. Divergence of intracellular and extracellular HSP72 in type 2 diabetes: does fat matter? Cell Stress Chaperones (2012) 17:293–302. doi:10.1007/s12192-011-0319-x
34. Marker T, Sell H, Zillessen P, Glode A, Kriebel J, Ouwens DM, et al. Heat shock protein 60 as a mediator of adipose tissue inflammation and insulin resistance. Diabetes (2012) 61:615–25. doi:10.2337/db10-1574
35. Rogers RS, Beaudoin MS, Wheatley JL, Wright DC, Geiger PC. Heat shock proteins: in vivo heat treatments reveal adipose tissue depot-specific effects. J Appl Physiol (1985) (2015) 118:98–106. doi:10.1152/japplphysiol.00286.2014
36. Imatoh T, Sugie T, Miyazaki M, Tanihara S, Baba M, Momose Y, et al. Is heat shock protein 60 associated with type 2 diabetes mellitus? Diabetes Res Clin Pract (2009) 85:208–12. doi:10.1016/j.diabres.2009.06.004
37. Pollack RM, Donath MY, LeRoith D, Leibowitz G. Anti-inflammatory agents in the treatment of diabetes and its vascular complications. Diabetes Care (2016) 39(Suppl 2):S244–52. doi:10.2337/dcS15-3015
38. Ye J, McGuinness OP. Inflammation during obesity is not all bad: evidence from animal and human studies. Am J Physiol Endocrinol Metab (2013) 304:E466–77. doi:10.1152/ajpendo.00266.2012
39. Dai X, Zhan J, Demmy TA, Poordad FB, Fauceglia PL, Zhang H, et al. Monocytes play different roles in stimulating T cells in obese diabetic individuals. Int J Immunopathol Pharmacol (2015) 28:374–83. doi:10.1177/0394632015598848
40. Newsholme P, de Bittencourt PI Jr. The fat cell senescence hypothesis: a mechanism responsible for abrogating the resolution of inflammation in chronic disease. Curr Opin Clin Nutr Metab Care (2014) 17:295–305. doi:10.1097/MCO.0000000000000077
41. Quintana FJ, Cohen IR. The HSP60 immune system network. Trends Immunol (2011) 32:89–95. doi:10.1016/j.it.2010.11.001
42. Rong JX, Qiu Y, Hansen MK, Zhu L, Zhang V, Xie M, et al. Adipose mitochondrial biogenesis is suppressed in db/db and high-fat diet-fed mice and improved by rosiglitazone. Diabetes (2007) 56:1751–60. doi:10.2337/db06-1135
43. Wilson-Fritch L, Nicoloro S, Chouinard M, Lazar MA, Chui PC, Leszyk J, et al. Mitochondrial remodeling in adipose tissue associated with obesity and treatment with rosiglitazone. J Clin Invest (2004) 114:1281–9. doi:10.1172/JCI21752
44. Sears DD, Hsiao G, Hsiao A, Yu JG, Courtney CH, Ofrecio JM, et al. Mechanisms of human insulin resistance and thiazolidinedione-mediated insulin sensitization. Proc Natl Acad Sci U S A (2009) 106:18745–50. doi:10.1073/pnas.0903032106
45. Kleinridders A, Lauritzen HP, Ussar S, Christensen JH, Mori MA, Bross P, et al. Leptin regulation of Hsp60 impacts hypothalamic insulin signaling. J Clin Invest (2013) 123:4667–80. doi:10.1172/JCI67615
46. Armstrong MJ, Sigal RJ. Exercise as medicine: key concepts in discussing physical activity with patients who have type 2 diabetes. Can J Diabetes (2015) 39(Suppl 5):S129–33. doi:10.1016/j.jcjd.2015.09.081
47. Zanuso S, Bergamin M, Jimenez A, Pugliese G, D’Errico V, Nicolucci A, et al. Determination of metabolic equivalents during low- and high-intensity resistance exercise in healthy young subjects and patients with type 2 diabetes. Biol Sport (2016) 33:77–82. doi:10.5604/20831862.1194124
48. Blaak EE, van Aggel-Leijssen DP, Wagenmakers AJ, Saris WH, van Baak MA. Impaired oxidation of plasma-derived fatty acids in type 2 diabetic subjects during moderate-intensity exercise. Diabetes (2000) 49:2102–7. doi:10.2337/diabetes.49.12.2102
49. Houstis N, Rosen ED, Lander ES. Reactive oxygen species have a causal role in multiple forms of insulin resistance. Nature (2006) 440:944–8. doi:10.1038/nature04634
50. van Tienen FH, van der Kallen CJ, Lindsey PJ, Wanders RJ, van Greevenbroek MM, Smeets HJ. Preadipocytes of type 2 diabetes subjects display an intrinsic gene expression profile of decreased differentiation capacity. Int J Obes (Lond) (2011) 35:1154–64. doi:10.1038/ijo.2010.275
51. Moldoveanu AI, Shephard RJ, Shek PN. Exercise elevates plasma levels but not gene expression of IL-1beta, IL-6, and TNF-alpha in blood mononuclear cells. J Appl Physiol (1985) (2000) 89:1499–504. doi:10.1152/jappl.2000.89.4.1499
52. Johannsen NM, Swift DL, Johnson WD, Dixit VD, Earnest CP, Blair SN, et al. Effect of different doses of aerobic exercise on total white blood cell (WBC) and WBC subfraction number in postmenopausal women: results from DREW. PLoS One (2012) 7:e31319. doi:10.1371/journal.pone.0031319
53. Wynn TA, Chawla A, Pollard JW. Macrophage biology in development, homeostasis and disease. Nature (2013) 496:445–55. doi:10.1038/nature12034
54. Palmer AK, Tchkonia T, LeBrasseur NK, Chini EN, Xu M, Kirkland JL. Cellular senescence in type 2 diabetes: a therapeutic opportunity. Diabetes (2015) 64:2289–98. doi:10.2337/db14-1820
55. Gayoso-Diz P, Otero-Gonzalez A, Rodriguez-Alvarez MX, Gude F, Garcia F, De Francisco A, et al. Insulin resistance (HOMA-IR) cut-off values and the metabolic syndrome in a general adult population: effect of gender and age: EPIRCE cross-sectional study. BMC Endocr Disord (2013) 13:47. doi:10.1186/1472-6823-13-47
56. Lee CH, Shih AZ, Woo YC, Fong CH, Leung OY, Janus E, et al. Optimal cut-Offs of homeostasis model assessment of insulin resistance (HOMA-IR) to identify dysglycemia and type 2 diabetes mellitus: a 15-year prospective study in Chinese. PLoS One (2016) 11:e0163424. doi:10.1371/journal.pone.0163424
57. Chang AM, Smith MJ, Bloem CJ, Galecki AT, Halter JB, Supiano MA. Limitation of the homeostasis model assessment to predict insulin resistance and beta-cell dysfunction in older people. J Clin Endocrinol Metab (2006) 91:629–34. doi:10.1210/jc.2005-1803
Keywords: cellular stress, heat shock response, heat shock protein 60, physical exercise, adipose tissue
Citation: Khadir A, Kavalakatt S, Cherian P, Warsame S, Abubaker JA, Dehbi M and Tiss A (2018) Physical Exercise Enhanced Heat Shock Protein 60 Expression and Attenuated Inflammation in the Adipose Tissue of Human Diabetic Obese. Front. Endocrinol. 9:16. doi: 10.3389/fendo.2018.00016
Received: 09 October 2017; Accepted: 15 January 2018;
Published: 06 February 2018
Edited by:
Jan Polák, Charles University, CzechiaReviewed by:
Christian Drouet, Université Grenoble Alpes, FranceMichaela Tencerova, University of Southern Denmark Odense, Denmark
Copyright: © 2018 Khadir, Kavalakatt, Cherian, Warsame, Abubaker, Dehbi and Tiss. This is an open-access article distributed under the terms of the Creative Commons Attribution License (CC BY). The use, distribution or reproduction in other forums is permitted, provided the original author(s) and the copyright owner are credited and that the original publication in this journal is cited, in accordance with accepted academic practice. No use, distribution or reproduction is permitted which does not comply with these terms.
*Correspondence: Ali Tiss, YWxpLnRpc3NAZGFzbWFuaW5zdGl0dXRlLm9yZw==
†These authors have equally contributed to this work.