 Viktoria Szabolcsi
 Gioele W. Albisetti
 Marco R. Celio
- Anatomy and Program in Neuroscience, Department of Medicine, University of Fribourg, Fribourg, Switzerland
The ventrolateral hypothalamic parvafox (formerly called PV1-Foxb1) nucleus is an anatomical entity of recent discovery and unknown function. With a view to gaining an insight into its putative functional role(s), we conducted a gene-microarray analysis and, armed with the forthcoming data, controlled the results with the Allen databases and the murine BrainStars (B*) database. The parvafox nucleus was specifically sampled by laser-capture microdissection and the transcriptome was subjected to a microarray analysis on Affymetrix chips. Eighty-two relevant genes were found to be potentially more expressed in this brain region than in either the cerebral cortex or the hippocampus. When the expression patterns of these genes were counterchecked in the Allen-Database of in-situ hybridizations and in the B*-microarray database, their localization in the parvafox region was confirmed for thirteen. For nine novel genes, which are particularly interesting because of their possible involvement in neuromodulation, the expression was verified by quantitative real time-PCR. Of particular functional importance may be the occurrence of glycine receptors, the presence of which indicates that the activity of the parvafox nucleus is under ascending inhibitory control.
Introduction
The parvafox nucleus (formerly known as PV1-Foxb1 nucleus) has been identified and described as a bilateral chord of parvalbumin (Parv)-positive neurons in the murine ventrolateral tuberal hypothalamus (Celio, 1990; Mészár et al., 2012; Bilella et al., 2014). It is sandwiched in the horizontal plane between the optic tract and the fornix, and in mice it extends for a total length of about 1 mm. Parv-positive cells of the parvafox nucleus are immunoreactive for glutamate (Mészár et al., 2012) and express the gene Slc17a6 encoding the vesicular glutamate transporter 2 (Vglut2) (Girard et al., 2011). Hence, unlike the usual GABA-phenotype (Celio, 1986), the Parv-positive neurons of the parvafox nucleus utilize the excitatory neurotransmitter glutamate.
The efferent connections of the Parv-positive sub-population of neurons in the parvafox nucleus are almost exclusively directed toward a small cylindrical zone lying ventral to the aqueduct in the periaqueductal gray matter (PAG) (Celio et al., 2013). The targets of the Foxb1-cell subpopulation of the parvafox nucleus are likewise located in and around the PAG, but occur also in a few other cerebral sites (Bilella et al., 2016). The inputs to the parvafox nucleus, as studied by trans-synaptic retrograde transport of rabies-virus, derive from a wide variety of brain sites, including orbitofrontal cortex, piriform cortex, olfactory tubercle, nucleus accumbens, caudoputamen, globus pallidus, diagonal band nucleus (NDB), substantia innominata (SI), bed nuclei of the stria terminalis (BST), anterior amygdalar area, central and medial amygdalar nucleus, thalamus [(lateral dorsal nucleus of the thalamus (LD), mediodorsal nucleus of the thalamus (MD)], midbrain (PAG, ventral tegmental area, midbrain reticular nucleus), pons, medulla oblongata [Gigantocellular reticular nucleus (GRN), Intermediate reticular nucleus (IRN)] (manuscript in preparation). The functions of this lateral hypothalamic parvafox nucleus are as yet unknown.
The identification of genes that are enriched in the neurons of the parvafox nucleus could reveal the presence of components that might provide an insight into the role(s) of this brain entity. A genome-wide molecular characterization of the parvafox nucleus has been already undertaken by a screening of the Allen Brain Atlas Database of in-situ hybridizations (ABA-ISH) (Girard et al., 2011). This former study disclosed 76 genes as being potentially co-expressed with Parv in the neurons of the parvafox nucleus, a large number of them being common to all Parv-positive neurons in the brain (e.g., those that are implicated in the regulation of potassium–channels). Somewhat surprisingly, only a few of the genes that encode neuromodulators or their receptors were found to be expressed in the parvafox nucleus.
With a view to complementing these early data and to disclosing genes encoding neuropeptides, neurotransmitters and their receptors, the entire transcriptome of the parvafox nucleus was subjected to a gene-microarray of laser-capture microdissected murine tissue. Armed with these data, we scrutinized the Allen Database of in-situ hybridizations (ABA-ISH; http://www.brain-map.org/) (Lein et al., 2007) and the BrainStars (B*)-Database of gene arrays (Kasukawa et al., 2011; http://brainstars.org/). The most significant outcome of this gene-array investigation was the discovery of glycine-receptor alpha subunits expressed in the parvafox nucleus.
Materials and Methods
Mice
Adult C57BL/6 and GlyT2-EGFP mice of both sexes were used in this study. GlyT2-EGFP mice were a kind gift of Prof. Hanns Ulrich Zeilhofer (University of Zürich, Neuropharmacology). All animal experiments were carried out in accordance with the institutional guidelines of the University of Fribourg and with the permission of the Swiss federal and cantonal committee on animal experimentation.
Gene-Microarray Analysis
Six C57BL/6 mice were killed by cervical dislocation. The brains were rapidly removed, mounted on cork platforms in OCT (Sakura Tissue-Tek), and frozen on pulverized dry ice. Prior to sectioning in a cryostat, the samples were stored at −80°C. Starting from the ventral surface, the brains were cut into 16-μm-thick horizontal sections at −18°C until the fornix was reached. At this point, the sections were respectively mounted in an alternating manner on MMI-membranes (Molecular Machines & Industries, Glattbrugg, Switzerland) and Superfrost-Plus glass slides (Menzel-Gläser, Braunschweig, Germany). The MMI-mounted sections were chemically fixed for 5 min in 100% ethanol at −18°C, air dried for 1 h in the cryostat chamber, likewise at −18°C and stored at −80°C for various periods of time until the time of laser-beam-aided microdissection. The Superfrost-Plus-mounted sections were chemically fixed for 10 min at ambient temperature in 4% paraformaldehyde diluted in phosphate-buffered saline (0.1M, pH 7.3). These sections were incubated overnight at 4°C with the horseradish-peroxidase-conjugated lectin Vicia villosa (EY Laboratories, San Mateo, California, USA) at a concentration of 20 μg/ml in 0.1 M Tris-buffered saline containing 0.1 mM MnCl2, 0.1 mM CaCl2, 0.1 mM MgCl2 and 0.1% Triton-X. The presence of the lectin staining was revealed after treatment with diaminobenzidine / hydrogen peroxide. Lectins such as Vicia villosa are markers of the perineuronal nets (Celio and Blümcke, 1994), which are abundant around the Parv-immunopositive neurons of the rodent parvafox nucleus (Mészár et al., 2012). The pattern of lectin staining on the Superfrost-Plus-mounted sections aided the localization of the parvafox nucleus on the adjacent, MMI-membrane-mounted ones.
Using vessels as landmarks, the corresponding parvafox region on the MMI-membranes was excised using the CellCut-Plus laser microdissection apparatus (MMI, Glattbrugg, Switzerland) of the Cellular Imaging Facility (CIF) at the University of Lausanne. The previously drawn trajectory was automatically excised using the precisely focused UV-laser beam. The dissected tissue samples were collected in special tubes bearing an adhesive surface on the interior of the cap (MMI, Glattbrugg, Switzerland). Finally, 350 μl of lysis buffer [Buffer RLT (Qiagen), supplemented with 1:100 β-mercaptoethanol] was added to each tube and the samples were immediately frozen at −80°C. The same protocol was used to extract tissue from regions encompassing the cerebral cortex (piriform and entorhinal cortex) and the hippocampus (CA2–CA3 area). These regions were arbitrarily chosen as a basis for comparison in so far they contain GABAergic, Parv-positive interneurons. Hence, from each murine brain, three regions were excised: the parvafox nucleus, the cortex and the hippocampus.
The entire RNA-pool of the microdissected cryosections was purified using the RNAeasy Plus Micro Kit (Qiagen, Hilden, Germany). The quantity and the quality of the RNA-extracts were respectively monitored in a NanoDrop 2000 spectrophotometer (Thermo Scientific, Wilmington, DE, USA) and an Agilent 2100 bioanalyzer (Agilent Technologies, Palo Alto, California, USA). For the final gene-array we used the tissue of two mice (m355 and m511) from which the RNA-extract was best preserved and at the highest concentrations. The samples of these animals were analyzed separately so as to furnish independent replicates. The RNA-samples were stored at −80°C until the time of amplification using the NuGEN Ovation® Pico WTA System V2 (NuGEN Technologies, San Carlos, California, USA) as previously described (Szabolcsi and Celio, 2015). The whole-transcript amplification, the labeling process and the gene-chip hybridization on an Affymetrix Mouse Gene 2.0 ST Array (Affymetrix, Santa Clara, California, USA) were performed in the Genomic Technologies Facility (GTF) at the University of Lausanne (UNIL). Excel spreadsheets containing the extracted data were produced alongside the original files that were generated using the Affymetrix GeneChip® System.
Quantitative Real-Time-PCR
Verification of the results of the gene microarray was performed by quantitative real-time-PCR (qRT-PCR). The same cDNA samples as used for the microarray analyses were subjected to SYBR qRT-PCR. Nine particularly interesting genes found enriched in the parvafox nucleus of the mice in our microarray study (Cbln1, Drd2, Ephb1, Foxb1, Glra1, Glra2, Glra3, Npb, Npsr1) were selected for the assay. Actin beta (Actb) was chosen as internal normalization gene. The qRT-PCR reactions were performed using Rotor-Gene Strip Tubes (Starlab Switzerland, Muri, Switzerland) in FastStart Essential DNA Green Master (Roche, Rotkreuz, Switzerland) containing 0.5 μM gene-specific primers and 5 ng cDNA/tube. The sequence of the primer pairs is listed in Supplementary Table 3. Assays were performed with a Rotor-Gene 6000 by Corbett Research (QIAGEN, Basel, Switzerland). The cycling program initiated with a 10 min hold at 95°C, and the cycles consisted of 20 s hold at 95°C, 20 s hold at 60°C, 20 s hold at 72°C, with 40 repeats. All samples were run in triplicates and CT values were averaged for final quantification.
Immunohistochemistry
Three C57BL/6 and two GlyT2-EGFP mouse brains were fixed by perfusion through the heart of 0.9% NaCl solution followed by cold 4% paraformaldehyde (PFA) diluted in phosphate-buffered saline (0.1 M, pH 7.3) and post-fixed overnight in the same buffer. The brains were transferred to cryoprotectant solution (30% saccharose in Tris-buffered saline 0.1 M, pH 7.3) and cut into 40 μm-thick coronal sections with a freezing microtome (Frigomobil, Reichert-Jung, Vienna, Austria). C57BL/6 sections were incubated for various length of time (1 to 3 days) with Glyrα2 antibody (Santa Cruz; Dallas, TX, USA; sc 20133) diluted 1:250 to 1:1000 (together with the monoclonal Parv antibody 235 (1: 1000; Swant Inc., Marly, Switzerland). The specificity of the Glyrα2 antibody was tested on 40 μm-thick sections of the prefrontal cortex derived from adult Glra2-KO mice, a kind gift of Prof. Bert Brône's lab (Morelli et al., 2016) (data not shown). GlyT2-EGFP sections were incubated overnight with monoclonal anti-GFP (1:1000, Molecular Probes, Thermo Fisher Scientific, Reinach, Switzerland) and polyclonal Parv antibody (PV-25, 1:1000, Swant Inc., Marly, Switzerland). Glyrα2-immunolabeling was revealed with the fluorescent avidin-biotin method (Vector labs), whereas GFP- and Parv-immunolabeling was detected with fluorophore conjugated secondary antibodies (Jackson Immunochemicals). Images were taken by a Leica epifluorescence microscope (DM6000B) and a Leica TCS SP5 confocal laser microscope. Image analyses and three-dimensional reconstructions were performed with the Imaris 8.3 software module (Bitplane, Zürich, Switzerland).
Immunoblot
To obtain hypothalamic protein extracts, two C57BL/6 mice were subjected to cervical dislocation, followed by removal of the brains and manual excision of the hypothalamic, cortical and hippocampal regions. Total protein content of the excised tissue was extracted by ultrasonication in Tris-EDTA solution. Protein extracts were subjected to 10% SDS-gel-electrophoresis (50 μg protein) followed by transfer on nitrocellulose paper and immunoblot using an antibody directed against Glyrα2 (Santa Cruz, sc20133) diluted 1:500. The bound antibody was revealed with an HRP-labeled secondary antibody and the reaction amplified by chemiluminescence.
Informatics
Data were pre-processed and normalized using the robust multi-array average (RMA) approach and the software “Expression Console” provided by Affymetrix (version 1.2.1.20). The data were evaluated using the programming language R (version 2.14.2) and Partek® Genomics Suite™ software (Partek Inc., St. Louis, Missouri, USA). Gene lists were prepared by the Genomic Technologies Facility of Lausanne using the Bioconductor package limma in R. NCBI Gene Expression Omnibus (GEO) database accession number of the gene microarray data is GSE92955.
The data gleaned from our gene-microarray analysis were compared to those derived by mining the B*-database and the Allenminer screening (v1.5) (Davis and Eddy, 2009), in order to retrieve the three-dimensional expression files that were prepared from the ABA-ISH database (Lein et al., 2007) in a former study (Girard et al., 2011).
Mining of the Brainstars (B*) Database
BrainStars (B*) (http://brainstars.org/) is a quantitative expression database of the adult murine brain (Kasukawa et al., 2011); it contains a genome-wide expression-profile of 51 regions. We exploited this publicly available expression-profile database to check our own gene-microarray analysis. Data appertaining to the lateral hypothalamus were compared with those derived from the cerebral cortex and the hippocampus.
Metacore Software Analysis
Further analysis of the data was performed using MetaCore (Thomson Reuters, New York, NY, USA), a data mining and pathway-analysis software facility, which is commonly implemented for a functional analysis of gene-microarray findings. The known and putative functions of specific genes, as well as their involvement in biological and molecular processes, were also studied, using the GO (Gene Ontology) bioinformatics platform and the UniProtKB/Swiss-Prot database.
Results
Gene-Expression Analysis of the Parvafox Nucleus
Using Partek® Genomics Suite™ software, we first examined the expression levels of the genes that are known to be enriched in the parvafox nucleus, such as Slc17a6 and Pvalb, and of those that have been demonstrated to remain unexpressed, such as Slc17a7 and Gad1. This analysis confirmed the expression levels of Slc17a6, the gene encoding the vesicular glutamate transporter 2 (Vglut2), to be higher in the parvafox nucleus than in either the cortex or the hippocampus. Pvalb is expressed in both the cortex and the hippocampus, but at a much higher level in the parvafox nucleus. The expression levels of Slc17a7 (encoding Vglut1) and Gad1 (coding for the GABA-synthesizing enzyme glutamate decarboxylase 1) in the parvafox nucleus were low compared to those in the cortex and the hippocampus (not shown).
A further analysis of the data was conducted using the Bioconductor package limma in R. A gene was considered to be enriched in the parvafox nucleus if its expression levels in the mice were 2-fold higher than those in both the hippocampus and the cortex. This was a very strict selection criterion, and its investigation revealed the enrichment of 67 genes in the parvafox nucleus (Table 1). The ABA-ISH and the B* database were screened for the specific expression of each of these genes in the region occupied by the parvafox nucleus. The function of these genes was ascertained by a search of the UniProtKB/Swiss-Prot database. The genes that were enriched in the parvafox nucleus (Table 1) can be classified as follows: neuropeptide activity (Adcyap1, Npb, Nxph4, Pmch), receptors (Glra2, Gpr139, Vmn1r7), transporters (Slc17a6), chloride channels (Ano4), enzymes (Agxt2l1, Dgkk, Fam113b, Gpx3, Hyi, Phyhd1, Plcb4, Ucp2), peptide-hormone precursors (Agt), transcription factors (Ddx5, Ebf3, Pitx2), peptidase inhibitors (Itih3, Serpinb1b), apolipoprotein (Apoc1), angiogenesis regulators (Baiap3), cytoskeleton growth regulator (Capza1), nucleosome-interacting proteins (Hist1h1b, Hmgxb4), cell recognition (Igsf1), cell-cell adhesion (Fndc3a, Mpp7), neural development (Slitrk6), cell growth and differentiation (Sfrp5), regulators of membrane traffic (Rhobtb3, Yif1a), unknown functions (Lhfpl3, Lhfpl5, Mthfd2l, Rnf122, Trav9d-3, Zfp455, Zfp784), non-coding RNA (Rmst, Rny1, Snord42b), and RNA-processing (Scarna3a). Eight predicted genes, 6 RIKEN-cDNAs and 7 non-characterized sequences were also enriched. We then expanded the initial list with 15 potential genes (Cbln1, Drd2, Ephb1, Foxb1, Glra1, Glra3, Kcnab3, Lgi2, Lhx1, Lrrc6, Ndufs1, Npsr1, Penk, Vamp1, 5830454E08Rik), which initially failed the selection criteria but appeared to be highly overexpressed in either the hippocampus or the cortex, or in one of the mice (Table 1), thus raising the total number of genes potentially expressed in the parvafox nucleus to 82.
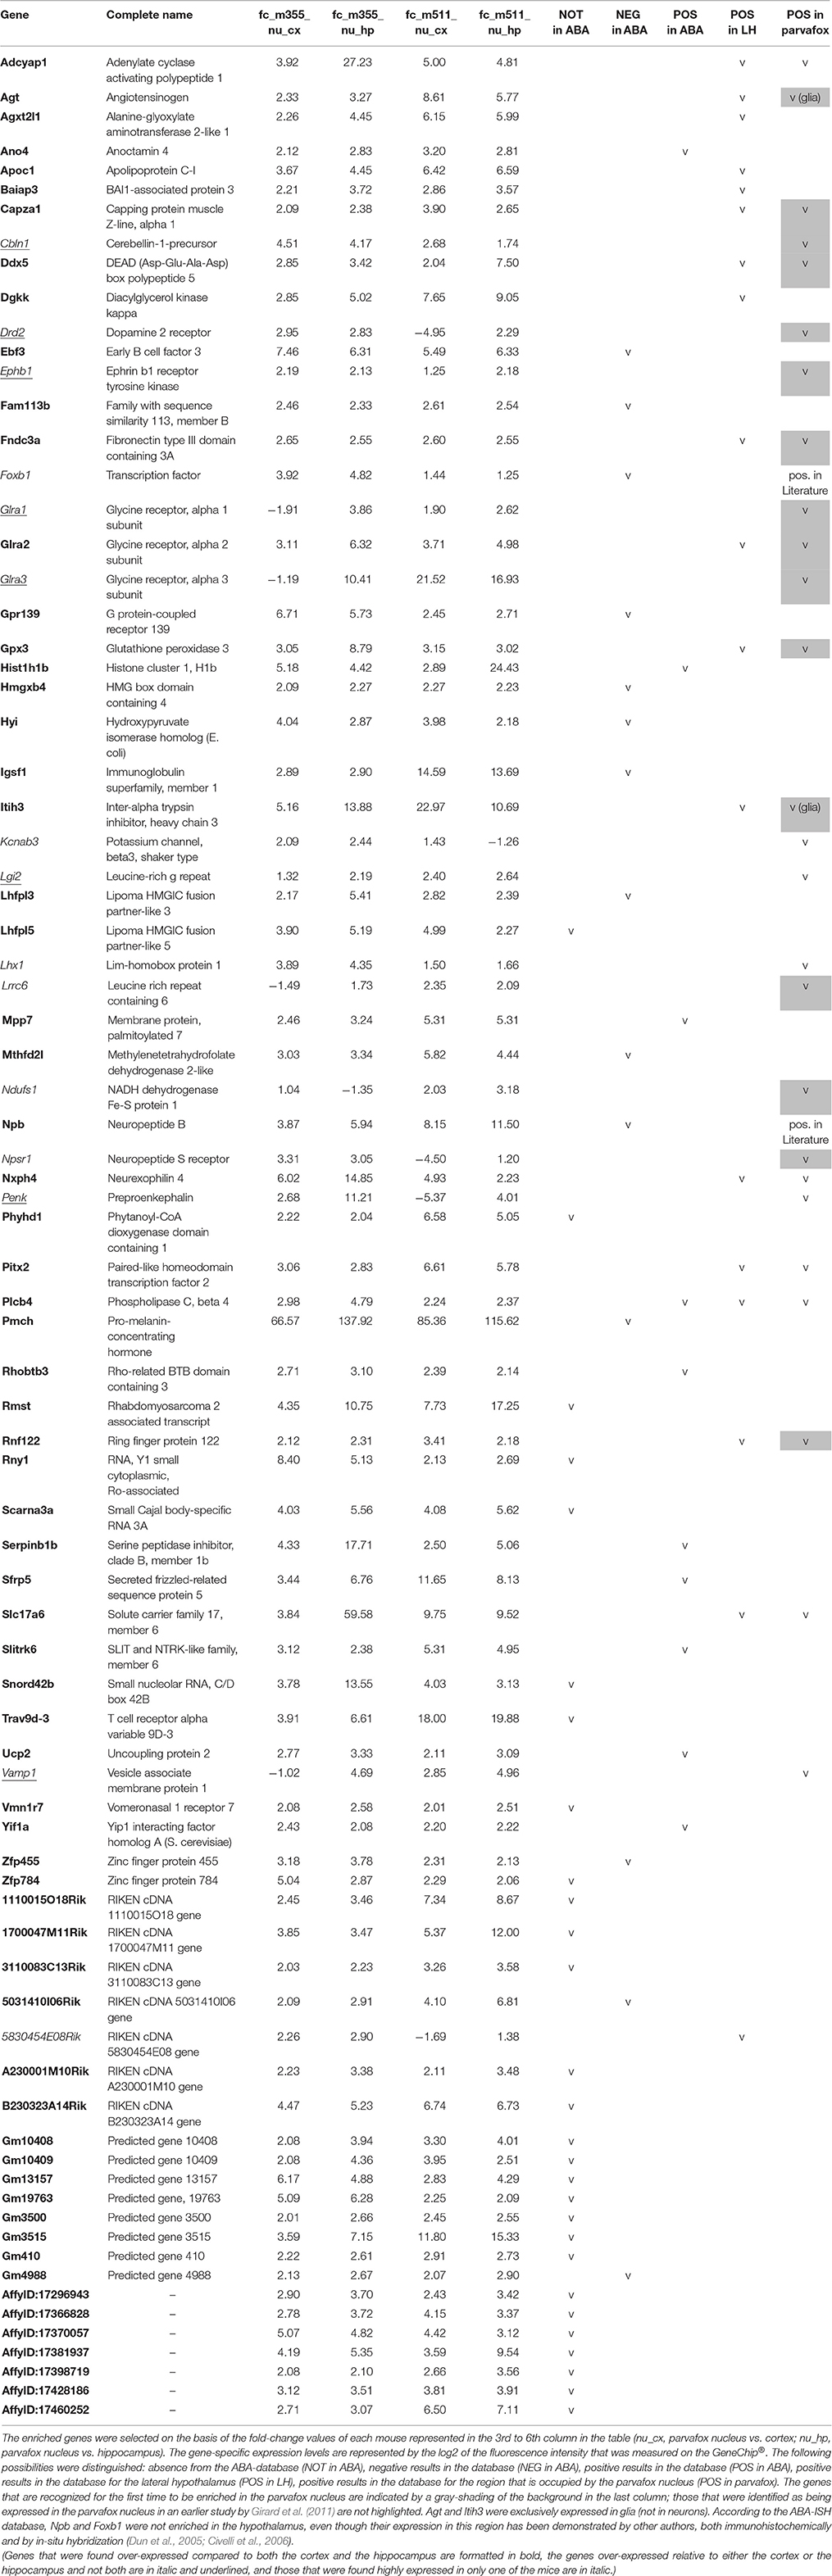
Table 1. List of the 82 genes that were enriched in the parvafox nucleus relative to the expression levels in the cortex and/or the hippocampus in our own gene-microarray analysis, and their localization counter-checked in the ABA-ISH database.
By checking the expression of these 82 gene profiles in the ABA-ISH, their occurrence in the parvafox region of the lateral hypothalamus was confirmed visually for 26 (Table 1, last column), 10 of which were already known to occur in the parvafox region (Girard et al., 2011). Submitting these genes to an additional check with the B* databases (Supplementary Table 1), this third criterion confirmed the enrichment of 13 of them (Adcyap1, Agt, Cazpa1, Cbln1, Drd2, Fndc3a, Glra1, Glra2, Glra3, Gpx3, Itih3, Nxph4, Slc17a6) in the parvafox nucleus. On the basis of morphological criteria in the ABA-ISH, we suspected that Agt and Itih3 were expressed by glia rather than by neurons. Remarkably, both in the ABA-ISH and the B* database, the results for neuropeptide b and Foxb1 were negative (Table 1, Supplementary Table 1), despite they having been successfully identified by in-situ hybridization in the hypothalamus by other authors (Dun et al., 2005; Jackson et al., 2006; Schulz et al., 2007). Consequently, in these specific cases we interpret the ABA-ISH-database result as a false negative one.
For many of the other genes that were revealed by the microarray analysis to be enriched in the parvafox nucleus, corresponding confirmation in the ABA-ISH images or in the B* database were either negative or not possible. For example, in the ABA-ISH the expression of 28 genes had not been performed and 14 genes were negative. Alternatively, the localization was either in the lateral hypothalamus at large (5 genes) or outside it (9 genes). In ABA-ISH images of sagittal sections, the parvafox nucleus was more difficult to identify with certainty, and the data were consequently less unequivocal. The findings of the detailed evaluation are summarized as a whole in the Table 1.
The most noteworthy result was the finding that the glycine-receptors subunit alpha-2 (Glra2) was expressed at higher levels in the parvafox nucleus than in both the cortex and the hippocampus, with a mean fold-change of +4.53 (Table 1). The glycine-receptor subunit alpha-3 (Glra3), although excluded by our strict selection criteria, was also expressed at high levels in the parvafox nucleus, with a mean fold-change of +11.92 in mouse 511 (Table 1 and Figure 1B). Screening of the B*-microarray database revealed the glycine-receptor subunit alpha-1 (Glra1) to be likewise expressed at higher levels in the parvafox region (FC = 3.5) than in the hippocampus (see Supplementary Table 1). The expression of these three alpha-subunit isoforms of glycine receptors in the parvafox nucleus was confirmed by visual screening of the ABA-ISH database (Table 1, Figure 1) and for Glyrα2 additionally also by immunofluorescence staining with specific antibodies (Figure 2).
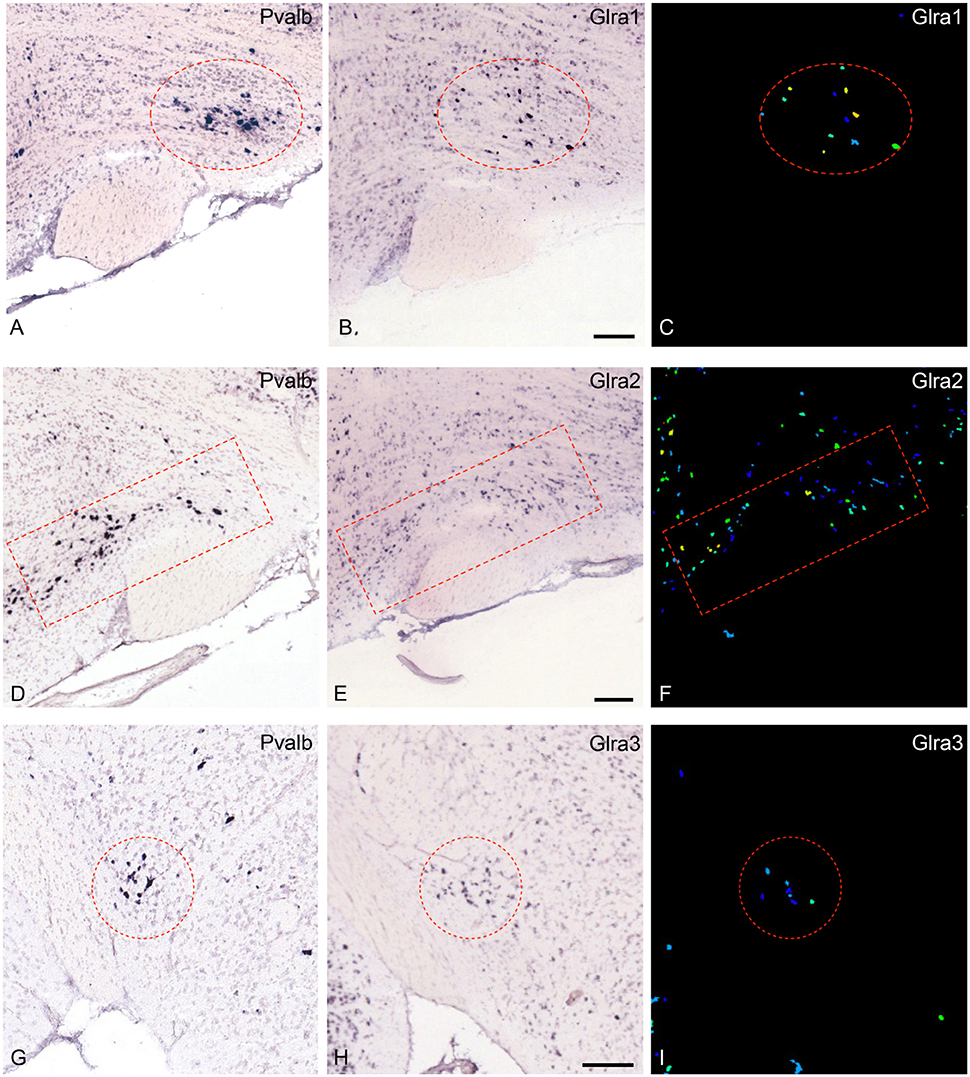
Figure 1. Expression of the mRNA for the glycine-receptor subunits α-1, α-2 and α-3 in the parvafox nucleus as found in the ABA-ISH. (A,D,G) In situ hybridization-images for Pvalb, downloaded from the ABA website, defining the location of the parvafox nucleus (surrounded by a red circle or rectangle). (B,E,H): The mRNAs for the glycine-receptor subunits α-1, α-2, and α-3 are expressed within the confines of the parvafox nucleus. In (C,F,I) the expression level of Glra1, Glra2, and Glra3 is visualized with pseudocolors. (A–F) are sagittal sections and (G–I) coronal sections. (Image credit: Allen Institute.) Scale bars represent 100 μm.
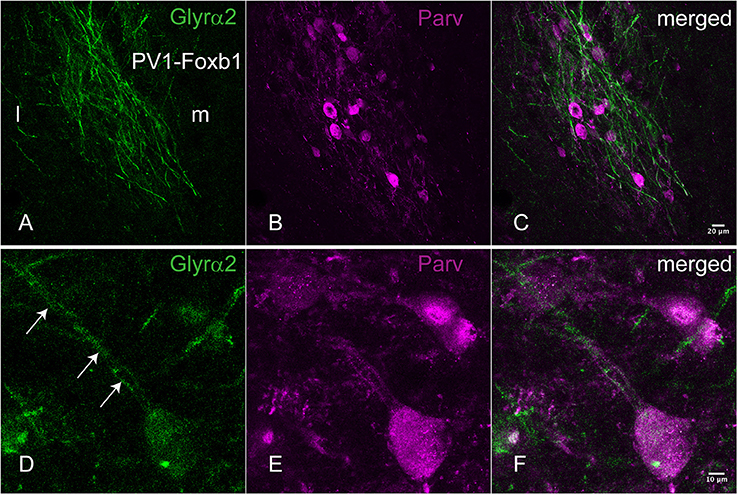
Figure 2. Immunohistochemical localization of the Glyrα2 receptor in the parvafox nucleus. In overview pictures, the Glyrα2 immunoreactive sites in the hypothalamus are concentrated in the ventrolateral hypothalamus and the mammillary nuclei. At low magnification, a meshwork of Glyrα2 immunoreactive fibers (A) is intermingled with Parv-immunoreactive neurons (B,C). At higher magnification, Glyrα2 immunoreactivity decorates the dendrites (arrows, D) and cell body of Parv-positive neurons (E,F).
Quantitative Real-Time PCR
Nine genes of particular interest because of their role as markers or neuromodulators (for the extended list of genes see Table 1) were selected to verify the results of the gene microarray study and to confirm their expression in the region of the parvafox nucleus by quantitative real-time PCR (Table 2). We calculated the expression values based on the 2−ΔΔCT method as described in the paper of Livak and Schmittgen (2001). The log2FC values obtained by the qRT-PCR assay are listed in Table 3. Student's t-tests were performed to assess statistical significance. We were able to confirm the enrichment of 9 genes in the parvafox nucleus: Cbln1, Drd2, Ephb1, Foxb1, Glra1, Glra2, Glra3, Npb and Npsr1. P-values calculated to compare the ΔCT values of the parvafox nucleus to the cortex and hippocampus of both mice showed that the enrichment was significant for all nine genes: Cbln1 (p = 0.0054) Drd2 (p = 0.003), Ephb1 (p = 0.00009), Foxb1 (p = 0.0008), Glra1 (p = 0.013), Glra2 (p = 0.000001), Glra3 (p = 0.003), Npb (p = 0.00073) and Npsr1 (p = 0.007) (Table 3). These results coincide with the microarray fold change values; however, in some cases the expression levels were considerably higher when measured by qRT-PCR (see Supplementary Table 2).
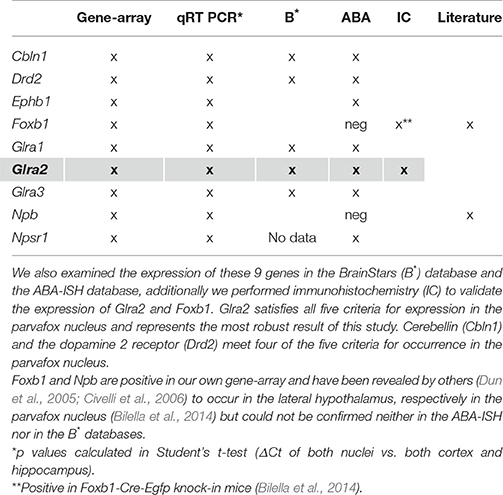
Table 2. A selection of 9 genes of particular interest because of their novelty and possible roles as markers or as neuromodulators (for an extended list of genes see Table 1) has been confirmed to be expressed in the transcriptome of the parvafox nucleus by qRT-PCR.
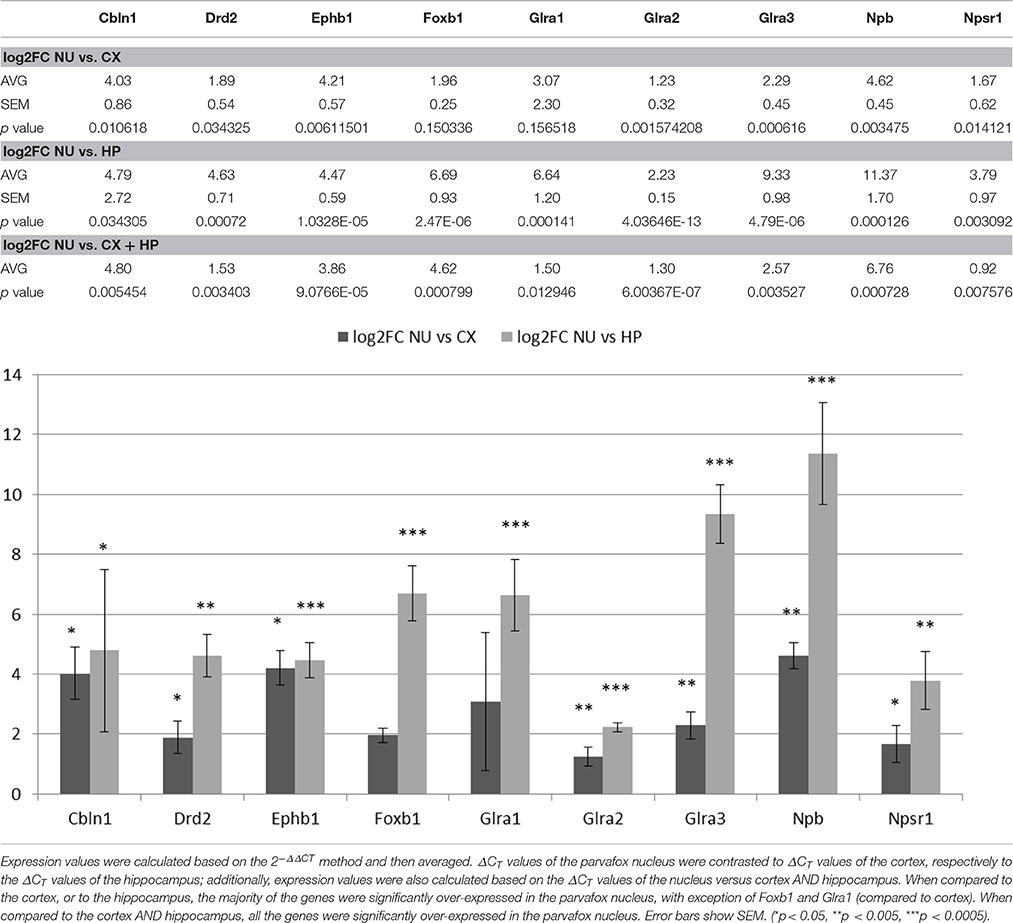
Table 3. Expression values presented as fold change on log2 scale obtained by qRT-PCR.
Analysis of the Putative Roles of the Genes That Were Enriched in the Parvafox Nucleus
We conducted a MetaCore (GeneGO)-enrichment analysis on a set of genes that had been revealed to be expressed in the parvafox nucleus by the combined results of the gene-microarray, the ABA-ISH database and the B*-database evaluations, as well as previous observations (Girard et al., 2011) (Table 4). This analysis revealed high expression levels of specific genes encoding proteins of various biological processes, the most noteworthy being synaptic transmission (Ionotropic glutamate receptor, Kv1.2, GluR5, Galpha(i)-specific amine GPCRs, GlyRA3, Galpha(q)-specific peptide GPCRs, HCN, KCNAB3, Cerebellin 1, NEFL, Kainate receptor, HCN2, VAMP1, Kv3.1, GlyRA1, PLC-beta), neuropeptide signaling pathway (Galpha(s)-specific CRF GPCRs, PACAP, GlyRA2, Neurexophilin 4, Galpha(q)-specific peptide GPCRs, Neuropeptide S receptor, CRHR1, Enkephalin A, GlyRA1), and regulation of the inhibitory postsynaptic membrane potential (Ionotropic glutamate receptor, GluR5, Galpha(i)-specific amine GPCRs, Kainate receptor, GlyRA1). A relation to behavioral response to pain was also manifested (Ionotropic glutamate receptor, Galpha(s)-specific CRF, GPCRs, GluR5, Galpha(q)-specific peptide GPCRs, CRHR1, Kainate receptor) (Table 4).
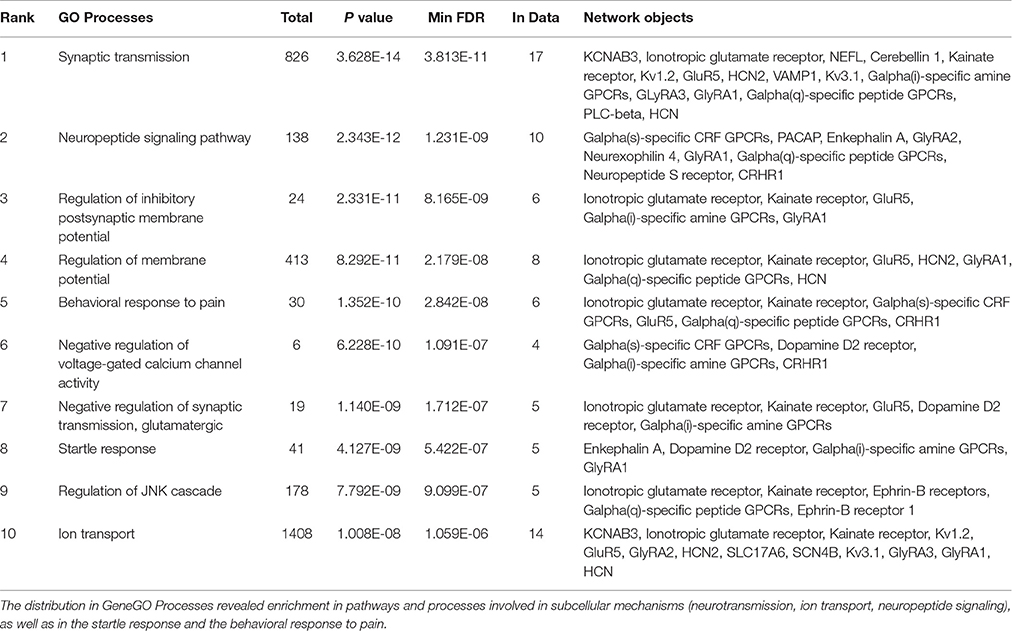
Table 4. A GeneGO (MetaCore) enrichment analysis was performed on 45 genes found enriched in our microarray, in the ABA-ISH and in the B* database, supplemented with genes which had previously been found to be positive in the parvafox nucleus (Girard et al., 2011).
Immunohistochemistry Revealed Parv-Positive Neurons of the Parvafox Nucleus to Express Glycine Receptor α2
For an additional independent verification of the most robust and interesting results, an antiserum against the Glyrα2-receptor was used to detect immunoreactivity in the hypothalamus. Positive immunolabeling was selectively observed in a few hypothalamic regions, one being the parvafox nucleus (Figures 2A–C). At higher magnification, the immunoreactivity was revealed to be associated with the plasma membrane of the Parv-positive neurons in this region (Figures 2D–F). Immunoblot analysis of murine hypothalamus protein extract with the antiserum against Glyrα2 resulted in a sharp band below 50 KDa, the expected molecular weight for the Glyrα2 receptor (Figure 3), confirming the presence of Glyrα2 in the hypothalamus, as well as the specificity of the Glyrα2-antibody used in our study. In addition to the hypothalamus, we detected Glyrα2 in hippocampal and cortical lysates (Figure 3) as well, regions that served as reference structures in the microarray analysis.
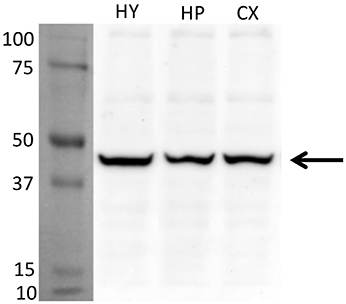
Figure 3. Detection of Glyrα2 on hypothalamic, hippocampal and cortical extracts by immunoblot. The antiserum against Glyrα2 detects a single band below 50 KDa (arrow) in an immunoblot of hypothalamic, hippocampal and cerebral cortical extracts submitted to SDS-gel electrophoresis. (HY, hypothalamus; HP, hippocampus; CX, cortex).
GlyT2-EGFP-Positive Axon Terminals End on Parv-Neurons of the Parvafox Nucleus
To confirm that Parv-neurons of the parvafox-nucleus indeed receive input from glycinergic nerve cells, Glycine transporter 2 (GlyT2)-expression was studied in GlyT2-EGFP mice (Zeilhofer et al., 2005). Double-immunolabeling of Parv and GFP revealed a dense net of GlyT2-EGFP positive axons and axon terminals in the parvafox region. We found that several GlyT2-EGFP axon terminals indeed ended on Parv-neurons (Figures 4A–C). Confocal laser microscope z-stacks were then subjected to 3D-reconstruction with the Imaris software for a better visualization (Figure 4D). The 3D-reconstruction demonstrated GlyT2-EGFP axon terminals in apposition both to the dendrites (Figure 4E, see arrows) and to the perikarya (Figure 4F, see arrows) of Parv-neurons of the parvafox nucleus.
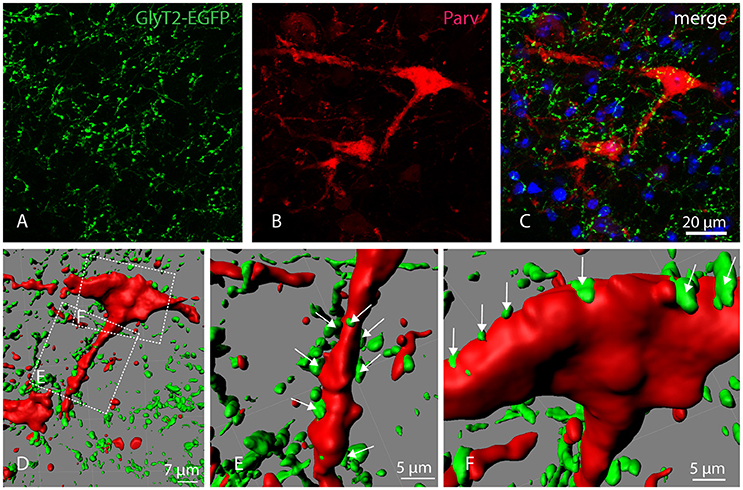
Figure 4. Localization of GlyT2-EGFP-positive axons and axon terminals in the parvafox nucleus. Confocal laser micrographs of double-immunohistochemistry for GFP (green, A) and Parv (red, B) performed on brain sections of transgenic GlyT2-EGFP mice revealed the presence of several axons and axon terminals in the hypothalamic region encompassing the parvafox nucleus. The merged image (C) shows GlyT2-EGFP-positive terminals around the perikaryon and the dendrites of a Parv-positive neuron. Three-dimensional reconstruction by Imaris (D) reveals several EGFP-positive terminals on the dendrite (E, see arrows), as well as on the cell body (F, see arrows) of the Parv-neuron.
Discussion
Laser-capture microdissection has been used in a variety of publications for the identification of marker genes that may help in the genetic dissection of functionally well characterized regions of the medial hypothalamus (Segal et al., 2005; Paulsen et al., 2009; Landmann et al., 2012; Lee et al., 2012; Humerick et al., 2013).
The aim of our gene-microarray analysis was primarily the search for neuromodulator genes in neurons of an ill-defined lateral hypothalamic region of as yet unknown function. Notwithstanding the methodological complexity, the expression of the receptors for the inhibitory neurotransmitter glycine in the parvafox nucleus is now well documented by our study.
This study has permitted an extension of the list of genes that are preferentially expressed in the parvafox nucleus of the ventrolateral hypothalamus. In addition to the 76 genes that were previously identified to be expressed by Girard et al. (2011), additional 82 (some overlapping) have been shown to be enriched in this region by our gene-microarray analysis. A survey of the ABA-ISH and B* databases for their hypothalamic distribution confirmed the expression of at least 13 of these genes in the parvafox nucleus. The expression of nine particularly relevant genes involved in neuromodulation was corroborated by qRT-PCR.
Interestingly, only a few genes (Adcyap1, Pitx2, Slc17A6, Plb4, Itih3, Hist1h1b, Tmem163) were revealed to be commonly expressed by the gene-microarray analysis and the ABA-ISH-database screening (Girard et al., 2011) thereby indicating that the two methodologies differ in sensitivity, specificity and selectivity. Although, both the in-situ-hybridization technique and the gene-microarray approach revealed an expression of various gene-families (e.g., neurotransmitters, transcription factors, extracellular molecules), the individual members thereof that were revealed by the ABA-ISH-database screening differed from those that were brought to light by the gene-microarray analysis.
The most obvious explanation of this discrepancy is that the gene-array search for the relative abundances based on a comparison between regions, namely, between the hypothalamus and either the cortex or the hippocampus. Consequently, the genes that are expressed in both regions were excluded. For example, the potassium channels (Kcna1, Kcna2, Kcnab2, Kcnab3, Kcnc1, Kcnc2, and Kcnk1), which are responsible for the high firing rates of Parv-positive neurons in the cortex and the hippocampus, were recognized as being expressed in the parvafox nucleus by the ABA-ISH-database screening (Girard et al., 2011) but not by the gene-microarray analysis (Table 1). Nevertheless, a detailed comparison of the long list of expressed genes in the gene-microarrays of both mice revealed that approximately 40% of those that were registered in the study of (Girard et al., 2011) were also enriched in the gene-microarray of the parvafox nucleus (results not shown).
For some genes, no in-situ-hybridization data exist as yet in the ABA-ISH (Table 1). For others (e.g., Npb, Foxb1), screening of the ABA-ISH database yielded negative results, even though the expression of such genes in the hypothalamus has been demonstrated by in-situ hybridization or immunohistochemistry in other reports (Dun et al., 2005; Civelli et al., 2006). Low-level transcripts may be below the threshold of detection by in situ hybridization techniques, and more sensitive techniques such as qRT-PCR may be needed to validate their expression in the parvafox nucleus. Hence, falsely negative results partially account for the discrepant findings.
On the other hand, it is also conceivable that the gene-array technique yields falsely-positive or falsely-negative results (Mitchell and Mirnics, 2012). The former may arise from the non-specific binding of cDNAs to homologous oligonucleotide probes, and the latter from the privileged amplification of certain mRNAs at the expense of others.
Hence, taking into account the combined results of the three approaches (Gene-array/ABA/B*) maximizes the reliability of the information we have gained. The counterchecking of findings revealed by a gene-microarray analysis against those disclosed by in-situ hybridization (screening of the ABA-ISH database) and in the B* database, is a legitimate mean of predicting the expression profiles of the neurons in the parvafox nucleus. Albeit so, it represents only a first approximation: the definitive allocation of gene-expression activity to a specific sub-population of neurons awaits the instigation of antibodies against the corresponding proteins for a definitive immunohistological confirmation of their localization to specific sub-population of neurons (Parv- or Foxb1-expressing). Furthermore, functional in-vitro studies investigating for example the effects of blocking glycinergic transmission or applying locally the corresponding neurotransmitter will be needed to confirm the physiological roles of the genes of interest.
The glycinergic inhibitory system is particularly powerful in the spinal cord and the brainstem, where virtually all immunoreactive cell-bodies are located (Kirsch, 2006). However, glycine-immunoreactive fibers and terminals have been observed in various parts of the brain by different authors (Zeilhofer et al., 2005; Barreiro-Iglesias et al., 2013) and glycine-induced chloride-currents were discovered already in 1989 in dissociated hypothalamic neurons (Akaike and Kaneda, 1989). Functional glycine receptors have been detected in higher brain centers, such as the hippocampus (Brackmann et al., 2004; Keck and White, 2009; Xu and Gong, 2010), and the glycine transporter 2 has been demonstrated in the whole brain as well as in the hypothalamus (Zeilhofer et al., 2005). The glycine receptor alpha 2 subunit alone can build functional receptors in adults and is particularly expressed in hippocampus and cortex (Meier et al., 2014). The expression of other components of the glycinergic system (glycine itself, glycine transporters, Glyrα1 and Glyrα3 glycine receptors, gephyrin) in the parvafox nucleus has been confirmed partly by the ABA-ISH-database screening (Figure 1) and by ongoing immunohistochemical studies. Hence, glycine appears to be an important inhibitory neurotransmitter in the parvafox nucleus, as also underlined by the Gene-GO enrichment analysis. The cell bodies giving rise to the axonal endings that abut on the neurons of the parvafox nucleus may be located in the brainstem, where aggregates of glycinergic neurons have been described (Zeilhofer et al., 2005).
In conclusion, the use of the laser capture microdissection and gene-microarray-based approach in combination with data verification in the ABA-ISH and B* databases has proved to be on efficient means of gaining further insight into the transcriptome of the murine parvafox nucleus. Nine genes were confirmed by independent techniques to be enriched therein. Some of these markers may be useful to define subpopulations of parvafox neurons as a prelude to studying their circuitry and function. The augmented expression levels of several of these genes shed light on the functional mechanisms that may be operative in the parvafox nucleus, for example, the glycine-mediated inhibitory control.
Author Contributions
VS and GWA contributed equally to this work. VS and GWA designed and conducted the experiments, analyzed and interpreted results, and wrote the paper. MRC designed the experiments and wrote the paper.
Conflict of Interest Statement
The authors declare that the research was conducted in the absence of any commercial or financial relationships that could be construed as a potential conflict of interest.
Acknowledgments
We would like to thank Franck Girard, PhD for continuous support and for improving the manuscript, Christiane Marti and Laurence Clement for help with cryostate-cutting, immunohistochemistry and immunoblot. GlyT2-EGFP mice (Zeilhofer et al., 2005) were kindly provided from Prof. Hanns Ulrich Zeilhofer, Zürich. Glra2-KO specimens were a kind gift of the lab of Prof. Bert Brône, Hasselt University, Hasselt, Belgium. This work was supported by a grant from the Swiss National Foundation (Grant No. 3100A0-113524). The authors declare no conflicts of interest.
Supplementary Material
The Supplementary Material for this article can be found online at: http://journal.frontiersin.org/article/10.3389/fnmol.2017.00008/full#supplementary-material
Abbreviations
3V, third ventricle; ABA, Allen Brain Atlas; ABA-ISH, Allen Brain Atlas of in-situ hybridizations; BMA, basomedial amygdalar nucleus; Cx, cortex; DMH, dorsomedial hypothalamic nucleus; f, fornix; fc, fold-change; Gad1, glutamate decarboxylase 1; Glra1, glycine receptor, alpha 1 subunit (gene); Glra2, glycine receptor, alpha 2 subunit (gene); Glra3, glycine receptor, alpha 3 subunit (gene); Glyrα2; glycine receptor, alpha 2 subunit (protein); Glyrα3, glycine receptor, alpha 3 subunit (protein); hp, hippocampus; ic, internal capsule; ISH, in-situ hybridization; LHA, lateral hypothalamic area; MEA, medial amygdalar nucleus; mt, mammillothalamic tract; ns, nigrostriatal bundle; opt, optic tract; Parv, parvalbumin (protein); Pvalb, parvalbumin (gene); Slc17a6, solute carrier family 17 member 6; Slc17a7, solute carrier family 17 member 7; STh, subthalamic nucleus; TH, thalamus; VMH, ventromedial hypothalamic nucleus; ZI, Zona incerta.
References
Akaike, N., and Kaneda, M. (1989). Glycine-gated chloride current in acutely isolated rat hypothalamic neurons. J. Neurophysiol. 62, 1400–1409.
Barreiro-Iglesias, A., Mysiak, K. S., Adrio, F., Rodicio, M. C., Becker, C. G., Becker, T., et al. (2013). Distribution of glycinergic neurons in the brain of glycine transporter-2 transgenic Tg(glyt2:Gfp) adult zebrafish: relationship to brain-spinal descending systems. J. Comp. Neurol. 521, 389–425. doi: 10.1002/cne.23179
Bilella, A., Alvarez-Bolado, G., and Celio, M. R. (2014). Coaxiality of Foxb1- and parvalbumin-expressing neurons in the lateral hypothalamic PV1-nucleus. Neurosci. Lett. 566, 111–114. doi: 10.1016/j.neulet.2014.02.028
Bilella, A., Alvarez-Bolado, G., and Celio, M. R. (2016). The Foxb1-expressing neurons of the ventrolateral hypothalamic parvafox nucleus project to defensive circuits. J. Comp. Neurol. 524, 2955–2981. doi: 10.1002/cne.24057
Brackmann, M., Zhao, C., Schmieden, V., and Braunewell, K. H. (2004). Cellular and subcellular localization of the inhibitory glycine receptor in hippocampal neurons. Biochem. Biophys. Res. Commun. 324, 1137–1142. doi: 10.1016/j.bbrc.2004.09.172
Celio, M. R. (1986). Parvalbumin in most gamma-aminobutyric acid-containing neurons of the rat cerebral cortex. Science 231, 995–997. doi: 10.1126/science.3945815
Celio, M. R. (1990). Calbindin D-28k and parvalbumin in the rat nervous system. Neuroscience 35, 375–475. doi: 10.1016/0306-4522(90)90091-H
Celio, M. R., Babalian, A., Ha, Q. H., Eichenberger, S., Clément, L., Marti, C., et al. (2013). Efferent connections of the parvalbumin-positive (PV1) nucleus in the lateral hypothalamus of rodents. J. Comp. Neurol. 521, 3133–3153. doi: 10.1002/cne.23344
Celio, M. R., and Blümcke, I. (1994). Perineuronal nets–a specialized form of extracellular matrix in the adult nervous system. Brain Res. Brain Res. Rev. 19, 128–145. doi: 10.1016/0165-0173(94)90006-X
Civelli, O., Saito, Y., Wang, Z., Nothacker, H. P., and Reinscheid, R. K. (2006). Orphan GPCRs and their ligands. Pharmacol. Ther. 110, 525–532. doi: 10.1016/j.pharmthera.2005.10.001
Davis, F. P., and Eddy, S. R. (2009). A tool for identification of genes expressed in patterns of interest using the Allen Brain Atlas. Bioinformatics 25, 1647–1654. doi: 10.1093/bioinformatics/btp288
Dun, S. L., Brailoiu, G. C., Mizuo, K., Yang, J., Chang, J. K., and Dun, N. J. (2005). Neuropeptide B immunoreactivity in the central nervous system of the rat. Brain Res. 1045, 157–163. doi: 10.1016/j.brainres.2005.03.024
Girard, F., Meszar, Z., Marti, C., Davis, F. P., and Celio, M. (2011). Gene expression analysis in the parvalbumin-immunoreactive PV1 nucleus of the mouse lateral hypothalamus. Eur. J. Neurosci. 34, 1934–1943. doi: 10.1111/j.1460-9568.2011.07918.x
Humerick, M., Hanson, J., Rodriguez-Canales, J., Lubelski, D., Rashid, O. M., Salinas, Y. D., et al. (2013). Analysis of transcription factor mRNAs in identified oxytocin and vasopressin magnocellular neurons isolated by laser capture microdissection. PLoS ONE 8:e69407. doi: 10.1371/journal.pone.0069407
Jackson, V. R., Lin, S. H., Wang, Z., Nothacker, H. P., and Civelli, O. (2006). A study of the rat neuropeptide B/neuropeptide W system using in situ techniques. J. Comp. Neurol. 497, 367–383. doi: 10.1002/cne.20989
Kasukawa, T., Masumoto, K. H., Nikaido, I., Nagano, M., Uno, K. D., Tsujino, K., et al. (2011). Quantitative expression profile of distinct functional regions in the adult mouse brain. PLoS ONE 6:e23228. doi: 10.1371/journal.pone.0023228
Keck, T., and White, J. A. (2009). Glycinergic inhibition in the hippocampus. Rev. Neurosci. 20, 13–22. doi: 10.1515/REVNEURO.2009.20.1.13
Kirsch, J. (2006). Glycinergic transmission. Cell Tissue Res. 326, 535–540. doi: 10.1007/s00441-006-0261-x
Landmann, E. M., Schellong, K., Melchior, K., Rodekamp, E., Ziska, T., Harder, T., et al. (2012). Short-term regulation of the hypothalamic melanocortinergic system under fasting and defined glucose-refeeding conditions in rats: a laser capture microdissection (LMD)-based study. Neurosci. Lett. 515, 87–91. doi: 10.1016/j.neulet.2012.03.025
Lee, S., Bookout, A. L., Lee, C. E., Gautron, L., Harper, M. J., Elias, C. F., et al. (2012). Laser-capture microdissection and transcriptional profiling of the dorsomedial nucleus of the hypothalamus. J. Comp. Neurol. 520, 3617–3632. doi: 10.1002/cne.23116
Lein, E. S., Hawrylycz, M. J., Ao, N., Ayres, M., Bensinger, A., Bernard, A., et al. (2007). Genome-wide atlas of gene expression in the adult mouse brain. Nature 445, 168–176. doi: 10.1038/nature05453
Livak, K. J., and Schmittgen, T. D. (2001). Analysis of relative gene expression data using real-time quantitative PCR and the 2−ΔΔCT Method. Methods 25, 402–408. doi: 10.1006/meth.2001.1262
Meier, J. C., Semtner, M., Winkelmann, A., and Wolfart, J. (2014). Presynaptic mechanisms of neuronal plasticity and their role in epilepsy. Front. Cell. Neurosci. 8:164. doi: 10.3389/fncel.2014.00164
Mészár, Z., Girard, F., Saper, C. B., and Celio, M. R. (2012). The lateral hypothalamic parvalbumin-immunoreactive (PV1) nucleus in rodents. J. Comp. Neurol. 520, 798–815. doi: 10.1002/cne.22789
Mitchell, A. C., and Mirnics, K. (2012). Gene expression profiling of the brain: pondering facts and fiction. Neurobiol. Dis. 45, 3–7. doi: 10.1016/j.nbd.2011.06.001
Morelli, G., Avila, A., Ravanidis, S., Aourz, N., Neve, R. L., Smolders, I., et al. (2016). Cerebral cortical circuitry formation requires functional glycine receptors. Cereb. Cortex. doi: 10.1093/cercor/bhw025. [Epub ahead of print].
Paulsen, S. J., Larsen, L. K., Jelsing, J., Janssen, U., Gerstmayer, B., and Vrang, N. (2009). Gene expression profiling of individual hypothalamic nuclei from single animals using laser capture microdissection and microarrays. J. Neurosci. Methods 177, 87–93. doi: 10.1016/j.jneumeth.2008.09.024
Schulz, S., Stumm, R., and Höllt, V. (2007). Immunofluorescent identification of neuropeptide B-containing nerve fibers and terminals in the rat hypothalamus. Neurosci. Lett. 411, 67–71. doi: 10.1016/j.neulet.2006.10.015
Segal, J. P., Stallings, N. R., Lee, C. E., Zhao, L., Socci, N., Viale, A., et al. (2005). Use of laser-capture microdissection for the identification of marker genes for the ventromedial hypothalamic nucleus. J. Neurosci. 25, 4181–4188. doi: 10.1523/JNEUROSCI.0158-05.2005
Szabolcsi, V., and Celio, M. R. (2015). De novo expression of parvalbumin in ependymal cells in response to brain injury promotes ependymal remodeling and wound repair. Glia 63, 567–594. doi: 10.1002/glia.22768
Xu, T. L., and Gong, N. (2010). Glycine and glycine receptor signaling in hippocampal neurons: diversity, function and regulation. Prog. Neurobiol. 91, 349–361. doi: 10.1016/j.pneurobio.2010.04.008
Keywords: parvalbumin, laser capture microdissection, glycine receptor α2, Allen Brain Atlas Database of in-situ hybridizations (ABA-ISH), BrainStars (B*) microarrays, PV1-Foxb1, parvafox, GlyT2-EGFP
Citation: Szabolcsi V, Albisetti GW and Celio MR (2017) Parvalbumin-Neurons of the Ventrolateral Hypothalamic Parvafox Nucleus Receive a Glycinergic Input: A Gene-Microarray Study. Front. Mol. Neurosci. 10:8. doi: 10.3389/fnmol.2017.00008
Received: 07 September 2016; Accepted: 06 January 2017;
Published: 23 January 2017.
Edited by:
Jean-Marc Taymans, French Institute of Health and Medical Research (Inserm), FranceReviewed by:
Johannes Vogt, University of Mainz, GermanyLei Pei, Huazhong University of Science and Technology, China
Copyright © 2017 Szabolcsi, Albisetti and Celio. This is an open-access article distributed under the terms of the Creative Commons Attribution License (CC BY). The use, distribution or reproduction in other forums is permitted, provided the original author(s) or licensor are credited and that the original publication in this journal is cited, in accordance with accepted academic practice. No use, distribution or reproduction is permitted which does not comply with these terms.
*Correspondence: Marco R. Celio, marco.celio@unifr.ch
†These authors have contributed equally to this work.