1
Department of Biology, Norwegian University of Science and Technology, Trondheim, Norway
2
Institut für Biologie-Neurobiologie, Freie Universität Berlin, Berlin, Germany
We use the moth Heliothis virescens as model organism for studying the neural network involved in chemosensory coding and learning. The constituent neurons are characterised by intracellular recordings combined with staining, resulting in a single neuron identified in each brain preparation. In order to spatially relate the neurons of different preparations a common brain framework was required. We here present an average shaped atlas of the moth brain. It is based on 11 female brain preparations, each stained with a fluorescent synaptic marker and scanned in confocal laser-scanning microscope. Brain neuropils of each preparation were manually reconstructed in the computer software Amira, followed by generating the atlas using the Iterative Shape Average Procedure. To demonstrate the application of the atlas we have registered two olfactory and two gustatory interneurons, as well as the axonal projections of gustatory receptor neurons into the atlas, visualising their spatial relationships. The olfactory interneurons, showing the typical morphology of inner-tract antennal lobe projection neurons, projected in the calyces of the mushroom body and laterally in the protocerebral lobe. The two gustatory interneurons, responding to sucrose and quinine respectively, projected in different areas of the brain. The wide projections of the quinine responding neuron included a lateral area adjacent to the projections of the olfactory interneurons. The sucrose responding neuron was confined to the suboesophageal ganglion with dendritic arborisations overlapping the axonal projections of the gustatory receptor neurons on the proboscis. By serving as a tool for the integration of neurons, the atlas offers visual access to the spatial relationship between the neurons in three dimensions, and thus facilitates the study of neuronal networks in the Heliothis virescens brain. The moth standard brain is accessible at http://www.ntnu.no/biolog/english/neuroscience/brain
Challenged by the need to integrate the rapidly growing data in neuroscience, digital brain atlases have become an important tool serving as a database for neural structures with their three dimensional spatial information. The intention is to provide common frameworks into which data from different brain preparations can be registered and spatially related. As the scientific record includes data from many animal species, digital brain atlases of several vertebrates and invertebrates have been made (Toga and Thompson, 2001
; Rein et al., 2002
; Toga, 2002
; Van Essen, 2002
; Brandt et al., 2005
; Kurylas et al., 2008
; Jundi et al., 2009
). In insects, three dimensional digital brain atlases have been generated for four species; the population-based quantitative atlas of the fruit fly Drosophila melanogaster (Rein et al., 2002
), the average shaped standard atlas of the honeybee Apis mellifera (Brandt et al., 2005
) and the locust Schistocerca gregaria (Kurylas et al., 2008
), and the recently made standard brain atlas of the hawkmoth Manduca sexta (Jundi et al., 2009
). In creating the locust brain atlas two procedures were used for comparison, the Virtual Insect Brain (VIB) procedure initially developed for standardisation of the fruit fly neuroanatomy (Jenett et al., 2006
) and the Iterative Shape Averaging (ISA) procedure developed to generate the honeybee standard brain (Rohlfing et al., 2001
; Brandt et al., 2005
). This study concluded that the VIB procedure using a global and a local rigid transformation followed by a local nonrigid transformation preserves anatomical variability, whereas the ISA procedure using an affine transformation followed by iterative nonrigid registrations reduces the variability.
The digital brain atlases of these four insects are based on common neuropil substrates like the protocerebrum including the optic lobes, the central body and the mushroom bodies, the deutocerebrum with the antennal lobes, and the tritocerebrum. Additional structures included in two or three of the atlases are the protocerebral bridge, anterior optic tubercles, lateral horns and the suboesophageal ganglion, the latter fused with the brain in the fly, the honeybee and the moth. These structures are involved in visual, olfactory and gustatory information processing as well as associative learning and memory formation. They are linked by neurons mediating information from one structure to the next where the information is further processed, thus forming networks within and between the different brain structures. In order to understand how the neuronal networks operate, it is critical to clarify the connectivity between physiologically and morphologically characterised neurons in the circuits. Revealing such details is a very elaborate process requiring a preparation accessible for in vivo recordings of identifiable neurons. Particularly suited for these examinations are the insects. Their nervous system is easily accessible for intracellular electrophysiological recordings. Combined with staining the entire morphology of the neurons can be precisely determined and three dimensionally visualised in the individual brain. In addition the brain is small enough to be studied as a whole, avoiding the problem of cutting neurons projecting out of a section. The number of identified neurons is large and growing, like neurons of the visual system in the fly Calliphora vicina and the locust Schistocerca gragaria (Borst and Haag, 2002
; Heinze and Homberg, 2007
), the olfactory system in a number of species (Kanzaki et al., 1989
; Heinbockel et al., 1999
; Lei et al., 2001
; Müller et al., 2002
; Reisenman et al., 2005
; Rø et al., 2007
; Yamagata et al., 2007
) auditory system of the crickets (Poulet and Hedwig, 2006
) the mushroom bodies in the honeybee (Mauelshagen, 1993
; Rybak and Menzel, 1998
) as well as neuromodulatory neurons and descending neurons (Kanzaki et al., 1991
; Hammer, 1993
; Bräunig and Pflüger, 2001
). Consequently the need for a standardized brain model as a tool for organizing and analyzing data has been substantial in many species. In addition to the three dimentional digital standard atlases providing common frames for integrating neurons in the entire brain, separate atlases of the antennal lobes have been made in a number of species, including heliothine moths (Rospars and Chambille, 1981
; Flanagan and Mercer, 1989
; Stocker et al., 1990
; Galizia et al., 1999
; Laissue et al., 1999
; Rospars and Hildebrand, 2000
; Chiang et al., 2001
; Berg et al., 2002
; Sadek et al., 2002
; Reischig and Stengl, 2002
; Smid et al., 2003
; Greiner et al., 2004
; Huetteroth and Schachtner, 2005
; Masante-Roca et al., 2005
; Skiri et al., 2005a
; Iyengar et al., 2006
; Jefferis et al., 2007
). These atlases are valuable tools for studying the neuronal network involved in processing olfactory information (Namiki and Kanzaki, 2008
; Staudacher et al., 2009
).
The moth, Heliothis virescens, is a major pest insect in agriculture and an object for extensive research in many areas, including chemosensory coding, learning and memory (Hartlieb, 1996
; Mustaparta, 2002
; Skiri et al., 2005b
; Jørgensen et al., 2006
, 2007a
,b
; Kvello et al., 2006
). The generation of a standard brain atlas of H. virescens is particularly motivated by the already large amount of data on the olfactory and the gustatory system. Tuning of olfactory receptor neurons according to biologically relevant odorants, pheromones as well as plant odorants have been described (Berg et al., 1998
; Mustaparta and Stranden, 2005
; Røstelien et al., 2005
). Projections of the primary axons in particular glomeruli of the antennal lobe are shown for the pheromone system by functional tracing (Berg et al., 1998
). Antennal lobe projection neurons have been anatomically described according to glomerular innervation and axonal tracts (Rø et al., 2007
), studies that are being followed up in ongoing investigations focusing on the physiology of morphologically characterised neurons.
Whereas the central olfactory pathways have been described in this as well as in many insect species, only scarce knowledge exists about the central gustatory pathways in two insect species, the fly Sarcophaga bullata (Mitchell and Itagaki, 1992
) and in the locust Locusta migratoria (Rogers and Newland, 2003
). H. virescens is emerging as one of few model insects in elucidating the gustatory pathways. The axonal projections of the gustatory receptor neurons have been traced to defined areas of the suboesophageal ganglion and tritocerebrum (Jørgensen et al., 2006
; Kvello et al., 2006
), and intracellular recordings combined with staining of individual gustatory neurons in the CNS have been made from a large number of neurons (unpublished). Particularly interesting is the connection between the gustatory and the olfactory systems which forms the neuronal basis for associative learning of odorants and tastants. In order to integrate the existing and future data, as well as to spatially relate neurons of any brain compartment, a common framework of the entire H. virescens brain is needed. Using standard brain atlases to integrate identified neurons of different preparations offers easy visual access to the relative position of the neurons in three dimensions and thus promotes an understanding of their functional relationship. Therefore, in the search for neuronal networks in any animal species, a standard brain atlas is a valuable tool.
In this paper we present a digital standard brain atlas of the moth Heliothis virescens. Since the purpose is to relate spatial information between different preparations it is important to minimize individual variability. We therefore chose to generate the standard brain using the ISA procedure. To demonstrate its application we have registered two olfactory and two gustatory interneurons, as well as the axonal projections of the gustatory receptor neurons on the antennae and proboscis into the model using the procedure described by Brandt et al. (2005)
. The presented average standard brain atlas of this moth will be used as a tool for investigating and visualising the neural networks underlying gustatory and olfactory coding as well as appetitive and aversive learning and memory formation. The moth standard brain is accessible at http://www.ntnu.no/biolog/english/neuroscience/brain
Insects
The moths, Heliothis virescens (Heliothinae; Lepidoptera; Noctuidae) were imported as pupae from a laboratory culture at Novartis Crop Protection, Basel, Switzerland. Before emerging the pupae were separated according to sex and placed in a glass container (height: 18 cm, width: 12 cm, depth: 17 cm) covered by a perforated plexiglass. The container with pupae was kept in a Refritherm 6 E incubator (Struers) at a reversed photoperiod (14-h light and 10-h dark) and at a temperature of 22–23°C. When emerged, the adults were placed into a plexiglass cylinder (height: 20 cm, diameter: 10 cm) covered by a perforated lid. The moths were fed ad. lib. on a 0.15 M sucrose solution. Experiments were performed on adult female moths 3- to 5-days after emerging.
The Standard Brain
Preparations
Female moths were mounted in plastic tubes with the head immobilized by dental wax (Kerr Corporation, Romulus, MI, USA). After removing cephalic scales and mouthparts, the moths were decapitated. The brains were dissected in Ringer solution and fixed in 4% paraformaldehyde in a phosphate-buffered saline (PBS: 684 mM NaCl, 13 mM KCl, 50.7 mM Na2HPO4 and 5 mM KH2PO4, pH 7.2) over night at 4°C. After a 10-min rinse in PBS, preparations were dehydrated in an increasing ethanol series (50%, 70%, 90%, 96%, 100%, 10 min each), degreased in xylol for 5 min, and rehydrated in a decreasing ethanol series (100%, 96%, 90%, 70%, 50%, 10 min each). The brains were then washed for 10 min in PBS, and incubated for 30 min in 1 mg/ml collagenase solution (Collagenase Type I, Invitrogen Norge AS) at 36°C. Subsequently the brains were preincubated in 10% normal goat serum (NGS; Sigma, St. Louis, MO, USA) in a PBS solution containing 0.1% Triton X (PBSX) for 30 min at room temperature. The brains were further incubated with a monoclonal antibody against the synaptic protein synapsin (SYNORF 1, kindly provided by Dr. E. Buchner, Würzburg, Germany), diluted 1:10 in PBSX and 10% NGS for 48 h at 4°C. After the preparations had been rinsed five times each for 20 min in PBS, they were incubated for 24 h with a Cy5-conjungated goat anti-mouse secondary antibody (Jackson Immunoresearch; dilution 1:500 in PBSX) at 4°C. The incubation was followed by rinsing in PBS, five times for 20 min, before the brains were dehydrated in increasing ethanol series. Finally the brains were cleared in methyl salicylate and mounted as whole mounts in double-sided aluminium slides.
Visualization of brain preparations
The stained whole-mount brain preparations were visualized with a laser-scanning confocal microscope (LSM 510 META Zeiss, Jena, Germany) using a C-Apochromat 10×/0.45NA water objective. The fluorescent dye (Cy5) was exited by a 633 nm line of argon laser. Due to the large size of the brain, each preparation was scanned in two partially overlapping tiles with a resolution of 1024 × 1024 pixels in the xy-plane and an interslice distance of 3 μm (voxel size of 0.75 μm × 0.75 μm × 3 μm). The resulting two stacks of optical sections per brain were resampled in order to make the size of the files manageable for the computer, then merged and filtered by the computer software Amira 4.1 (Mercury Computer Systems, San Diego, CA, USA). To compensate for the refraction indexes of the mountant and that of the water objective, the z-axis dimension was multiplied by a factor of 1.3. The final voxel size of each stack consequently increased to 1.1 μm × 1.1 μm × 3.9 μm.
Reconstruction of brain structures
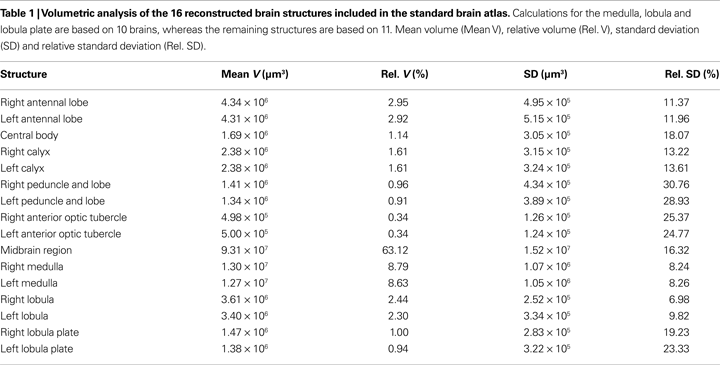
The gray value image stacks acquired from the confocal microscope were elaborately examined section by section and brain structures of interest were manually labelled using the segmentation editor in Amira (Table 1
). In this process any group of voxels belonging to a particular brain structure was given a unique label resulting in a stack of label images corresponding to the underlying confocal images. As a prerequisite to the subsequent registration and averaging process corresponding structures of the different brain preparations were given the same label. These label images were subsequently used to perform conventional volumetric analyzes, to reconstruct polygonal surface models and to generate the average standard brain atlas. The volume of each labelled structure was calculated by the “TissueStatistics” tool in Amira 4.1. Other conventional volumetric analyses, like mean volume, relative volume, standard deviations and relative standard deviation, were performed using Microsoft office Excel (2003).
Averaging brain structures
Creating the average standard brain followed the ISA method according to the description for the honeybee Apis mellifera and the locust Schistocerca gregaria (Rohlfing et al., 2001
; Brandt et al., 2005
; Kurylas et al., 2008
). One brain was first selected as a template. Then the label images of the other brain preparations were affine registered to the label images of the template brain followed by making an average. Then the affine registered brain preparations and the template were elastically registered to the average followed by the generation of a second average. This was repeated by a second elastic registration of the previous elastic registered preparations to the second average brain. Thus, the affine registration compensating for position, rotation and global size differences was performed only once whereas the elastic registration compensating for local differences in shape was performed twice. To verify the average shape property of the ISA-generated standard brain atlas, three dimentional polygonal surface models of the standard brain and each individual brain were made. They were subsequently aligned with respect to position, orientation and size before the shape differences between them were calculated. The calculations were performed using the surface distance tool in Amira 4.1 which measured the average distance between corresponding points on the surface of the different brain preparations.
Interneurons
Preparation
The insects were mounted in a plastic tube with the head exposed. Wax was used to immobilize the head and the mouthparts. For recording from the olfactory neurons, the antennae were fastened to the wax with tungsten cramps. The cuticle between the eyes was removed, exposing the antennal lobes and the protocerebrum. Large trachea, intracranial- and antennal muscles were removed to eliminate brain movements. When recording from gustatory interneurons the antenna and the uncoiled proboscis were fastened to the wax with tungsten cramps. The labium was cut off and the underlying trachea removed. Subsequently the left eye was cut off and the preparation tilted in order to expose the left side of the SOG and tritocerebrum. To facilitate insertion of the microelectrode the neurolemma was removed with a tungsten hook and the preparation was superfused with ringer solution.
Stimulation, recordings and staining
The taste stimuli used in the experiments were sucrose (1 M, Sigma-Aldrich), quinine hydrochloride (0.1 M, VWR), distilled water, and tactile touch, previously found to elicit responses in separate receptor neurons (Jørgensen et al., 2007a
). The stimuli were applied to the sensilla as droplets on a glass rod. The olfactory stimuli were applied as air puffs (0.8 ml/500 ms) through glass cartridges, each containing the odorants applied to a filter paper. The two neurons included were tested for 100 μg of each of 12 primary plant odorants (Hexanol, (3Z)-Hexen-1-ol, (3Z)-Hexenyl acetate, Ocimene, racemic- Linalool, Geraniol, (+)-3-Carene, trans-Verbenol, Methyl benzoate, 2-Phenylethanol, (-)-Germacrene D, Farnesene) (Røstelien et al., 2005
). Neuronal activity in the antennal lobe and the SOG was recorded intracellularly with a glass microelectrode containing 0.2 M K+-acetate solution with 4% dye (Micro-Ruby or Micro-Emerald, Invitrogen). After stimulation with tastants and odorants the neurons were stained by passing a 1–3 nA depolarizing current of 2 Hz with 0.2 s duration. Complete labelling of the neurons required dye injection for 5–10 min. After current injection, the dye was allowed to diffuse over night at 4°C. The brains were dissected in Ringer solution. The “olfactory” preparation was fixed in 4% paraformaldehyde in PBS similar to the standard brain preparations. The two “gustatory” preparations were also fixed in a solution of 4% paraformaldehyde in PBS, but additionally added 0.5% glutaraldehyde as an alternative and less time consuming way of visualizing neuropile structures. All three preparations were left over night at 4°C. To amplify the staining of the labelled neurons the brains were incubated in Streptavidin-Cy3 (Micro-Ruby stained preparations) and Streptavidin-Cy2 (Micro-Emerald stained preparations) (Jackson immunoresearch, West Grove, PA, USA; diluted 1:200 in PBS) over night at 4°C. After 10 min rinse in PBS the “olfactory” preparation went through the same protocol as the preparations used for the standard brain, starting with preincubation in 10% normal goat serum (NGS; Sigma, St. Louis, MO, USA) in a PBS solution containing 0.1% Triton X (PBSX) for 30 min at room temperature. Finally, all preparations were dehydrated in increasing ethanol series and cleared in methyl salicylate.
Visualization
The brains were mounted as whole mounts on double-sided aluminium slides and the stained neurons were examined with a confocal laser-scanning microscope (LSM 510 META, Zeiss, Jena, Germany) using a C-Apochromat 10×/0.45NA water objective, a C-Achroplan 40×/0.8NA water objective and a Plan-Neofluar 20×/0.5 dry lens objective. The two fluorescent dyes were exited by different lasers. Micro-emerald was excited by a Titanium Sapphire laser of 780 nm and a 488 nm argon laser, both filtered through a bandpass filter BP 500–550 IR. Micro-ruby was excited by a 543 nm Helium Neon laser and filtered through a bandpass filter BP 565–615 IR. The Titanium Sapphire laser was used for two-photon microscopy increasing the resolution in the z-axis which enabled us to better distinguish among overlapping neurites. The brains were scanned frontally with an interslice distance of 0.5–3 μm and an optical resolution in the y- and x-axis of 1024 × 1024 pixels. The neurons were scanned in several tiles and the tiles were manually merged in Amira. To compensate for the refraction indexes of the mountant and that of the water and dry lens objective, the z-axis dimension was multiplied by a factor of 1.3 and 1.6, respectively.
Reconstruction and registration of neurons into the average standard brain atlas
The gray value image stacks acquired from the confocal microscope were examined section by section and the neurons were semi-automatically reconstructed using the skeleton tool (Evers et al., 2004
; Schmitt et al., 2004
), which was implemented as a custom module in Amira 3.1. Registration of the neurons into the standard brain atlas followed the same procedure as described by Brandt et al. (2005)
. Selected brain structures in the “neuron-preparations” were reconstructed as label images. The selection only included brain structures corresponding to the structures in the standard brain atlas. Then, the label images in the “neuron-preparations” were affine- and elastically registered to the label images of the standard brain. The resulting transformation parameters for the brain structures were subsequently applied to the reconstructed neurons. The same procedure was followed for integrating the previously described gustatory receptor neurons (Jørgensen et al., 2006
; Kvello et al., 2006
).
Reconstruction
For creating the standard brain of the moth Heliothis virescens we selected the 11 best out of 72 female brain preparations. The selection was mainly based on the staining quality and the preservation of brain structures. Brain neuropils with high synaptic density were clearly stained with the antibody SYNORF 1 against synapsin, as visualized in the confocal microscope images (Figure 1
).
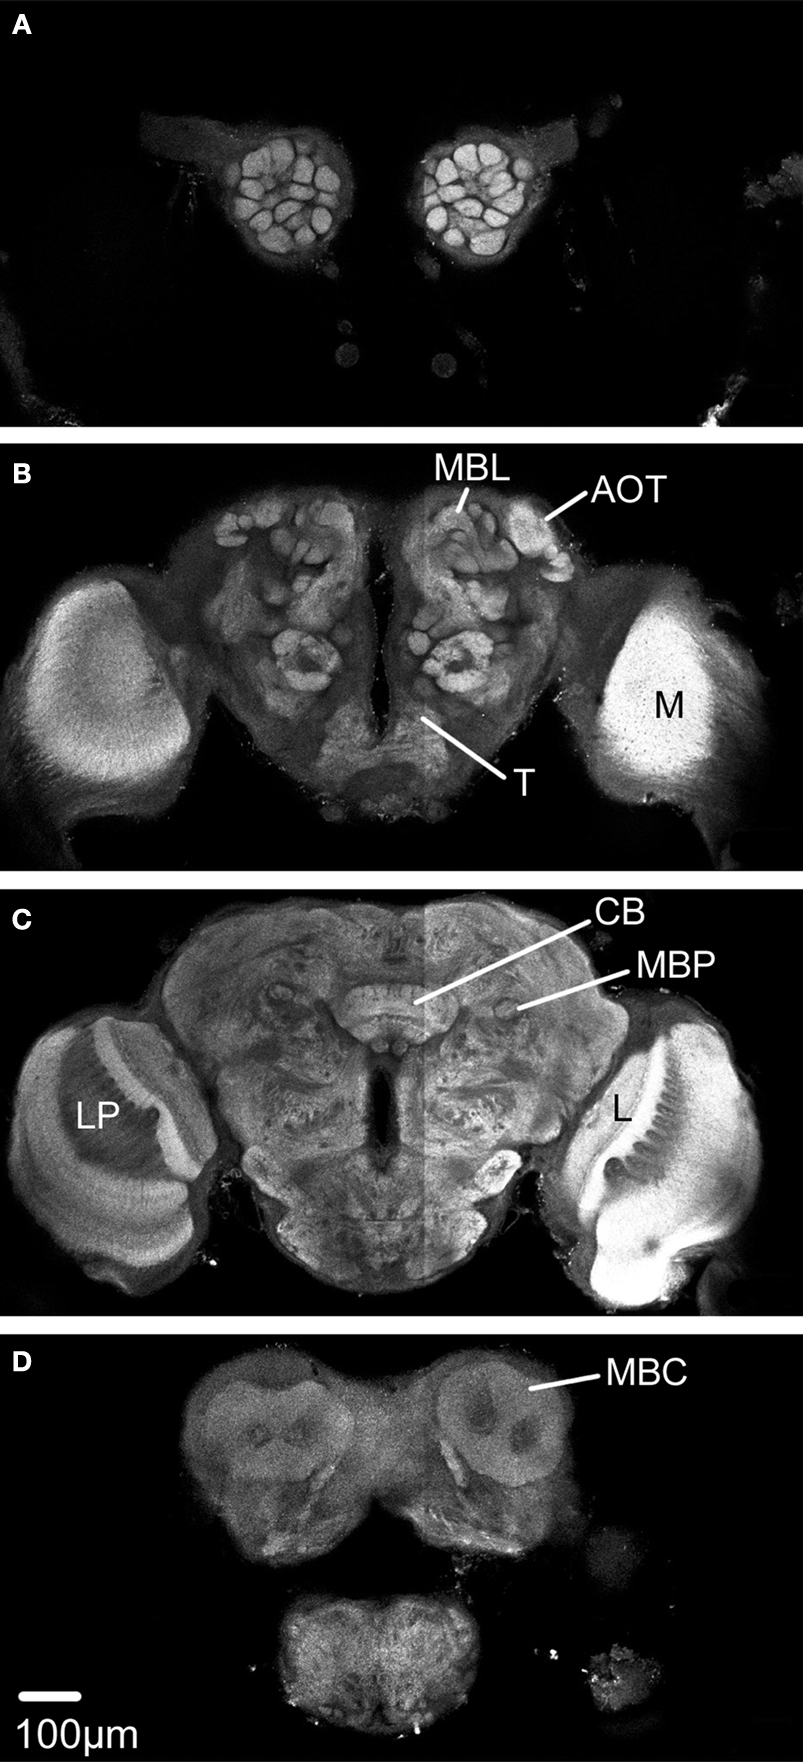
Figure 1. Confocal images of the Heliothis virescens brain immunostained with the synaptic marker SYNORF 1. Sections from anterior to posterior at depths 30 μm, 100 μm, 162 μm and 246 μm. (A) Right and left antennal lobes with olfactory glomeruli. (B–D) Anterior optic tubercle (AOT), mushroom body lobes (MBL), tritocerebrum (T), central body (CB), medulla (M), lobula (L), Lobula plate (LP), mushroom body peduncle (MBP) and mushroom body calyces (MBC). Light intensity difference is due to merging of two image stacks with different light intensities.
Based on distinguishable structures, each of the 11 brain preparations was divided into 16 anatomical regions that were separately labelled (Table 1
).
In one of the 11 preparations the optic lobes were excluded because of mechanical damage. However, the medial part of this brain was included because of its high staining quality. Because some neuropil structures could not be clearly distinguished in these whole mount preparations, they were included in a larger region. Thus, the region termed “Midbrain region” includes the protocerebral lobes with the lateral horns, the lateral accessory lobes, the protocerebral bridge and a small, previously not described structure located posterior to the antennal lobe glomeruli and merging into the protocerebrum. The midbrain region also includes the antennal mechanosensory and motor centre of the deutocerebrum, the tritocerebrum and the suboesophageal ganglion (SOG) (Figures 2
A,B).
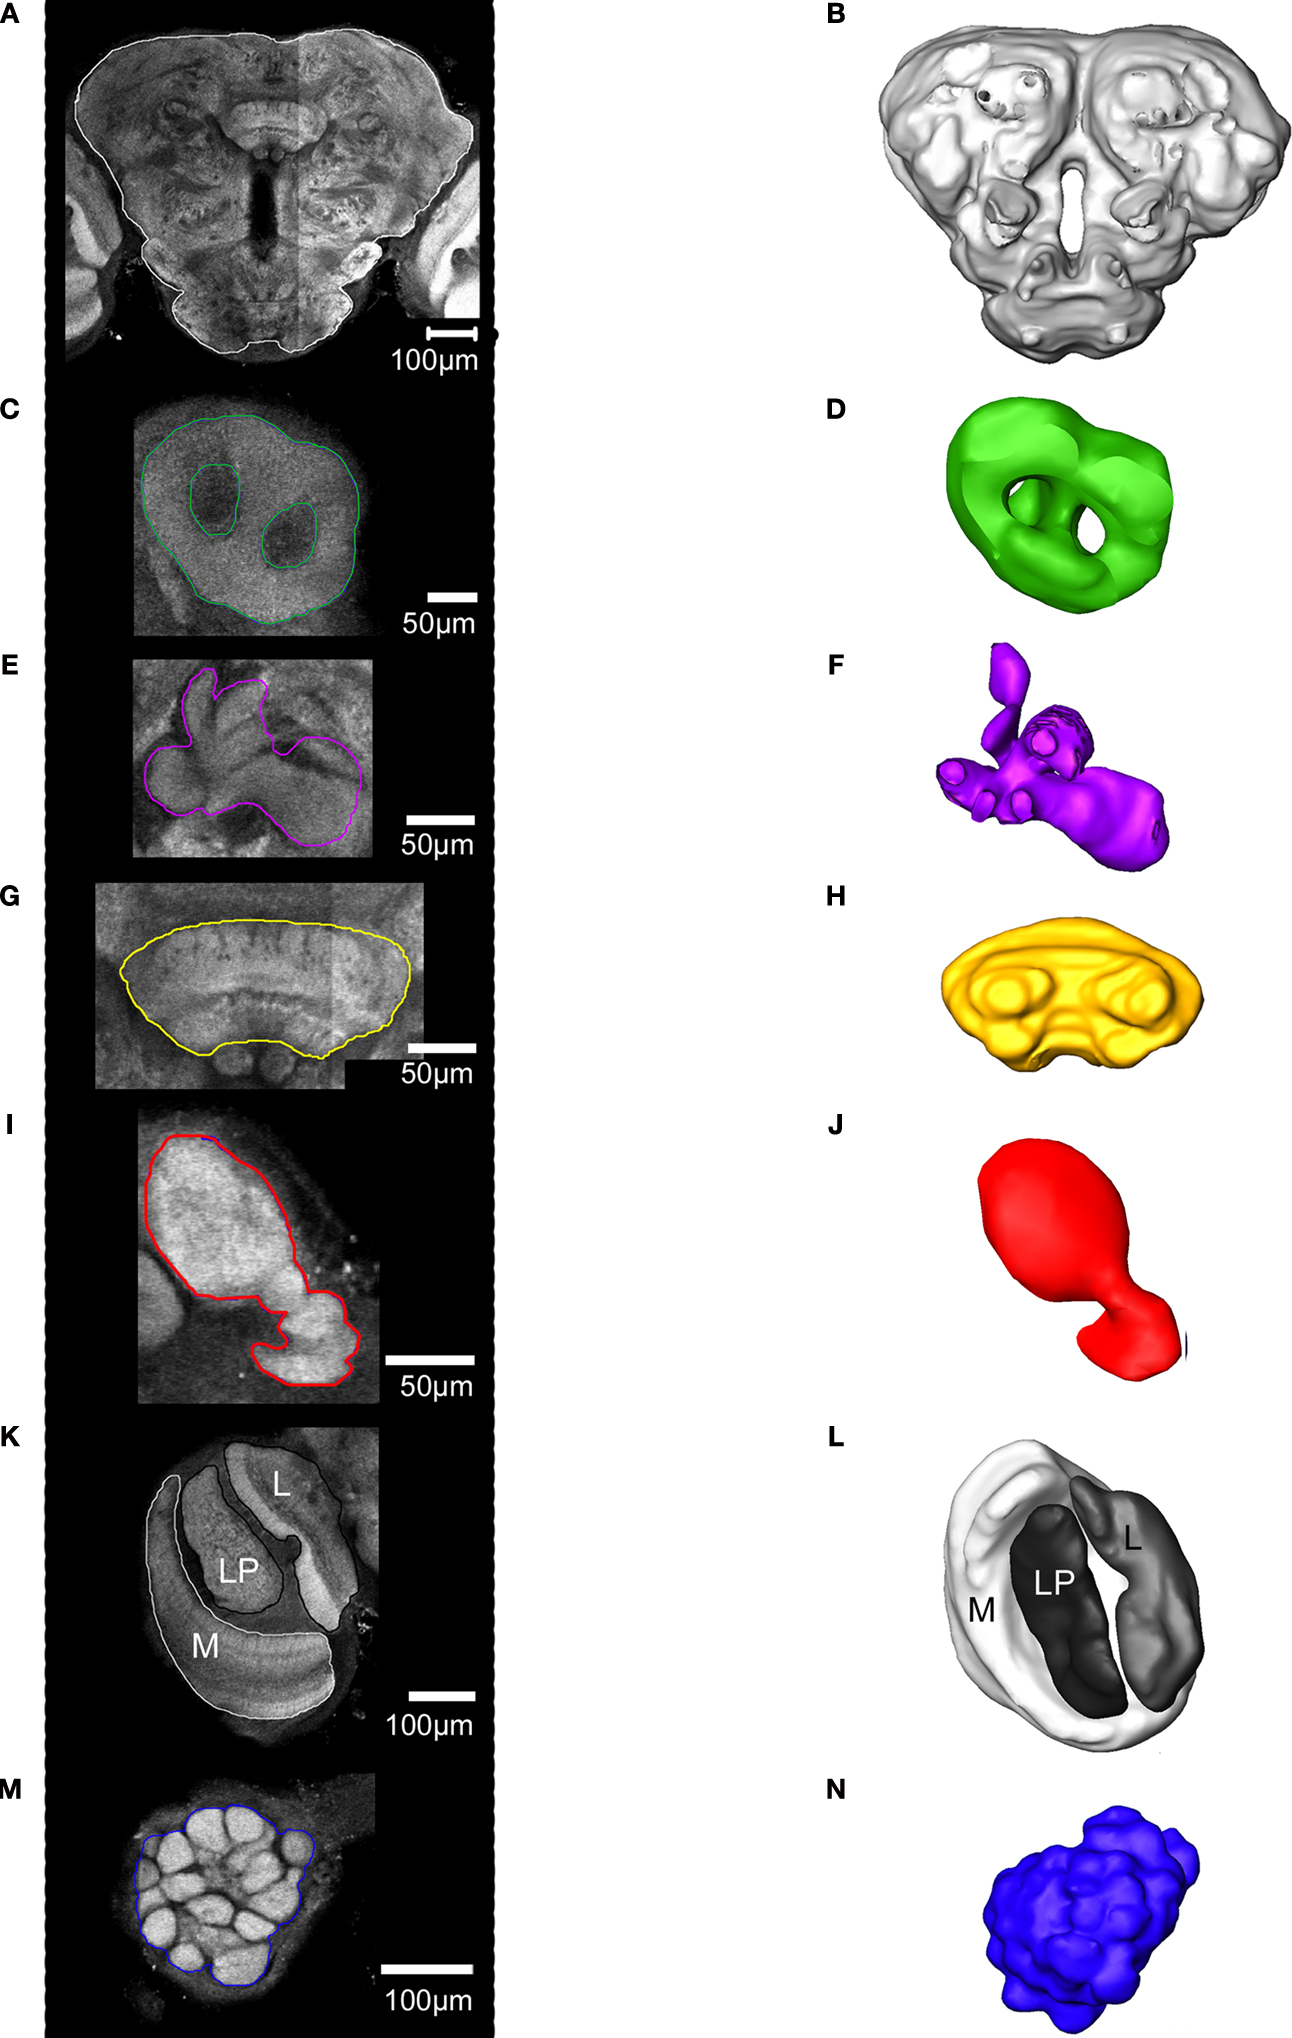
Figure 2. The structures included in the Heliothis virescens standard brain atlas visualized by confocal images including their labelled outline (left) and surface reconstructions (right). The images are from a single brain preparation. (A,B) Midbrain region. (C,D) Mushroom body calyx. (E,F) Mushroom body peduncle and lobes. (G,H) Central body. (I,J) Anterior optic tubercle. (K,L) Optic lobe neuropils including the medulla (M), lobula plate (LP) and lobula (L). (M,N) Antennal lobe glomeruli. Light intensity difference is due to merging of two image stacks with different light intensities.
The calyces of the mushroom bodies could be clearly distinguished from the surrounding protocerebrum and labelled as one distinct structure (Figures 2
C,D). The pedunculus and the lobe system of the mushroom bodies were difficult to completely separate and were therefore included as a single labelled region (Figures 2
E,F). The central body and the anterior optic tubercles could be distinguished and were assigned to separate labels (Figures 2
G–J). Among the lateral protocerebral structures comprising the optic lobes we included the medulla, the lobula and the lobula plate as separate labels (Figures 2
K,L). Among the deutocerebral structures we have collectively assigned the antennal lobe glomeruli as one labelled region (Figures 2
M,N). As a prerequisite to the subsequent registration process corresponding structures of the different preparations were given the same label. From the constructed label files a complete three dimensional surface reconstruction of one brain was made, shown in Figure 3
.
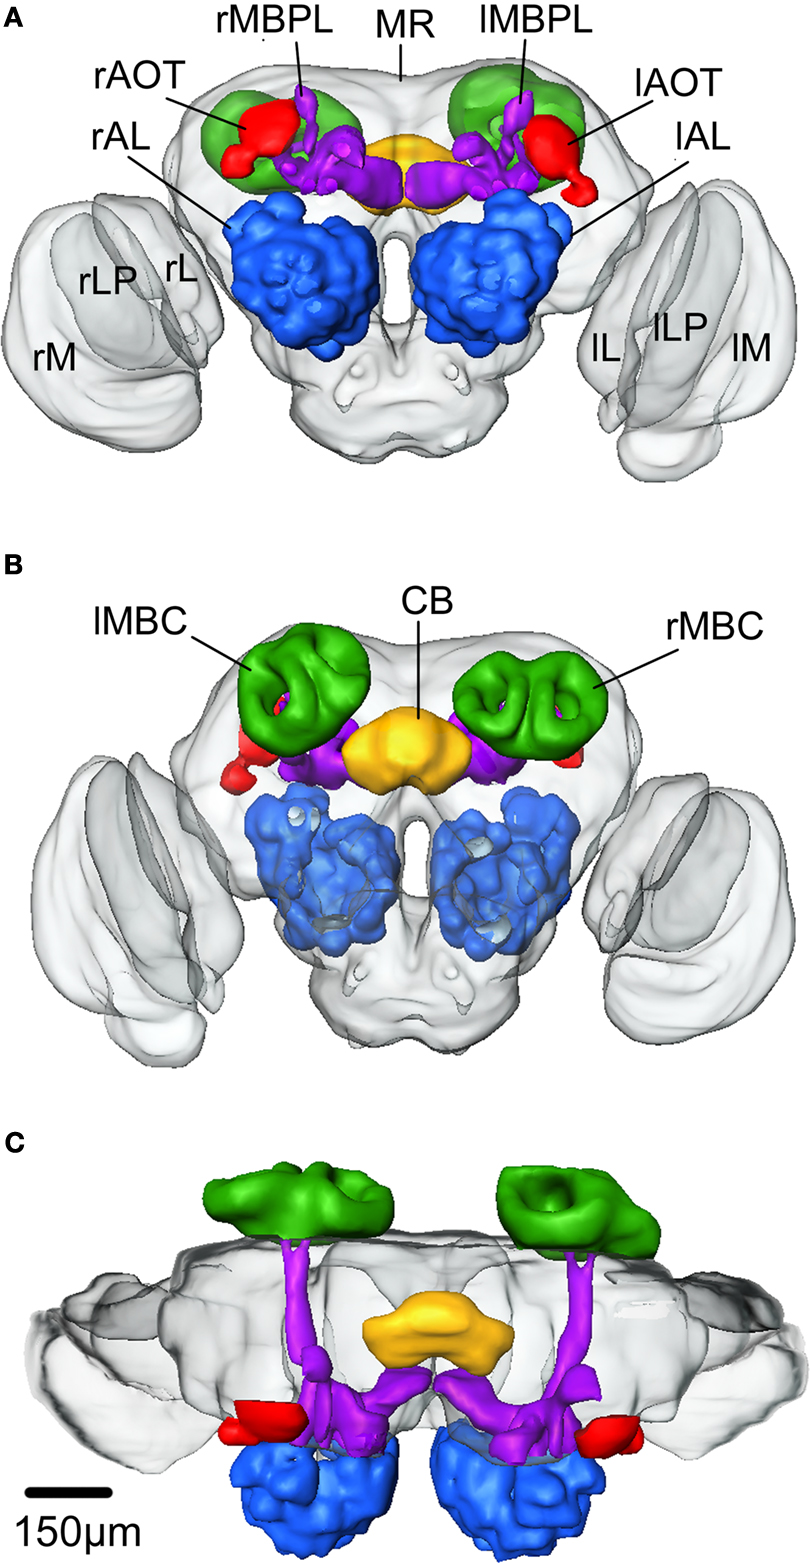
Figure 3. Surface reconstruction of an individual brain of Heliothis virescens. (A) Anterior view. (B) Posterior view. (C) Dorsal view. Midbrain region (MR), right mushroom body calyces (rMBC), right mushroom body peduncle and lobes (rMBPL), central body (CB), right anterior optic tubercle (rAOT), right antennal lobe (rAL), right medulla (rM), right lobula plate (rLP), right lobula (rL), left mushroom body calyces (lMBC), left mushroom body peduncle and lobes (lMBPL), left anterior optic tubercle (lAOT), left antennal lobe (lAL), left medulla (lM), left lobula plate (lLP), left lobula (lL).
Conventional volumetric analyzes including means and standard deviations of the absolute and relative volumes were performed on the label images of each anatomical region in all 11 brain preparations (Table 1
).
Averaging
After constructing the label images of all 11 brain preparations one brain was selected as a template into which the other were registered and subsequently averaged. The selection of the template brain was based on staining quality and shape. Before starting the ISA procedure the label images were divided into three major compartments, the right optic lobe, the left optic lobe and the remaining medial brain structures. The registration and averaging procedures were subsequently performed separately on each compartment. The procedures were repeated according to the ISA method. The three average label image stacks resulting from the second elastic registration were selected as the standard brain. A three dimentional polygonal surface model of each major compartment was created (Figure 4
).
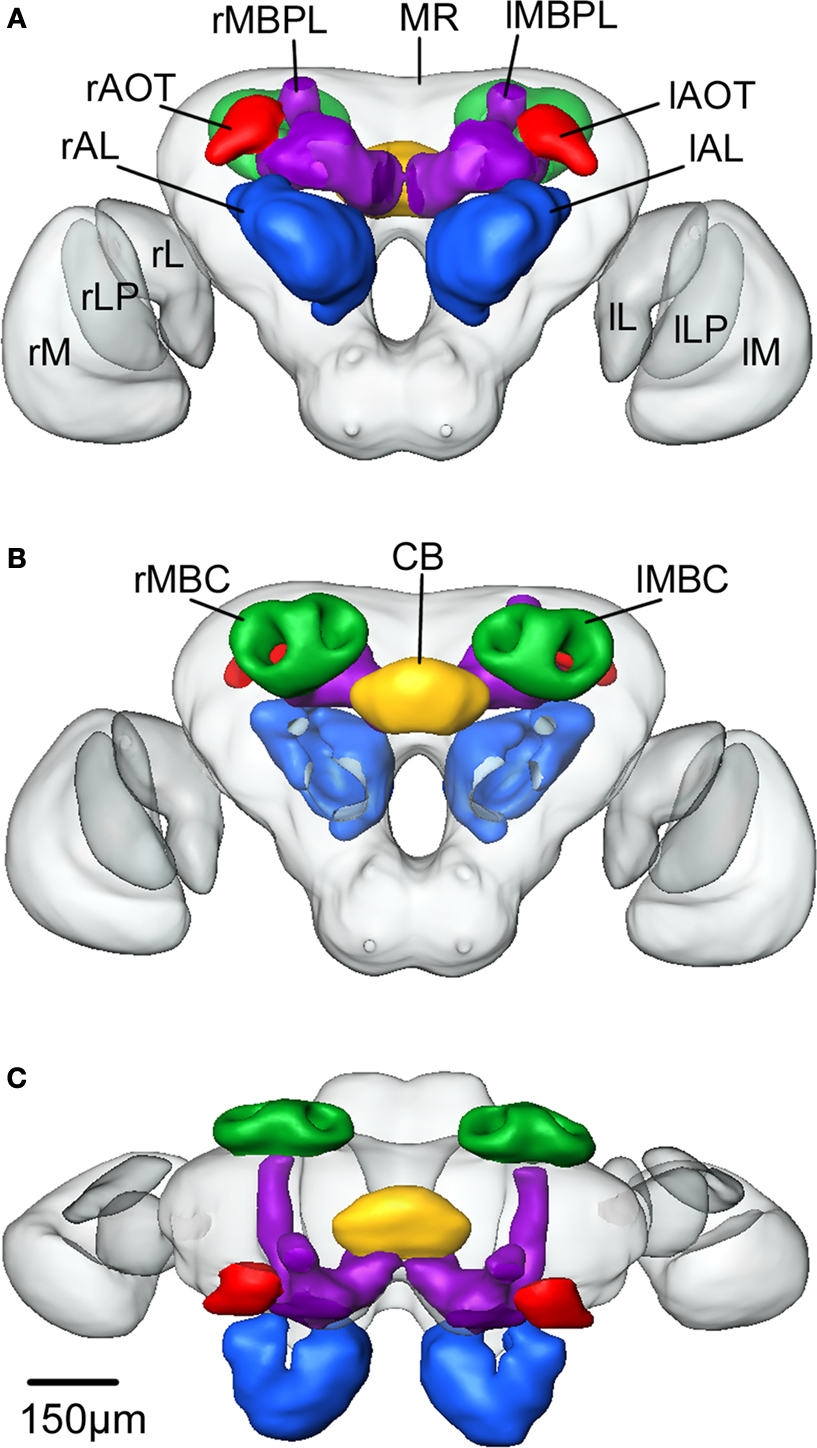
Figure 4. The average standard brain of Heliothis virescens. (A) Anterior view. (B) Posterior view. (C) Dorsal view. Midbrain region (MR), right mushroom body calyces (rMBC), right mushroom body peduncle and lobes (rMBPL), central body (CB), right anterior optic tubercle (rAOT), right antennal lobe (rAL), right medulla (rM), right lobula plate (rLP), right lobula (rL), left mushroom body calyces (lMBC), left mushroom body peduncle and lobes (lMBPL), left anterior optic tubercle (lAOT), left antennal lobe (lAL), left medulla (lM), left lobula plate (lLP), left lobula (lL).
To verify the average shape property of the standard brain which we defined as the brain shape being most similar to the 11 individual brains, we calculated the shape difference between them. The calculations were performed using the surface distance tool in Amira 4.1 which measured the mean distance between corresponding points on the surface of the different brain preparations. All the brains were compared with each other and with the standard after they had been aligned with respect to position, rotation and global size (rigid and iso-scaling transformations). The calculations were performed separately on each of the three major compartments (Figure 5
).
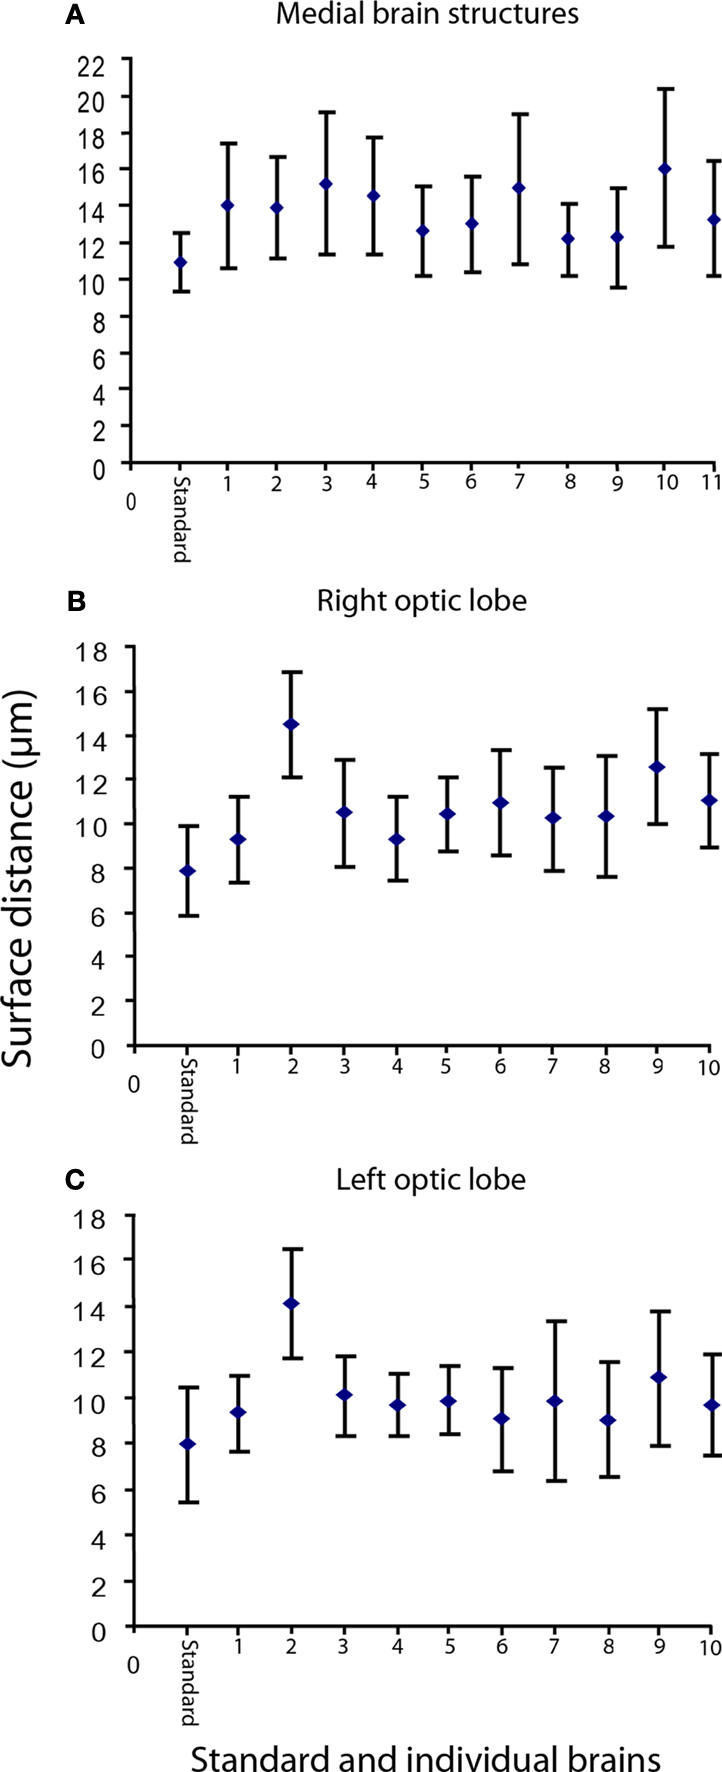
Figure 5. The mean surface distance between the standard brain and the individual brains, as well as between each individual brain and the other brains. (A) The mean distance between the standard (the medial brain structures) and the 11 individual brains is 11.0 μm, whereas the mean distance between the individual brains range from 12.2 to 16.1 μm. (B) The right optic lobe. The mean distance between the standard and the 10 individual brains is 8.0 μm, whereas the mean distance between the individual brains range from 9.3 to 14.5 μm (C) The left optic lobe. The mean distance between the standard and the 10 individual brains is 8.0 μm, whereas the mean distance between the individual brains range from 9.1 to 14.2 μm. On average the standard brain is more similar to each individual brain than the individual brains are to each other. The vertical bars show the standard deviation.
As shown in Figure 5
, on average the standard brain is a true average brain, fulfilling the average shape requirements for the standard brain atlas.
Fitting Single Neurons into the Standard Brain Atlas
To demonstrate the application of the average standard brain atlas we have registered four intracellularly recorded and stained interneurons into the model, two olfactory and two gustatory neurons. To visualize the gustatory input region we have also registered the previously described axonal projections of the antennal and the proboscis gustatory receptor neurons (Jørgensen et al., 2006
; Kvello et al., 2006
). The two olfactory interneurons were stained simultaneously during one recording, a phenomenon often observed for antennal lobe projection neurons. The olfactory function was manifested as exitation to several of the tested odorants in repeated stimulation. The axons closely followed each other all the way from the left antennal lobe to the calyces of the ipsilateral mushroom body and laterally in the protocerebral lobe (Figure 6
).
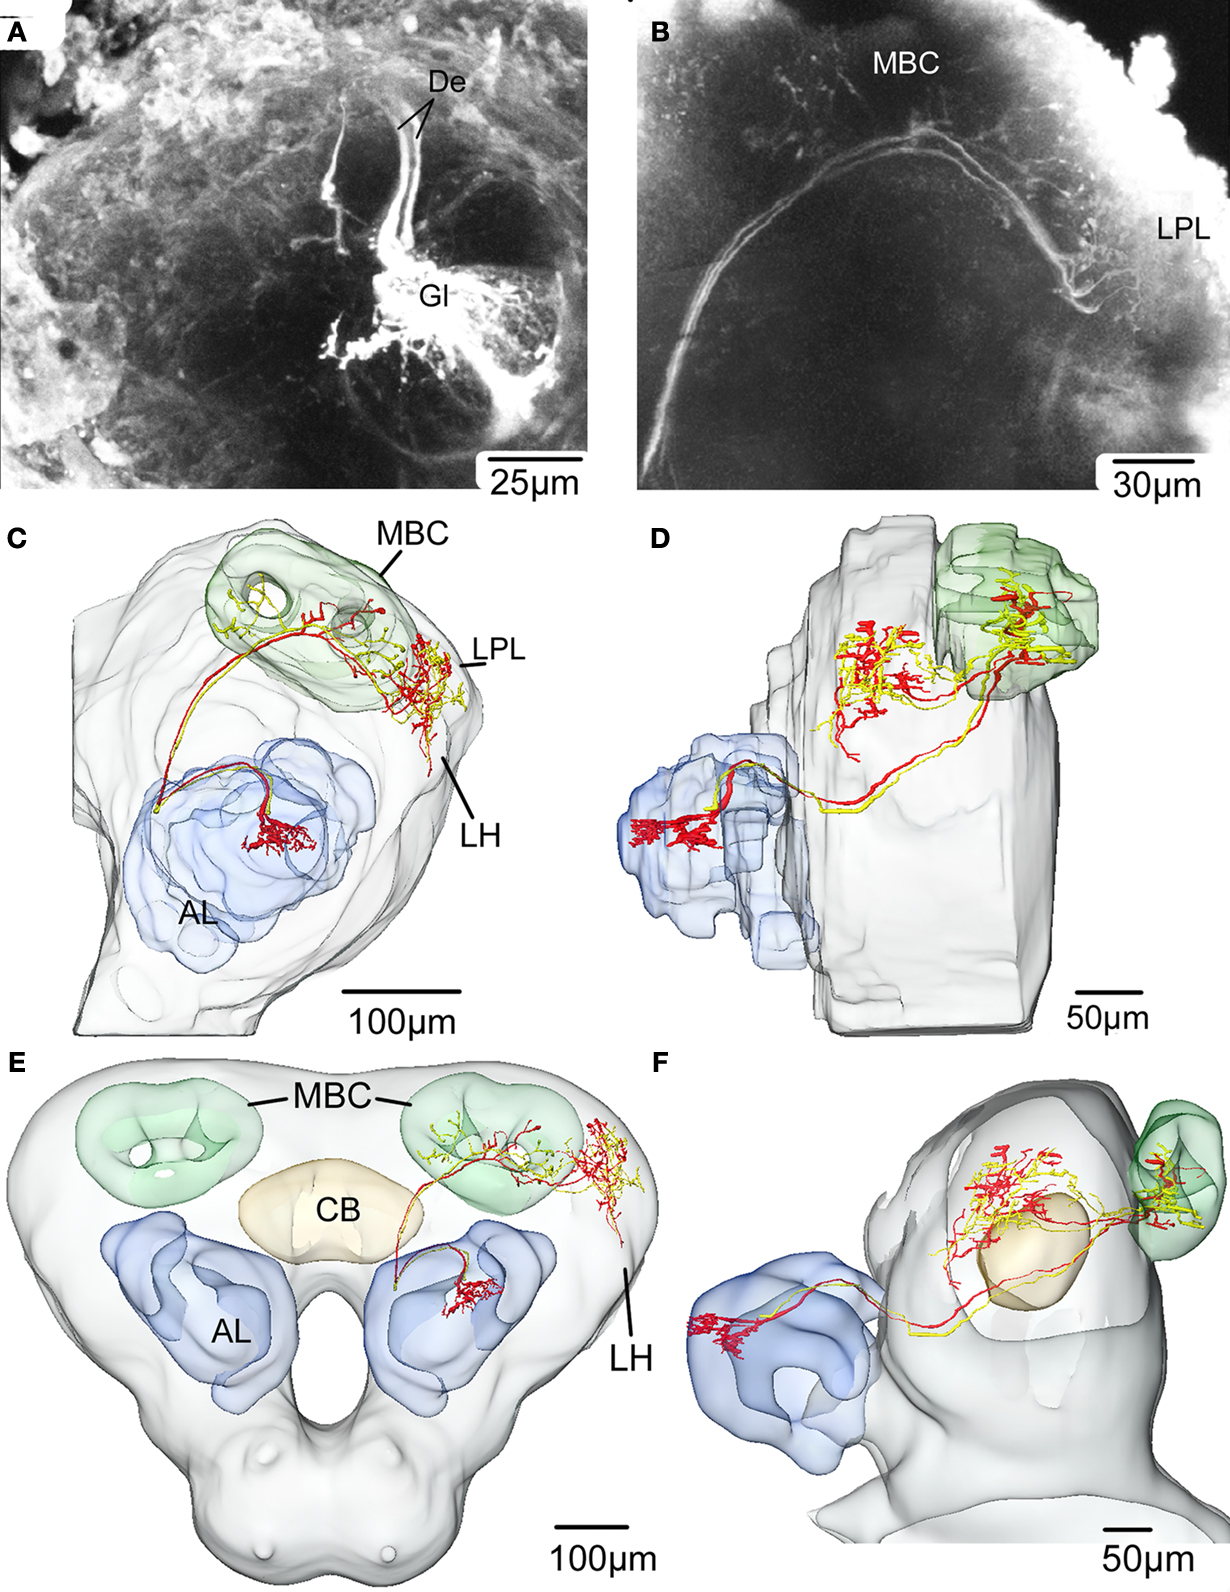
Figure 6. Confocal images and registration of two antennal lobe projection neurons (simultaneously stained) into the average standard brain atlas of Heliothis virescens. (A) Confocal image of a section showing Micro-Ruby stained dendrites (De) of two antennal lobe projection neurons innervating a single glomerulus (Gl). Their branching pattern within the glomerulus could not be distinguished. (B) Confocal image showing the projections of the two neurons in the mushroom body calyces and in the lateral part of the protocerebral lobe. (C,D) Reconstruction of the left protocerebral lobe with the two neurons innervating one glomerulus (Gl) of the antennal lobe (AL), the mushroom bodies calyces (MBC) and the lateral protocerebral lobe (LPL) in a frontal view (C) and lateral view (D). One branch of both axons extends into the lateral horn (LH). (E,F) The two neurons registered into the standard brain atlas in a frontal view (E) and lateral view (F). Central body (CB).
The two neurons densely innervated the same glomerulus (Figure 6
A), but no connections to the somata were identified. The axons followed the inner antenno-cerebral tract, each giving off four branches projecting in partially overlapping areas of the mushroom body calyces (Figures 6
B–D). They continued anterior laterally in the protocerebral lobe, extending several branches into an area posterior dorsally of the lateral horn. One branch of both axons extended into the lateral horn (Figures 6
C,D). The lateral area of the protocerebral lobes also received gustatory information, as shown by one neuron (Figure 7
A).
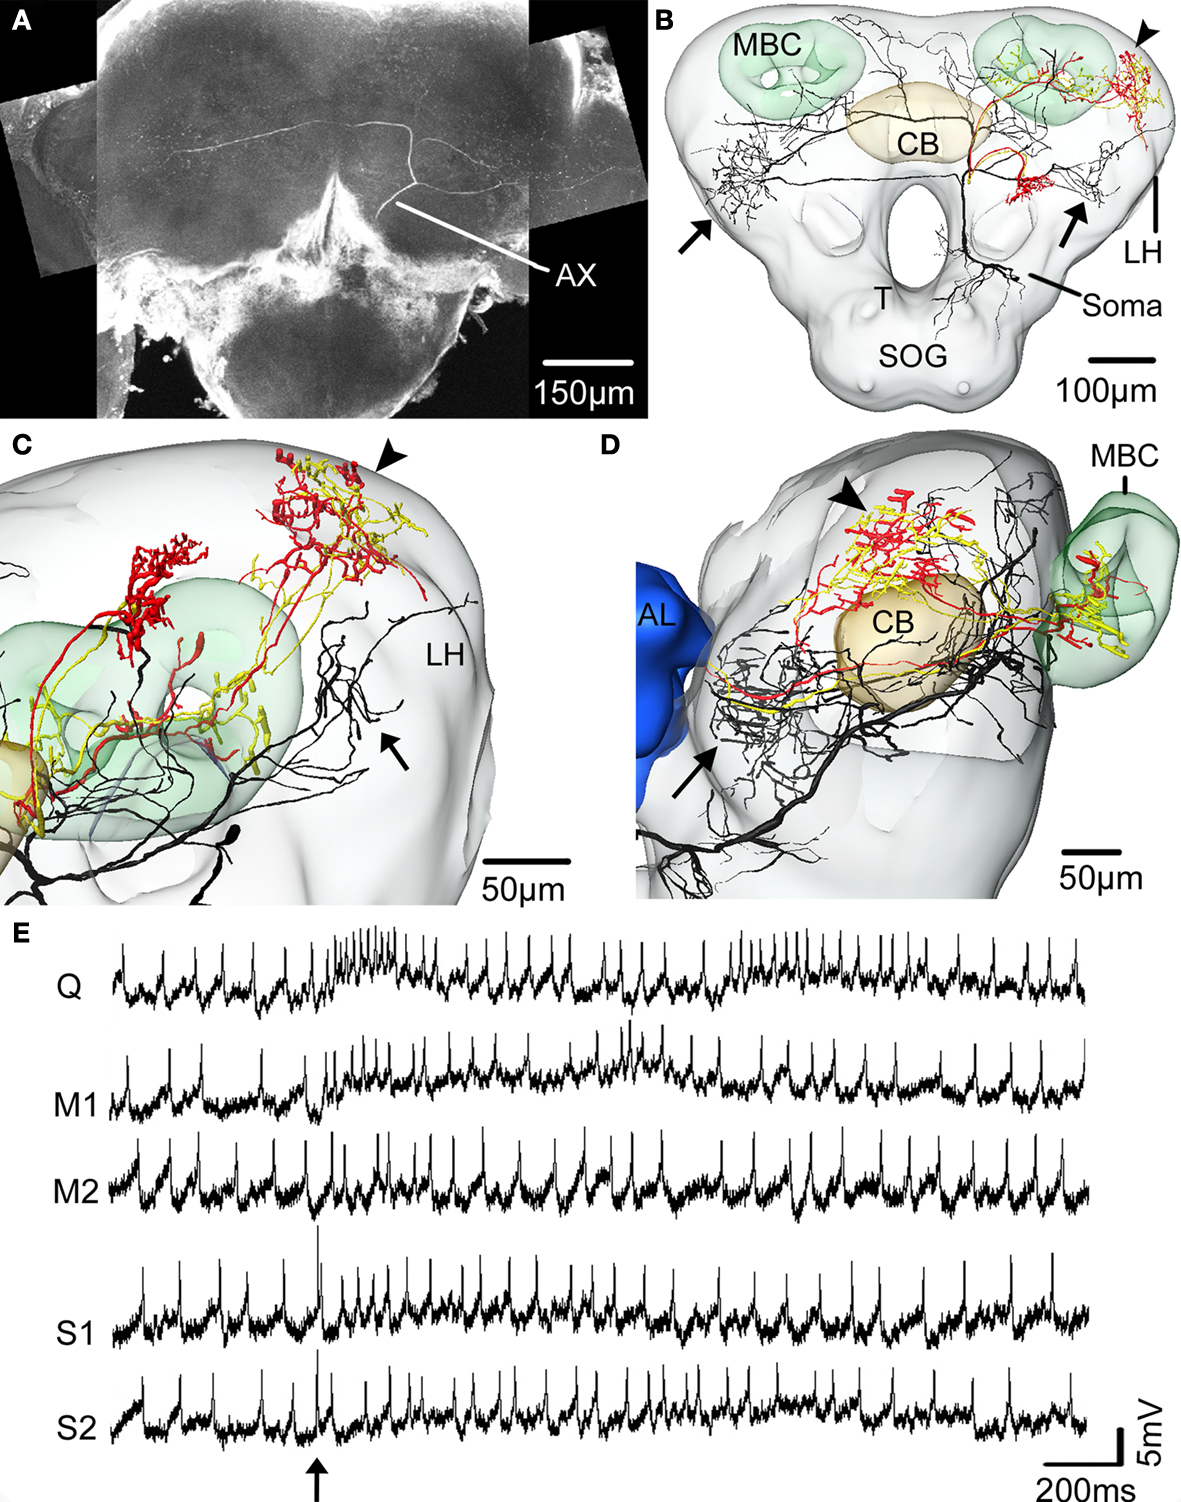
Figure 7. The spatial relationship between a single gustatory interneuron and the two antennal lobe projection neurons visualised in the standard brain atlas of Heliothis virescens. (A) Confocal image of a brain section showing the gustatory interneuron stained with Micro-Emerald. Axon (Ax). (B) Reconstruction of the gustatory interneuron (black) and the two antennal lobe projection neurons (yellow and red) registered into the standard brain atlas (frontal view with selected brain structures). Mushroom body calyces (MBC), Central body (CB), Lateral horn (LH), Suboesophageal ganglion (SOG), Tritocerebrum (T). (C,D) Magnified sections of the lateral parts of the left protocerebral lobe in a frontal view (C) and a lateral view (D). The segregated axonal projections of the gustatory interneuron and the antennal lobe projection neurons appear. Arrows point to the axonal projections of the gustatory interneuron and the arrowheads to the axonal projections of the antennal lobe projection neurons. Antennal lobe (AL). (E) Electrophysiological recordings from the interneuron during stimulation of the right antenna with quinine (Q), mechanosensory stimuli (M1, M2) and sucrose (S1, S2). Arrow points to the stimulus onset.
This neuron was excited by quinine and tactile stimulation of the right antenna. The excitation was strongest to quinine appearing as two bursts, similar to the quinine responses of the receptor neurons (Jørgensen et al., 2007a
). The response to sucrose stimulation did not exceed the mechanosensory response. The dendrites arborised in the dorsal SOG/tritocerebrum and the axon projected in wide areas of the protocerebral lobes. To elucidate whether the axonal projections of the gustatory- and the olfactory interneurons laterally in the protocerebral lobes are overlapping or separated, they were registered into the standard brain atlas (Figures 7
B–D). The registration revealed two closely, but separated projection areas (smallest distance 34 μm); the gustatory area located anterior-ventrally to the olfactory area.
The other gustatory interneuron, with excitatory responses to repeated application of sucrose to the proboscis (latency: 47 ms), was confined to the SOG (Figure 8
), the terminal area of the gustatory receptor neurons on the antennae and the proboscis.
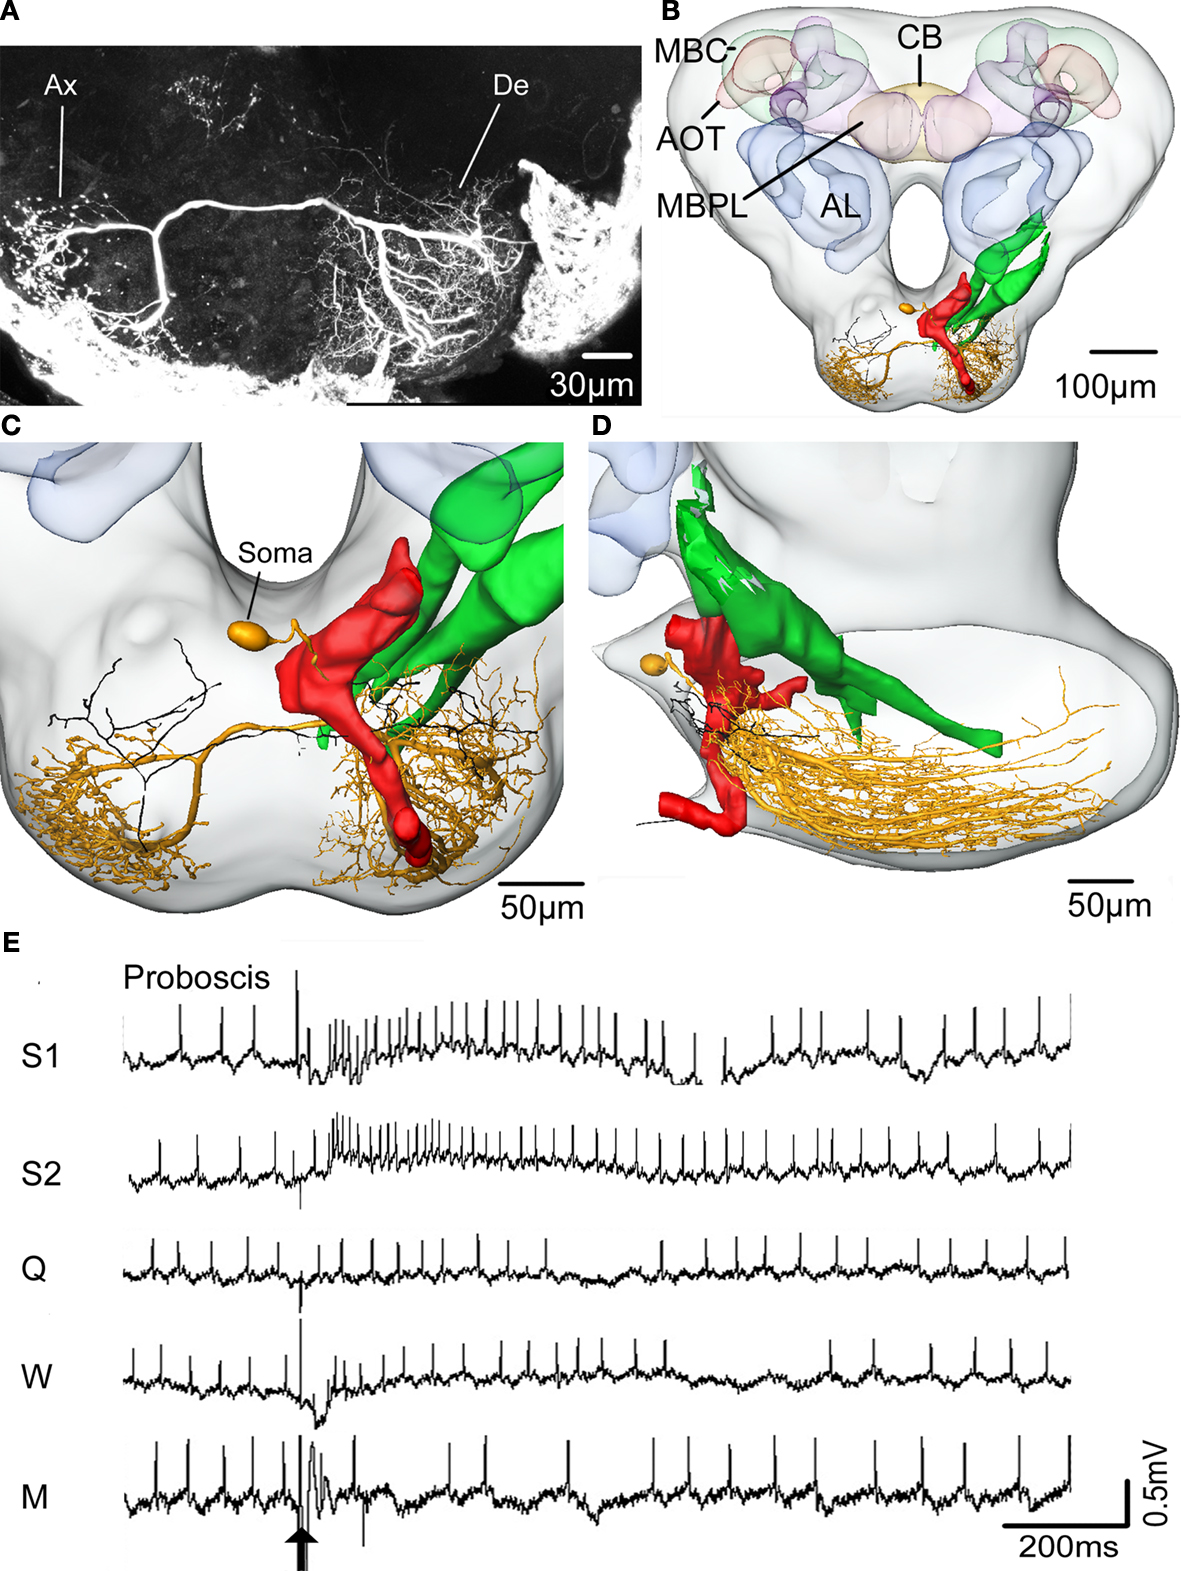
Figure 8. The spatial relationship between a single gustatory interneuron and the axonal projections of the antennal and proboscis gustatory receptor neurons visualized in the standard brain atlas of the Heliothis virescens. (A) Confocal image of a section of the suboesophageal ganglion with a Micro-Ruby stained gustatory interneuron. Axon (Ax), Dendrite (De). (B) The gustatory interneuron (yellow) and the axonal projections of the antennal (green) and proboscis (red and black) gustatory receptor neurons registered into the standard brain atlas (frontal view with a few selected structures) Mushroom body calyces (MBC), Anterior optic tubercle (AOT), Mushroom body peduncle and lobes (MBPL), Antennal lobe (AL), Central body (CB). (C,D) Magnified section of the suboesophageal ganglion in a frontal view (C) and a lateral view (D). The axon terminals of the proboscis gustatory receptor neuron (black) overlap the dendritic arborisations of the gustatory interneuron with direct contact between a few of the neurites. (E) Electrophysiological recordings from the interneuron during stimulation of the proboscis with sucrose (S1, S2), quinine (Q), water (W) and a mechanosensory stimulus (M). Arrow points to the stimulus onset.
The interneuron showed no response to sucrose stimulation of the antennae. The dendrites arborized extensively in the left, lateral SOG with branches extending from the anterior surface of the neuropil to the most posterior part (Figures 8
A–D). The axon ran contra laterally in a medial commissure before bifurcating in one lateral and one ventral branch. Both branches turn in posterior direction ramifying extensively throughout the right, ventro lateral SOG, each ramification ending in a large beaded terminal. The soma was located dorso medially, close to the oesophagus (Figure 8
C). To indicate possible connections between the gustatory receptor neurons and the interneuron, the antennal and the proboscis gustatory receptor neurons were registered into the standard brain atlas together with the interneuron. Overlap with the dendritic arborisations of the interneuron only occurred with the proboscis receptor neuron projections, as shown in Figures 8
C,D by the single axon of category two described in Kvello et al. (2006)
. In fact, direct contact occurred between a few of the neurites. No overlap with the antennal gustatory receptor neurons was found.
The results present a digital, three dimensional average standard brain atlas of Heliothis virescens, based on brain preparations of 3- to 5-days-old females. Since the aim is to use this atlas as a common framework into which identified neurons of different brain preparations will be transformed, the important feature is a minimized difference between the standard model and any individual brain. Both from nature and experimental procedures, the individual brain preparations differ slightly, not only in size and orientation, but also in shape of the whole brain as well as brain structures exemplified by the 11 individual preparations in this study (Table 1
, Figure 5
). The ISA procedure takes this variability into account in the rigid and the elastic registrations as well as in the averaging procedures, resulting in a brain model with minimized differences to the individual brains (Figure 5
), as previously demonstrated for the honeybee and the locust brain models (Brandt et al., 2005
; Kurylas et al., 2008
).
The procedure used and the structures selected for making the moth standard brain atlas are in general the same as for the honeybee brain, with a few modifications. The division of the moth brain into three compartments compensated for individual differences of the optic lobe orientations. The segregation allowed the use of 11 specimen for the midbrain region and 10 for the optic lobes because of mechanical damage. The selection of structures was based on staining quality, significance as landmarks and relevance with respect to chemosensory coding and learning. Structures of the optic lobes like the medulla, lobula and lobula plate were well stained and also necessary to make the brain model complete. The well stained central body and the anterior optic tubercles are important landmarks in the midbrain. The antennal lobe glomeruli, the mushroom bodies, and the lateral parts of the protocerebral lobes are involved in processing olfactory information (Rø et al., 2007
), and the SOG/tritocerebrum in processing gustatory information (Jørgensen et al., 2006
; Kvello et al., 2006
). However, the staining quality of these structures varied, either because of how well the antibody penetrated the tissue or because of different synaptic density. As a result the weakly stained structures were collectively assigned to one large label (Midbrain region) whereas the well stained structures were given a unique label.
The antennal lobe glomeruli with high synaptic density appeared as distinct stained structures, easily distinguished from the dark surroundings. They were collectively assigned as one label, separate from the remaining antennal lobe. This differs from the standard brain of the fruit fly, honeybee and the locust where the whole antennal lobe was assigned as one label (Rein et al., 2002
; Brandt et al., 2005
; Kurylas et al., 2008
). One reason for the separate glomerular labelling in the moth brain atlas was the difficulties in determining the borderline between the antennal lobe and the protocerebrum. In addition, the antennal lobe glomeruli have a larger surface relative to the volume as compared to the whole antennal lobe, which is an advantage when registering neurons into the atlas. The particular registration algorithm developed for label images use information that lies in the borderline of the label images (Rohlfing et al., 2001
). A larger surface gives the algorithm more information and consequently improves the precision when registering neurons into the brain atlas. Finally, we also want to emphasize the glomeruli, being of particular interest since they relay information from olfactory sensory neurons to the second order neurons. We did not find it practical to include each of the 66 glomeruli as separate labels because we have already made three dimensional atlases of the antennal lobe glomeruli of this species (Berg et al., 2002
; Skiri et al., 2005a
). At present, the separate antennal lobe atlas seems necessary for identifying the glomeruli innervated by a neuron, since this needs a detailed analysis of the relative position of the glomeruli. If practical and technically possible the atlas of the antennal lobe glomeruli may be registered into the standard brain atlas in the future.
The mushroom bodies were divided into the calyces and the peduncle/lobe system. These two compartments were easily distinguished, but a further division into their sub-compartments proved unreliable. Consistent with previous studies of H. virescens (Rø et al., 2007
) and Spodoptera littoralis (Sjöholm et al., 2005
) we could not distinguish any accessory calyx from the primary calyces. Such a division of the calyces, described in the moth Manduca sexta, may reflect a functional difference between the species (Homberg et al., 1988
; Nighorn et al., 2001
). Because of the difficulties of separating the mushroom body peduncle and the lobe system in the H. virescens brain these structures were included in the same label like in the other insect brain atlases (Rein et al., 2002
; Brandt et al., 2005
; Kurylas et al., 2008
; Jundi et al., 2009
). As shown in Heliothis virescens and Spodoptera littoralis the peduncle fuses anteriorly with the lobe system dividing into a dorsal α lobe and a medial β lobe, both intimately associated with the γ lobe (Sjøöholm et al., 2005
; Rø et al., 2007
). Specific to Lepidoptera is the Y lobe which was vaguely observed in a few preparations and therefore was not included in the standard atlas.
The SOG, tritocerebrum and protocerebral lobes, including the lateral accessory lobes, the protocerebral bridge and the lateral horns did not appear distinct and therefore were collectively included into the midbrain region label. In the same label we also included the particular structure located posterior to the antennal lobe glomeruli merging into the protocerebral lobes without a distinct borderline. The SOG, tritocerebrum and protocerebral lobes are also included in the same label in the honeybee and the fruit fly brain atlases. In these species as in the moth, the three structures are highly interconnected and seem to lack an area with high synaptic density where a reliable distinction can be made (Rein et al., 2002
; Brandt et al., 2005
). This differs from the locust where the SOG (not included in the standard locust brain atlas) is a distinct ganglion connected to the brain by the circumoesophageal connectives (Burrows, 1996
). The lateral horn is another structure treated differently among the five insect brain atlases. In H. virescens, they were weakly stained and therefore included in the same label as the SOG, tritocerebrum and protocerebral lobes like in the honeybee and M. sexta (Brandt et al., 2005
; Jundi et al., 2009
). This differs from the fruit fly and the locust where the lateral horns were given a unique label (Rein et al., 2002
; Kurylas et al., 2008
). The midbrain region is by far the largest structure in the standard moth brain atlas. Its shape results in a relative small surface which is disadvantageous when registering neurons into the structure. Therefore, the central body and the anterior optic tubercles, located within the midbrain region, serve as important landmarks. These two structures appeared quite distinct in all 11 preparations. Especially the central body is a stable landmark because its location in the middle of the brain keeps it protected from distortion by external factors.
The application of the average standard brain atlas is demonstrated by the four registered interneurons, as well as the axonal projections of the gustatory receptor neurons shown in Figures 7 and 8
. The olfactory interneurons showed the typical morphology of inner-tract antennal lobe projection neurons (Rø et al., 2007
), with dendrites innervating a single glomerulus of the antennal lobe, and axons projecting via the inner antenno-cerebral tract to the calyces of the mushroom body involved in olfactory learning and memory (Menzel, 2001
; Heisenberg, 2003
), and to the lateral parts of the median protocerebrum considered to be a premotoric area (Figure 6
). Interestingly, axonal projections of the quinine responding neuron were identified in a separate, but closely located area of the olfactory projections. Because of the absence of distinct landmarks in this brain region the standard brain atlas proved particularly valuable in visualizing and distinguishing these target areas of the gustatory- and olfactory projections (Figures 7
B–D). However, registration of more neurons into the standard brain atlas combined with electrophysiology is needed to verify whether the projection areas of the two chemosensory modalities are completely separated or partly overlapping in this area of the brain. The atlas also proved valuable in visualising possible connections between the sucrose responding interneuron and the receptor neurons in the SOG (Figure 8
). The direct contact between the intermingled dendritic branches of one gustatory interneuron and the projections of the proboscis gustatory receptor neuron suggest input from the proboscis. In contrast the non overlapping projections of the antennal gustatory receptor neuron indicate no antennal input. This was in fact shown physiologically by the excitatory responses of the interneuron to sucrose stimulation of the proboscis, but not of the antennae. Furthermore, the short and constant latency of the response indicate monosynaptic connections (Burrows and Newland, 1994
; Newland, 1999
). The axon projected contra laterally relative to the dendritic arborizations, terminating in the ventro lateral SOG where motorneurons of the mouthparts presumably are located. Thus, this neuron may receive direct synaptic input from the sucrose receptor neurons on the proboscis and feed into motor neurons involved in feeding.
The standard brain atlas is a valuable tool for visualising the spatial relationship between neurons from different brain preparations, detecting regions of overlap among the neurites, and thus to make predictions about neuronal connectivity. The procedure of rigid and elastic registration is particularly suited as an objective way to integrate neurons from different preparations into the digital standard brain atlas. The average property of the atlas ensures that the neurons undergo a minimal deformation in the registration procedure. In combination with physiological data the atlas provides an important tool for investigating and visualising the neural networks underlying gustatory and olfactory coding as well as appetitive and aversive learning and memory formation.
The authors declare that the research was conducted in the absence of any commercial or financial relationships that could be construed as a potential conflict of interest.
The project was financed by the Norwegian University of Science and Technology and the Royal Norwegian Society of Sciences and Letters. We thank Prof. Erich Buchner (Universität Würzburg, Würzburg, Germany) for providing antibodies, Dr. Robert Brandt (Mercury Computer Systems, Berlin, Germany) and Anja Kuss (Zuse-Institute Berlin) for help with Amira, Dr. Sabine Krofczik (Freie Universität Berlin) for staining protocols and Gisela Manz (Freie Universität Berlin) for advices during the intracellular recordings.
Berg, B. G., Almaas, T. J., Bjaalie, J. G., and Mustaparta, H. (1998). The macroglomerular complex of the antennal lobe in the tobacco budworm moth Heliothis virescens: specified subdivision in four compartments according to information about biologically significant compounds. J. Comp. Physiol. A 183, 669–682.
Jørgensen, K., Kvello, P., Almaas, T. J., and Mustaparta, H. (2006). Two closely located areas in the suboesophageal ganglion and the tritocerebrum receive projections of gustatory receptor neurones located on the antennae and the proboscis in the moth Heliothis virescens. J. Comp. Neurol. 496, 121–134.