 Nepu Saha
 Jordan Klinger
 Md Tahmid Islam
 Toufiq Reza
- 1Energy and Environment Science & Technology Directorate, Idaho National Laboratory, Idaho Falls, ID, United States
- 2Department of Biomedical and Chemical Engineering and Sciences, Florida Institute of Technology, Melbourne, FL, United States
Because of accelerated urbanization and the development of a global economy, a large quantity of municipal solid waste (MSW) has been collected and disposed of by the municipalities. Due to this drastic increase in the disposal of MSW, the need for its management is a must to preserve the environment. Currently, approximately 50% of the total MSW generated in the United States has been utilized through various recycling, combustion, and composting technologies, which means the remaining 50% is sent to landfill; this is often known as non-recyclable MSW (nMSW). As this nMSW is physically and chemically heterogenous and contains very high amounts of inorganic material, processing is required prior to using it as a biorefinery feedstock. Thus, this study focused on how mechanical preprocessing advanced the physical and chemical properties of nMSW. The physical and chemical properties were investigated in terms of particle size distribution, bulk density, ultimate and proximate analysis, and the higher heating value (HHV). The combustion properties were examined in terms of ignition temperature, peak heat release rate, and combustion efficiency. Results showed that the variability of physical and chemical properties of nMSW can be reduced by mechanical preprocessing. For example, the variability of the bulk density of the as-received nMSW was approximately 17.3% while it reduced to 5.8% when the sample size was reduced to 2 mm. Similarly, the variability of ash and HHV reduced from 49.2% to 11.0% and 13.4%–4.2%, respectively. Combustion thermograms showed that the size reduction positively improved the combustion properties. For example, 2 mm of spec sample started to ignite approximately 4 times earlier and took 6.5 folds less time to reach the peak heating rate compared to as-received nMSW. Overall, the mechanical preprocessing reduced the variability of physical and chemical properties in addition to the improvement of combustion behavior of the nMSW which is one step forward toward the biorefinery feedstock.
1 Introduction
Municipal solid waste (MSW), commonly called “trash” or “garbage”, consists of but is not limited to the wastes of durable and non-durable goods, household waste, office waste, retail waste, etc. In 2018, the United States generated approximately 292.4 million tons of MSW. Approximately 50% of this was utilized through recycling, composting, or combusting, leaving approximately 146 million tons to be sent to landfill (United States Environmental Protection Agency, 2018). The overdependence on landfilling and inappropriate waste disposal has been continuously pressing the environment (e.g., greenhouse gases, global warming) including health and safety issues (e.g., nutrient enrichment potential) (Alqassim, 2021). Thus, finding additional ways of properly utilizing MSW is necessary in today’s world.
There are various technologies, such as thermochemical (e.g., gasification, pyrolysis) and biological (e.g., anaerobic digestion) conversion to convert MSW into energy (Rivard et al., 1995; Kwon et al., 2010; Wang H. et al., 2015; Panepinto et al., 2015; Seo et al., 2018). Of these two conversion platforms, thermochemical conversion could be more attractive because it is much quicker than biological conversion, and products derived from MSW can directly be used as a fuel or chemical feedstock (Ojolo and Bamgboye, 2005; Hlaba et al., 2016; Nandhini et al., 2022). However, either technology is suitable for some specific fraction of MSW (e.g., organics, plastics) where material recovery facility (MRF), a plant that separates various streams from the MSW, can play a significant role. The reject stream from an MRF, or the non-recycled MSW (nMSW), is sent to the landfill. Although nMSW ideally contains only non-recyclable fractions, it still has a significant amount of organics (∼28%) (United States Environmental Protection Agency, 2015) and also a very high amount of inorganics (>30%) (Campuzano and González-Martínez, 2016). Because of its notable quantity of organics, it could be used as a potential source of energy; however, the inorganics detract from this. Hence, it is necessary to reduce the presence of inorganics in nMSW prior to its use as an advanced biorefinery feedstock.
Advanced biorefinery feedstock is usually obtained from lignocellulosic biomass. However, the cost of lignocellulosic biomass is between $30 to $80, which makes biofuel >$3 per gallon of gas equivalent (Messner, 2022). nMSW could play a role in offsetting the low-cost material as, currently, it has a negative value; however, preprocessing is required to make it a biorefinery-ready feedstock. We hypothesize that mechanical preprocessing could overcome the bottlenecks (e.g., heterogeneity) and make nMSW viable for advanced biorefinery feedstock.
As this is emerging research, no such literature was found that focuses on nMSW. However, there are some available works of literature on front-end mechanical preprocessing followed by chemical/thermal/biological processing of waste biomass to reduce inorganic content hence improving the energy properties. For example, Lacey et al. (2015) observed that air classification, a density-based separation technique, can reduce more than 80% of soil-based inorganics in the pine forest residue. Liu and Bi. (2011) found that dilute acid leaching can substantially remove different inorganic elements (e.g., 66% Al, 90% Ca, 66% Fe, 92% K, 98% Mg, 100% Na) from pine bark, while water leaching can significantly reduce the inorganics from switchgrass. Recently, Brown et al. (2022) studied the effect of chemical decontamination of mixed plastic waste to improve the oil yield during pyrolysis. They found that detergent and dimethyl ether washing improved the oil yield by approximately 64.3% and 45.2%, respectively. They also reported that these methods of washing mostly removed the dirt content (inorganics) from the plastic waste.
A few recent studies have been conducted on refuse-derived fuel (RDF), a fraction of MSW (Azam et al., 2019; Pio et al., 2020; Rajca et al., 2020; Yang et al., 2021). RDF is mainly the combustible substance in MSW, which consists of carbon-based derivatives such as organics, plastic, paper, wood, and textile. Where the nMSW is the reject stream from MRF, nMSW is chemically (e.g., ultimate, proximate) as well as physically (e.g., density, flowability) very heterogenous. Feeding this heterogenous feedstock to a conversion process is not only a problem in keeping the product quality within the target but also keeping the downtime minimum by feeding the reactor continuously without interruption. Thus, mechanical preprocessing (e.g., shredding, air classification) is a prerequisite for many processing technologies for continuous feeding. For example, with the decrease of particle size, the density increases resulted in better flowability (Kim et al., 2016; Xu et al., 2019; Saha et al., 2022b). Although mechanical preprocessing is usually used for altering the physical properties, we hypothesized that this could also change the chemical properties in the case of mixtures of materials with diverse chemical properties.
Thus, the goal of this study was to understand the behavior of the fuel and combustion properties of nMSW during the preprocessing stage. The physical and chemical properties were investigated in terms of particle size distribution, bulk density, ultimate and proximate analysis, ash species, and higher heating value. Finally, the combustion properties were examined to understand how this mechanical preprocessing impacted the fuel properties.
2 Materials and methods
2.1 Material
nMSW was received from Waste Management (MRF) in Salt Lake City, UT. All the visible metal pieces were manually removed from the as-received nMSW. The rest of the nMSW was primarily reduced in size using a 3” screen in the Jordan Reduction Solutions (JRS) knife mill (Birmingham, AL). Fractional analysis of this <3” material was manually completed to determine the major constituents. A total of 15 different grab samples were taken from approximately 4.5 m3 (approximately 6 yd3) of a full walking floor trailer. They were analyzed in terms of various fractions, such as plastic, paper, cardboard, grass, and dirt. The findings are shown in Figure 1 where the cardboard contributed the most followed by the glass and dirt. Although the standard deviations were very high, the average values indicate waste fiber products contributed more compared to thin and rigid plastics. After the initial removal of metal, we still found approximately 0.6% metal in the remaining nMSW.
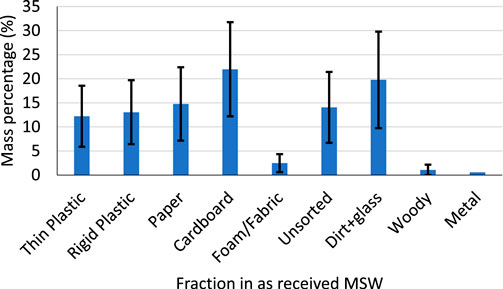
FIGURE 1. Fractional analysis of the nMSW. The error bars represent the standard deviation between replicate measurements. Note that the unsorted fraction mainly consists of thin plastic, rigid plastic, paper, cardboard, and foam/fabric. Owing to their smaller size, it is unpractical to sort manually.
The <3” sample was then fed manually on a screw conveyer to 6 mm rotor set in a shredder. The sample between 6 mm and 3/32 s (2.38 mm) screens was considered as 6 mm on-spec sample, while the sample smaller than 2.38 mm was considered as fines (reject) from this process. Then, 6 mm on-spec sample was fed manually on a screw conveyer and reduced in size through 4 mm rotor set, while the sample between 4 mm and 3/32 s screens was considered as 4 mm on-spec sample, and the sample under 2.38 mm was considered as fines. Similarly, 6 mm on-spec sample was also reduced in size through 2 mm crumble, while the sample between 2 mm and 20 mesh screens was considered as 2 mm on-spec sample and 20 mesh was considered as fines. A photograph of all the processed samples has been shown in the supplementary material (see Supplementary Figure S1). As the samples were processed, we randomly grabbed 3 samples from each on spec and fine fractions for further chemical and physical analyses. During every size reduction step, any visible metal was removed. An overall mass balance of this preprocessing is shown in Table 1 where the 6 mm sample ended up with the most fines (approximately 10%) which was expected as this was the first pass where the dirt and glass were separated. Both 4 and 2 mm samples showed similar mass balance where approximately 92% and 6% ended up with on-spec and fines, respectively. Note that we lost approximately 2%–3% sample during each step, either as oversized, remained inside the crumble, or blown away with the wind.
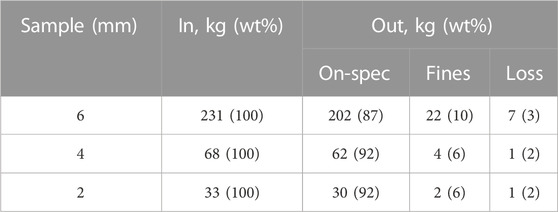
TABLE 1. Mass balance of 6, 4, and 2 mm preprocessed samples.
A sample of the 6 mm on spec was further processed using Oliver (Model: Voyager) gravity separation table (La Junta, CO) to examine the ability to separate the nMSW to constituent components or further refine products. The separation was conducted by adjusting three control parameters of the table: the cross-air flow, the acentric rotational speed, and the biaxial table tilt. For example, the air speeds of the feed end, middle, and far end were 80, 90, and 60 Hz, respectively. The acentric speed and the side tilt were set at 524 rpm and 90 mm, respectively. The sample was fed to the conveyer with 50% gate opening and fed slowly. The separation was made based on the bulk density of the particle and ended up with three different cuts (heavy, mid, and light), where the heavy consisted mainly of glass bits, bigger plastic pieces, etc., while the light consisted of mostly paper and film plastics. The remaining fractions (e.g., cardboard, rigid plastic, etc.) have stayed in the mid-stream. The mass balance of this separation indicated that approximately 53.8 wt% of the input separated as the mid-stream while 22.3 and 23.9 wt% ended up as heavy and light streams, respectively.
2.2 Methods
Particle size distribution (PSD) analysis was carried out using a Ro-Tap separator (Model RX-29) according to the American Society of Agricultural Engineers (ASAE) standard method S319.3. To briefly explain the procedure used, the sample was loaded into the top sieve, and the stack was placed in the Ro-Tap, turned on, and allowed to run for 10 min. Afterward, the sieve stack was disassembled, and each sieve was weighed to find the relative amount of each sample that passes through each successive sieve. From these measured weights, cumulative particle passing distributions were calculated. For all samples, the 10% (d10), 50% (d50), and 90% (d90) cumulative passing sieve sizes were calculated by linear interpolation to find the theoretical sieve size.
The bulk densities (loose and tapped) of the tested samples were measured by using a modified version of ASAE standard method S269.4. In a typical test, the sample was poured into a cylindrical container (195 mm diameter) from a height of 0.6 m above the container’s top edge until the height of the material was approximately 90% of the container’s diameter. The “loose bulk density (LBD)” of the sample was estimated from the mass of the sample dividing the volume occupied by the sample. To measure the “tapped bulk density (TBD)”, the container with the sample was dropped five times from a height of 0.15 m onto a hard surface as per the standard. Subsequently, TBD was estimated using the same procedure described above for LBD.
Ultimate analysis of the grabbed on-spec and fines was carried out in an Elementar Vario EL cube (Ronkonhoma, NY) as per American Society for Testing and Materials (ASTM) standard method D 3176-09. The analyzer was calibrated with a certified Alfalfa standard. During a typical analysis, the sample was combusted at 1150 °C in presence of ultra-high purity (UHP) oxygen at a flowrate of 38 mL/min along with a carrier gas (UHP helium) at 230 mL/min. The combusted gas was analyzed using a thermal conductivity detector (TCD) to determine the elemental carbon, hydrogen, and nitrogen, while an infrared (IR) detector was used to measure the sulfur content. Oxygen content was calculated by the difference method which is a common method used in various studies (Chen et al., 2018; Volpe et al., 2021; Saha et al., 2022a). Ultimate analysis was measured in triplicate for each grabbed sample which ended up with at least 9 replicates for each sample.
Proximate analysis of the grabbed samples was carried out in a LECO Thermogravimetric Analyzer 701 (St. Joseph, MI) as per ASTM D 7582. Briefly, the sample was heated from room temperature to 107°C at 6°C/min heating ramp and held until a constant mass was reached. The mass loss during this time was considered as moisture content. The sample was further heated up to 950°C at a ramp of 50°C/min and kept isothermal for 9 min. During these steps, an inert atmosphere was maintained by flowing UHP grade nitrogen at 10 L/min. The mass loss during this time was considered as volatile matter, respectively. To make sure all volatile matter (VM) was removed from the sample, the sample was cooled down to 600°C, and oxygen was introduced (3.5 L/min) instead of nitrogen to allow the sample to be combusted. The temperature was ramped to 750°C at 13°C/min and held until a constant mass was reached for the sample. This remaining mass was considered ash while the fixed carbon (FC) was determined by subtracting volatile matter and ash percentages from 100%. The measured values were corrected for dry basis based on a calibration curve built on coal standards provided by LECO. Proximate analysis was measured for at least 9 replicates for each sample.
Higher heating value (HHV) was determined as per ASTM method D 5865 using a LECO AC600 (St. Joseph, MI) isoperibolic system. In short, the sample was combusted under 450 psi UHP grade oxygen and all the calculations were conducted based on the methods stated in D 5865.
The elemental ashes were analyzed in an inductively coupled plasma-atomic emission spectroscopy (ICPAES) in the forms of oxide, such as SiO2, Na2O, MgO, K2O, SO3, CaO, P2O5, Al2O3, and Fe2O3 as per ASTM method D3682. From the elemental ash percentage, several predictive indices were calculated (Lachman et al., 2021):
where
where Sd indicates wt% sulfur in dry fuel.
To assess the fuel performance of nMSW, the combustion efficiency, heat release rate (HRR), and peak heat release rate (pHRR) are important to understand the combustibility of a fuel which can be determined from thermogravimetric analysis (Rantuch et al., 2021). It is understood that upon applying the external heat flux, the combustion process starts with devolatilization and oxidation reactions of volatiles and fixed carbon along with several other physicochemical changes of the solid fuel (Medina et al., 2015; Rantuch et al., 2021). Thus, the combustion experiment was performed in a cone calorimeter (McHenry, IL, United States) as per ASTM standard method E1354. In summary, 20 g of sample was taken in an aluminum container and placed on the sample holder located right beneath the cone heater. A specific radiant heat flux (20 kW/m2) was applied onto the exposed surface of the sample which then ignited in the presence of atmospheric oxygen. Ignition time, pHRR, and time required to reach pHRR were calculated from the thermogram of a 30 min combustion test. In addition, the combustion gases (CO2, CO) were analyzed, and the concentration of each combustion gas was recorded. The combustion efficiency was calculated using Eq. 1.
where, [C]CO2 and [C]CO indicate the carbon emitted as CO2 and CO, respectively, while 0.18 and 0.82 are modification factors.
3 Results and discussion
3.1 Physical properties
A full cumulative PSD chart is shown in the supplementary material (see Supplementary Figure S2), and the various cuts (d10, d50, and d90) are shown in Table 2. The various cuts showed a lowering trend with the smaller-sized sample as expected. For example, the average d10 of 6, 4, and 2 mm on-spec samples are 2.66, 2.19, and 1.09 mm, respectively, while the d50 and d90 are 5.45, 3.77, 2.01 and 8.64, 5.67, 3.05, respectively. Although d50 and d90 of 4 and 6 mm samples are different, the d10 is similar because the same bottom screen was used during the preparation of those samples. Although the on-spec samples were processed through a respective size rotor head, the distribution showed each sample had up to 50% oversized material. For example, the d50 of 2 mm on-spec sample is 2.01 mm means approximately 50% of the material is >2 mm nominal size. This could happen because of the compressible and compliant behavior of feedstock, particularly thin film plastics. So, while the feedstock passed through a specific crumble head, some of the material squeezed through the head instead of cutting through. One of the key findings is that the standard deviation of the different cuts reduced significantly with more processing steps and longer processing time which indicates more homogeneity of the feedstock. Similar to the on-spec samples, fines also showed the same trend.
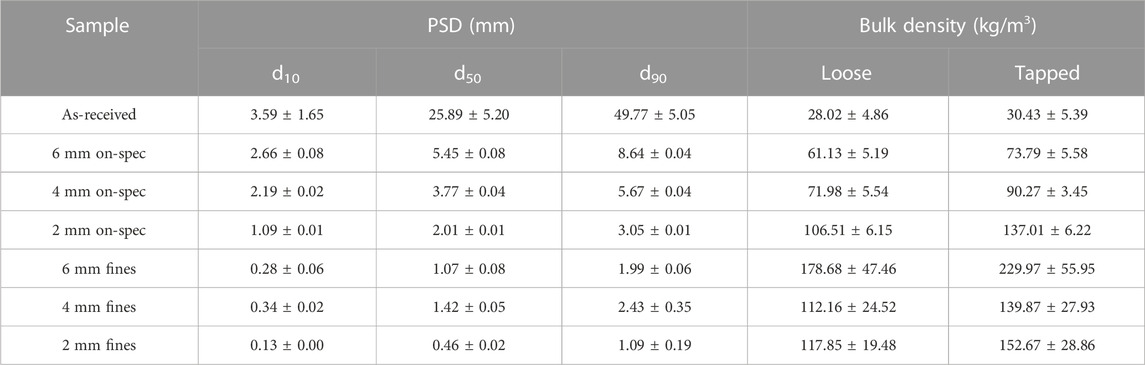
TABLE 2. Particle size distribution (PSD) along with the bulk density of mechanically size-reduced MSW.
The bulk densities (loose and tapped) of studied samples are also shown in Table 2. The LBD of the as-received material is 28.02 kg/m3 which increased with the reduction of particle size. For example, the 6 mm on-spec sample has loose density of 61.13 kg/m3 while it further increased to 71.98 and 106.51 kg/m3 for 4 and 2 mm on-spec samples, respectively. As the smaller-sized particle is easy to pack by keeping the void space minimal, the smaller-sized on-spec material showed higher LBD. The TBD of each sample showed a higher value compared to LBD. This was expected as during the TBD measurements, the materials were allowed to settle down which reduced the void space as well as made a densely packed material. The fines from each size showed higher loose and tapped density compared to their respective on-spec size; however, no statistically significant trend was observed (p>0.05). The fines contained a significant amount of glass and dirt along with other fibrous fraction which has very different bulk density. As a result, bulk densities also varied widely.
It can be concluded that the bulk density and the relative density variability are highly dependent on the particle size. It is a critical material attribute that determines equipment handling performance. For example, our recent study on corn stover showed that smaller particles flowed better with less power consumption at a specific moisture content (Saha et al., 2022b).
3.2 Chemical properties
The ultimate analysis of the studied samples is shown in Figure 2 where carbon, hydrogen, oxygen, and ash contents are reported. Note that, nitrogen and sulfur contents in all the samples were <1.0% and <0.2%, respectively. The carbon content of the as-received feedstock was 51.2 ± 7.2 wt%, where the hydrogen and oxygen contents were 6.3 ± 1.0 and 21.1 ± 7.6 wt%, respectively. The ash content was expectedly very significant at approximately 20.9 ± 10.3 wt%. Although the carbon and hydrogen contents reported in the raw MSW by Phasee and Areeprasert. (2017) were similar to the current study, the oxygen and ash numbers were different because of the different sources of the material. With the size reduction, the on-spec samples did not show any significant change in the ultimate analysis. However, the fines showed notable changes. For example, the carbon content dropped approximately 30% while the ash content increased more than 100% compared to the as-received material. Since “as-received” material went through various crumble heads during size reduction, the dirt, glass, and other extrinsic inorganic material were allowed to break down into fines and be removed from the on-spec fraction. Thus, the fines ended up with very high ash concentrations. In the meantime, the ash content in the on-spec samples did not change significantly as we were only removing 6–10 wt% as fine fraction (see Table 1). Current literature documented that higher inorganic content lowers the conversion rate and causes catalyst poisoning during thermochemical conversion (Wang K. et al., 2015; Zhang et al., 2016; Chanaka Udayanga et al., 2019). An important finding is that even though the ultimate analysis of the on-spec samples is not significantly different from the as-received sample, the deviation (see error bar in Figure 2) of the analysis is lower, which means the materials are becoming more uniform.
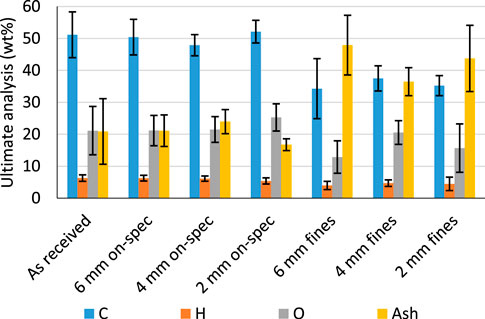
FIGURE 2. Ultimate analysis of on-spec MSW along with fines and as-received material. The error bars represent the standard deviation between at least 9 replicate measurements.
Similar to the ultimate analysis, no significant change in the proximate analysis for the on-spec sample was observed. The volatile and fixed carbon contents of the as-received sample were 73.5 and 5.6 wt%, respectively while the rest 20.9 wt% was ash. Although the volatile content is similar to the literature value, the fixed carbon is lower because of the high ash content compared to the literature (Phasee and Areeprasert, 2017). The volatile and fixed carbon of the on-spec samples varied between 69.2–75.3 and 5.8–8.0 wt%, respectively. In the fines fraction, the volatiles significantly dropped by approximately 28% compared to on-spec as well as the fixed carbon (approximately 23%), resulting in an increase in the ash content.
As both the ultimate (especially carbon) and the proximate analysis showed minimal changes in the on-spec samples compared to the as-received material, our expectation was to get a similar observation on HHV. In addition, as the fines had very high ash content in addition to the lower carbon content compared to on-spec, they should have lower HHV. Figure 3 indicates that the HHV of the as-received material was 21.5 MJ/kg while the on-spec and fines samples were 20.5–21.6 and 12.6–17.0 MJ/kg, respectively. Similar to the ultimate and proximate analysis, HHV also confirmed that the preprocessing reduces the variability even though the average values did not change significantly. Even though each of the analyses was replicated at least 9 times (mentioned in Section 2), the standard deviation of the measurements is still high, which could be due to the heterogeneity of nMSW in nature.
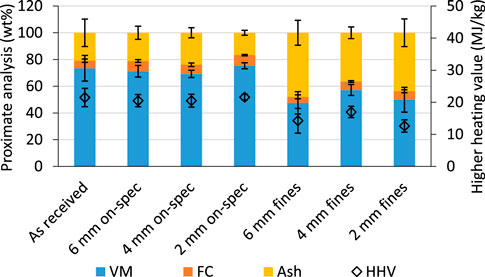
FIGURE 3. Proximate analysis and higher heating value of on-spec MSW along with fines and as-received material. The error bars represent the standard deviation between replicate measurements.
Although the preprocessing did not change most of the chemical properties significantly other than removing substantial inorganics, this could have a great impact on the combustion, which will be discussed in the next sections.
3.3 Elemental ash and predictive indices
Table 3 showed the elemental percentage in the ash after complete oxidation. The Si content dominates in all the studied samples, where 55.5% was in the as-received nMSW. The concentration of Si reduces in the on-spec samples while an increase in the fines fractions was as expected because the fines fraction of any specific size is mostly the dirt and glass. Similar to the Si, Na also accumulated in the fines compared to the on-spec. All other inorganic species are more in the on-spec fraction compared to the fines.
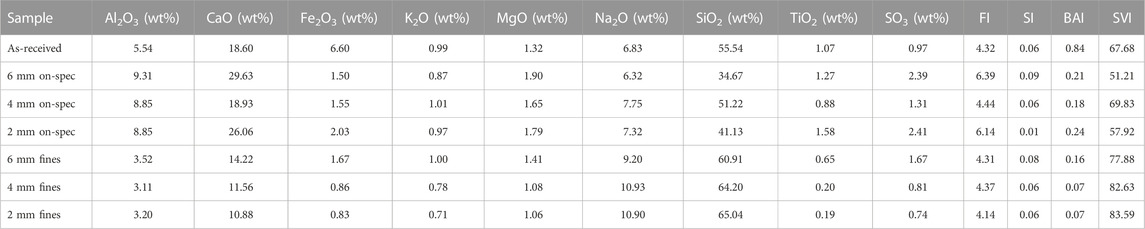
TABLE 3. Major elemental ash composition along with the predictive indices. The green, yellow, and red color cells indicate low, medium, and high, respectively.
The predictive indices are evaluated based on elemental ash analysis and are shown in Table 3. The FI showed a distinct difference between on-spec and fine fractions. This difference could be mainly due to the difference in Si content as well as the Na content since the K was similar in both on-spec and fines fractions. All the FI indexes were from 4.0 to 6.5 which indicates a medium fouling inclination. Sever Akdağ et al. (2016) found that the FI of the RDF was between 0.3 and 0.5, which is lower than what we observed in this study. Usually, RDF is considered the combustible fraction of MSW; which means most of the Si content (which contributed significantly to the FI) has already been removed, resulting in lower FI. Similar to the FI, BAI also showed two distinct bands, while the on-spec BAI is higher compared to the fines. For example, the BAI of the on-spec is greater than 0.18 while the fines are less than 0.16. Bed agglomeration usually occurs when the BAI is less than 0.15 (Vamvuka and Zografos, 2004), which means this could be a possible scenario for the fines. Higher BAI indicates a higher ash fusion temperature, therefore having a higher BAI is preferred for the fuels (Lachman et al., 2021). On the other hand, SI indexes of all samples were less than 0.10, which exhibited very low slagging inclination as the SI<0.6 is considered a low slagging inclination fuel (Masiá et al., 2007). Phasee and Areeprasert (Phasee and Areeprasert, 2017) found that the MSW showed medium slagging inclination as the SI obtained was 1.66 where current study showed low. This difference could be due to the different sources of MSW used in these two studies. The SVI of the on-spec samples is between 50 and 70 while the fines are >77. As per the literature (Masiá et al., 2007; Lachman et al., 2021), the SVI greater than 72 is considered as low slagging while lower than 65 is considered as high slagging. Hence, the fines showed low slagging sample. Note that the SVI indicates the slagging tendency inside the furnace during combustion. Although the fines showed more prominent SVI compared to on-spec samples, other indices (e.g., FI, SI, BAI) discussed above could conclude the on-spec samples as better fuels. The following section will discuss the combustion properties of the studied samples.
3.4 Combustibility of preprocessed nMSW
Figures 4A, B shows the combustion thermogram and weight loss, while Table 4 presents the combustion properties of studied MSW samples. It is observed that the ignition lag decreased with the smaller particles, which makes them thermally unstable. Both on-spec and fines showed relatively lower ignition lag than as-received MSW. For example, the as-received MSW started to ignite 27.0 s after the applied heat flux where the ignition times of 6, 4, and 2 mm on-spec samples were 24.5, 11.0, and 7.0 s, respectively. This is expected since the size reduction of the materials leads to lower heat transfer limitation for combustion (Zhisheng et al., 2014). The on-spec MSWs showed 1.4-1.8 times higher pHRR and reached pHRR approximately 2.4–6.5 times faster than as-received MSW, while the 6 mm showed the lowest and 4 mm showed the highest pHRR. Although 6 mm fines showed 1.4 times higher pHRR compared to its on-spec sample, due to the very high unburnt fraction (approximately 36.5 wt%) shown in Figure 4B it would not be wise to use it as fuel. Overall, the fines had 10%–30% less weight loss after 30 min of combustion relative to on-specs, indicating the fines contained higher unburnt residuals and would not be good biorefinery feedstock. The combustion efficiency shown in Table 4 suggests that all the samples had 100% conversion efficiency meaning the CO2 formation was prevalent over CO formation.
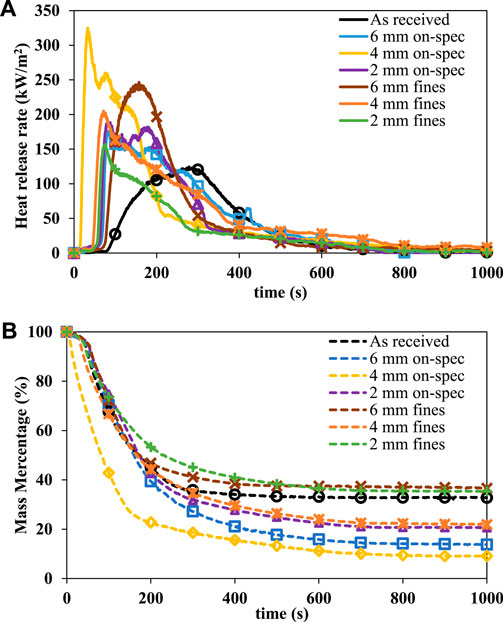
FIGURE 4. Combustion behavior of studied nMSW materials. (A) combustion thermograms, and (B) mass percentage with respect to combustion time.
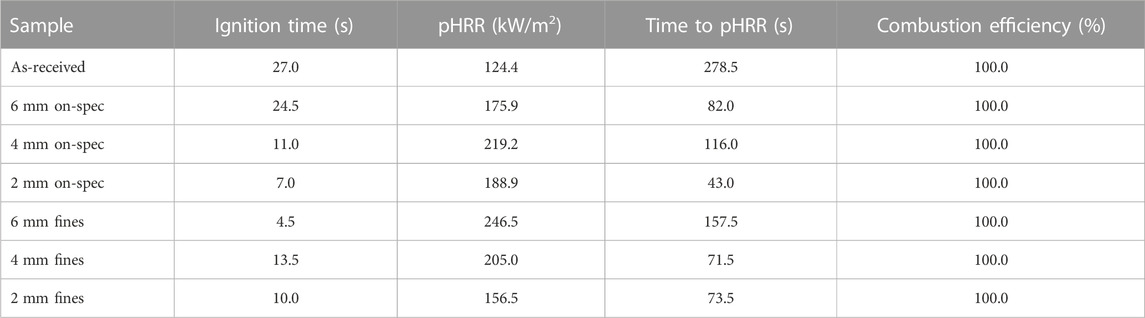
TABLE 4. Combustion properties of studied nMSW materials.
3.5 Effect of advanced preprocessing
An advanced preprocessing step (gravity separation) was introduced for the 6 mm sample to see whether we could further improve the material quality (in terms of fuel) or obtain component-rich or pure fractions removed from the MSW mixture. It was visually observed that the light fraction contained mostly paper and fiber wastes, while the middle included a large portion of these materials mixed with foils and other composite wrappers (see Supplementary Figure S3 in the Supplementary Material S1). The average loose bulk densities (shown in Table 5) of heavy, mid, and light were 152.1, 72.5, and 54.7 kg/m3, respectively, which confirms that the material separated based on the density. The proximate analysis of those three streams showed that the average ash content of the heavy stream was 37.1 wt% while the mid and light streams were 9.3 and 8.9 wt%, respectively. The ash species showed that the heavy fraction contained approximately 60 wt% Si while mid and light fractions contained approximately 47 and 42 wt% Ca out of the total inorganics. These findings further confirm that the dense inorganics (e.g., glass, dirt) move to the heavier cut and light inorganics (e.g., ink in the writing paper) move to the light and mid cuts during the separation. In addition, the presence of fixed carbon and volatile matters slightly improved in the middle and light fractions, which could further enhance the combustion properties of those fractions.
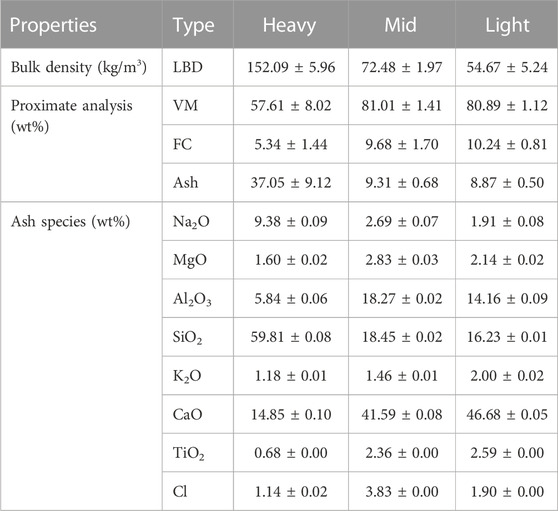
TABLE 5. Physical and chemical properties of gravity-separated 6 mm nMSW sample.
Regardless of the end use, mixed wastes by their nature require processing before their use as a fuel product or before their reformulation to a saleable market product. This work presents an over-for-one MSW scenario where material was collected after recycling operations. An initial characterization of the material shows material properties that are not too dissimilar from those of other biomass and biomaterial feedstock but much more variable. In addition, the profile of metals and inorganics, and biological contaminants that come along with post-consumer waste create additional challenges to material re-introduction to the marketplace. Depending on the intended application, preprocessing and fractionation stages should be tailored to the end purpose, e.g., inorganics removal and metal passivation for thermochemical conversion or biological sterilization and inhibitor treatment for biological processing, etc. Focusing on critical material attributes and the unit operations to homogenize and stabilize those properties, such as those for solid fuel shown in this case study, is essential for reusing this feedstock and needs to be the focus of future research. When possible, these metals, polymers, resins, and fibers should be carefully extracted and recycled back for circular product use–some of which require additional circularity consideration during product design. Recovery and recycling efforts themselves are improving but could be improved substantially. For example, it is anecdotally noted here that the vast majority of material components from the studied material were potentially recyclable post-consumer products. Future work will focus on the recovery of these materials, as well as the partitioning of materials according to beneficial use in energy/product scheme(s).
4 Conclusion
Various physical and chemical properties of the mechanically preprocessed nMSW along with the as-received nMSW were investigated. This study observed that almost 50% of the on-spec material was larger than the specific nominal size which could be due to the compressible behavior of feedstock. The bulk density showed that it increased with the decrease in particle size as smaller particles packed well by keeping the void space to a minimum. A significant difference of ash content observed in the on-spec and fines fraction indicates that the on-spec fraction of the nMSW could be better fuel, which was further proven by the SI and BAI indices. Various combustion properties confirm that mechanical preprocessing positively influences the combustion of on-spec materials. Reducing the size of the on-spec samples showed earlier ignition. The on-spec samples ended up with 10%–30% less residual weight at the end of the combustion relative to the fines, indicating that the fines contain higher unburnt residuals. Advanced separation technique further showed the ash content of the middle and light streams was 4.0–4.2 times lower than the heavy stream, which further indicated an improvement of the fuel property. Overall, mechanical preprocessing mainly improves the material variability rather than improving the substantial fuel properties. However, mechanical preprocessing followed by mild chemical preprocessing might improve the material variability as well as fuel properties of the nMSW, which requires more investigation in the future. In addition, identifying various species in each individual fraction (e.g., heavies, middles, and lights) might be helpful for downstream utilization which is currently under investigation.
Data availability statement
The original contributions presented in the study are included in the article/Supplementary Material, further inquiries can be directed to the corresponding author.
Author contributions
NS, JK, and TR conceptualization, project oversight. NS and MTI contributed to experimental investigation, methodology, formal analysis, data curation, and writing the original draft manuscript. NS, JK, MTI, and TR writing, reviewing, and editing.
Funding
The research is supported by the U.S. Department of Energy (DOE), Office of Energy Efficiency and Renewable Energy (EERE), Bioenergy Technologies Office (BETO), under DOE Idaho Operations Office with Contract No. DE-AC07-05ID14517.
Acknowledgments
This work leveraged resources of the US Department of Energy’s Biomass Feedstock National User Facility (BFNUF) and Bioenergy Feedstock Library located at Idaho National Laboratory (Idaho Falls, ID). The authors would like to acknowledge the assistance of Brad Thomas and Gabriella Morales at Idaho National Laboratory with the ultimate and proximate, and ash species analyses, respectively. The authors would also like to acknowledge the technical support and guidance of GTI Energy, Zach El Zahab and Matthew Davidson.
Conflict of interest
The authors declare that the research was conducted in the absence of any commercial or financial relationships that could be construed as a potential conflict of interest.
Publisher’s note
All claims expressed in this article are solely those of the authors and do not necessarily represent those of their affiliated organizations, or those of the publisher, the editors and the reviewers. Any product that may be evaluated in this article, or claim that may be made by its manufacturer, is not guaranteed or endorsed by the publisher.
Supplementary material
The Supplementary Material for this article can be found online at: https://www.frontiersin.org/articles/10.3389/ffuel.2023.1105637/full#supplementary-material
References
Alqassim, A. Y. (2021). Environmental health impacts of municipal solid waste landfilling and incineration in different health systems: A review. Hail J. Health Sci. 3, 13–24. doi:10.4103/1658-8312.347572
Azam, M., Jahromy, S. S., Raza, W., Jordan, C., Harasek, M., and Winter, F. (2019). Comparison of the combustion characteristics and kinetic study of coal, municipal solid waste, and refuse-derived fuel: Model-fitting methods. Energy Sci. Eng. 7, 2646–2657. doi:10.1002/ese3.450
Brown, R. M., Hoover, A. N., Klinger, J. L., Wahlen, B. D., Hartley, D., Lee, H., et al. (2022). Decontamination of mixed paper and plastic municipal solid waste increases low and high temperature conversion yields. Front. Energy Res. 10. doi:10.3389/fenrg.2022.834832
Campuzano, R., and González-Martínez, S. (2016). Characteristics of the organic fraction of municipal solid waste and methane production: A review. Waste Manag. 54, 3–12. doi:10.1016/j.wasman.2016.05.016
Chanaka Udayanga, W. D., Veksha, A., Giannis, A., Lisak, G., and Lim, T.-T. (2019). Effects of sewage sludge organic and inorganic constituents on the properties of pyrolysis products. Energy Convers. Manag. 196, 1410–1419. doi:10.1016/j.enconman.2019.06.025
Chen, D., Gao, A., Ma, Z., Fei, D., Chang, Y., and Shen, C. (2018). In-depth study of rice husk torrefaction: Characterization of solid, liquid and gaseous products, oxygen migration and energy yield. Bioresour. Technol. 253, 148–153. doi:10.1016/j.biortech.2018.01.009
Hlaba, A., Rabiu, A., and Osibote, O. A. (2016). Thermochemical conversion of municipal solid waste-an energy potential and thermal degradation behavior study. Int. J. Environ. Sci. Dev. 7, 661–667. doi:10.18178/ijesd.2016.7.9.858
Kim, S. M., Dien, B. S., and Singh, V. (2016). Promise of combined hydrothermal/chemical and mechanical refining for pretreatment of woody and herbaceous biomass. Biotechnol. Biofuels 9, 97. doi:10.1186/s13068-016-0505-2
Kwon, E., Westby, K. J., and Castaldi, M. J. (2010). “Transforming municipal solid waste (MSW) into fuel via the gasification/pyrolysis process,” in North American Waste-to-Energy Conference, 53–60.
Lacey, J. A., Aston, J. E., Westover, T. L., Cherry, R. S., and Thompson, D. N. (2015). Removal of introduced inorganic content from chipped forest residues via air classification. Fuel 160, 265–273. doi:10.1016/j.fuel.2015.07.100
Lachman, J., Baláš, M., Lisý, M., Lisá, H., Milčák, P., and Elbl, P. (2021). An overview of slagging and fouling indicators and their applicability to biomass fuels. Fuel Process. Technol. 217, 106804. doi:10.1016/j.fuproc.2021.106804
Liu, X., and Bi, X. T. (2011). Removal of inorganic constituents from pine barks and switchgrass. Fuel Process. Technol. 92, 1273–1279. doi:10.1016/j.fuproc.2011.01.016
Masiá, A. T., Buhre, B., Gupta, R., and Wall, T. (2007). Characterising ash of biomass and waste. Fuel Process. Technol. 88, 1071–1081. doi:10.1016/j.fuproc.2007.06.011
Medina, C. H., Maccoitir, B., Sattar, H., Slatter, D. J., Phylaktou, H. N., Andrews, G. E., et al. (2015). Comparison of the explosion characteristics and flame speeds of pulverised coals and biomass in the ISO standard 1 m3 dust explosion equipment. Fuel 151, 91–101. doi:10.1016/j.fuel.2015.01.009
Nandhini, R., Berslin, D., Sivaprakash, B., Rajamohan, N., and Vo, D.-V. N. (2022). Thermochemical conversion of municipal solid waste into energy and hydrogen: a review. Environ. Chem. Lett. 20, 1645–1669. doi:10.1007/s10311-022-01410-3
Ojolo, S., and Bamgboye, A. (2005). Thermochemical conversion of municipal solid waste to produce fuel and reduce waste. Washington: International Commission of Agricultural Engineering.
Panepinto, D., Tedesco, V., Brizio, E., and Genon, G. (2015). Environmental performances and energy efficiency for MSW gasification treatment. Waste Biomass Valorization 6, 123–135. doi:10.1007/s12649-014-9322-7
Phasee, P., and Areeprasert, C. (2017). Thermal decomposition behavior during combustion of hydrothermally treated MSW by thermogravimetric analysis. Energy Procedia 138, 616–621. doi:10.1016/j.egypro.2017.10.171
Pio, D., Tarelho, L., Tavares, A., Matos, M., and Silva, V. (2020). Co-gasification of refused derived fuel and biomass in a pilot-scale bubbling fluidized bed reactor. Energy Convers. Manag. 206, 112476. doi:10.1016/j.enconman.2020.112476
Rajca, P., Poskart, A., Chrubasik, M., Sajdak, M., Zajemska, M., Skibiński, A., et al. (2020). Technological and economic aspect of refuse derived fuel pyrolysis. Renew. Energy 161, 482–494. doi:10.1016/j.renene.2020.07.104
Rantuch, P., Martinka, J., and Ház, A. (2021). The evaluation of torrefied wood using a cone calorimeter. Polymers 13, 1748. doi:10.3390/polym13111748
Rivard, C. J., Rodriguez, J. B., Nagle, N. J., Self, J. R., Kay, B. D., Soltanpour, P. N., et al. (1995). Anaerobic digestion of municipal solid waste. Appl. Biochem. Biotechnol. 51-52, 125–135. doi:10.1007/bf02933417
Saha, N., Fillerup, E., Thomas, B., Pilgrim, C., Causer, T., Herren, D., et al. (2022a). Improving bamboo’s fuel and storage properties with a net energy export through torrefaction paired with catalytic oxidation. Chem. Eng. J. 440, 135750. doi:10.1016/j.cej.2022.135750
Saha, N., Goates, C., Hernandez, S., Jin, W., Westover, T., and Klinger, J. (2022b). Characterization of particle size and moisture content effects on mechanical and feeding behavior of milled corn (Zea mays L.) stover. Powder Technol. 405, 117535. doi:10.1016/j.powtec.2022.117535
Seo, Y.-C., Alam, M. T., and Yang, W.-S. (2018). “Gasification of municipal solid waste,” in Gasification for low-grade feedstock, 115–141.
Sever Akdağ, A., Atımtay, A., and Sanin, F. D. (2016). Comparison of fuel value and combustion characteristics of two different RDF samples. Waste Manag. 47, 217–224. doi:10.1016/j.wasman.2015.08.037
United States Environmental Protection Agency (2015). Advancing sustainable materials management: 2014 fact sheet. Washington: International Commission of Agricultural Engineering.
United States Environmental Protection Agency (2018). National overview: Facts and figures on materials, wastes and recycling.
Vamvuka, D., and Zografos, D. (2004). Predicting the behaviour of ash from agricultural wastes during combustion. Fuel 83, 2051–2057. doi:10.1016/j.fuel.2004.04.012
Volpe, M., Luz, F. C., Saha, N., Reza, M. T., Mosonik, M. C. A., Volpe, R., et al. (2021). Enhancement of energy and combustion properties of hydrochar via citric acid catalysed secondary char production. Biomass Convers. Biorefinery, 1–12. doi:10.1007/s13399-021-01816-z
Wang, H., Wang, L., and Shahbazi, A. (2015). Life cycle assessment of fast pyrolysis of municipal solid waste in North Carolina of USA. J. Clean. Prod. 87, 511–519. doi:10.1016/j.jclepro.2014.09.011
Wang, K., Zhang, J., Shanks, B. H., and Brown, R. C. (2015). The deleterious effect of inorganic salts on hydrocarbon yields from catalytic pyrolysis of lignocellulosic biomass and its mitigation. Appl. Energy 148, 115–120. doi:10.1016/j.apenergy.2015.03.034
Xu, G., Li, M., and Lu, P. (2019). Experimental investigation on flow properties of different biomass and torrefied biomass powders. Biomass Bioenergy 122, 63–75. doi:10.1016/j.biombioe.2019.01.016
Yang, Y., Liew, R. K., Tamothran, A. M., Foong, S. Y., Yek, P. N. Y., Chia, P. W., et al. (2021). Gasification of refuse-derived fuel from municipal solid waste for energy production: a review. Environ. Chem. Lett. 19, 2127–2140. doi:10.1007/s10311-020-01177-5
Zhang, S., Song, Y., Song, Y. C., Yi, Q., Dong, L., Li, T. T., et al. (2016). An advanced biomass gasification technology with integrated catalytic hot gas cleaning. Part III: Effects of inorganic species in char on the reforming of tars from wood and agricultural wastes. Fuel 183, 177–184. doi:10.1016/j.fuel.2016.06.078
Keywords: non-recyclable municipal solid waste, mechanical preprocessing, biorefinery feedstock, material variability, higher heating value, combustibility
Citation: Saha N, Klinger J, Islam MT and Reza T (2023) Advanced biorefinery feedstock from non-recyclable municipal solid waste by mechanical preprocessing. Front. Fuels. 1:1105637. doi: 10.3389/ffuel.2023.1105637
Received: 22 November 2022; Accepted: 31 January 2023;
Published: 22 February 2023.
Edited by:
Marco A. Sanchez-Castillo, Universidad Autónoma de San Luis Potosí, MexicoReviewed by:
Marcin Jewiarz, University of Agriculture in Krakow, PolandMark Mba Wright, Iowa State University, United States
Copyright © 2023 Saha, Klinger, Islam and Reza. This is an open-access article distributed under the terms of the Creative Commons Attribution License (CC BY). The use, distribution or reproduction in other forums is permitted, provided the original author(s) and the copyright owner(s) are credited and that the original publication in this journal is cited, in accordance with accepted academic practice. No use, distribution or reproduction is permitted which does not comply with these terms.
*Correspondence: Jordan Klinger, am9yZGFuLmtsaW5nZXJAaW5sLmdvdg==