 Wenyi Qin
 Xujun Wang4
 Hui Lu
- 1Center for Biomedical Informatics, Shanghai Children's Hospital, Shanghai Jiaotong University, Shanghai, China
- 2Department of Bioengineering, University of Illinois at Chicago, Chicago, IL, United States
- 3Department of Genetics, School of Medicine, Yale University, New Haven, CT, United States
- 4Department of Bioinformatics and Biostatistics, SJTU-Yale Joint Center for Biostatistics, Shanghai Jiaotong University, Shanghai, China
- 5Department of Biostatistics, School of Public Health, Yale University, New Haven, CT, United States
Motivation: Gene set enrichment analysis is a widely accepted expression analysis tool which aims at detecting coordinated expression change within a pre-defined gene sets rather than individual genes. The benefit of gene set analysis over individual differentially expressed (DE) gene analysis includes more reproducible and interpretable results and detecting small but consistent change among gene set which could not be detected by DE gene analysis. There have been many successful gene set analysis applications in human diseases. However, when the sample size of a disease study is small and no other public data sets of the same disease are available, it will lead to lack of power to detect pathways of importance to the disease.
Results: We have developed a novel joint gene set analysis statistical framework which aims at improving the power of identifying enriched gene sets through integrating multiple similar disease data sets. Through comprehensive simulation studies, we demonstrated that our proposed frameworks obtained much better AUC scores than single data set analysis and another meta-analysis method in identification of enriched pathways. When applied to two real data sets, the proposed framework could retain the enriched gene sets identified by single data set analysis and exclusively obtained up to 200% more disease-related gene sets demonstrating the improved identification power through information shared between similar diseases. We expect that the proposed framework would enable researchers to better explore public data sets when the sample size of their study is limited.
Background
High-throughput technology like microarray and next-generation sequencing (NGS) allows researchers measure the expression levels of thousands of genes or microRNAs in one sample simultaneously. These high-throughput genomic data have enabled researchers to better identification of disease related genes and pathways (Gu et al., 2014, 2017; Zheng et al., 2015, 2016; Liu et al., 2016, 2017, 2018; Gong et al., 2018). Gene set enrichment analysis has become a widely accepted expression analysis tool whose purpose is to identify coherent altered expression change within a predefined gene set or a pathway rather than identifying individual differentially expressed (DE) genes (Mootha et al., 2003; Kim and Volsky, 2005; Subramanian et al., 2005; Nam and Kim, 2008). Compared with DE gene analysis, more reproducible and interpretable results could be obtained through gene set enrichment analysis. Gene set enrichment could also detect small but consistent change which is ignored by DE gene analysis (Luo et al., 2009). There are many successful applications of gene set enrichment analysis approach in human disease-related gene/pathway discovery. For example, Drier et al. (2013) showed that enriched gene sets could serve as biomarkers in predicting survival time in glioblastoma and colorectal cancer patients. Zhao et al. combined gene set enrichment analysis information and microRNA target gene sets to identify cancer-related microRNAs (Zhao et al., 2014). Lee et al. utilized gene set enrichment analysis based on mutation and transcriptional data to identify driver mutation behind breast cancer metastasis (Lee et al., 2016). Identifying the enriched gene set will provide crucial information of molecular functions and mechanisms underlying different diseases.
Many gene set enrichment analysis methods have been developed to identify differentially expressed gene sets with different assumptions and data types (Edgar et al., 2002; Kim and Volsky, 2005; Subramanian et al., 2005; Dinu et al., 2007; Freudenberg et al., 2010; Rahmatallah et al., 2015; Zhao and Li, 2017). These methods focused on the analysis of one single data set, thus cannot make full utilization of the rich amount of public expression data. Further, with the cost of microarray and next generation sequencing technique decreasing and stabilization of the experiment protocol, there are now over 1,000,000 samples deposited in public databases such as Gene Expression Ominus (GEO) (Subramanian et al., 2005), meta-analysis is one way to improve the identification power by integrating data sets of same conditions together (Qin et al., 2016). Shen and Tseng (2010) and Chen M. et al. (2013) both proposed meta gene set enrichment analysis frameworks to integrate public data sets of same biological condition and demonstrated improved identification power. However, these meta-analysis frameworks simplify the model by assuming a simple concordance model: a gene is either differentially in all studies or non-differentially expressed in all studies. This is a reasonable assumption when analyzing the dataset of same biological condition but might be problematic in conditions where there are not many public studies available for this disease.
On the other hand, the joint analysis approach has proven more effective in combining multiple different but similar sources of data than meta-analysis approach. The joint analysis methods developed in other fields of omics data analysis have proven useful in increasing the identification power by borrowing information from other similar diseases (Chen X. et al., 2013; Chung et al., 2014; Wang et al., 2016; Lin et al., 2017). In our previous study, we also demonstrated that our joint analysis framework aiming at DE gene detection is more advantageous than single data set analysis and meta-analysis in both simulation studies and real data cases combining different similar disease data sets (Qin and Lu, 2018).
In this study, we extended our previous joint gene analysis framework to joint gene set analysis framework. Base on the assumption that similar disease tends to share similar disease-related genes and pathways (Carson et al., 2017; Qin and Lu, 2018), we developed two joint gene set analysis frameworks aiming at improving identification power of enriched gene sets by borrowing different levels of information from other similar diseases. Compared with previous joint gene analysis framework, we unified DE gene/pathway statistic modeling through a two-component beta-uniform mixture model of p-values and combined the model with normalized Kolmogorov-Smirnov (KS) statistic for joint gene set enrichment analysis. These novel frameworks were then compared with single data set analysis as well as the MAPE framework proposed by Shen and Tseng (2010) in simulation studies while Chen's method is not available from their website (Chen M. et al., 2013). The simulation results demonstrated that our proposed joint analysis framework outperformed all other methods in AUC under different simulation scenarios. When applied to two real data examples, the proposed joint analysis framework could recover most of the enriched gene sets which is identified by single data set analysis and further identified more pathways with better biological interpretability than single data set analysis. These results demonstrated the improved identification power of enriched gene sets of the proposed joint gene set analysis framework by borrowing information through similar diseases.
Methods
EM Algorithm Implementation for Joint Gene Set Analysis Framework
To perform joint gene set analysis, we need to first address the issue of modeling DE gene/enriched pathway statistics in a single data set. In this study, P-values derived from differential test statistics (for example, two sample t-statistic or Kolmogorov–Smirnov (KS) statistic designed for detecting enriched pathways) in a single data set are modeled directly by a beta-uniform two component mixture model as described in Pounds and Morris (2003) where the p-values of non-DE genes/non-enriched pathways are assumed to belong to uniform distribution and p-values of DE genes/enriched pathways belong to a beta distribution with scale parameter α and 1, i.e., f(p|D = 1) = αpα−1; f(p|D = 0) = 1, where the categorical variable D represents either DE/enriched or non-DE/non-enriched status of a gene/pathway. The marginal density of p-value is thus written as follows:
where Pr(D = 1) is the percentage of DE genes/enriched pathways in a single data set and αϵ(0, 1) is the parameter of the beta distribution. In the joint analysis framework setup, let pg = {pg1, …pgN} represent all computed p-values of g-th gene/pathway across N diseases. The formula (1) could be extended to N diseases:
where Pr(D1…, DN) represents the global configuration of DE gene/enriched pathway status across all diseases. In this model, Pr(D1…, DN) and α = {α1,α2, …αN} need to be estimated from the data. This is a typical mixture model problem, therefore an EM algorithm is implemented to obtain the maximum likelihood estimate of these parameters following the derivation in previous literature (Pounds and Morris, 2003; Qin and Lu, 2018). The details are described as follows:
Given initial guess of and where , the EM algorithm update at t-th step for α(t) and Pr(D1…, DN) is written as follows:
E-Step
The posterior probability of g-th gene's configuration status given observed pg and α(t) is given by:
M-Step
Then the updated and α(t+1) is shown as follows:
Normalized KS statistic defined in Mootha et al. (2003) is used to detect significantly enriched pathways by measuring if the ranks of genes along one pathway are more enriched on the top rank of an ordered gene list than expected by chance while controlling for pathway size. A normalized KS statistic for a pathway P containing M members is computed as follows:
1. Order all G genes by their statistical significance.
2. Calculate if the gene i does not belong to a pathway; Calculate if the gene i belongs to the pathway.
3. Run a running sum across all G genes and compute the normalized KS statistic as:
To evaluate the significance of the observed normKS for a pathway, a gene-based permutation test is used to calculate the p-value.
The permutation test contains the following steps:
1. Random permutate the gene labels.
2. Compute the permutated normalized KS statistics for each pathway and pool them together as nKSperm.
3. Repeat step 1 and 2 B times.
4. The p-value of a pathway P could be obtained by counting how many permutated normalized KS statistics are larger than the observed normalized KS statistic, i.e.,:
where I(·) is the indicator function.
Gene-Level Joint Gene Set Enrichment Analysis Framework (JointNormKS)
Based on the two-component mixture modeling of p-value for a single data set defined before a gene-level joint gene set enrichment framework is then developed which is based on normalized KS statistic (JointNormKS). The outline of the framework could be summarized as follows:
1. Compute and convert the differential statistics into p-value, denote pgi as the p-value of gene g in data set i.
2. Joint analysis based on a two-component beta-uniform mixture model is performed with these p-values and the posterior probability of DE status for each gene g in disease i is computed:
3. Compute normKS statistic and corresponding p-value based on the ranking of posterior probability Pr(Di = 1|pg1, …, pgN) within each data set i.
4. After p-values of all pathways within each data set are computed, use Benjamini-Hochberg (BH) procedure (Benjamini and Hochberg, 1995) to compute FDR for each pathway and order the pathways within each dataset by the FDR respectively.
Pathway-Level Joint Pathway Enrichment Analysis Framework (JointPathway)
In this section, JointPathway is proposed as another joint gene set enrichment analysis framework which summarizes the enrichment evidence on pathway-level first within each disease data set and then performs joint analysis on pathway-level p-value to identify potential enriched pathways. The assumption of the framework is based on that similar disease tends to share similar shared dysregulated pathways. The outline of the framework is summarized as follows:
1. Within each disease dataset, compute the normKS statistics for each pathway and obtain their p-values based on the permutation procedures denoted as pgi where g represents g-th pathway and i represents i-th disease data set. The implementation of the permutation procedures is described in detail in JointNormKS section.
2. Perform joint analysis procedure based on pgi of all pathways across all data sets. Estimate prior probability, Pr(D1…, DN), and beta distribution parameter of each data set, α = {α1,α2, …αN}, from pgi through EM algorithm as described before.
3. Compute posterior probability Pr(Di = 1|pg1, …, pgN) of for each pathway g within each data set i as similarly defined in Equation (8) in JointNormKS and rank the pathways accordingly.
Meta-Analysis for Pathway Enrichment Analysis (MAPE)
Meta-Analysis for Pathway Enrichment Analysis (MAPE) is a series of meta-analysis frameworks proposed by Shen and Tseng (2010), which is specifically designed for pathway/gene set enrichment meta-analysis. It consists of three different frameworks: MAPE_Gene, MAPE_Pathway, and MAPE_I. Here, we briefly introduce the implementation of each framework.
MAPE_Gene could be summarized by the following steps:
1. Compute p-value of differential statistic for each gene.
2. Perform MaxP meta-analysis for all genes across all data sets.
3. Compute KS statistics for each pathway.
4. Determine the p-value and false discovery rate (FDR) for each pathway through permutation test.
MAPE_Pathway could be summarized by the following steps:
1. Compute KS statistic and its p-value through permutation test for all pathways within each data set.
2. Perform MaxP meta-analysis for all pathways across all data sets.
3. Determine the p-value and FDR for each pathway through permutation test.
MAPE_I is a hybridization of MAPE_Gene and MAPE_Pathway frameworks which takes the minimum p-value of a pathway obtained through MAPE_Gene and MAPE_Pathway as its test statistic. The p-value and FDR of this statistic are then determined through permutation test.
Simulation Study
To evaluate the effectiveness of the proposed joint gene set analysis frameworks, we performed comprehensive simulation studies. Assume that there is a total of 1,000 DE genes out of 10,000 genes. The expression value of each gene in a sample within each data set is generated as described in our previous study (Qin and Lu, 2018) with different means and variance set for each gene. We further assume that the number of data sets to be jointly analyzed is fixed at N = 2 and the number of shared DE genes between two data sets is fixed at 600, 700, 800, or 900, so the DE gene similarity between two data sets are defined as the average shared percentage of DE genes i.e., would be 60, 70, 80, and 90%. After the gene expression data are generated, we further assume that there is a total of 1,000 pathways each of which contains 50 genes and therefore we would expect to see 5 DE genes within each pathway and any pathway containing more than 5 DE genes would be considered as an enriched pathway. In this simulation study, we set the number of DE genes of an enriched pathway at 10 and 15, respectively. Within each data set, there is a total of 100 enriched pathways. Similar to DE gene similarity definition, we define the shared number of enriched pathways at 60, 70, 80, and 90 between two data sets and consider it as enriched pathway similarity between two diseases. Each pathway is formed by randomly sampling DE and non-DE gene and could be represented by Table 1 where each row represents the enrichment status of a pathway in two data sets and the number in each cell represents how to sample genes from two data sets. Finally, to systematically evaluate the performance of different frameworks, Receiver Operation Curve (ROC) (Fawcett, 2006) is used. Each parameter setup is repeated 30 times and the average Area Under Curve (AUC) is calculated and recorded for each framework.
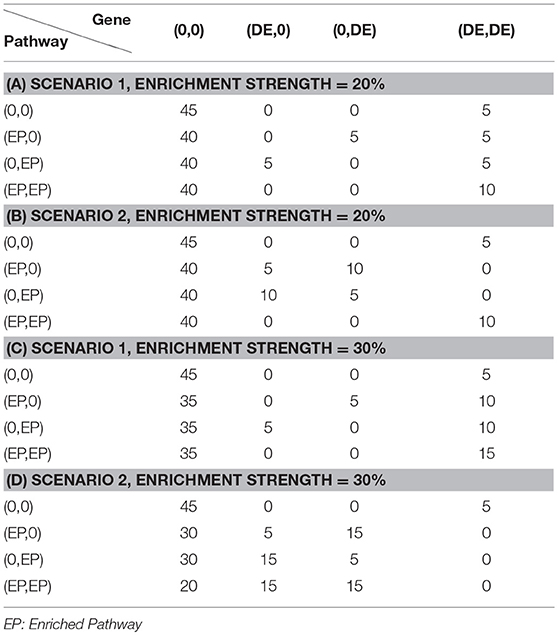
Table 1. Simulation parameter setup under different scenarios.
Gene Set Collection Database
The up-to-date C2 canonical pathway collection (Version 6.1) of MsigDB (Subramanian et al., 2007) which contains 1,329 gene sets is used in this study. Before the gene set enrichment analysis, any gene set which contains < 15 genes, or more than 500 genes is removed from further analysis.
Lung Adenocarcinoma and Colorectal Adenocarcinoma
Adenocarcinomas are observed to share similar DE genes as discovered in our previous study (Qin and Lu, 2018), we decide to use lung adenocarcinoma (GEO accession no.: GSE32863) and colorectal adenocarcinoma (GEO accession no.: GSE41258) as one evaluation of our proposed joint gene set analysis frameworks. After we combined multiple probe sets representing same gene by taking the maximum expression value in each sample, a total of 12,054 unique genes and 991 canonical pathways are used in the analysis.
Alzheimer's Disease (AD) and Huntington's Disease (HD)
AD and HD are known to share highly similar pathology (Narayanan et al., 2014). In this study, GSE33000 which contains both AD and HD postmortem samples are used to evaluate the performance of joint gene set enrichment analysis. Multiple probe sets representing same gene are combined by taking the maximum expression value in each sample. A total of 21,576 genes and 1,071 pathways are used in the analysis.
Results
Overview of Proposed Joint Gene Set Enrichment Analysis Frameworks
Figure 1 outlines the flowchart of three joint gene set enrichment frameworks proposed in this study. The details of the algorithm implementation could be found in the Methods section. Here we briefly discuss the difference between the two frameworks. The joint gene set enrichment framework could be split into gene-level (JointNormKS) and pathway-level (JointPathway). In JointNormKS, the differential expression status of each gene is first jointly analyzed across all similar disease data sets and gene set enrichment analysis is then performed based on the jointly analyzed results which incorporates information from other similar diseases. In this framework, we would expect to observe increased identification power of pathway enrichment when a gene successfully borrows information from other genes. In JointPathway, gene-level information is first summarized based on pathway within each dataset and joint analysis is then performed based on the pathway-level evidence. Under this framework, we would expect to see increased identification power when similar diseases share many enriched pathways among each other.
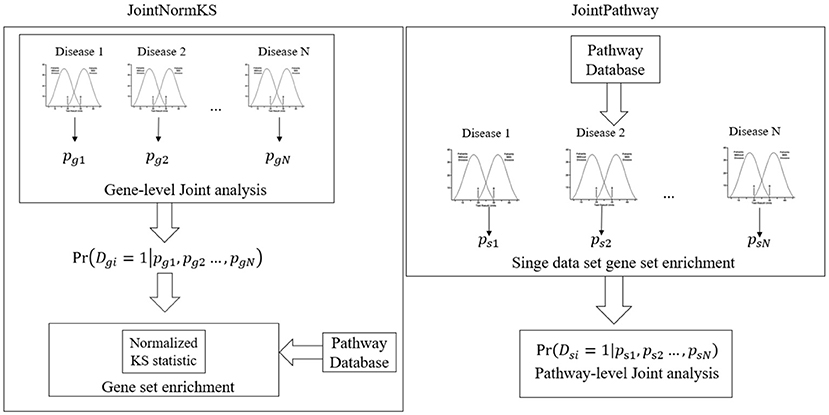
Figure 1. Overview of the proposed joint gene set enrichment frameworks.
Comparisons Among JointNormKS, JointPathway, Single Data Set Analysis and MAPE Methods in Simulated Data Sets
In this section, we evaluated the performance of the proposed joint gene set enrichment analysis framework through simulation study and compared their performance with single data set analysis and published MAPE methods (Shen and Tseng, 2010). The detailed implementation of the simulation study and parameter setup could be found in Methods section and Table 1. Briefly speaking, expression data sets of two similar diseases are generated with different number of DE genes within a pathway, DE gene similarity and enriched pathway similarity. Furthermore, we consider two different DE gene configuration scenario in the pathway. In the first scenario, the enriched pathway in the target disease data set will contain fully overlapped shared DE genes from the similar disease data set from which information is borrowed. In the second scenario, the DE genes in the enriched pathway of the target disease data set will not overlap with any DE genes in the similar disease data set. This is a reasonable assumption as similar situation has been observed in other literature where one pathway is enriched in both datasets but DE genes are different (Shen and Tseng, 2010). The comparison results are summarized in Figure 2.
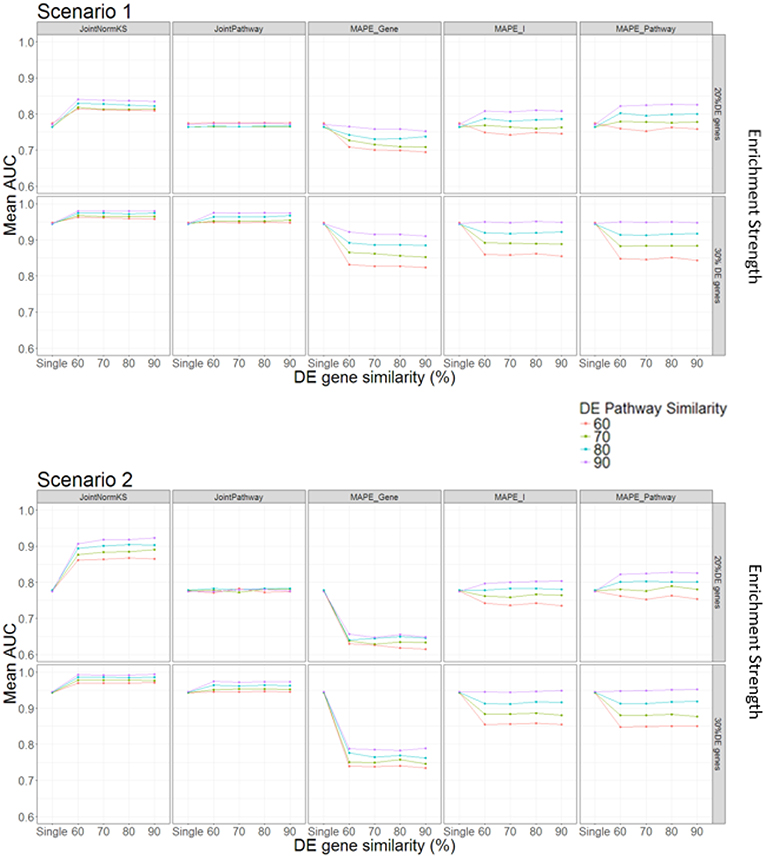
Figure 2. AUC comparison among different methods under different parameter setup.
In Scenario 1, we assume that one enriched pathway is composed of shared DE genes. In this scenario, we observe that our proposed JointNormKS outperforms all other methods when the enrichment strength is set to 20% DE genes in an enriched pathway. We observe that JointNormKS is not sensitive to the DE gene similarity, different DE gene similarity yields similar significant AUC improvement over single data set analysis. On the other hand, enriched pathway similarity shows a stronger impact on the performance of JointNormKS: the AUC improves when the enriched pathway similarity increases. JointPathway in this scenario does not show difference with single data set analysis when the enrichment strength is low mainly because the p-value signals of enriched and non-enriched pathways are not separable in this case. The information borrowing in the joint analysis is thus not working for low-signal case. MAPE methods do not work well in this case. MAPE_Gene shows worse performance in all Enriched pathway parameter setup mainly because when MAPE_Gene summarizes evidence at gene-level, it takes the maximum p-value of a gene in both diseases which will lead to failing to identify many disease-specific DE genes in a pathway. MAPE_Pathway shows increased performance when enriched pathway similarity increases. However, even when the enriched pathway similarity is set to 90%, JointNormKS still outperforms MAPE_Pathway because disease-specific pathway will be regarded as false positive by MAPE_Pathway and thus has a low rank. MAPE_I method combines best results calculated from MAPE_Gene and MAPE_Pathway methods and thus cannot demonstrate better performance than JointNormKS. When the enrichment strength increases from 20% DE genes to 30% DE genes, JointNomrKS still outperforms all other methods. we also observe that JointPathway demonstrates improved AUC over single data set analysis when the enrichment strength increases because the signal of an enriched pathway in a single data set could be distinguished from non-Enriched pathway which enables the information sharing between two similar diseases. MAPE_gene performs similar as before while MAPE_pathway does not show improvement over single data set analysis mainly because when the signal of a single data set is strong enough, meta-analysis-based method would, on the contrary, cause the decrease of the rank of disease-specific Enriched pathway.
In Scenario 2, we assume that enriched pathways are composed of non-overlapping DE genes in two data sets. JointNormKS still outperforms all other methods in this scenario. The AUC improvement is even larger than that in scenario 1. As we further examine the result, we find that the reason that JointNormKS could efficiently borrow shared enriched pathway information is due to the combined use of normalized KS statistic and joint analysis at gene level (see Conclusion and Discussions for details). MAPE_Gene performs even worse in this scenario because there is not shared DE genes within a pathway. Meta-analysis by taking maximum p-value would thus produce many false positives in DE gene detection. Other methods based on pathway-level evidence summarization remain same performance as in Scenario 1.
To sum up, the simulation test with different parameter setup and two different scenarios demonstrates that JointNormKS performs best among all other methods even when there are no shared DE genes within an enriched pathway. We then decide to use JointNormKS method in real data application in next section.
Comparison of JointNormKS With Single Data Set Analysis in Real Data Application
Based on the simulation test results, we apply the JointNormKS framework on two real data sets and compare their identified enriched gene sets with those derived from single data set analysis, respectively. We use lung and colorectal adenocarcinoma as one example because adenocarcinoma both develop from gland cells of different tissues and as shown in our previous study, we observed that lung and colorectal adenocarcinoma shared a significant higher percentage of DE genes than other cancers (Qin and Lu, 2018). Alzheimer's disease and Huntington's disease are selected as another example due to their highly similar clinical phenotypes.
Real Data Application: Lung Adenocarcinoma and Colorectal Adenocarcinoma
JointNormKS is first applied on adenocarcinoma data sets and results are compared with those obtained through single data set analysis with the use of NormKS statistic by setting the FDR cutoff at 0.1. The comparison results are summarized in Figure 3. In lung adenocarcinoma data set, single data set analysis identified 19 pathways while JointNormKS could identify all these pathways plus 12 more enriched pathways. The common pathways identified by both methods contain “KEGG_CELL_CYCLE” which is the KEGG pathway documented in KEGG disease pathway database about known pathways involved with non-small cell lung cancer (pathways taken from hsa05223). The p-value and FDR of this pathway is significantly improved in JointNormKS (FDR~0.005) compared with single data set analysis (FDR~0.012). We also examined other known pathways involved with non-small-cell lung cancer recorded in KEGG and found that most of these pathways have improved significance in JointNormKS over single data set analysis (Additional File 1A). Among other commonly identified pathways, many cancer related pathways are identified including cell cycle related pathways such as “REACTOME_DNA_REPLICATION” and cancer signaling pathways such as “PID_E2F_PATHWAY” (Nevins, 2001; Bracken et al., 2003; Tazawa et al., 2007), “PID_AURORA_B_PATHWAY” all of which play an important role in tumor progress (Chieffi et al., 2006; Girdler et al., 2006; Qi et al., 2007). For exclusively identified pathways by JointNormKS shown in Table 2, many of them are related to lung cancer after an extensive literature search. For instance, “PID_MYC_ACTIV_PATHWAY” is a classic cancer-related pathway regulating cell proliferation process which is found in many cancers (Zajac-Kaye, 2001; Bild et al., 2006; Chou et al., 2010). “BIOCARTA_MCM_PATHWAY” which controls initialization of DNA replication process was reported in several lung cancer studies (Ho et al., 2007; Brambilla and Gazdar, 2009). Other pathways which is closely related to cancer progress includes pathways of amino acid metabolism and DNA synthesis. The full list of identified pathways in lung adenocarcinoma could be found in Additional File 1B.
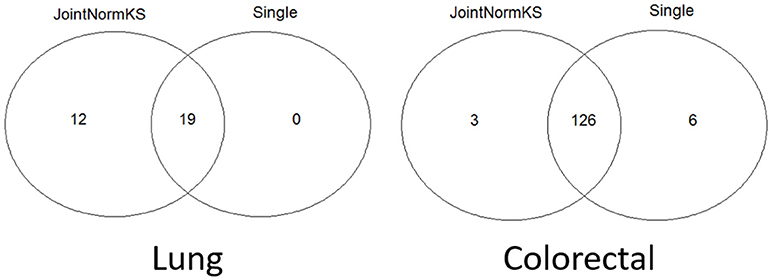
Figure 3. Venn diagram of identified enriched pathways by JointNormKS and single data set analysis in lung and colorectal adenocarcinoma data sets. FDR cutoff is set to 0.1.
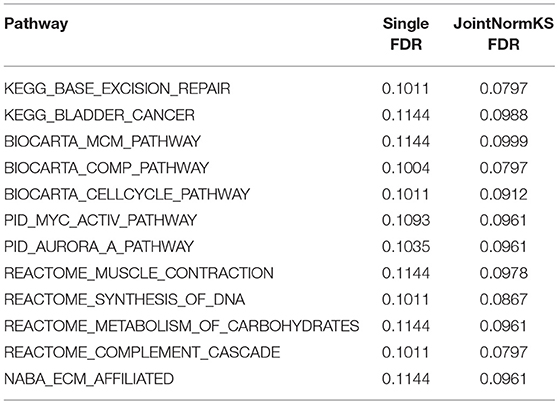
Table 2. Pathways exclusively identified by JointNormKS in lung adenocarcinoma data set.
In colorectal adenocarcinoma data sets, single data set analysis slightly identified more enriched pathways than JointNormKS. One hundred and twenty six pathways were identified by both methods. We observe that three pathways are exclusively identified by JointNormKS while six exclusively by single data set analysis. The biological process represented by 126 commonly identified enriched pathways are similar to what was observed in lung adenocarcinoma data set. Among them, “KEGG_CELL_CYCLE” and “KEGG_P53_SIGNALING_PATHWAY” are two pathways that are documented in pathways known to be related to colorectal cancer in KEGG database (hsa05210). When examining all eight pathways known to be related to colorectal cancer, we also observed that JointNormKS overall improved the FDR statistical significance of these pathways compared with single data set analysis. The full result is summarized in Additional File 2A. We further examined the enriched pathways exclusively identified by JointNormKS and single data set analysis, respectively. We find that all three pathways exclusively identified by JointNormKS are closely related to cancer. “BIOCARTA_P53_PATHWAY” and “PID_MYC_PATHWAY” are two canonical cancer-related pathways. As for “REACTOME_TRANSCRIPTION,” after we examined the gene family categorization on MsigDB, we find that many genes in this gene set belong to gene family related to cancer such as “oncogene,” “tumor suppressor” etc. On the other hand, in the six gene sets exclusively identified by single data set analysis, only one gene set: “WNT_SIGNALING” is the process known to be related to cancer progress. The other four gene sets might be potential false positives because very few reports could be found for these biological processes. The full list of identified enriched gene sets in colorectal adenocarcinoma could be found in Additional File 2B.
Real Data Application: Alzheimer's Disease and Huntington's Disease
Furthermore, we apply JointNormKS on two neurodegenerative disorder data sets and evaluate the identified enriched gene sets. The comparison results are summarized in Figure 4. JointNormKS demonstrated improved statistical power by identifying more enriched gene sets than single data set analysis while enriched gene sets identified by single data set analysis could also be identified by JointNormKS. On the other hand, in AD data set, JointNormKS exclusively identified 13 enriched gene sets and in HD data set, the number is 57. A clear statistical power gain is observed in JointNormKS over single data set analysis here.
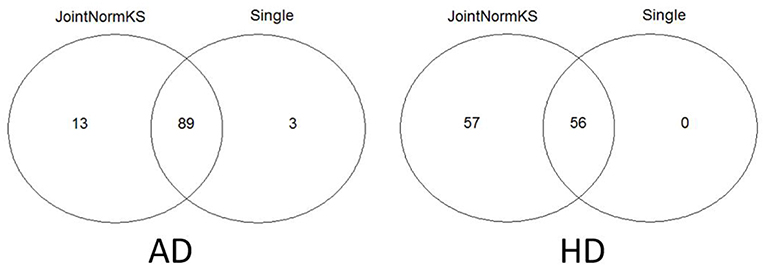
Figure 4. Venn diagram of identified enriched pathways by JointNormKS and single data set analysis in AD and HD data sets. FDR cutoff is set to 0.1.
In AD data set, we first examined three pathways known to be related to AD disease documented in KEGG disease pathway (hsa05010). “KEGG_APOPTOSIS” and “KEGG_OXIDATIVE_PHOSPHORYLATION” are identified by both methods with similar level of significance. The results of three known AD related pathways are summarized in Additional File 3A. A further examination on the 13 exclusively identified gene sets by JointNormKS shows that these gene sets belong to category of apoptosis/cell survival, neuron development and energy metabolism all of which has a close relationship to AD (Table 3). The full list of identified enriched gene sets are summarized in Additional File 3B.
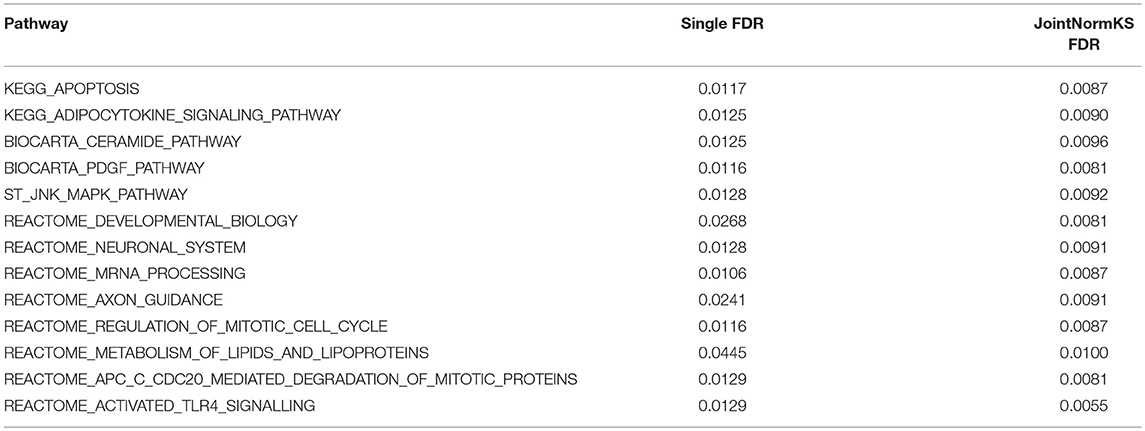
Table 3. Pathways exclusively identified by JointNormKS in AD data set.
In HD data set, seven pathways known to be related to HD documented in KEGG disease pathway are first examined (hsa05016). “KEGG_CALCIUM_SIGNALING_PATHWAY,” “KEGG_OXIDATIVE_PHOSPHORYLATION,” “KEGG_PROTEASOME,” “KEGG_APOPTOSIS” are identified by both methods where JointNormKS demonstrated on average better statistical significance. It worth noting that one HD-related pathway, “KEGG_RNA_POLYMERASE” is exclusively identified by JointNormKS. The full result of these HD related pathways is summarized in Additional File 4A. Furthermore, among the 57 gene sets exclusively identified by JointNormKS, we are surprised to find many cancer-related pathways. A further literature search shows that biological processes such as cell cycle, DNA repair, apoptosis and kinase signaling are both implicated in both diseases suggesting a potential link between two diseases (Plun-Favreau et al., 2010; Driver, 2012). The full list of enriched gene sets identified in HD are summarized in Additional File 4B.
Conclusions and Discussion
In this study, we proposed two novel joint gene set enrichment analysis frameworks: JointNormKS and JointPathway aiming at borrowing shared information across similar disease from gene-level and pathway-level, respectively. Compared our previously developed joint gene analysis framework, the framework proposed here focused on pathway-level detection and demonstrated that assumption of similar disease sharing similar pathways is valid. The framework provides researchers with new opportunities to view their data from a different angle and could complement the limitation of gene-level analysis.
The two frameworks were first tested through simulation test and compared with MAPE, the current meta-analysis methods of gene set enrichment analysis. The results showed that the JointNormKS performed best among all tested methods under all simulation scenarios. The JointNormKS was then applied to two real data sets and identified a comparable or more number of enriched gene sets than analyzing the data set alone. Further examination revealed that JointNormKS could recover most of enriched gene sets that was identified by single data set analysis and the enriched gene sets exclusively identified by JointNormKS were mostly related to the disease. These results demonstrate that when similar diseases are jointly analyzed, the proposed joint gene set framework could borrow information from each other and improve identification power.
In the simulation test, we observed that in Scenario 1, the JointNormKS was not sensitive to the DE gene similarity (Figure 2). The reason is that after the joint analysis at gene-level, the rank of genes which are DE in both data sets would be prioritized to the top of the gene list ordered by posterior probability of DE status and the improvement of the rank of these genes is similar across different DE gene similarity values. Since the Normalized KS statistic is rank-sensitive, the ranks of enriched pathways would remain the same and so is the ROC although the posterior probability of these DE genes within an enriched pathway keep increasing. In scenario 2, when an enriched gene set in both data sets is composed of non-overlapped DE genes across two data sets, we observed that JointNormKS was still able to detect these gene sets and even had a better AUC improvement. The reason is that after gene-level joint analysis, the ranks of DE genes in the disease to be borrowed from would improve and Normalized KS statistic which is sensitive to these changes would increase the rank of these shared pathways. This might raise a concern whether this will lead to increased number of false positives. We would like to argue that the whole framework is designed based on the assumption that similar diseases would share similar enriched pathways. If this assumption holds, the JointNormKS framework would work well as demonstrated in simulation tests.
Three improvements need to be implemented in the future work. The first improvement is to design a likelihood test to detect the shared DE gene or enriched pathway similarity before joint analysis is performed so that researchers using this framework would have a better sense of whether these disease data sets should be jointly analyzed or not. The test procedure would be similar to that described in Chung et al. (2014). The second improvement is the ability of the framework to include more disease data sets to borrow as currently the size of prior probability vector increases exponentially based on the total number N of data sets (2N). A heuristic approximation or a hierarchical structure could be implemented as described in Lai et al. (2017). The third improvement is the incorporation of gene set dependence in the joint gene set enrichment analysis framework. In this study, gene set independence is assumed even many gene sets share common genes. This is hardly the case in real world. How to address the gene set/pathway dependence has been discussed and is a hot topic in the field of statistics (Tamayo et al., 2016; Tomoiaga et al., 2016; Xie et al., 2017). Extra work is needed to include it in the framework proposed in this study and several options would be explored in the future.
Author Contributions
WQ and HL conceived and designed the study. WQ and HL developed the method, XW and HZ helped in method development. WQ wrote the computer program, analyzed data and interpreted the results. WQ, XW, HZ, and HL wrote the manuscript. All authors read and approved the final manuscript.
Funding
The work is partially supported by National Key R&D Program of China 2018YFC0910500, the Neil Shen's SJTU Medical Research Fund, SJTU-Yale Collaborative Research Seed Fund; NSFC 31728012, Science and Technology Commission of Shanghai Municipality (STCSM) grant 17DZ 22512000, and the University of Illinois at Chicago Department of Bioengineering.
Conflict of Interest Statement
The authors declare that the research was conducted in the absence of any commercial or financial relationships that could be construed as a potential conflict of interest.
Supplementary Material
The Supplementary Material for this article can be found online at: https://www.frontiersin.org/articles/10.3389/fgene.2019.00293/full#supplementary-material
References
Benjamini, Y., and Hochberg, Y. (1995). Controlling the false discovery rate: a practical and powerful approach to multiple testing. J. R. Stat. Soc. Ser. B 57, 289–300. doi: 10.2307/2346101
Bild, A. H., Yao, G., Chang, J. T., Wang, Q., Potti, A., Chasse, D., et al. (2006). Oncogenic pathway signatures in human cancers as a guide to targeted therapies. Nature 439:353. doi: 10.1038/nature04296
Bracken, A. P., Pasini, D., Capra, M., Prosperini, E., Colli, E., and Helin, K. (2003). EZH2 is downstream of the pRB-E2F pathway, essential for proliferation and amplified in cancer. EMBO J. 22, 5323–5335. doi: 10.1093/emboj/cdg542
Brambilla, E., and Gazdar, A. (2009). Pathogenesis of lung cancer signalling pathways: roadmap for therapies. Eur. Respir. J. 33, 1485–1497. doi: 10.1183/09031936.00014009
Carson, M. B., Liu, C., Lu, Y., Jia, C., and Lu, H. (2017). A disease similarity matrix based on the uniqueness of shared genes. BMC Med. Genomics 10:26. doi: 10.1186/s12920-017-0265-2
Chen, M., Zang, M., Wang, X., and Xiao, G. (2013). A powerful Bayesian meta-analysis method to integrate multiple gene set enrichment studies. Bioinformatics 29, 862–869. doi: 10.1093/bioinformatics/btt068
Chen, X., Slack, F. J., and Zhao, H. (2013). Joint analysis of expression profiles from multiple cancers improves the identification of microRNA–gene interactions. Bioinformatics 29, 2137–2145. doi: 10.1093/bioinformatics/btt341
Chieffi, P., Cozzolino, L., Kisslinger, A., Libertini, S., Staibano, S., Mansueto, G., et al. (2006). Aurora B expression directly correlates with prostate cancer malignancy and influence prostate cell proliferation. Prostate 66, 326–333. doi: 10.1002/pros.20345
Chou, Y. T., Lin, H. H., Lien, Y. C., Wang, Y. H., Hong, C. F., Kao, Y. R., et al. (2010). EGFR promotes lung tumorigenesis by activating miR-7 through a Ras/ERK/Myc pathway that targets the Ets2 transcriptional repressor ERF. Cancer Res. 70, 8822–8831. doi: 10.1158/0008-5472.CAN-10-0638
Chung, D., Yang, C., Li, C., Gelernter, J., and Zhao, H. (2014). GPA: a statistical approach to prioritizing GWAS results by integrating pleiotropy and annotation. PLoS Genet. 10:e1004787. doi: 10.1371/journal.pgen.1004787
Dinu, I., Potter, J. D., Mueller, T., Liu, Q., Adewale, A. J., Jhangri, G. S., et al. (2007). Improving gene set analysis of microarray data by SAM-GS. BMC Bioinformatics 8:242. doi: 10.1186/1471-2105-8-242
Drier, Y., Sheffer, M., and Domany, E. (2013). Pathway-based personalized analysis of cancer. Proc. Natl. Acad. Sci. U.S.A. 110, 6388–6393. doi: 10.1073/pnas.1219651110
Driver, J. A. (2012). Understanding the link between cancer and neurodegeneration. J. Geriatr. Oncol. 3, 58–67. doi: 10.1016/j.jgo.2011.11.007
Edgar, R., Domrachev, M., and Lash, A. E. (2002). Gene expression omnibus: NCBI gene expression and hybridization array data repository. Nucleic Acids Res. 30, 207–210. doi: 10.1093/nar/30.1.207
Fawcett, T. (2006). An introduction to ROC analysis. Pattern Recognit. Lett. 27, 861–874. doi: 10.1016/j.patrec.2005.10.010
Freudenberg, J. M., Sivaganesan, S., Phatak, M., Shinde, K., and Medvedovic, M. (2010). Generalized random set framework for functional enrichment analysis using primary genomics datasets. Bioinformatics 27, 70–77. doi: 10.1093/bioinformatics/btq593
Girdler, F., Gascoigne, K. E., Eyers, P. A., Hartmuth, S., Crafter, C., Foote, K. M., et al. (2006). Validating aurora B as an anti-cancer drug target. J. Cell Sci. 119, 3664–3675. doi: 10.1242/jcs.03145
Gong, Z., Ma, Q., Wang, X., Cai, Q., Gong, X., Genchev, G., et al. (2018). A herpes simplex virus thymidine kinase-induced mouse model of hepatocellular carcinoma associated with up-regulated immune-inflammatory-related signals. Genes (Basel) 9:380. doi: 10.3390/genes9080380
Gu, J. L., Chukhman, M., Lu, Y., Liu, C., Liu, S. Y., and Lu, H. (2017). RNA-seq based transcription characterization of fusion breakpoints as a potential estimator for its oncogenic potential. Biomed Res. Int. 2017:9829175. doi: 10.1155/2017/9829175
Gu, J. L., Lu, Y., Liu, C., and Lu, H. (2014). Multiclass classification of sarcomas using pathway based feature selection method. J. Theor. Biol. 362, 3–8. doi: 10.1016/j.jtbi.2014.06.038
Ho, M. M., Ng, A. V., Lam, S., and Hung, J. Y. (2007). Side population in human lung cancer cell lines and tumors is enriched with stem-like cancer cells. Cancer Res. 67, 4827–4833. doi: 10.1158/0008-5472.CAN-06-3557
Kim, S. Y., and Volsky, D. J. (2005). PAGE: parametric analysis of gene set enrichment. BMC Bioinformatics 6:144. doi: 10.1186/1471-2105-6-144
Lai, Y., Zhang, F., Nayak, T. K., Modarres, R., Lee, N. H., and McCaffrey, T. A. (2017). An efficient concordant integrative analysis of multiple large-scale two-sample expression data sets. Bioinformatics 33, 3852–3860. doi: 10.1093/bioinformatics/btx061
Lee, J. H., Zhao, X. M., Yoon, I., Lee, J. Y., Kwon, N. H., Wang, Y. Y., et al. (2016). Integrative analysis of mutational and transcriptional profiles reveals driver mutations of metastatic breast cancers. Cell Discov. 2:16025. doi: 10.1038/celldisc.2016.25
Lin, Z., Wang, T., Yang, C., and Zhao, H. (2017). On joint estimation of Gaussian graphical models for spatial and temporal data. Biometrics 73, 769–779. doi: 10.1111/biom.12650
Liu, C., Jiang, J., Gu, J., Yu, Z., Wang, T., and Lu, H. (2016). High-dimensional omics data analysis using a variable screening protocol with prior knowledge integration (SKI). BMC Syst. Biol. 10:118. doi: 10.1186/s12918-016-0358-0
Liu, C., Wang, X., Genchev, G. Z., and Lu, H. (2017). Multi-omics facilitated variable selection in Cox-regression model for cancer prognosis prediction. Methods 124, 100–107. doi: 10.1016/j.ymeth.2017.06.010
Liu, S., Wang, X., Qin, W., Genchev, G. Z., and Lu, H. (2018). Transcription factors contribute to differential expression in cellular pathways in lung adenocarcinoma and lung squamous cell carcinoma. Interdiscipl. Sci. 10, 836–847. doi: 10.1007/s12539-018-0300-9
Luo, W., Friedman, M. S., Shedden, K., Hankenson, K. D., and Woolf, P. J. (2009). GAGE: generally applicable gene set enrichment for pathway analysis. BMC Bioinformatics 10:161. doi: 10.1186/1471-2105-10-161
Mootha, V. K., Lindgren, C. M., Eriksson, K. F., Subramanian, A., Sihag, S., Lehar, J., et al. (2003). PGC-1α-responsive genes involved in oxidative phosphorylation are coordinately downregulated in human diabetes. Nat. Genet. 34:267. doi: 10.1038/ng1180
Nam, D., and Kim, S. Y. (2008). Gene-set approach for expression pattern analysis. Brief. Bioinform. 9, 189–197. doi: 10.1093/bib/bbn001
Narayanan, M., Huynh, J. L., Wang, K., Yang, X., Yoo, S., McElwee, J., et al. (2014). Common dysregulation network in the human prefrontal cortex underlies two neurodegenerative diseases. Mol. Syst. Biol. 10:743. doi: 10.15252/msb.20145304
Nevins, J. R. (2001). The Rb/E2F pathway and cancer. Hum. Mol. Genet. 10, 699–703. doi: 10.1093/hmg/10.7.699
Plun-Favreau, H., Lewis, P. A., Hardy, J., Martins, L. M., and Wood, N. W. (2010). Cancer and neurodegeneration: between the devil and the deep blue sea. PLoS Genet. 6:e1001257. doi: 10.1371/journal.pgen.1001257
Pounds, S., and Morris, S. W. (2003). Estimating the occurrence of false positives and false negatives in microarray studies by approximating and partitioning the empirical distribution of p-values. Bioinformatics 19, 1236–1242. doi: 10.1093/bioinformatics/btg148
Qi, G., Ogawa, I., Kudo, Y., Miyauchi, M., Siriwardena, B. S., Shimamoto, F., et al. (2007). Aurora-B expression and its correlation with cell proliferation and metastasis in oral cancer. Virchows Archiv. 450, 297–302. doi: 10.1007/s00428-006-0360-9
Qin, W., Liu, C., Sodhi, M., and Lu, H. (2016). Meta-analysis of sex differences in gene expression in schizophrenia. BMC Syst. Biol. 10:S9. doi: 10.1186/s12918-015-0250-3
Qin, W., and Lu, H. (2018). A novel joint analysis framework improves identification of differentially expressed genes in cross disease transcriptomic analysis. BioData Min. 11:3. doi: 10.1186/s13040-018-0163-y
Rahmatallah, Y., Emmert-Streib, F., and Glazko, G. (2015). Gene set analysis approaches for RNA-seq data: performance evaluation and application guideline. Brief. Bioinform. 17, 393–407. doi: 10.1093/bib/bbv069
Shen, K., and Tseng, G. C. (2010). Meta-analysis for pathway enrichment analysis when combining multiple genomic studies. Bioinformatics 26, 1316–1323. doi: 10.1093/bioinformatics/btq148
Subramanian, A., Kuehn, H., Gould, J., Tamayo, P., and Mesirov, J. P. (2007). GSEA-P: a desktop application for gene set enrichment analysis. Bioinformatics 23, 3251–3253. doi: 10.1093/bioinformatics/btm369
Subramanian, A., Tamayo, P., Mootha, V. K., Mukherjee, S., Ebert, B. L., Gillette, M. A., et al. (2005). Gene set enrichment analysis: a knowledge-based approach for interpreting genome-wide expression profiles. Proc. Natl. Acad. Sci. U.S.A. 102, 15545–15550. doi: 10.1073/pnas.0506580102
Tamayo, P., Steinhardt, G., Liberzon, A., and Mesirov, J. P. (2016). The limitations of simple gene set enrichment analysis assuming gene independence. Stat. Methods Med. Res. 25, 472–487. doi: 10.1177/0962280212460441
Tazawa, H., Tsuchiya, N., Izumiya, M., and Nakagama, H. (2007). Tumor-suppressive miR-34a induces senescence-like growth arrest through modulation of the E2F pathway in human colon cancer cells. Proc. Natl. Acad. Sci. U.S.A. 104, 15472–15477. doi: 10.1073/pnas.0707351104
Tomoiaga, A., Westfall, P., Donato, M., Draghici, S., Hassan, S., Romero, R., et al. (2016). Pathway crosstalk effects: shrinkage and disentanglement using a Bayesian hierarchical model. Stat. Biosci. 8, 374–394. doi: 10.1007/s12561-016-9160-1
Wang, T., Chen, M., and Zhao, H. (2016). Estimating DNA methylation levels by joint modeling of multiple methylation profiles from microarray data. Biometrics 72, 354–363. doi: 10.1111/biom.12422
Xie, X. P., Gan, B., Yang, W., and Wang, H. Q. (2017). ctPath: demixing pathway crosstalk effect from transcriptomics data for differential pathway identification. J. Biomed. Inform. 73, 104–114. doi: 10.1016/j.jbi.2017.07.019
Zajac-Kaye, M. (2001). Myc oncogene: a key component in cell cycle regulation and its implication for lung cancer. Lung Cancer 34, S43–S46. doi: 10.1016/S0169-5002(01)00343-9
Zhao, X. M., and Li, S. (2017). HISP: a hybrid intelligent approach for identifying directed signaling pathways. J. Mol. Cell Biol. 9, 453–462. doi: 10.1093/jmcb/mjx054
Zhao, X. M., Liu, K. Q., Zhu, G., He, F., Duval, B., Richer, J. M., et al. (2014). Identifying cancer-related microRNAs based on gene expression data. Bioinformatics 31, 1226–1234. doi: 10.1093/bioinformatics/btu811
Zheng, B., Liu, J., Gu, J., Du, J., Wang, L., Gu, S., et al. (2016). Classification of benign and malignant thyroid nodules using a combined clinical information and gene expression signatures. PLoS ONE 11:e0164570. doi: 10.1371/journal.pone.0164570
Keywords: public data integration, cross disease transcriptome, gene expression, gene set enrichment analysis, mixture model, EM algorithm
Citation: Qin W, Wang X, Zhao H and Lu H (2019) A Novel Joint Gene Set Analysis Framework Improves Identification of Enriched Pathways in Cross Disease Transcriptomic Analysis. Front. Genet. 10:293. doi: 10.3389/fgene.2019.00293
Received: 21 December 2018; Accepted: 19 March 2019;
Published: 12 April 2019.
Edited by:
Tao Huang, Shanghai Institutes for Biological Sciences (CAS), ChinaReviewed by:
Xingming Zhao, Tongji University, ChinaLong Lu, Cincinnati Children's Hospital Medical Center, United States
Copyright © 2019 Qin, Wang, Zhao and Lu. This is an open-access article distributed under the terms of the Creative Commons Attribution License (CC BY). The use, distribution or reproduction in other forums is permitted, provided the original author(s) and the copyright owner(s) are credited and that the original publication in this journal is cited, in accordance with accepted academic practice. No use, distribution or reproduction is permitted which does not comply with these terms.
*Correspondence: Hui Lu, huilu@sjtu.edu.cn