 Xu-tao Lin1,2†
 Qiu-ning Wu1,2†
 Si Qin2,3†
 De-jun Fan1,2
 Min-yi Lv2,4
 Xi Chen2,4Jia-wei Cai2,4
 Jing-rong Weng2,4
 Yi-feng Zou2,4
 Yu-ming Rong5*
 Feng Gao2,4*
- 1Department of Gastrointestinal Endoscopy, The Sixth Affiliated Hospital of Sun Yat-sen University, Guangzhou, China
- 2Guangdong Provincial Key Laboratory of Colorectal and Pelvic Floor Diseases, Guangdong Institute of Gastroenterology, The Sixth Affiliated Hospital of Sun Yat-sen University, Guangzhou, China
- 3Department of Medical Ultrasonics, The Sixth Affiliated Hospital of Sun Yat-sen University, Guangzhou, China
- 4Department of Colorectal Surgery, The Sixth Affiliated Hospital of Sun Yat-sen University, Guangzhou, China
- 5Department of VIP Region, Cancer Center of Sun Yat-sen University, Guangzhou, China
Purpose: A certain number of early-stage colorectal cancer (CRC) patients suffer tumor recurrence after initial curative resection. In this context, an effective prognostic biomarker model is constantly in need. Autophagy exhibits a dual role in tumorigenesis. Our study aims to develop an autophagy-related gene (ATG) signature-based on high-throughput data analysis for disease-free survival (DFS) prognosis of patients with stage I/II CRC.
Methods: Gene expression profiles and clinical information of CRC patients extracted from four public datasets were distributed to discovery and training cohort (GSE39582), validation cohort (TCGA CRC, n = 624), and meta-validation cohort (GSE37892 and GSE14333, n = 420). Autophagy genes significantly associated with prognosis were identified.
Results: Among 655 autophagy-related genes, a 10-gene ATG signature, which was significantly associated with DFS in the training cohort (HR, 2.76[1.56–4.82]; p = 2.06 × 10⁻⁴), was constructed. The ATG signature, stratifying patients into high and low autophagy risk groups, was validated in the validation (HR, 2.29[1.15–4.55]; p = 1.5 × 10⁻²) and meta-validation cohorts (HR, 2.5[1.03–6.06]; p = 3.63 × 10⁻²) and proved to be prognostic in a multivariate analysis. Functional analysis revealed enrichment of several immune/inflammatory pathways in the high autophagy risk group, where increased infiltration of T regulatory cells (Tregs) and decreased infiltration of M1 macrophages were observed.
Conclusion: Our study established a prognostic ATG signature that effectively predicted DFS for early-stage CRC patients. Meanwhile, the study also revealed the possible relationship among autophagy process, immune/inflammatory response, and tumorigenesis.
Introduction
CRC is currently the second leading cause of cancer deaths worldwide, ranking third in morbidity (Bray et al., 2018). Depending upon the tumor stage at diagnosis, relative 5-year survival rates for patients with CRC range from 65% for all stages to 91, 82, and 12% for patients diagnosed with stage I, II, and IV, respectively (Miller et al., 2019). Although increasing awareness of cancer screening and advances in technology have improved early detection (Dekker et al., 2019) and enabled treatments without chemotherapy, around one-third of patients with stages I-III CRC still encounter tumor relapse after so-called curative treatment (Van Der Stok et al., 2017). Therefore, it is particularly important to identify these high-risk patients with poor prognosis. The National Comprehensive Cancer Network (NCCN) suggested such clinicopathologic features as high-risk factors for stage II colorectal cancer, including tumor size, number of lymph nodes investigated, degree of differentiation, tumor perforation, bowel obstruction, and lymphovascular invasion. However, some studies have shown that these pathological features are inadequate to accurately identify such high-risk patients (O'Connor et al., 2011; Kannarkatt et al., 2017). Accordingly, there is a growing need for novel molecular markers for prognosis patterns, which might provide valuable information for supplementary adjuvant chemotherapy or other targeted therapy. Recently, the predictive potency of KRAS and BRAF mutations, microsatellite instability (MSI) status, and CpG island methylator phenotype (CIMP) status in CRC had been studied extensively. Kim et al. (Kim et al., 2019) investigated a novel prognostic predictor based on an 11-gene signature for identifying high-risk CRC and predicting patients who will have the worst response to adjuvant chemotherapy. However, more markers await to be discovered.
Autophagy plays a dual role in tumorigenesis (Rosich et al., 2013). It inhibits early tumor initiation by the clearance of damaged mitochondria, peroxisome, and other cytotoxic substance and also caters to the high metabolic demands from accelerated proliferating tumors by degrading intracellular organelle and macromolecule substances (Kongara and Karantza, 2012; Carroll and Martin, 2013). The autophagy process includes initiation of autophagy, biogenesis of the phagophore, expansion of the phagophore, formation of the autophagosome, fusion with the lysosome, and reformation of the lysosome (Zhi et al., 2018). A few gene mutations on the autophagy process reveal correlated with human cancer. PARK2 (Parkin), an autophagy-related gene participating in mitophagy and autophagy-independent functions that regulate the cell cycle, was identified as a potential tumor suppressor on chromosome 6q25-q26 which is frequently deleted in human cancers. Autophagy substrate p62 deficiency triggered by autophagy deficiency was found to suppress tumorigenesis in mouse liver. P62 regulates NRF2 and also mTOR and NFκB, all of which are important in cancer signaling (White et al., 2015). Recent studies have started working on autophagy-related gene model building in CRC (Huang et al., 2019; Zhou et al., 2019; Cheng et al., 2021; Zhao et al., 2021). Most of them constructed different autophagy gene signatures to monitor the CRC prognosis, regardless of tumor stages. However, early-stage CRC patients may need more accurate prognostic guidance, wondering about the need for additional chemotherapy. So, to further investigate how autophagy affects the prognosis of early-stage CRC patients, we identified an autophagy-related gene (ATG) signature from CRC-specific transcriptomes based on high-throughput data analysis. The ATG signature, which stratified the stage I/II CRC patients into distinct risk groups, together with functional analysis, might provide insights into the mechanism of CRC recurrence and targeted treatment.
Methods
Public Datasets
Gene expression data of CRC tissue samples and corresponding clinical information obtained from the public database were retrospectively analyzed. A total of 1,610 patient samples from four independent public cohorts were included. Three hundred nine patients without adjuvant chemotherapy but with survival information in the GSE39582 dataset (n = 566) served as the discovery cohort; stage I and II patients among these 309 patients were intended for training. The Cancer Genome Atlas (TCGA) CRC dataset (n = 624) was used for independent validation, while the GSE37892 and GSE14333 datasets (n = 420) were combined for meta-validation. All datasets are from Affymetrix Human Genome U133 Plus 2.0 Array. TCGA cohort data were downloaded from Broad GDAC Firehose before transcripts per million (TPM) of level 3 RNA-Seq data in the log2 scale were applied to calibrate the gene expression levels. Other datasets were obtained directly in their processed format from the Gene Expression Omnibus database (GEO) through the Bioconductor package “GEOquery.” The “combat” algorithm of the R package “sva” and the z-scores were used to correct the batch effects, so as to standardize microarray data across multiple experiments and compare them independent of the original hybridization intensities.
Construction of a Prognostic ATG Signature
The absolute median difference (MAD) was used to select the ATGs (Guinney et al., 2015). MAD is a robust statistic of statistical divergence that is more adaptable to outliers in a dataset than the standard deviation. To construct a prognostic ATG signature, we focused on 655 ATGs from eight gene sets identified via MSigDB (version 6.2) (Subramanian et al., 2005; Liberzon et al., 2011; Liberzon et al., 2015) with the keyword “autophagy.” Only 617 genes measured on all platforms involved in this study with high variation (MAD >0.5) were selected. After 1,000 times random Cox univariate regressions, genes with repeated significance, which indicated a strong relationship between ATGs and patients’ disease-free survival (DFS), were selected as candidates for the signature. A Cox proportional hazard regression model on CRC samples together with the least absolute shrinkage and selection operator (LASSO) was applied to minimize the risk of overfitting as well as to generate a risk model.
Patients were divided into low and high autophagy risk groups in accordance with the optimal ATG signature cutoff, which was defined by the time-dependent receiver operating characteristic (ROC) curve analysis at 5 years of DFS in the training cohort. The ATG signature score with the largest Youden’s index in the ROC curve was deemed as the cutoff value.
Validation of ATG Signature
Oncotype DX is a quantitative multi-gene, real-time polymerase chain reaction (RT-PCR) assay that measures gene expression in paraffin-embedded tumor tissues. The C-index was employed in the GSE39582 cohort, TCGA cohorts, and meta-validation cohorts respectively in comparison to Oncotype DX colon to assess the predictive capability of the model. For further validation, the prognostic value of the ATG signature was evaluated in CRC patients with early stages (stage I and II) and all stages in different cohorts through survival analysis. Univariate and multivariate analyses of the ATG signature and available clinical parameters were performed to assess whether the ATG signature is an independent risk factor. The independent risk factors identified by multivariate Cox regression analysis were applied to construct the nomogram for estimating the DFS of 5 years in CRC.
Functional Analysis
Enrichment of potential pathways of the ATG signature by gene ontology (GO) analysis was performed on gProfiler (https://biit.cs.ut.ee/gprofiler/), and gene set enrichment analysis (GSEA) (Newman et al., 2015) was conducted using the Bioconductor package “fgsea.” Gene sets of cancer hallmarks from MSigDB with statistical significance (FDR-adjusted p<0.05) were selected (Markle et al., 2010). CIBERSORT (Mokarram et al., 2017) was used to dissect immune cell infiltration in different risk groups.
Statistical Analysis
All statistical analyses were performed in R software (version 3.5.1). Categorical variables were reported as count. Continuous data were reported as mean with standard deviation (SD) and compared with the Student’s t-test. The LASSO regression was plotted using the “glmnet” R package (version: 2.0-16). Time-dependent ROC curve analysis was done by the R package “survivalROC” (version: 1.0.3). Survival analysis was conducted using the Kaplan–Meier method and compared with the log-rank test. Univariate and multivariate analyses of ATG signature and clinical parameters were performed using the log-rank test. The statistical significance level was set at α = 0.05, two-sided.
Results
ATG Signature Establishment
After filtration with MAD >0.5, 617 genes measured on all platforms were selected for this study. By 1,000 times random Cox univariate regressions, 58 ATGs were identified to be strongly relevant to DFS and considered as candidates for the signature (Figure 1). A LASSO Cox regression in stage I and II patients in the training cohort (Table 1) revealed 10 ATGs for the risk model (Figure 2), with the coefficient of each ATG listed in Table 2. The risk model was formulated as follows: autophagy-related risk score = 0.040346631 × exp CD163L1 + 0.040346631 × exp FAM13B + 0.160103165 × exp HDAC6 + 0.05063732× exp HPR − 0.012205947 × exp NR2C2 − 0.027104325 × exp RAB12 + 0.055095935 × exp SIRT2 − 0.084226324 × exp TBC1D14 − 0.012613054 × exp TLK2 − 0.001301898 × exp TBC1D12 (each gene represents its mRNA expression level).
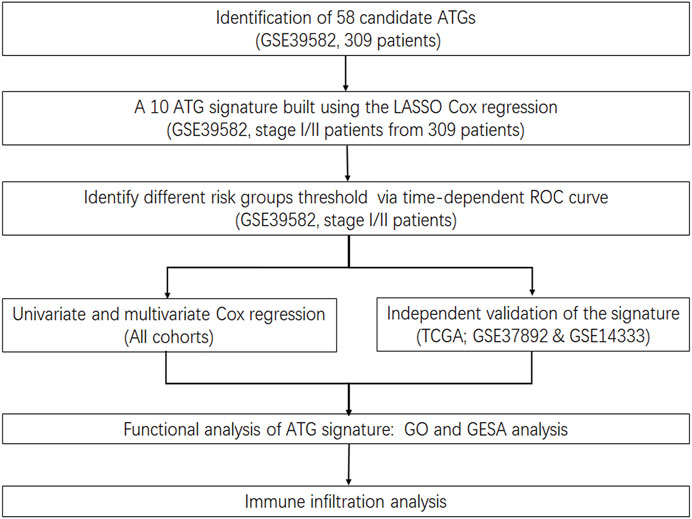
FIGURE 1. Flowchart.

TABLE 1. Characteristics of GSE39582, TCGA, and meta-validation cohorts.
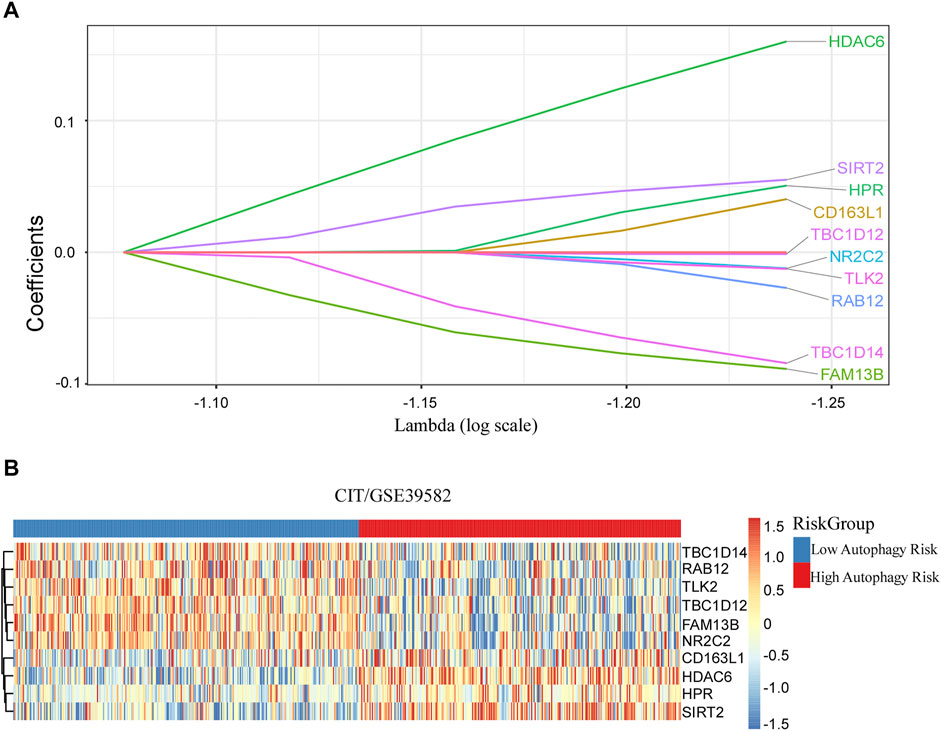
FIGURE 2. Discovered ATG signature for prognostic prediction of colorectal cancer. (A) Ten ATGs signatures were found from the LASSO Cox regression. (B) Heatmap of the identified 10-gene signature.
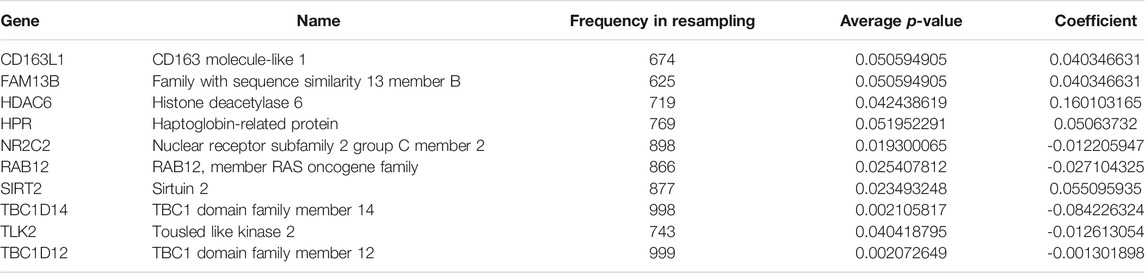
TABLE 2. Model information.
Based on the time-dependent ROC curve analysis of 5-year DFS in the training cohort, the optimal cutoff of ATG signature that divided the patients into high and low autophagy risk groups was −0.0087 (Figure 3). The risk scores of all patients are shown in Supplementary Table S1. Survival analysis showed that the DFS rate was higher in the low autophagy risk group compared to the high autophagy risk group for patients with early stages (stages I and II) in the training cohort (Figures 4A–C, HR, 2.76[1.56–4.82]; p = 2.06 × 10⁻⁴). So it was indicated for patients in all stages in the GSE39582 dataset (Figures 5A–C, HR, 1.7[1.25–2.31]; p = 5.21 × 10⁻⁴).
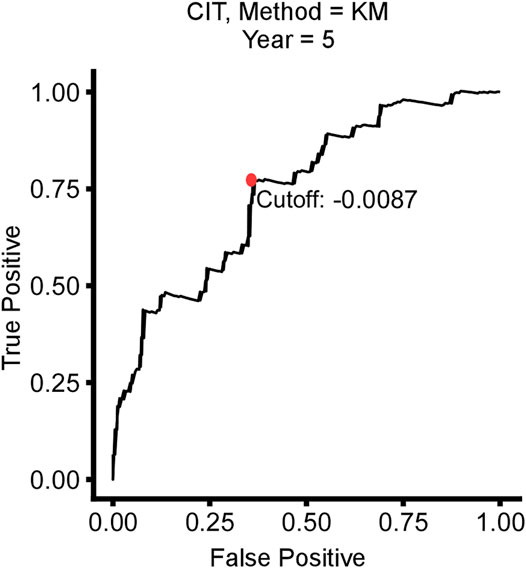
FIGURE 3. Time-dependent ROC curve for 5-year disease-free survival (DFS) in stage I/II CRC patients in the training cohort.
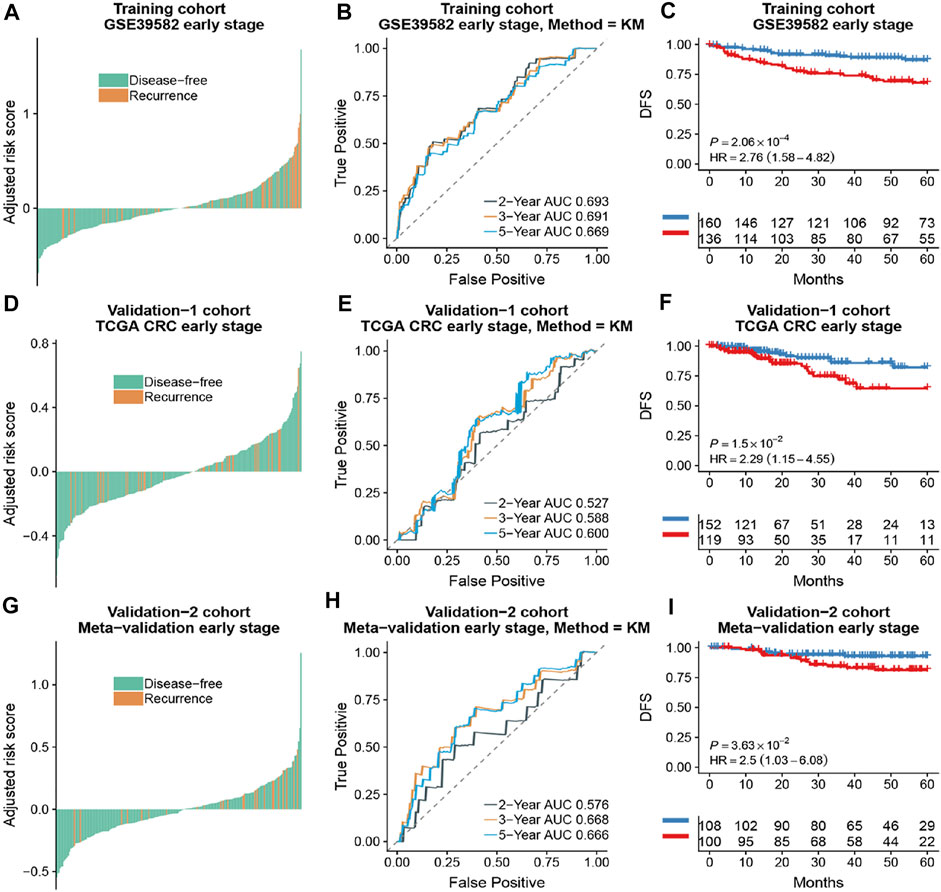
FIGURE 4. The association of the ATG signature with DFS in early-stage (stage I and II) patients with CRC. Patients with CRC of the early stage were ranked by autophagy risk scores in the training cohort (A), the TCGA cohort (D), and the meta-validation cohort (G). Time-dependent ROC curves for DFS in early stage (stage I and II) patients achieved with different durations in the training cohort (B), the TCGA cohort (E), and the meta-validation cohort (H). Kaplan–Meier curves showed DFS of early-stage patients in low and high autophagy groups in the training cohort (C), the TCGA cohort (F), and meta-validation cohort (I), respectively. p values comparing risk groups were calculated with the log-rank test. Hazard ratios (HRs) and 95% CIs are for low vs. high autophagy risk. CRC, colorectal cancer; ATG, autophagy-related gene; DFS, disease-free survival.
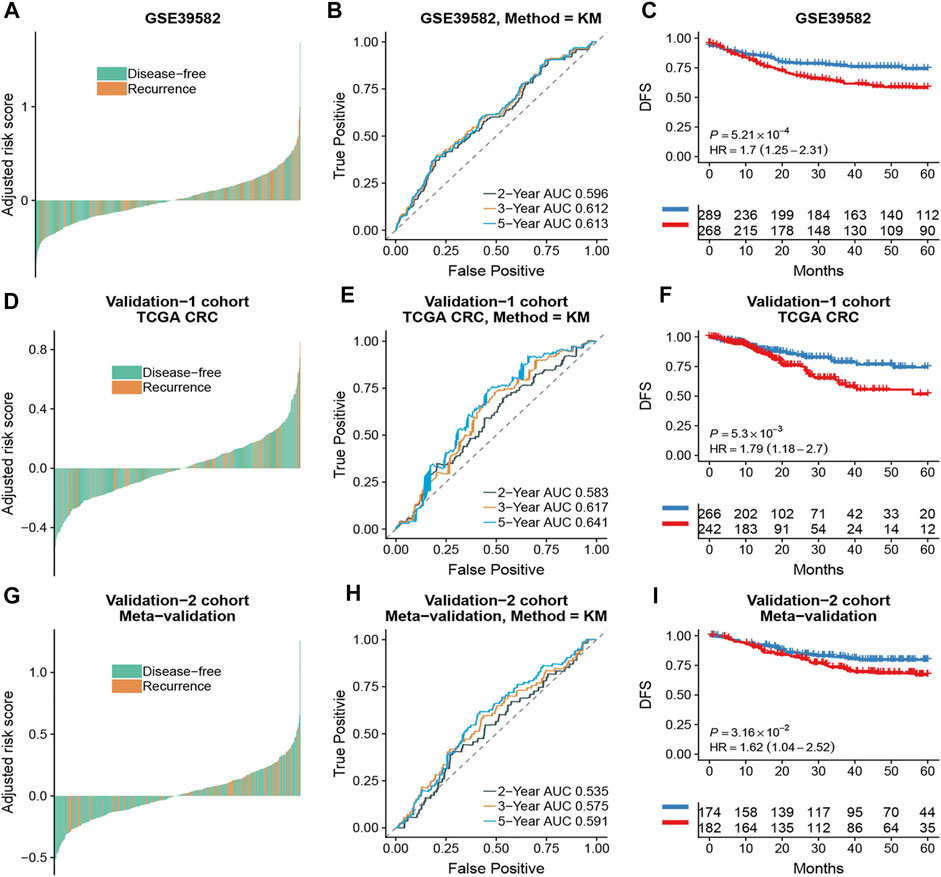
FIGURE 5. The association of the ATG signature with DFS in CRC patients with all stages. Patients with CRC of the early stage were ranked by autophagy risk scores in the GSE39582 cohort (A), the TCGA cohort (D), and the meta-validation cohort (G). Time-dependent ROC curves for DFS in CRC patients were achieved with different durations in the GSE39582 cohort (B), the TCGA cohort (E), and the meta-validation cohort (H). Kaplan–Meier curves showed DFS of CRC patients in low and high autophagy groups in the GSE39582 cohort (C), TCGA cohort (F), and meta-validation cohort (I), respectively. p values comparing risk groups were calculated with the log-rank test. Hazard ratios (HRs) and 95% CIs are for low vs. high autophagy risk. CRC, colorectal cancer; ATG, autophagy-related gene; DFS, disease-free survival.
Validation of the ATG Signature
To assess the predictive capability of the risk model, the C-index was first applied to various cohorts which turned out to be 0.74 (95% CI, 0.63–0.85) in the GSE39582 cohort, 0.70 (95% CI, 0.54–0.85) in the TCGA cohort, and 0.70 (95% CI, 0.51–0.89) in the meta-validation cohort (Table 3), higher than those of Oncotype DX colon. We employed the same formula to the independent validation cohort (TCGA) and the meta-validation cohort (GSE37892 and GSE14333). Patients were significantly stratified into different risk groups by the ATG signature considering DFS. For early stages, CRC patients in the high autophagy risk group displayed poorer DFS in both the independent validation cohort (Figures 4D–F, HR, 2.29[1.15–4.55]; p = 1.5 × 10⁻²) and the meta-validation cohort (Figures 4G–I, HR, 2.5[1.03–6.06]; p = 3.63 × 10⁻²). So it was indicated for patients with all stages in both the independent validation (Figures 5D–F, HR, 1.79[1.16–2.7]; p = 5.3 × 10⁻³) and meta-validation cohorts (Figures 5G–I, HR, 1.64[1.04–2.52]; p = 3.16 × 10⁻²). Besides, the univariate and multivariate analyses further proved ATG as an independent prognostic factor after adjusting for clinical parameters such as sex and tumor stage (Table 4). Nomogram is displayed in Supplementary Figure S1.
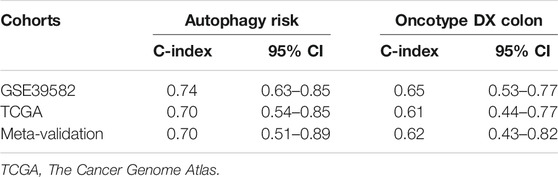
TABLE 3. C-index for autophagy risk compared with Oncotype DX colon in three cohorts.
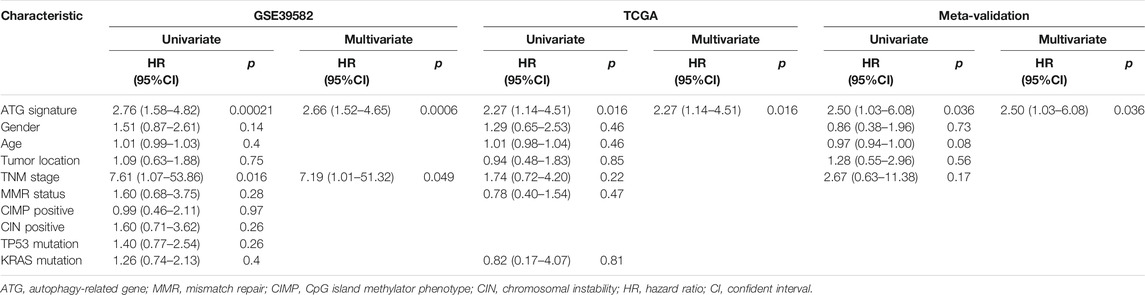
TABLE 4. Univariate and multivariate analyses of ATG signature and clinical and pathologic factors in validation cohorts.
Functional Analysis of the ATG Signature
GO analysis and GSEA were carried out to explore the biological function and signaling pathways of genes from the ATG signature. GO analysis revealed that the genes within the ATG signature were mostly involved in the regulation of autophagy and catabolic processes (Figure 6A; Supplement Table S2). GSEA was performed between different risk groups to further investigate the pathways that were significantly affected. We found a significant enrichment in multiple immune/inflammatory pathways in the high autophagy risk group, including the IL6/JAK/STAT3 signaling pathway, the IL2/STAT5 pathway, the IFN-α pathway, the IFN-γ pathway, and the inflammatory response pathway (Figure 6B, p value < 0.005). Some cell cycle/metabolism-associated pathways, including G2-M, oxidative phosphorylation, E2F, and MYC, were also significantly enriched in the high autophagy risk group, in addition to a few classic pathways like mTORC1 and epithelial–mesenchymal transmission (EMT; p value < 0.005).
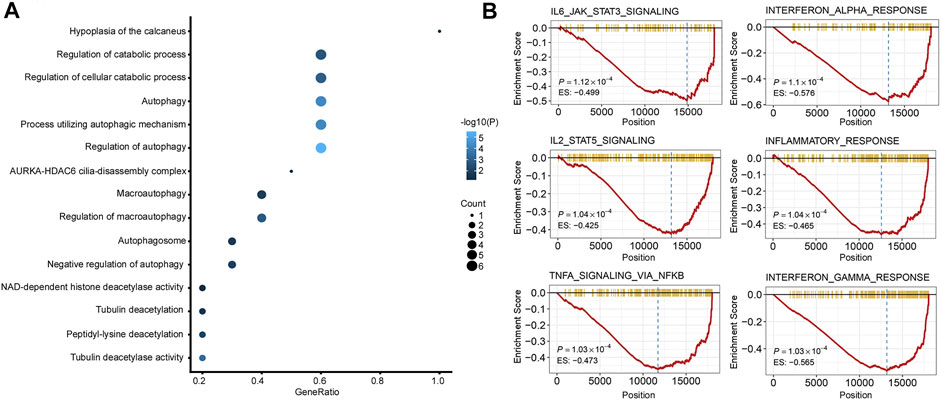
FIGURE 6. Functional analysis of the 10 autophagy signature genes. (A). Gene ontology (GO) of the 10 autophagy signature genes. (B). GSEA showed some immune/inflammatory pathways downregulated in high autophagy risk patients.
As there was a significant enrichment in the immune/inflammatory pathway through GSEA analysis, we conducted immune infiltration analysis. The ESTIMATE algorithm displayed significant differences in the immune score (p = 0.02) and ESTIMATE score (p = 0.027) between the high and low autophagy risk groups in the TCGA CRC cohort (Figure 7A). Infiltration of plasma cells and Tregs was enriched significantly in the high autophagy risk group compared with the low autophagy risk group in the GSE39582 and TCGA cohorts (Figure 7B–C). By contrast, M1 macrophage infiltration turned out to be significantly lower in the high autophagy risk group (Figure 7B–C). Similar results are shown in Supplementary Figure S2.
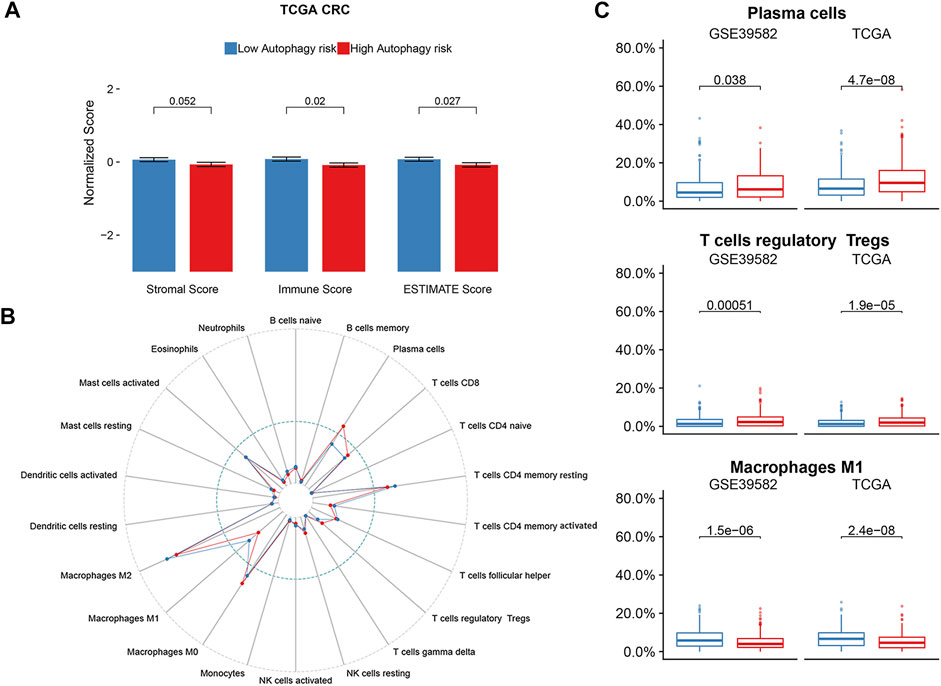
FIGURE 7. Immune infiltration status of ATG signature risk groups. (A) ESTIMATE algorithm in the TCGA cohort. (B) Twenty-two immune cells abundance for different immune risk groups. (C) Plasma cells and T cells regulatory were enriched in the high-risk group. The macrophage M1 was enriched in the low-risk group. p-values are based on the Wilcoxon test. Hazard ratios (HRs) and 95% CIs are for low vs. high autophagy risk. CRC, colorectal cancer; DFS, disease-free survival.
Adjuvant Chemotherapy Effects on Different Autophagy Risk Groups
Survival analysis conducted for different autophagy risk groups with and without adjuvant chemotherapy respectively showed that for early-stage CRC patients without adjuvant chemotherapy in the high autophagy risk group displayed poorer DFS in the GSE39582 cohort (Figures 8A, HR, 5[2.38–10.5]; p = 2.42 × 10⁻⁶). However, DFS showed no significant difference between high and low autophagy risk groups for early CRC patients with adjuvant chemotherapy (Figure 8B, p = 4.46 × 10⁻¹). Similar results were observed in the TCGA cohort (Figure 8C, HR, 2.05[0.9–4.67]; p = 8.22 × 10⁻² and Figure 8D, p = 5.84 × 10⁻¹). In addition, according to the cutoff values, we divided 48 kinds of cell lines related to colorectal cancer into high and low autophagy risk groups to test the effects of different chemotherapy drugs on cell lines and found that the half-maximal inhibitory concentrations (IC-50) of oxaliplatin, fluorouracil, and irinotecan were lower in the low autophagy risk group (Figures 9A–C). These results indicate that the model can be used to predict the drug sensitivity of cell lines to chemotherapeutic drugs under different autophagy risk groups.
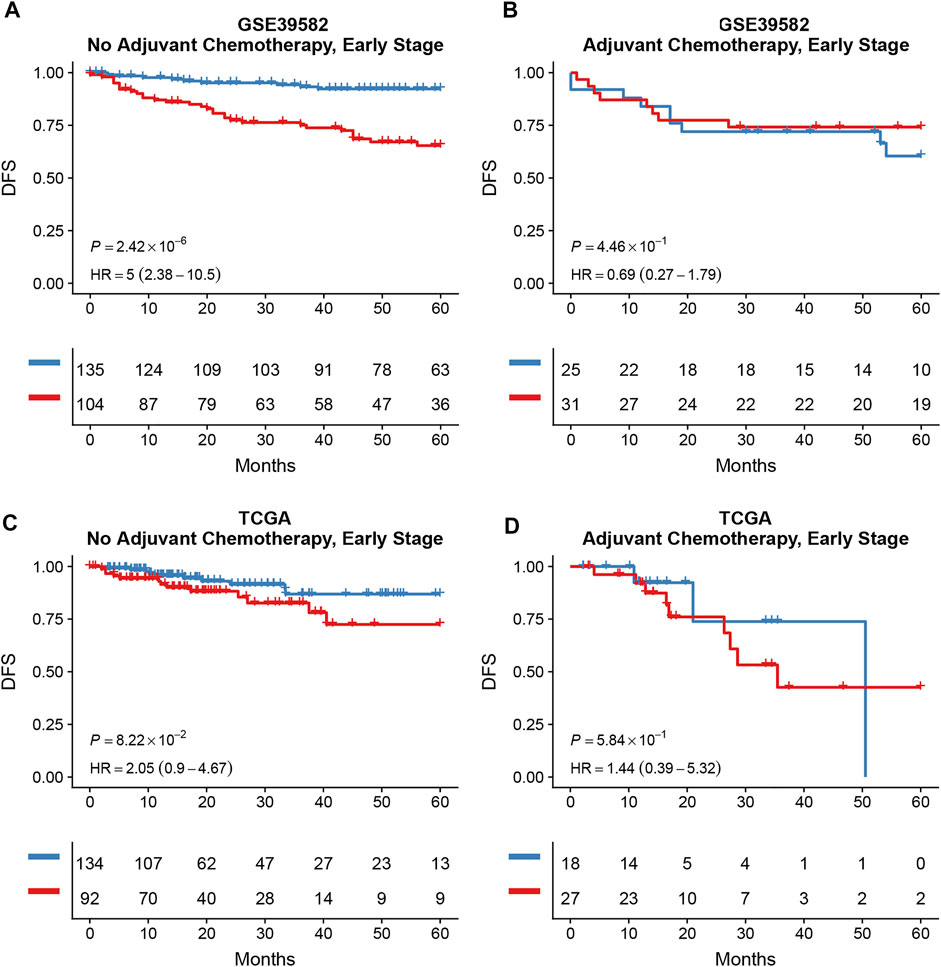
FIGURE 8. Effects of adjuvant chemotherapy on DFS between different autophagy risk groups in early stage (stage I and II) patients with CRC. Kaplan–Meier curves showed DFS of early-stage patients between low and high autophagy groups with and without adjuvant chemotherapy respectively in the GSE39582 (A,B) cohort and the TCGA cohort (C,D). p values comparing risk groups were calculated with the log-rank test.
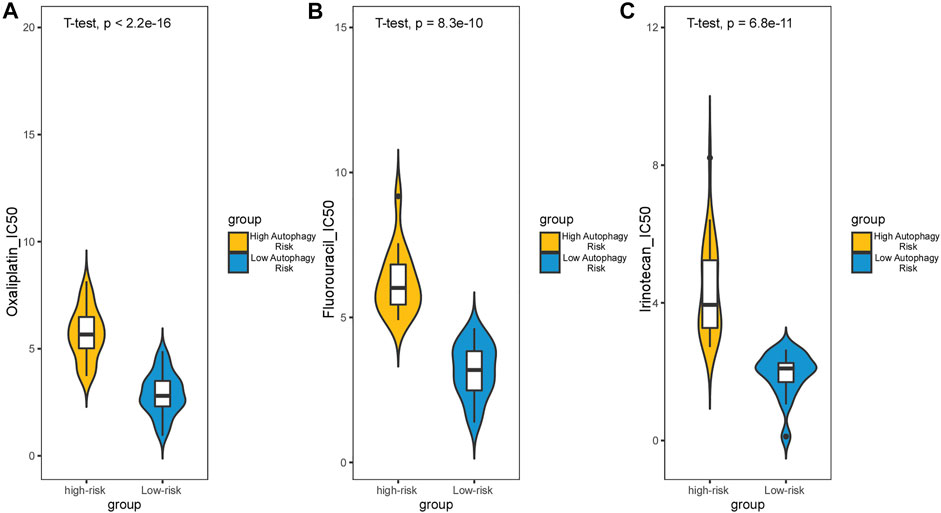
FIGURE 9. Effect of chemotherapy drugs on colorectal cancer cell lines from different autophagy risk groups. IC-50 of oxaliplatin (A), fluorouracil (B), and irinotecan (C) were lower in the low autophagy risk group. p values were calculated by T-test.
Discussion
Thanks to the improved awareness of cancer screening, CRC is now detected at an early stage, resulting in a better rate of survival. Surgery without chemotherapy, which was deemed as the curative treatment, was carried out on the majority of patients with stage I/II colon cancer and in some cases of stage I/II rectal cancer (Miller et al., 2019). Indeed, it enabled prevention from unnecessary side effects of chemotherapy. Nevertheless, more than 20% of patients with stage I/II CRC who underwent surgical resection still suffered recurrence (Markle et al., 2010). Quite a few multigene prognostic signatures have been developed for CRC, but none of them graduated to the widespread application due to the uncertainty of prognostic accuracy. Accordingly, an effective prognostic model composed of multiple biomarkers to distinguish early-stage patients with a high risk of recurrence is crucial and necessary for elective adjuvant chemotherapy or other targeted treatments.
Emerging studies have revealed that autophagy functions diversely in the development, maintenance, and progression of tumors. While autophagy may prevent cellular cancerous transformation in normal tissue, it acts as a survival mechanism in established tumors, especially under stress conditions and in response to chemotherapy (Mokarram et al., 2017). Several autophagy inhibitors and activators have been brought up as improved chemotherapeutic options for cancer treatment (Koustas et al., 2019), but without sufficient clinically significant results, especially in CRC. Accordingly, further investigation on the biological mechanism of autophagy in the tumor microenvironment deserves attention, and more targets associated with autophagy await to be found.
In our study, we developed a prognostic model comprised of 10 ATGs for stage I/II CRC. This ATG signature, which classified patients into high and low autophagy risk groups, demonstrated a significant difference in 5-year DFS. The C-index of the ATG signature exhibited a good clinical predicting fitness superior to the Oncotype DX colon. Validation results suggested that the ATG signature could successfully predict DFS for stage I/II CRC patients after treatment. This novel model enabled us to identify CRC patients with high autophagy risk which stood for increased risk of tumor recurrence. Surprisingly, despite the original intention for DFS prediction of early-stage CRC patients, the ATG signature also showed a significant effect in the prediction for all stages. Therefore, this model could be applied to predict tumor recurrence in all CRC patients regardless of tumor stage.
As we looked over the genes within the ATG signature, some of them have been found correlated with CRC but mostly bear context-dependent biological functions in cancers, similar to autophagy. For example, the cytosolic histone deacetylase 6 (HDAC6) served as a tumor suppressor in hepatocellular carcinogenesis (Yang et al., 2019), while another study revealed that the HDAC6 inhibitor significantly suppressed the proliferation and viability and induced apoptosis in CRC cells, where autophagy activation was observed (Chen et al., 2019). Elevated Sirtuin 2 (SIRT2) was found to be associated with poor prognosis in CRC patients via its participation in tumor angiogenesis (Hu et al., 2019). Meanwhile, in a separate study SIRT2 was found to be downregulated in colon cancer biopsies compared to adjacent noncancerous tissues, and overexpression of SIRT2 inhibited the proliferation and metastatic progression of SW480 cells (Zhang et al., 2017). In terms of autophagy-related functions, a previous investigation reported that in response to oxidative stress or serum starvation, SIRT2 dissociated as acetylated FOXO1, which later bound to autophagy protein 7 (ATG7) and induced autophagy in tumors (Zhao et al., 2010). As these inconsistencies make it difficult to clarify the role of autophagy in CRC, we further investigated the biological functions of the ATG signature, expecting to find some clues in the autophagy-related functions in tumors.
GSEA revealed that the ATG signature included genes that were robustly involved in multiple immune/inflammatory pathways including IL6/JAK/STAT3, IL2/STAT5, IFN-α, IFN-γ, and TNF-α/NF-κB, and the inflammatory response presented a particular relation to CRC proliferation or prognosis as previous studies revealed (Nichols et al., 1994; Eguchi et al., 2003; De Simone et al., 2015; Park et al., 2017; Giordano et al., 2019). As our findings suggested that a high autophagy risk score correlated with the downregulation of these immune/inflammatory pathways, we speculated that autophagy might play a role in CRC tumorigenesis and tumor proliferation via an anti-immune/anti-inflammatory response. Moreover, increased infiltration of Tregs and decreased infiltration of M1 macrophages observed in the high autophagy risk group during immune infiltration analysis seemingly catered to the anti-immune/anti-inflammatory response. Tregs are known to suppress both antibody-mediated and cell-mediated immune responses (Wing and Sakaguchi, 2010). The pro-inflammatory M1 macrophages, a phenotype of tumor-associated macrophages (TAMs), correlated with a better prognosis in CRC patients for its tumor-suppressing function (Edin et al., 2012; Shapouri-Moghaddam et al., 2018). By triggering an anti-immune or anti-inflammatory response, autophagy might promote polarization or re-polarization toward the M2 phenotype spontaneously and thus lead to the decrease of M1 infiltration observed. Previous studies have described the link between autophagy and macrophage polarization in the tumor microenvironment. For example, mTOR which functions as a conserved kinase protein in the regulation of autophagy also participates in the polarization of monocytes into TAMs (Chen et al., 2014). More new strategies targeting TAM polarization as well as autophagy await exploration, and further studies are needed to clarify the above speculations.
Upon the prognostic prediction, clinicians could thus make an informed decision regarding supplementary treatment regimens. For example, we can selectively apply more aggressive chemotherapy strategies to early CRC patients of high autophagy risk groups. As our statistics suggest, DFS showed no significant difference between high and low autophagy risk groups for early CRC patients with adjuvant chemotherapy. However, the predicted results of the IC-50 of the colorectal cancer-associated cell lines showed a higher sensitivity to chemotherapy in the low autophagy risk group. This may be due to the limitations of retrospective studies, in which clinicians choose chemotherapy based on the patient’s condition rather than random assignment. Cell experiments can reduce heterogeneity. It is hard to state whether those antitumor agents of chemotherapy are inhibiting autophagy or not. However, combined with our findings that a high autophagy risk score correlated with the downregulation of these immune/inflammatory pathways, chemotherapy may prevent tumor proliferation or recurrence by triggering specific immune/inflammatory responses or modifying the tumor microenvironment through TAMs. Besides, it is possible that chemotherapy just reduces the impact of autophagy on tumor relapse through massive, indiscriminate cell killing, and immunosuppression. Possible mechanisms will be explored in the further basic experiment and prospective clinical studies.
However, our prognostic ATG signature relies on the gene expression profiles from microarray platforms, which makes it too expensive and time-consuming to popularize in clinical application. In addition to the dataset limitations from retrospective studies, further prospective clinical tests are recommended to validate our results. Despite the limitations, our research proposes a novel perspective to predicting the prognosis of early CRC patients and offers valuable insights into the relationship between autophagy, immune/inflammatory response, and tumorigenesis.
In conclusion, our study established a prognostic ATG signature that can effectively predict DFS for early-stage CRC patients. Meanwhile, our study also revealed the possibility that CRC patients in the high autophagy risk group might suffer tumor relapse via anti-immune/anti-inflammatory response. Moreover, higher sensitivity to chemotherapy in the low autophagy risk group was discovered in colorectal cancer-associated cell lines.
Data Availability Statement
The original contributions presented in the study are included in the article/Supplementary Material, further inquiries can be directed to the corresponding authors.
Ethics Statement
Ethical review and approval was not required for the study on human participants in accordance with the local legislation and institutional requirements. Written informed consent for participation was not required for this study in accordance with the national legislation and the institutional requirements.
Author Contributions
FG, Y-mR, and X-tL contributed conception and design of the study; X-tL, SQ, and D-jF collected the datasets; X-tL, SQ, M-yL, and XC performed the statistical analysis; X-tL, Q-nW, D-jF, M-yL, J-wC, J-rW, and Y-fZ participated in the data interpretation; Q-nW wrote the first draft of the manuscript; SQ and D-jF wrote sections of the manuscript. All authors contributed to manuscript revision, read and approved the submitted version.
Funding
This work was supported by National Key Clinical Discipline; and “5010 Clinical Research Program” of Sun Yat-sen University (grant number 2010012); and Natural Science Foundation of Guangdong Province, China (grant number 2020A1515010428); and Medical Science Research Grant from the Health Department of Guangdong Province (grant number A2018007).
Conflict of Interest
The authors declare that the research was conducted in the absence of any commercial or financial relationships that could be construed as a potential conflict of interest.
Publisher’s Note
All claims expressed in this article are solely those of the authors and do not necessarily represent those of their affiliated organizations, or those of the publisher, the editors and the reviewers. Any product that may be evaluated in this article, or claim that may be made by its manufacturer, is not guaranteed or endorsed by the publisher.
Acknowledgments
The authors would like to thank Yidu Cloud Technology Co., Ltd., for the assistance in the data processing.
Supplementary Material
The Supplementary Material for this article can be found online at: https://www.frontiersin.org/articles/10.3389/fgene.2021.755789/full#supplementary-material
References
Bray, F., Ferlay, J., Soerjomataram, I., Siegel, R. L., Torre, L. A., and Jemal, A. (2018). Global Cancer Statistics 2018: Globocan Estimates of Incidence and Mortality Worldwide for 36 Cancers in 185 Countries. CA: A Cancer J. Clinicians 68 (6), 394–424. doi:10.3322/caac.21492
Carroll, R. G., and Martin, S. J. (2013). Autophagy in Multiple Myeloma: what Makes You Stronger Can Also Kill You. Cancer Cell 23 (4), 425–426. doi:10.1016/j.ccr.2013.04.001
Chen, M., Lin, Y., Liao, Y., Liou, J., and Chen, C. (2019). MPT0G612, a Novel HDAC6 Inhibitor, Induces Apoptosis and Suppresses IFN-γ-Induced Programmed Death-Ligand 1 in Human Colorectal Carcinoma Cells. CANCERS 11 (161710), 1617. doi:10.3390/cancers11101617
Chen, P., Cescon, M., and Bonaldo, P. (2014). Autophagy-mediated Regulation of Macrophages and its Applications for Cancer. Autophagy 10 (2), 192–200. [Journal Article; Research Support, Non-U.S. Gov't; Review]. doi:10.4161/auto.26927
Cheng, L., Han, T., Zhang, Z., Yi, P., Zhang, C., Zhang, S., et al. (2021). Identification and Validation of Six Autophagy-Related Long Non-coding RNAs as Prognostic Signature in Colorectal Cancer. Int. J. Med. Sci. 18 (1), 88–98. doi:10.7150/ijms.49449
De Simone, V., Franzè, E., Ronchetti, G., Colantoni, A., Fantini, M. C., Di Fusco, D., et al. (2015). Th17-type Cytokines, IL-6 and TNF-α Synergistically Activate STAT3 and NF-kB to Promote Colorectal Cancer Cell Growth. Oncogene 34 (27), 3493–3503. doi:10.1038/onc.2014.286
Dekker, E., Tanis, P. J., Vleugels, J. L. A., Kasi, P. M., and Wallace, M. B. (2019). Colorectal Cancer. The Lancet 394 (10207), 1467–1480. doi:10.1016/S0140-6736(19)32319-0
Edin, S., Wikberg, M. L., Dahlin, A. M., Rutegård, J., Öberg, Å., Oldenborg, P.-A., et al. (2012). The Distribution of Macrophages with a M1 or M2 Phenotype in Relation to Prognosis and the Molecular Characteristics of Colorectal Cancer. PLoS One 7 (10), e47045. doi:10.1371/journal.pone.0047045
Eguchi, J.-i., Hiroishi, K., Ishii, S., and Mitamura, K. (2003). Interferon-α and Interleukin-12 Gene Therapy of Cancer: Interferon-α Induces Tumor-specific Immune Responses while Interleukin-12 Stimulates Non-specific Killing. Cancer Immunol. Immunother. 52 (6), 378–386. doi:10.1007/s00262-002-0367-2
Giordano, G., Parcesepe, P., D’Andrea, M. R., Coppola, L., Di Raimo, T., Remo, A., et al. (2019). Jak/stat5-mediated Subtype-specific Lymphocyte Antigen 6 Complex, Locus G6d (Ly6g6d) Expression Drives Mismatch Repair Proficient Colorectal Cancer. J. Exp. Clin. Cancer Res. 38 (1). doi:10.1186/s13046-018-1019-5
Guinney, J., Dienstmann, R., Wang, X., de Reyniès, A., Schlicker, A., and Soneson, C. (2015). The Consensus Molecular Subtypes of Colorectal Cancer. Nat. Med. 21 (11), 1350–1356. [Journal Article; Research Support, N.I.H., Extramural; Research Support, Non-U.S. Gov't]. doi:10.1038/nm.3967
Hu, F., Sun, X., Li, G., Wu, Q., Chen, Y., Yang, X., et al. (2019). Inhibition of Sirt2 Limits Tumour Angiogenesis via Inactivation of the Stat3/vegfa Signalling Pathway. Cel Death Dis. 10 (1), 9. doi:10.1038/s41419-018-1260-z
Huang, Z., Liu, J., Luo, L., Sheng, P., Wang, B., Zhang, J., et al. (2019). Genome-wide Identification of a Novel Autophagy-Related Signature for Colorectal Cancer. [Journal Article]. Dose Response 17 (4), 711624285. doi:10.1177/1559325819894179
Kannarkatt, J., Joseph, J., Kurniali, P. C., Al-Janadi, A., and Hrinczenko, B. (2017). Adjuvant Chemotherapy for Stage Ii colon Cancer: a Clinical Dilemma. [Journal Article; Review]. J. Oncol. Pract. 13 (4), 233–241. doi:10.1200/JOP.2016.017210
Kim, S. K., Kim, S. Y., Kim, C. W., Roh, S. A., Ha, Y. J., Lee, J. L., et al. (2019). A Prognostic index Based on an Eleven Gene Signature to Predict Systemic Recurrences in Colorectal Cancer. [Journal Article; Research Support, Non-U.S. Gov't]. Exp. Mol. Med. 51 (10), 1–12. doi:10.1038/s12276-019-0319-y
Kongara, S., and Karantza, V. (2012). The Interplay between Autophagy and Ros in Tumorigenesis. [Journal Article]Frontiers Oncol. 2, 171. doi:10.3389/fonc.2012.00171
Koustas, E., Sarantis, P., Kyriakopoulou, G., Papavassiliou, A. G., and Karamouzis, M. V. (2019). The Interplay of Autophagy and Tumor Microenvironment in Colorectal Cancer—Ways of Enhancing Immunotherapy Action. Cancers 11 (4), 533. doi:10.3390/cancers11040533
Liberzon, A., Birger, C., Thorvaldsdóttir, H., Ghandi, M., Mesirov, J., and Tamayo, P. (2015). The Molecular Signatures Database Hallmark Gene Set Collection. Cel Syst. 1 (6), 417–425. doi:10.1016/j.cels.2015.12.004
Liberzon, A., Subramanian, A., Pinchback, R., Thorvaldsdottir, H., Tamayo, P., and Mesirov, J. P. (2011). Molecular Signatures Database (Msigdb) 3.0. Bioinformatics 27 (12), 1739–1740. doi:10.1093/bioinformatics/btr260
Markle, B., May, E. J., and Majumdar, A. P. N. (2010). Do nutraceutics Play a Role in the Prevention and Treatment of Colorectal Cancer? Cancer Metast. Rev. 29 (3), 395–404. doi:10.1007/s10555-010-9234-3
Miller, K. D., Nogueira, L., Mariotto, A. B., Rowland, J. H., Yabroff, K. R., Alfano, C. M., et al. (2019). Cancer Treatment and Survivorship Statistics, 2019. CAA Cancer J. Clinicians 69 (5), 363–385. doi:10.3322/caac.21565
Mokarram, P., Albokashy, M., Zarghooni, M., Moosavi, M. A., Sepehri, Z., Chen, Q. M., et al. (2017). New Frontiers in the Treatment of Colorectal Cancer: Autophagy and the Unfolded Protein Response as Promising Targets. Autophagy 13 (5), 781–819. doi:10.1080/15548627.2017.1290751
Newman, A. M., Liu, C. L., Green, M. R., Gentles, A. J., Feng, W., Xu, Y., et al. (2015). Robust Enumeration of Cell Subsets from Tissue Expression Profiles. Nat. Methods 12 (5), 453–457. doi:10.1038/nmeth.3337
Nichols, P. H., Ward, U., Ramsden, C. W., and Primrose, J. N. (1994). The Effect of 5-fluorouracil and Alpha Interferon and 5-fluorouracil and Leucovorin on Cellular Anti-tumour Immune Responses in Patients with Advanced Colorectal Cancer. Br. J. Cancer 70 (5), 946–949. doi:10.1038/bjc.1994.426
O'Connor, E. S., Greenblatt, D. Y., LoConte, N. K., Gangnon, R. E., Liou, J. I., Heise, C. P., et al. (2011). Adjuvant Chemotherapy for Stage Ii colon Cancer with Poor Prognostic Features. J. Clin. Oncol. 29 (25), 3381–3388. Journal Article; Research Support, N.I.H., Extramural; Research Support, Non-U.S. Gov't]. doi:10.1200/JCO.2010.34.3426
Park, J. H., Van Wyk, H., McMillan, D. C., Quinn, J., Clark, J., Roxburgh, C. S. D., et al. (2017). Signal Transduction and Activator of Transcription-3 (Stat3) in Patients with Colorectal Cancer: Associations with the Phenotypic Features of the Tumor and Host. Clin. Cancer Res. 23 (7), 1698–1709. doi:10.1158/1078-0432.CCR-16-1416
Rosich, L., Colomer, D., and Roué, G. (2013). Autophagy Controls Everolimus (Rad001) Activity in Mantle Cell Lymphoma. Autophagy 9 (1), 115–117. doi:10.4161/auto.22483
Shapouri-Moghaddam, A., Mohammadian, S., Vazini, H., Taghadosi, M., Esmaeili, S. A., Mardani, F., et al. (2018). Macrophage Plasticity, Polarization, and Function in Health and Disease. [Journal Article; Review]. J. Cel. Physiol. 233 (9), 6425–6440. doi:10.1002/jcp.26429
Subramanian, A., Tamayo, P., Mootha, V. K., Mukherjee, S., Ebert, B. L., Gillette, M. A., et al. (2005). Gene Set Enrichment Analysis: a Knowledge-Based Approach for Interpreting Genome-wide Expression Profiles. P. Natl. Acad. Sci. Usa. 102 (43), 15545–15550. doi:10.1073/pnas.0506580102
Van Der Stok, E. P., Spaander, M. C. W., Grünhagen, D. J., Verhoef, C., and Kuipers, E. J. (2017). Surveillance after Curative Treatment for Colorectal Cancer. Nat. Rev. Clin. Oncol. 14 (5), 297–315. doi:10.1038/nrclinonc.2016.199
White, E., Mehnert, J. M., and Chan, C. S. (2015). Autophagy, Metabolism, and Cancer. Clin. Cancer Res. 21 (22), 5037–5046. [Journal Article; Research Support, N.I.H., Extramural; Research Support, Non-U.S. Gov't; Review]. doi:10.1158/1078-0432.CCR-15-0490
Wing, K., and Sakaguchi, S. (2010). Regulatory T Cells Exert Checks and Balances on Self Tolerance and Autoimmunity. Nat. Immunol. 11 (1), 7–13. doi:10.1038/ni.1818
Yang, H. D., Kim, H. S., Kim, S. Y., Na, M. J., Yang, G., Eun, J. W., et al. (2019). Hdac6 Suppresses Let-7i-5p to Elicit Tsp1/cd47-Mediated Anti-tumorigenesis and Phagocytosis of Hepatocellular Carcinoma. Hepatology 70 (4), 1262–1279. doi:10.1002/hep.30657
Zhang, L. L., Zhan, L., Jin, Y. D., Min, Z. L., Wei, C., Wang, Q., et al. (2017). Sirt2 Mediated Antitumor Effects of Shikonin on Metastatic Colorectal Cancer. Eur. J. Pharmacol. 797, 1–8. doi:10.1016/j.ejphar.2017.01.008
Zhao, H., Huang, C., Luo, Y., Yao, X., Hu, Y., Wang, M., et al. (2021). A Correlation Study of Prognostic Risk Prediction for Colorectal Cancer Based on Autophagy Signature Genes. [Journal Article]. Front. Oncol. 11, 595099. doi:10.3389/fonc.2021.595099
Zhao, Y., Yang, J., Liao, W., Liu, X., Zhang, H., Wang, S., et al. (2010). Cytosolic Foxo1 Is Essential for the Induction of Autophagy and Tumour Suppressor Activity. Nat. Cel Biol. 12 (7), 665–675. doi:10.1038/ncb2069
Zhi, X., Feng, W., Rong, Y., and Liu, R. (2018). Anatomy of Autophagy: from the Beginning to the End. Cell. Mol. Life Sci. 75 (5), 815–831. [Journal Article; Research Support, Non-U.S. Gov't; Review]. doi:10.1007/s00018-017-2657-z
Keywords: colorectal cancer, prognosis, early stage, disease-free survival, autophagy-related gene
Citation: Lin X-t, Wu Q-n, Qin S, Fan D-j, Lv M-y, Chen X, Cai J-w, Weng J-r, Zou Y-f, Rong Y-m and Gao F (2021) Identification of an Autophagy-Related Gene Signature for the Prediction of Prognosis in Early-Stage Colorectal Cancer. Front. Genet. 12:755789. doi: 10.3389/fgene.2021.755789
Received: 09 August 2021; Accepted: 19 October 2021;
Published: 25 November 2021.
Edited by:
Guangchuang Yu, Southern Medical University, ChinaReviewed by:
Dongguo Li, Capital Medical University, ChinaSaifur Rahaman, City University of Hong Kong, Hong Kong SAR, China
Huaichao Luo, Sichuan Cancer Hospital, China
Copyright © 2021 Lin, Wu, Qin, Fan, Lv, Chen, Cai, Weng, Zou, Rong and Gao. This is an open-access article distributed under the terms of the Creative Commons Attribution License (CC BY). The use, distribution or reproduction in other forums is permitted, provided the original author(s) and the copyright owner(s) are credited and that the original publication in this journal is cited, in accordance with accepted academic practice. No use, distribution or reproduction is permitted which does not comply with these terms.
*Correspondence: Yu-ming Rong, rongym@sysucc.org.cn; Feng Gao, gaof57@mail.sysu.edu.cn
†These authors have contributed equally to this work