 Wenqi Wu1†
 Su Liu1†
 Linyan Tian1†Cheng Li1
 Yanan Jiang2Jinhuan Wang1Yangyang Lv1Jing Guo1Donghui Xing1Yixin Zhai1Huimeng Sun1Yuhang Li1Luying Zhang3Xiang He1Kaiping Luo1Hongjie Zhan4*
 Zhigang Zhao1,2*
- 1Department of Hematology, Tianjin Medical University Cancer Institute and Hospital, National Clinical Research Center for Cancer, Key Laboratory of Cancer Prevention and Therapy, Tianjin’s Clinical Research Center for Cancer, Tianjin, China
- 2Department of Medical Oncology, Tianjin First Central Hospital, School of Medicine. Nankai University, Tianjin, China
- 3Department of Pharmacy, Shandong Cancer Hospital and Institute, Shandong First Medical University and Shandong Academy of Medical Sciences, Jinan, China
- 4Department of Gastroenterology, Tianjin Medical University Cancer Institute and Hospital, National Clinical Research Center for Cancer, Key Laboratory of Cancer Prevention and Therapy, Tianjin’s Clinical Research Center for Cancer, Tianjin, China
Background: Diffuse large B-cell lymphoma (DLBCL) is a genetically heterogeneous disease with a complicated prognosis. Even though various prognostic evaluations have been applied currently, they usually only use the clinical factors that overlook the molecular underlying DLBCL progression. Therefore, more accurate prognostic assessment needs further exploration. In the present study, we constructed a novel prognostic model based on microtubule associated genes (MAGs).
Methods: A total of 33 normal controls and 1360 DLBCL samples containing gene-expression from the Gene Expression Omnibus (GEO) database were included. Subsequently, the univariate Cox, the least absolute shrinkage and selection operator (LASSO), and multivariate Cox regression analysis were used to select the best prognosis related genes into the MAGs model. To validate the model, Kaplan-Meier curve, and nomogram were analyzed.
Results: A risk score model based on fourteen candidate MAGs (CCDC78, CD300LG, CTAG2, DYNLL2, MAPKAPK2, MREG, NME8, PGK2, RALBP1, SIGLEC1, SLC1A1, SLC39A12, TMEM63A, and WRAP73) was established. The K-M curve presented that the high-risk patients had a significantly inferior overall survival (OS) time compared to low-risk patients in training and validation datasets. Furthermore, knocking-out TMEM63A, a key gene belonging to the MAGs model, inhibited cell proliferation noticeably.
Conclusion: The novel MAGs prognostic model has a well predictive capability, which may as a supplement for the current assessments. Furthermore, candidate TMEM63A gene has therapeutic target potentially in DLBCL.
1 Introduction
Diffuse large B-cell lymphoma (DLBCL) is the most common lymphoid neoplasm, has invasive behavior and a complex origin, and is heterogeneous in clinical presentation, immunophenotype, and molecular genetics (Locke et al., 2017; Kimani et al., 2021; Jiang et al., 2022). Although combination chemotherapy cyclophosphamide, doxorubicin, vincristine, and prednisone (CHOP) containing rituximab serves as the backbone of treatment, approximately 30%–40% of patients experience treatment failure or an inevitable relapse, and the number of DLBCL-related fatalities continues to increase (Maurer et al., 2014; Miao et al., 2019; Matasar et al., 2021). Conventional prognostic evaluation methods, such as the International Prognostic Index (IPI) score and 2-deoxy-2-[F-18]-fluoro-D-glucose (FDG)-PET/CT scan are insufficient to elucidate the clinical diversity of DLBCL (Zwezerijnen et al., 2021). In addition, BCL2 and TP53 mutations are considered prognostic indicators in DLBCL patients (Qin et al., 2021). Nevertheless, the effectiveness of these identified molecular markers has been limited. Therefore, predicting the survival rate of patients with a heterogeneous malignancy such as DLBCL remains challenging (Meyer et al., 2011).
Exploration of the use of microtubules has shown potential positive effects in prognosis prediction in cancer patients. As a major part of the eukaryotic cytoskeleton, microtubules serve as molecular highways and contribute to the exchange of cellular cargo (Roehlecke and Schmidt, 2020; Liang et al., 2022). Furthermore, they consist of spindle apparatus that play a crucial role in the correct attachment and segregation of chromosomes during cell division (Kavallaris, 2010). Tumor cell invasion has proven to be highly dependent on microtubule cytoskeleton systems, and tubulin is the biochemical target for several clinical anticancer drugs, including vinca alkaloids as microtubule destabilizers ;and paclitaxel as microtubule stabilizers (Cao et al., 2018).
Furthermore, tumor microtubules contribute to the resistance against standard treatment modalities in several solid tumors, where most of the surviving cells are tumor microtubule-connected cells (Osswald et al., 2015; Weil et al., 2017). The newly approved antibody–drug conjugate polatuzumab vedotin for the treatment of relapsed or refractory DLBCL performs an essential role via prevention of tubulin polymerization. However, the association between microtubules, the prognosis of DLBCL, and the potential involvement of microtubule-related genes has yet to be explored.
Considering current studies, we established a microtubule-associated gene (MAG) prognosis prediction model based on mRNA expression using clinical data from DLBCL patients that were accessible from the National Center for Biotechnology Information Gene Expression Omnibus (NCBI GEO). Moreover, the results have indicated promise for the development of targeted interventions against DLBCL.
2 Materials and methods
2.1 Data source
Clinical data and gene expression profiling data were acquired from the NCBI GEO database. Data series in GSE10846, GSE11318, GSE31312, GSE87371, and GSE56315 were downloaded in a normalized expression matrix file format for retrospective analysis. As shown in Table 1, 33 normal controls and 1360 DLBCL samples were included in our study.
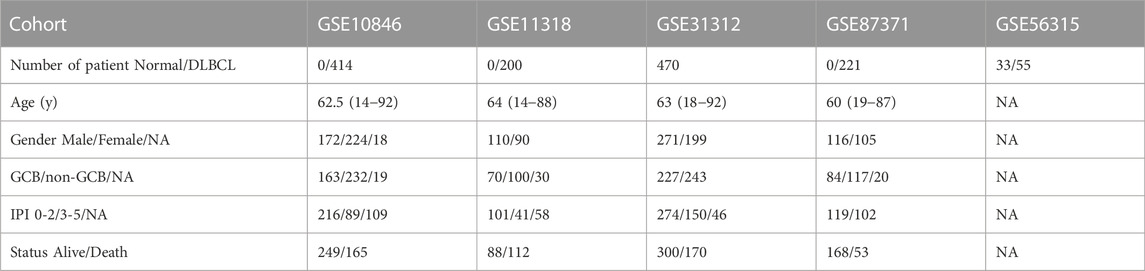
TABLE 1. Clinical information of the patients in training and validating datasets.
2.2 Selection of optimal prognostic genes related to OS
We performed univariate Cox regression analysis to investigate relationships between gene expression and prognostic values. A total of 1474 MAGs (Supplementary Table S1) were retrieved and 596 genes with p-values <.05 were retained (Supplementary Table S2). We then performed Lasso penalized Cox regression analysis with 596 microtubule-associated genes. Next, we constructed the multivariate Cox regression analysis using the 53 genes obtained from the Lasso analysis (Supplementary Table S3). Finally, the 14 MAGs that were significantly related to overall survival (OS) in the datasets were extracted (Supplementary Table S4).
2.3 Microtubule-associated risk model development and validation
We built a MAG model based on the GSE10846 dataset and validated the predictive capacity of the model using the GSE11318, GSE31312, and GSE87371 datasets.
We calculated the characteristic risk score for every patient using the following formula: risk score = ∑ βi * X. Next, we set up a proper cut-off value and divided patients into low-risk and high-risk groups. Kaplan–Meier (K-M) survival analysis and log-rank test were used to evaluate OS in different groups. The area under the curve (AUC) of the receiver operating characteristic (ROC) curve illustrated the performance of the prognostic signature. The Cox regression model method in the “survival” R package was used for univariate and multivariate analyses to explore the independent prognostic role of the gene signature.
2.4 Nomogram construction
A nomogram, including risk score and clinical features (age, gender, and IPI components), was established to predict OS of DLBCL patients at 1, 3, and 5 years. The distinguishing capacity of the nomogram was assessed via calibration mapping.
2.5 Functional enrichment analysis and immunohistochemical staining
We used the ‘LIMMA’ R package to identify genes differentially expressed between the high-risk and low-risk groups (Supplementary Table S5). Gene Ontology (GO) analysis focused on the upregulated pathways in the high-risk group (Supplementary Table S6). Gene set enrichment analysis (GSEA) was used to find pathway enrichment associated with the differentially expressed genes. Immunohistochemical staining of RALBP1 was downloaded from the HPA database (https://www.proteinatlas.org).
2.6 Knockout of the key prognostic gene TMEM63A
We used CRISPR-Cas9-mediated sgRNA to target and knockout the TMEM63A gene. We then produced a lentivirus with the sgRNA to infect the DLBCL cell lines OCI-LY7 and DOHH2. Next, EdU staining was performed to analyze cell proliferation. TMEM63A-sg1: CACCGTACTCACTGCAGACGGAAGA, TMEM63A-sg2: CACCGCGATGACAATCTCTGAAATC, and non-targeted: ACGGAGGCTAAGCGTCGCAA.
2.7 Statistical analysis
Statistical analyses were carried out, and graphs were generated using GraphPad Prism 8.0 and R.4.1.1 software; p-values <.05 indicated significant differences. Expression of MAG mRNA was compared between normal cells and cells from DLBCL patients using the unpaired t-test (Figure 2D). The boxplots of risk score (Figures 3C–H) and predicted drug sensitivity (Figures 9A–I) were analyzed using the Wilcoxon test. The K-M curves were analyzed using the log-rank test. The bar plots of cell proliferation were compared using the unpaired t-test.
3 Results
3.1 Construction of the predictive signature model
The flowchart shown in Figure 1 illustrates our study process. First, we selected 1474 MAGs from the GSEA database and conducted univariate Cox regression analysis in the training dataset GSE10846. Next, we extracted 596 genes and performed least absolute shrinkage and selection (Lasso) penalized Cox regression analysis to screen the crucial prognostic genes based on the GSE10846 dataset. We calculated the coefficient values at different levels of penalty (Figure 2A). Next, we identified the optimal lambda (λ) value, and two best-fit values (lambda.min and lambda.1se) were determined by minimizing the mean-square error, thus establishing the Lasso models (Figure 2B). A total of 53 MAGs that correlated with OS were selected. Finally, we carried out multivariate Cox regression analyses and selected 14 potential genes. It was revealed that CCDC78, CD300LG, CTAG2, DYNLL2, MAPKAPK2, MREG, NME8, PGK2, RALBP1, SIGLEC1, SLC1A1, SLC39A12, TMEM63A, and WRAP73 were significantly associated with the OS rate of DLBCL patients (Figure 2C and Supplementary Figures S1A–S1N). Furthermore, we explored the expression of the candidate genes mentioned previously in normal cells and DLBCL samples. Higher expression of CD300LG, SIGLEC1, SLC39A12, TMEM63A, and WRAP73 was observed in DLBCL samples compared to normal controls. Meanwhile, lower expression of DYNLL2, MAPKAPK2, MREG, NME8, PGK2, and SLC1A1 was detected in DLBCL samples (Figure 2D).
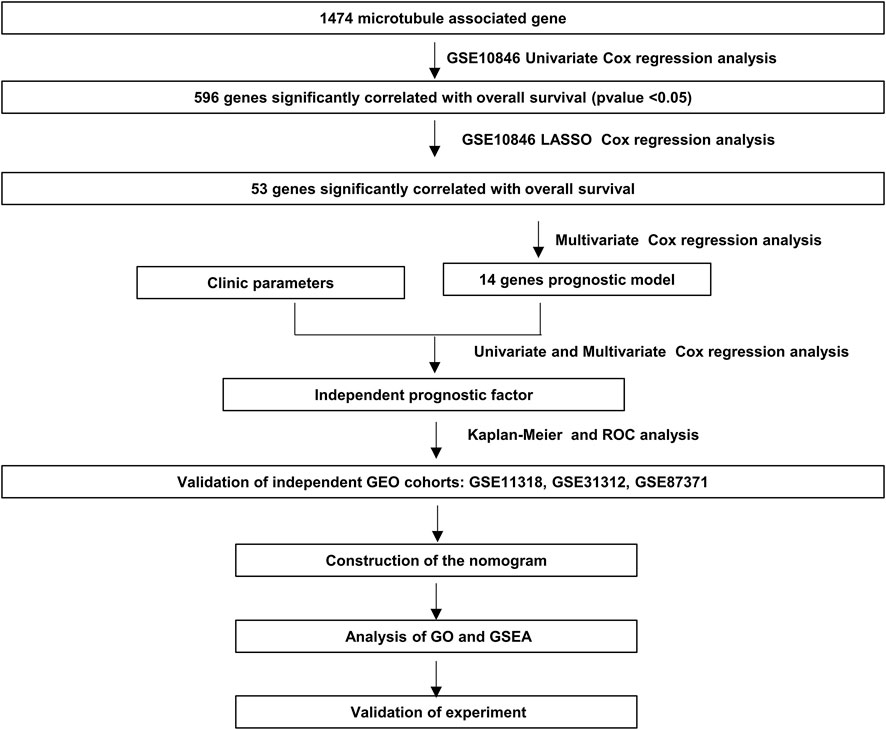
FIGURE 1. Processes of the study.
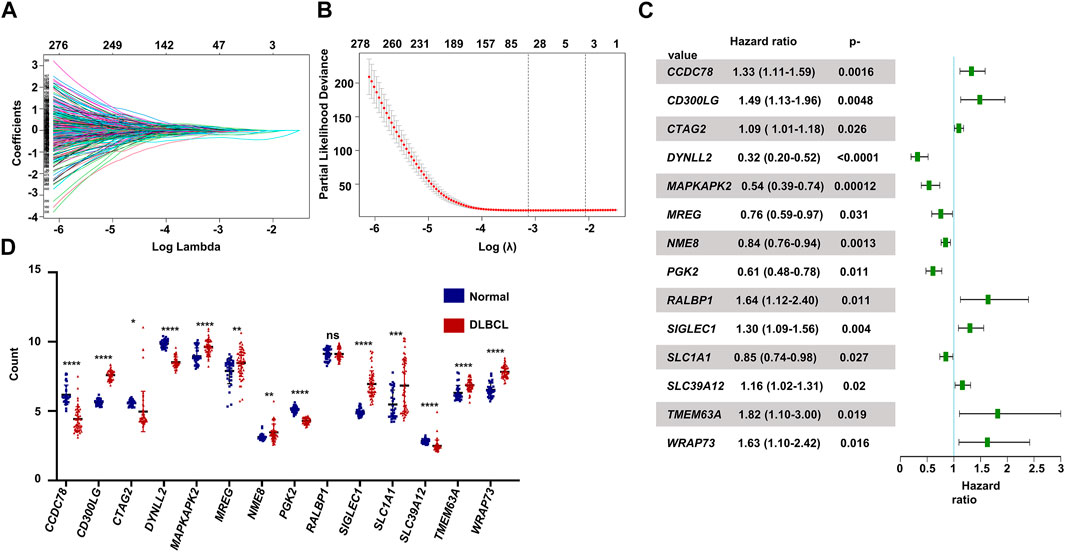
FIGURE 2. Construction of the prognostic gene signature. (A) LASSO regression analysis of the 596 prognosis-related genes. (B) Penalty plot for the LASSO regression analysis. (C) Forest plots of the multivariate Cox regression analyses of the 14 genes significantly associated with OS. (D) Expression levels of the 14 genes comparing normal B cells and DLBCL B cells. p < .05: *, p < .01: **, p < .001: ***, and p < .0001 ****.
3.2 Relationship between candidate genes and survival
The functions of the selected genes listed in Table 2 indicate that most genes are associated with microtubules and are promising for use in prediction of the prognosis of DLBCL patients. We probed the independent influence of 14 MAGs on the OS of DLBCL patients and constructed the risk score model in light of the forum risk score = ∑ βi * Xi, where Xi is the gene expression level and βi is the regression coefficient.
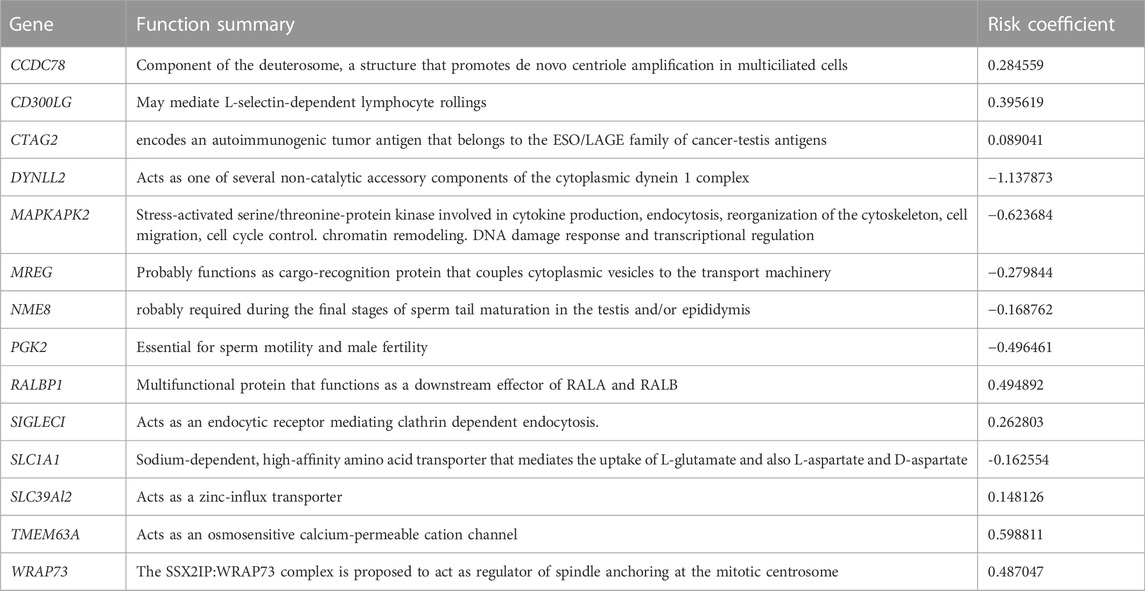
TABLE 2. Functions of genes in the prognostic signature.
3.3 Construction and validation of the 14 MAGs risk score model
We performed univariate Cox regression and multivariate Cox regression analyses using the risk score and clinical parameters. These analyses showed that the IPI score and our MAG risk score were statistically associated with OS in the training and validation cohorts (Figures 3A,B and Supplementary Figures S2A–S2D). Subsequently, we performed subgroup analysis based on IPI scores and illustrated that MAG risk score was higher in subgroups with high IPI scores (3–5) in the GSE10846, GSE11318, and GSE87371 datasets (Figures 3C–E and Supplementary Figures S3A–S3C). Similarly, we performed subgroup analysis comparing germinal center B-cell (GCB) and non-GCB groups. The MAG risk score was higher in non-GCB groups, which suggested a worse prognosis for the subgroup of non-GCB patients (Figures 3F–H). We then compared age and stage in different risk score groups. A higher percentage of patients > 60 years of age and with stage 4 DLBCL were distributed in the high-risk group than in the low-risk group (Supplementary Figures S3D–S3I). Next, we compared the MAG model with the revised IPI (R-IPI), which used IPI to divide the patients into subgroups with zero risk factors, 1–2 risk factors, and 3–5 risk factors. The results showed that a higher proportion of patients with R-IPI of 3–5 belonged to the high-risk group (Supplementary Figures S4A–S4C). Lastly, we used the clinical parameters according to the National Comprehensive Cancer Network International Prognostic Index (NCCN-IPI) to validate the MAG model. Patients were divided into subgroups by age: ≤40, 41–60, 61–75, and >75 years, and then divided based on stage into subgroups of stage 1–2 and stage 3–4. We found that the high-risk group contained a higher percentage of patients aged 61–75 and > 75 years (Supplementary Figures S4D–S4F). In addition, patients with DLBCL of stage 3–4 had a higher risk score (Supplementary Figures S4G, S4H). These data suggest that our MAG model is consistent with clinical assessment methods such as GCB/non-GCB, IPI, R-IPI, and NCCN-IPI.
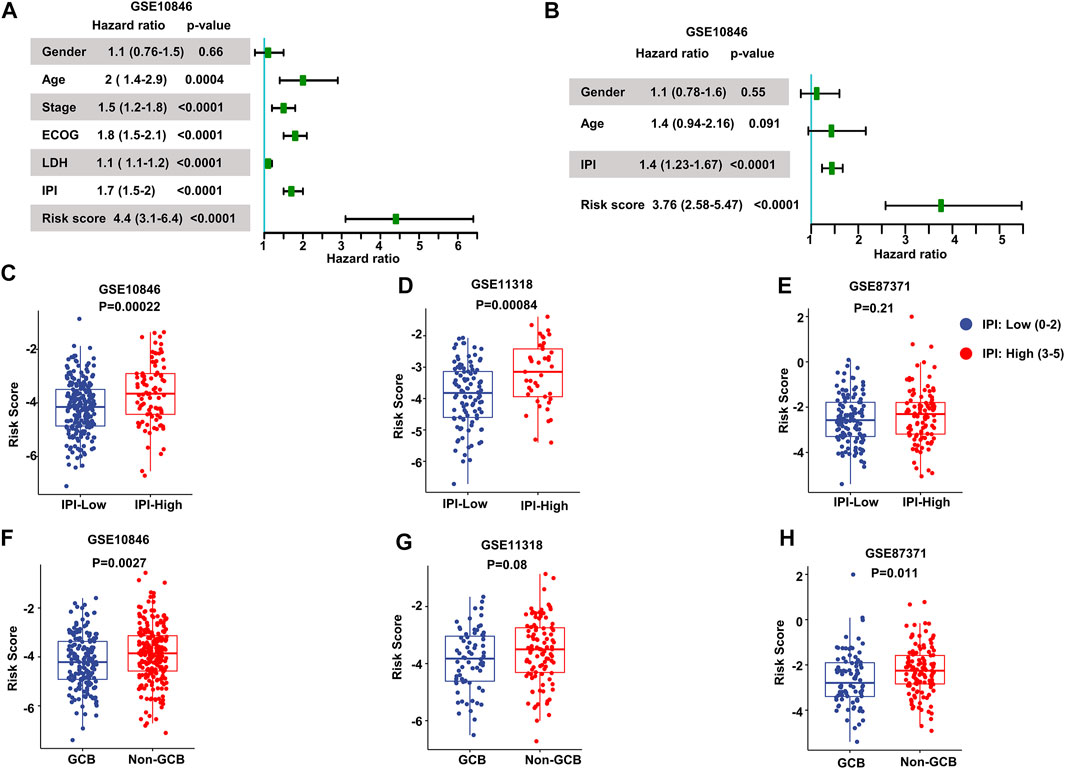
FIGURE 3. Validation of the prognostic model. (A, B) Forest plots of the univariate Cox regression analyses (A) and multivariate Cox regression analyses (B) of the prognostic risk score and clinical parameters in the training dataset GSE10846. (C–E) Box plots of the risk score in IPI-low and IPI-high groups in the training and validation datasets. (F–H) Box plots of the risk score comparing GCB and non-GCB subgroups. Training dataset: GSE10846; validation datasets: GSE11318 and GSE87371; IPI-low: 0–2, IPI-high: 3–5.
We stratified patients into high- and low-risk groups based on the median risk score from the aforementioned multivariate Cox regression analysis. The results of our study demonstrated increased survival among patients in low-risk score groups. Conversely, increased numbers of fatalities were observed in the high-risk group in both the training and validating datasets (Figures 4A–C). After K-M analysis and comparing OS in the different datasets, a poorer outcome was noted in the high-risk group (p < .0001 in GSE10846, GSE11318, and GSE87378) (Figures 4D–F). To evaluate the accuracy of our newly constructed 14 MAG prognosis prediction model, we conducted a time-dependent ROC analysis in which the AUC at 1 year (.777), 3 years (.798), and 5 years (.823) in GSE10846 was analyzed (Figure 4G). Similarly, the AUC at 1, 3, and 5 years exhibited an excellent capacity to predict prognostic outcomes in GSE11318 and GSE87378 (Figures 4H, I). Consistent results and exceptional validation were observed in GSE31312 (Supplementary Figures S5A–S5C).
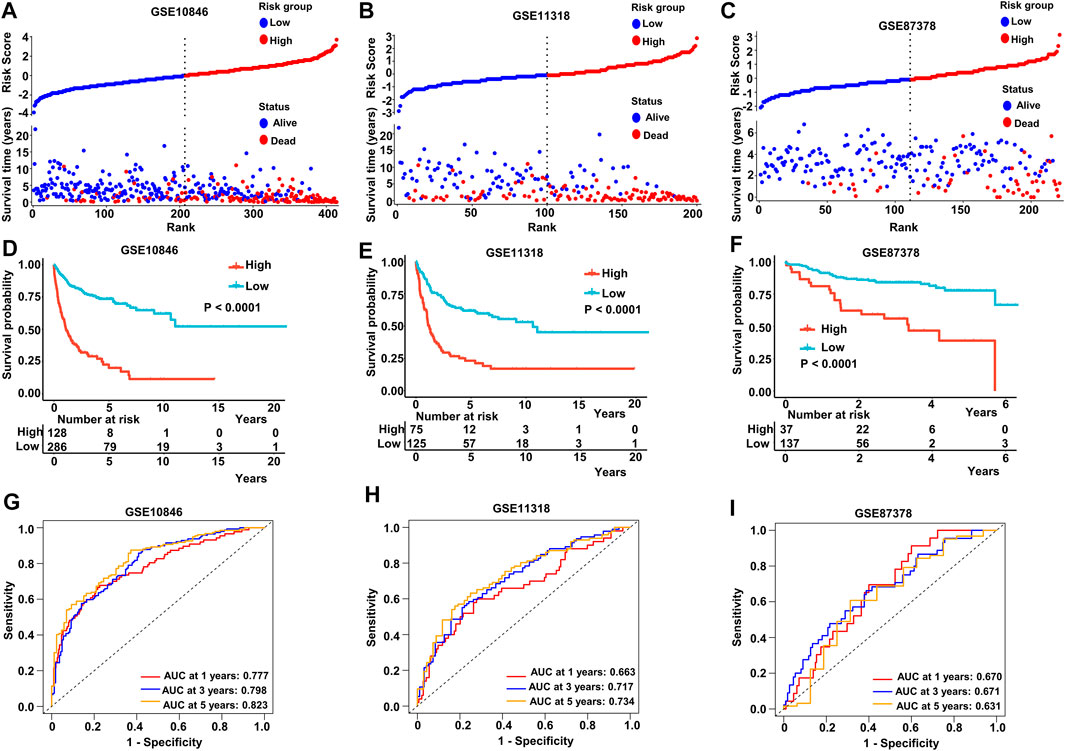
FIGURE 4. Predictive capacity of the prognostic gene signature. (A–C) Plot of the risk score, survival time, and status of patients in training and validation cohorts. (D–F) Kaplan–Meier curves of OS in the high-risk group and low-risk group in the training and validation sets. (G–I) ROC curves with calculated AUC of the training and validation datasets. Training dataset: GSE10846; validation datasets: GSE11318 and GSE87371.
The IPI score could not accurately distinguish the risk of individual DLBCL patients, so we tested our prognostic model in the high IPI score (3–5) and low IPI score (0–2) subgroups. K-M curves suggested an excellent prognostic value in different IPI score subgroups in both training and validating datasets (Figures 5A–F). Our risk score model also displayed good survival prediction in both GCB and non-GCB subgroups in different datasets (Figures 6A–H). Furthermore, we analyzed the prediction of the MAGs at 1, 3, and 5 years. The K-M curves markedly distinguished between low-risk and high-risk patients (Supplementary Figures S5D–S5L). These results suggest that the prognostic signature can predict the prognosis of most DLBCL patients.
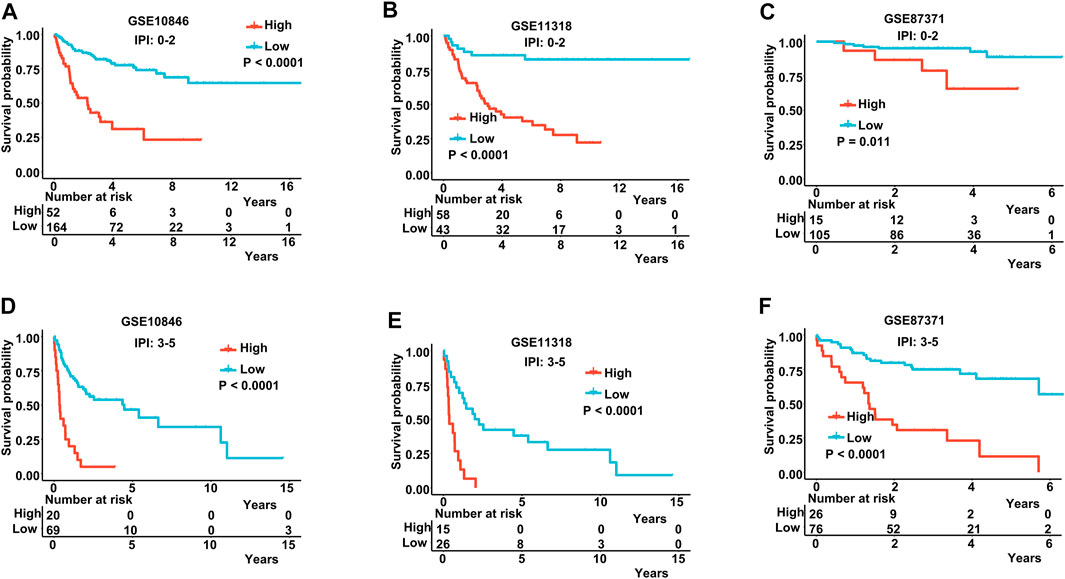
FIGURE 5. K-M curves in low-IPI score and high-IPI score subgroups. (A–C) K-M curves in low-IPI score groups in the training and validation datasets. (D–F) K-M curves in high-IPI score groups in the training and validation datasets. Training dataset: GSE10846; validation datasets: GSE11318 and GSE87371; IPI-low: 0–2, IPI-high: 3–5.
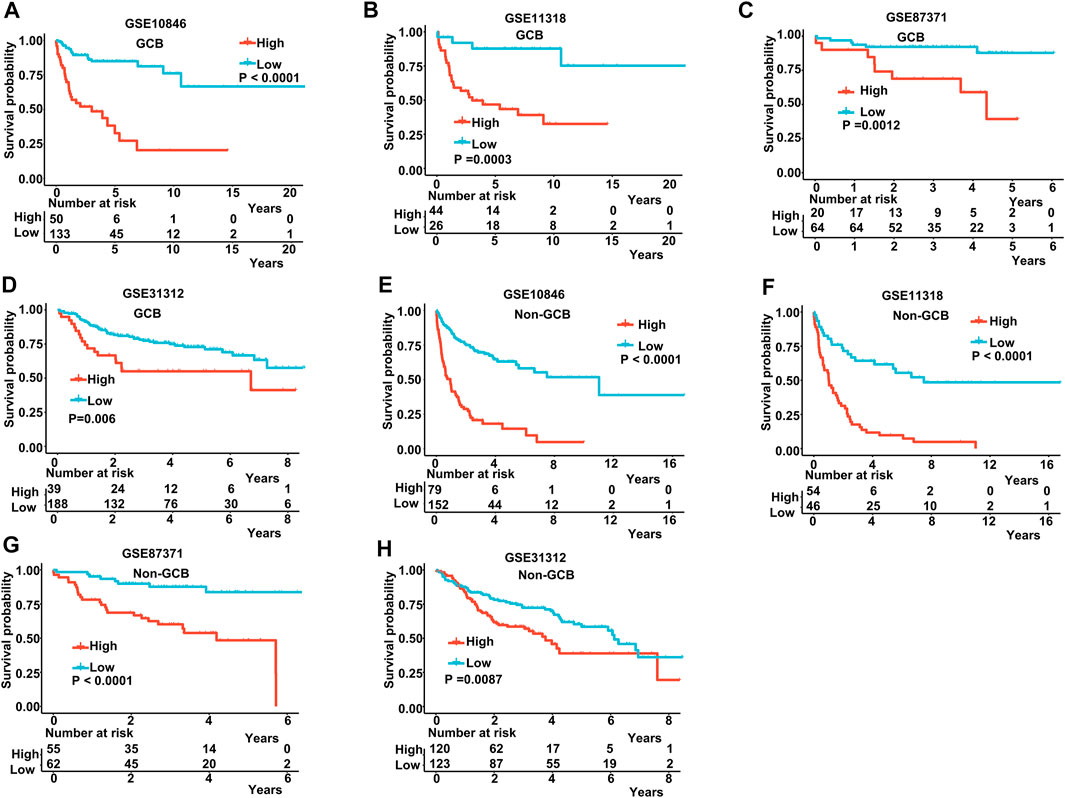
FIGURE 6. K-M curves in the GCB and non-GCB subgroups. (A–D) K-M curves in the GCB subgroups in the training and validation datasets. (E–H) K-M curves in the non-GCB subgroups in the training and validation datasets. Training dataset: GSE10846; validation datasets: GSE11318, GSE87371, and GSE11312.
3.4 Establishment of a nomogram for prognosis prediction
To build a novel nomogram that provided more precise prognosis, we combined 14 MAG risk scores with the vital clinical factors of age, gender, and IPI scores (Figure 7A). The calibration curves of 1 year, 3 years, and 5 years were all very close to the ideal lines, indicating the powerful predictive capacity of this nomogram (Figures 7B–D).
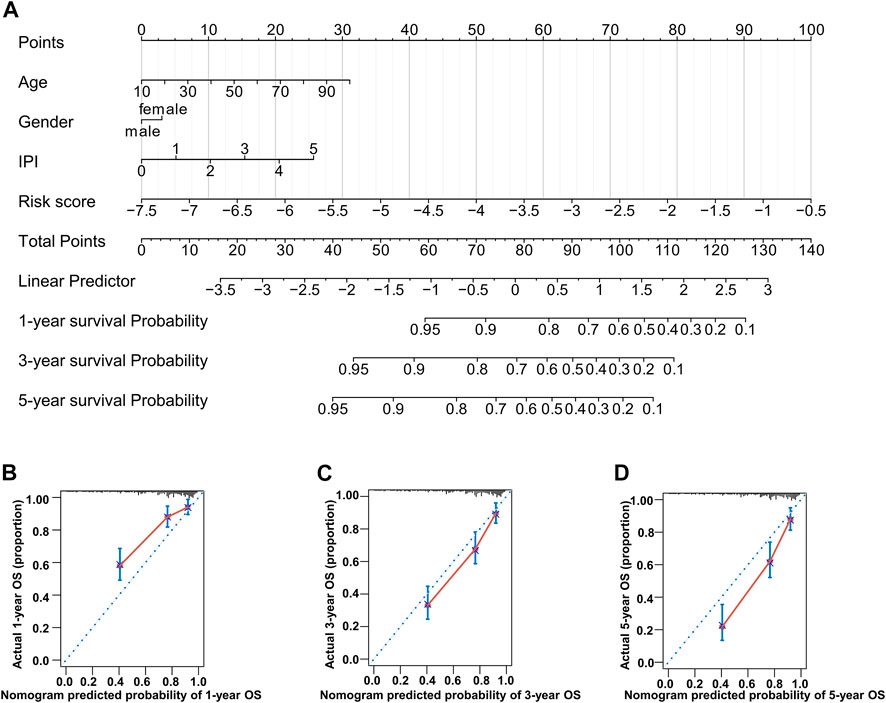
FIGURE 7. Nomogram consisting of age, gender, IPI score, and risk score. (A) Prognostic nomogram predicting OS at 1, 3, and 5 years in the training dataset. (B–D) Calibration curves for internal validation of the nomogram for OS at 1, 3, and 5 years.
3.5 Analysis of associated pathways
We performed GO analysis of upregulated genes in the population with high-risk scores and found that the enriched genes were mainly involved in RNA splicing, covalent chromatin modification, and histone modification (Figure 8A). We also conducted GSEA, and the results implied that the gene pathways enriched in patients with high-risk scores were most commonly related to upregulation of epithelial mesenchymal transition, inflammatory response, and myogenesis. In addition, enrichment of other crucial pathways involving NFKβ-TNFα and IL2-STAT5 signaling was also associated with high-risk patients (Figures 8B–F).
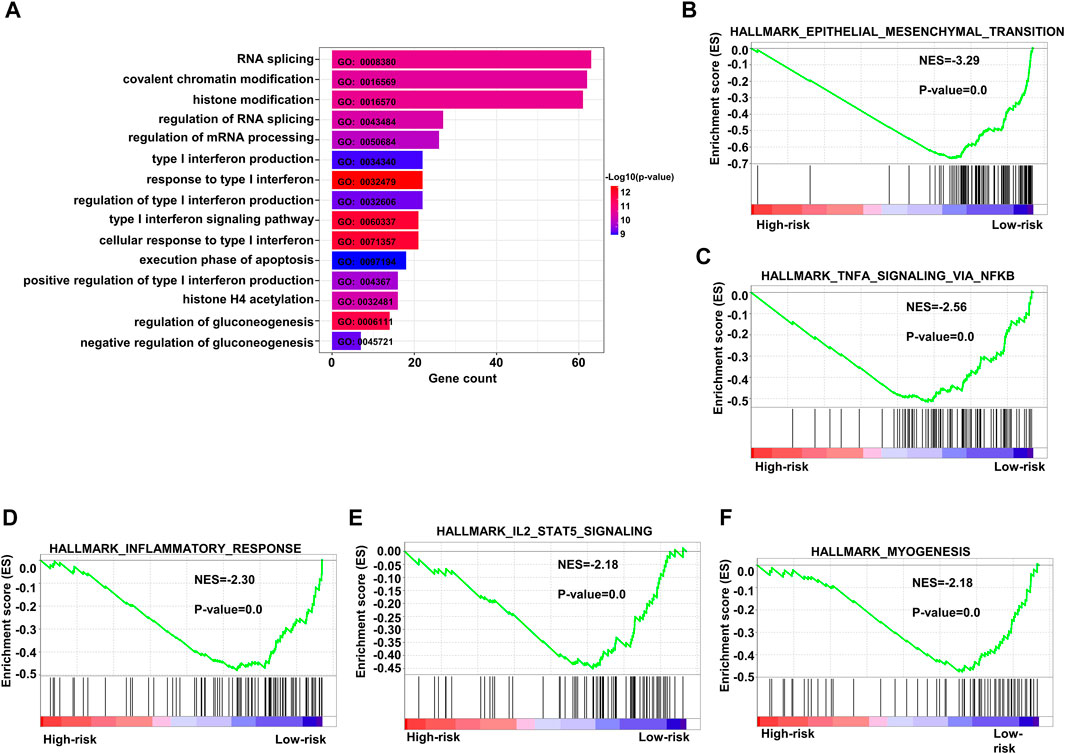
FIGURE 8. Enriched pathways in the high-risk group. (A) Bar plots of GO upregulated pathways in the high-risk score subgroup in the training dataset GSE10846. (B–F) Top five enriched pathways as indicated by GSEA of differentially expressed genes when comparing high-risk and low-risk groups in the training dataset. GO: gene ontology.
3.6 Drug sensitivity in different risk groups and immunohistochemical staining
We assessed the drug sensitivity of high-risk and low-risk groups to conventional chemotherapeutic strategies. In our study, the low-risk group showed a significantly lower half-maximal inhibitory concentration (IC50) ratio of AKT inhibitors, bortezomib, and pazopanib (Figures 9A–C). In contrast, patients in the high-risk group were more sensitive to 5-fluorouracil, doxorubicin, gefitinib, lenalidomide, mitomycin C, and methotrexate than those in the low-risk group (Figures 9D–I). These data imply that AKT inhibitors, bortezomib, and pazopanib have promising effects in the low-risk groups, while 5-fluorouracil, doxorubicin, gefitinib, lenalidomide, mitomycin C, and methotrexate are recommended as treatment modalities in high-risk groups. These results indicate that it may be best to choose an inhibitor based on the different risk subgroups of each DLBCL patient.
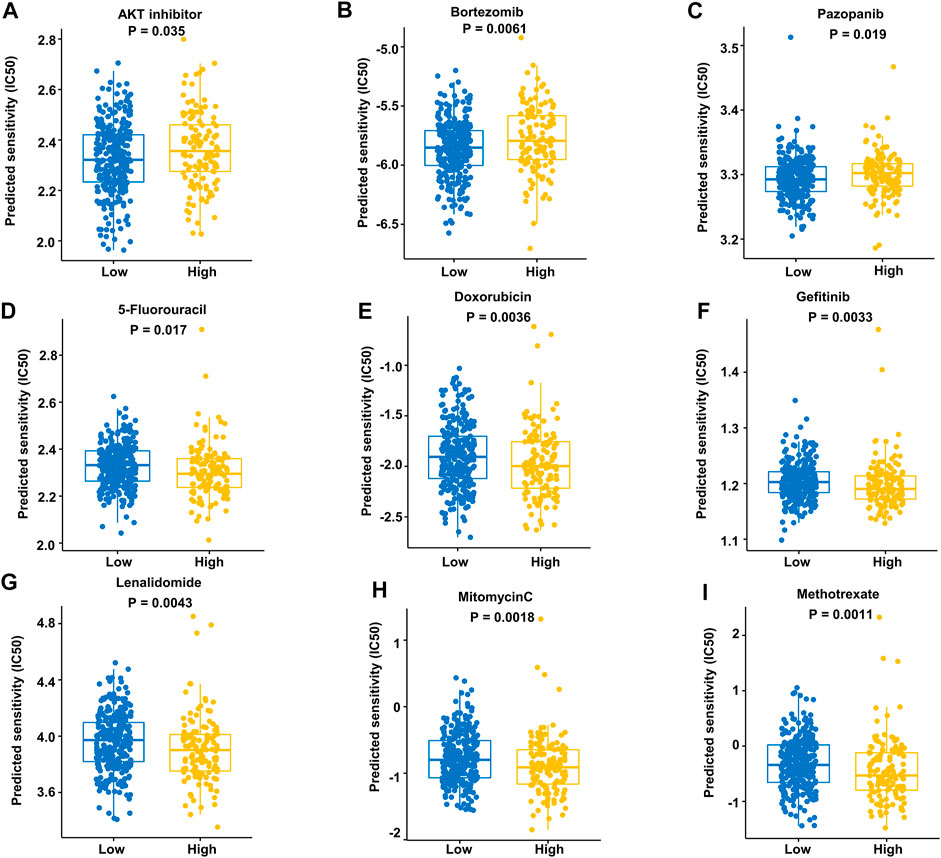
FIGURE 9. Prediction of responses to drugs. (A–C) Low-risk patients were more sensitive to these drugs in the training dataset. (D–I) High-risk patients were more sensitive to these drugs in the training dataset.
The level of RALBP1 protein expressed in DLBCL tissue was further validated using the Human Protein Atlas database (Figures 10A, B).
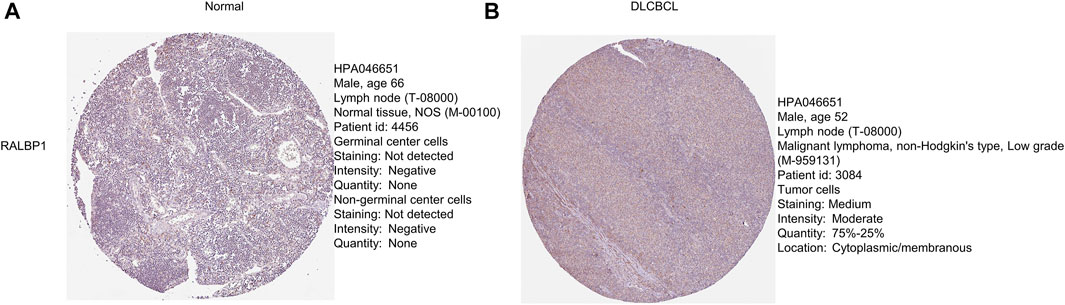
FIGURE 10. Protein levels of the prognostic genes. (A, B) Immunohistochemical staining of RALBP1 and MAPKAPK2 from the Human Protein Atlas database.
3.7 Inhibition of cell proliferation by TMEM63A knockout
To understand the function of TMEM63A in DLBCL, we generated TMEM63A knockout strains of the DLBCL cell lines OCI-LY7 and DOHH2 using CRISPR-CAS9-mediated sgRNA. Next, we analyzed the proliferating cells that showed growth inhibition following TMEM63A knockout using EdU staining (Figure 11A). Bar plots of the data showed a significant difference in proliferation of the control cell lines compared to the knockout cells (Figure 11B). These data indicate promise in targeting TMEM63A in DLBCL therapy.
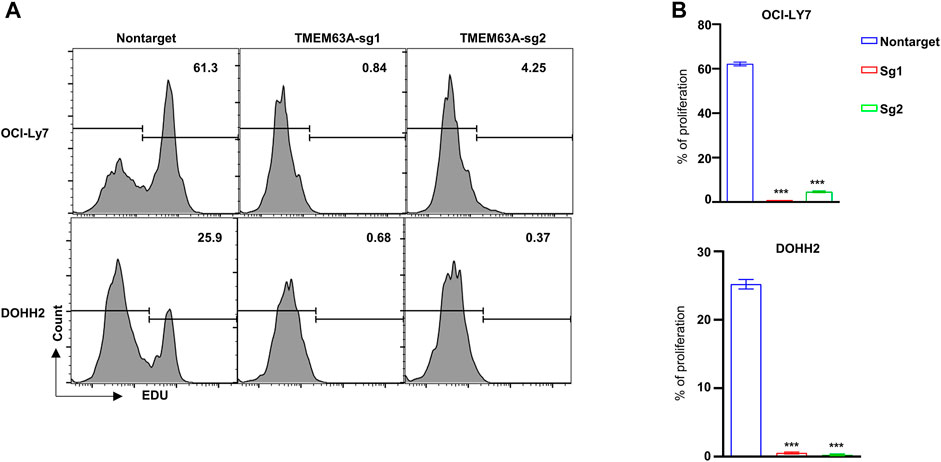
FIGURE 11. Knockout of the key prognostic gene TMEM63A. (A) Flow cytometric analysis of EdU staining after TMEM63A knockout. (B) Bar plots of cell proliferation.
4 Discussion
DLBCL is an aggressive lymphoma that damages normal lymph nodes and manifests extensive heterogeneity. Therefore, risk stratification and prognosis evaluations for DLBCL remain challenging for clinicians. The three currently available and universally acknowledged scoring systems in DLBCL (IPI, revised-IPI, and NCCN-IPI classifications) fail to identify high-risk patients with long-term OS below 50%. In our study, we analyzed the relationship between MAGs and the prognosis of patients with DLBCL in the GEO database and established a MAG prognostic model containing 14 genes (CCDC78, CD300LG, CTAG2, DYNLL2, MAPKAPK2, MREG, NME8, PGK2, RALBP1, SIGLEC1, SLC1A1, SLC39A12, TMEM63A, and WRAP73) that showed high predictive accuracy.
Microtubules are hollow tubes that radiate from the microtubule-organizing center situated at the centrosome in the cytoplasm of interphase eukaryotic cells. They are core cytoskeletal structures involved in material transport and cell proliferation that show promising capacity to reflect the prognosis of cancer patients (Osswald et al., 2016). However, the impact of microtubule function on prognostic assessment in DLBCL cases remains unclear. Our study demonstrated the use of MAGs to construct the first prognosis prediction model in DLBCL, which is capable of precisely evaluating prognosis for DLBCL patients.
Dynein light chain LC8-type 2(DYNLL2) is involved in cytoskeletal motor activity and protein binding, which plays an important role in the tumor microenvironment (Rapali et al., 2011). There is a negative correlation between DYNLL2 expression and macrophage M0, the most abundant cells in stage N1 colorectal tumors (Ge et al., 2019). However, the correlation between DYNLL2 and hematolymphoid neoplasm has yet to be elucidated. Mitogen-activated protein kinase-activated protein kinase 2 (MAPKAPK2 or MK2) is the downstream substrate in the p38MAPK pathway and induces post-translational regulation of cytokines (Soni et al., 2019). MAPKAPK2 has been confirmed as the core regulator of RNA-binding proteins and has the ability to sustain regulation stability and inhibition of tumor progression (Suarez-Lopez et al., 2018). Similarly, melanoregulin (MREG) downregulates the phosphatidylinositol 3 kinase (PI3K)/Akt-mTOR signaling pathway and simultaneously inhibits the invasion and proliferation of cancer cells (Meng et al., 2017). NME8 is the first metastasis suppressor protein found to be capable of suppressing metastasis of cancer cells without affecting primary tumor growth (Puts et al., 2018). Phosphoglycerate kinase 2 (PGK2) impacts the replication and repair of DNA in mammalian nuclei, and its expression is regulated via oxygen tension. It is a crucial enzyme in the glycolysis pathway, catalyzing glycerol-1,3-diphosphate into 3-phosphoglycerate conversion and ATP production (Wu et al., 2020). SLC1A1 has been reported as a potential therapeutic target of natural killer T-cell lymphoma, and it contributes to the favorable prognosis of asparaginase-based anti-metabolic treatment (Xiong et al., 2021). Our research suggests that the aforementioned genes are protective factors in DLBCL.
CCDC78 is correlated with poorer survival when using a prediction scoring model in colon cancer, but its role in other cancers is unclear. CCDC78 has been found to interact with PVT1, which encodes lncRNA and maps to chromosome 8q24 (Guttman et al., 2009). Likewise, the oncogene MYC, a comprehensively acknowledged risk biomarker in DLBCL, has been mapped to 8q24. MYC was also found to co-amplify with PVT1 in several cancer cell lines. CD300LG has a functional dependency associated with WT1, and upregulation and hypermethylation of WT1 have been associated with poor prognosis (Ren et al., 2021). CD300LG also has a wide variety of immunological functions (Borrego, 2013). Immuno-proteomic screening demonstrated that elevated titers of auto-antibodies to the cancer-testis antigens (CTAG2) are correlated with diverse cancer types and suggest decreased differentiation in cancer cells (Kaaks et al., 2018). RalBP1 acts as an important mediator of cancer cell migration (Lim et al., 2006). Wu et al. (2010) showed that RalBP1 depletion inhibits cancer cell growth and metastasis in vivo. High expression of SIGLEC1 was significantly associated with shorter DSS in an exploration of breast tumor-associated macrophage (TAM) markers. CCL8 is chemotactic for monocytes and forms a positive regulatory loop between cancer cells and TAMs via CSF1 and TNF-α, which upregulates SIGLEC1 (Lim et al., 2006). The solute carrier (SLC) groups of membrane transport proteins provide novel targets for therapeutic strategies in different types of malignant solid tumors, such as esophageal carcinoma, lung cancer, and pancreatic cancer (Cui et al., 2015; Wu et al., 2017). Significantly increased expression of SLC39A12 has been associated with worse OS, especially for patients with positive lymph node metastasis (Liu et al., 2020). The transmembrane protein 63A (TMEM63A) has been reported to be a novel oncogene that promotes cell proliferation, migration, and invasion (Zhang et al., 2022). Xenograft tumor growth and lung metastasis were also observed in vivo. WRAP73 encodes a member of the WD repeat protein family, which is implicated in osteoblast differentiation and osteogenesis in vivo. It has been proposed that WRAP73 participates in the development of osteoporosis through regulation of bone remodeling. However, the role of WRAP73 in DLBCL remains unknown. Given the results of our study, these genes can predict the prognosis of patients with DLBCL, and they show promise as novel therapeutic targets.
There were some limitations in our study. Further preclinical experiments are required to validate our predictive model and extend its capacity to inform clinical assessment. Nevertheless, through our study, we elucidated the association between MAGs and the prognosis of patients with DLBCL. The results of our study also suggest potential therapeutic targets and provide novel insights into the management of DLBCL.
5 Conclusion
In summary, we constructed a reliable MAG signature capable of predicting survival and showing remarkable prognostic performance. We also discussed distinctive therapeutic patterns in high- and low-risk cohorts. In addition to being prognostic biomarkers for DLBCL, the candidate genes in our predictive model are promising potential therapeutic targets.
Data availability statement
The original contributions presented in the study are included in the article/Supplementary Material; further inquiries can be directed to the corresponding authors.
Author contributions
We have completed and uploaded the attached author disclosure form. ZZ and HZ designed the study. WW and LT made the statistical plan and performed the key analyses. YJ, JW, and SL extracted the data. YL, JG, and DX tested the analyses. YZ, HS, and YL summarized the data. CL, XH, and KL assisted in data interpretation and quality assessment. WW wrote the manuscript. LT and LZ revised the manuscript. All authors have read and approved the manuscript.
Funding
This manuscript was funded by the National Natural Science Foundation of China (81870150 and 81670102) and the Tianjin Key Medical Discipline (Specialty) Construction Project (TJYXZDXK-009A).
Conflict of interest
The authors declare that the research was conducted in the absence of any commercial or financial relationships that could be construed as a potential conflict of interest.
Publisher’s note
All claims expressed in this article are solely those of the authors and do not necessarily represent those of their affiliated organizations, or those of the publisher, the editors, and the reviewers. Any product that may be evaluated in this article, or claim that may be made by its manufacturer, is not guaranteed or endorsed by the publisher.
Supplementary material
The Supplementary Material for this article can be found online at: https://www.frontiersin.org/articles/10.3389/fgene.2022.1092678/full#supplementary-material
References
Borrego, F. (2013). The CD300 molecules: An emerging family of regulators of the immune system. Blood 121, 1951–1960. doi:10.1182/blood-2012-09-435057
Cao, Y. N., Zheng, L. L., Wang, D., Liang, X. X., Gao, F., and Zhou, X. L. (2018). Recent advances in microtubule-stabilizing agents. Eur. J. Med. Chem. 143, 806–828. doi:10.1016/j.ejmech.2017.11.062
Cui, X. B., Shen, Y. Y., Jin, T. T., Li, S., Li, T. T., Zhang, S. M., et al. (2015). SLC39A6: A potential target for diagnosis and therapy of esophageal carcinoma. J. Transl. Med. 13, 321. doi:10.1186/s12967-015-0681-z
Ge, P., Wang, W., Li, L., Zhang, G., Gao, Z., Tang, Z., et al. (2019). Profiles of immune cell infiltration and immune-related genes in the tumor microenvironment of colorectal cancer. Biomed. Pharmacother. 118, 109228. doi:10.1016/j.biopha.2019.109228
Guttman, M., Amit, I., Garber, M., French, C., Lin, M. F., Feldser, D., et al. (2009). Chromatin signature reveals over a thousand highly conserved large non-coding RNAs in mammals. Nature 458, 223–227. doi:10.1038/nature07672
Jiang, J., Lyu, W., and Chen, N. (2022). A bibliometric analysis of diffuse large B-cell lymphoma research from 2001 to 2020. Comput. Biol. Med. 146, 105565. doi:10.1016/j.compbiomed.2022.105565
Kaaks, R., Fortner, R. T., Husing, A., Barrdahl, M., Hopper, M., Johnson, T., et al. (2018). Tumor-associated autoantibodies as early detection markers for ovarian cancer? A prospective evaluation. Int. J. Cancer 143, 515–526. doi:10.1002/ijc.31335
Kavallaris, M. (2010). Microtubules and resistance to tubulin-binding agents. Nat. Rev. Cancer 10, 194–204. doi:10.1038/nrc2803
Kimani, S., Painschab, M. S., Kaimila, B., Kasonkanji, E., Zuze, T., Tomoka, T., et al. (2021). Safety and efficacy of rituximab in patients with diffuse large B-cell lymphoma in Malawi: A prospective, single-arm, non-randomised phase 1/2 clinical trial. Lancet Glob. Health 9, e1008–e1016. doi:10.1016/S2214-109X(21)00181-9
Liang, T., Lu, L., Song, X., Qi, J., and Wang, J. (2022). Combination of microtubule targeting agents with other antineoplastics for cancer treatment. Biochim. Biophys. Acta Rev. Cancer 1877, 188777. doi:10.1016/j.bbcan.2022.188777
Lim, K. H., O'Hayer, K., Adam, S. J., Kendall, S. D., Campbell, P. M., Der, C. J., et al. (2006). Divergent roles for RalA and RalB in malignant growth of human pancreatic carcinoma cells. Curr. Biol. 16, 2385–2394. doi:10.1016/j.cub.2006.10.023
Liu, L., Yang, J., and Wang, C. (2020). Analysis of the prognostic significance of solute carrier (SLC) family 39 genes in breast cancer. Biosci. Rep. 40, BSR20200764. doi:10.1042/BSR20200764
Locke, F. L., Neelapu, S. S., Bartlett, N. L., Siddiqi, T., Chavez, J. C., Hosing, C. M., et al. (2017). Phase 1 results of ZUMA-1: A multicenter study of kte-C19 anti-CD19 car T cell therapy in refractory aggressive lymphoma. Mol. Ther. 25, 285–295. doi:10.1016/j.ymthe.2016.10.020
Matasar, M. J., Capra, M., Özcan, M., Lv, F., Li, W., Yañez, E., et al. (2021). Copanlisib plus rituximab versus placebo plus rituximab in patients with relapsed indolent non-hodgkin lymphoma (CHRONOS-3): A double-blind, randomised, placebo-controlled, phase 3 trial. Lancet Oncol. 22, 678–689. doi:10.1016/S1470-2045(21)00145-5
Maurer, M. J., Ghesquieres, H., Jais, J. P., Witzig, T. E., Haioun, C., Thompson, C. A., et al. (2014). Event-free survival at 24 months is a robust end point for disease-related outcome in diffuse large B-cell lymphoma treated with immunochemotherapy. J. Clin. Oncol. 32, 1066–1073. doi:10.1200/JCO.2013.51.5866
Meng, X., Dong, Y., Yu, X., Wang, D., Wang, S., Chen, S., et al. (2017). MREG suppresses thyroid cancer cell invasion and proliferation by inhibiting Akt-mTOR signaling. Biochem. Biophys. Res. Commun. 491, 72–78. doi:10.1016/j.bbrc.2017.07.044
Meyer, P. N., Fu, K., Greiner, T. C., Smith, L. M., Delabie, J., Gascoyne, R. D., et al. (2011). Immunohistochemical methods for predicting cell of origin and survival in patients with diffuse large B-cell lymphoma treated with rituximab. J. Clin. Oncol. 29, 200–207. doi:10.1200/JCO.2010.30.0368
Miao, Y., Medeiros, L. J., Li, Y., Li, J., and Young, K. H. (2019). Genetic alterations and their clinical implications in DLBCL. Nat. Rev. Clin. Oncol. 16, 634–652. doi:10.1038/s41571-019-0225-1
Osswald, M., Jung, E., Sahm, F., Solecki, G., Venkataramani, V., Blaes, J., et al. (2015). Brain tumour cells interconnect to a functional and resistant network. Nature 528, 93–98. doi:10.1038/nature16071
Osswald, M., Solecki, G., Wick, W., and Winkler, F. (2016). A malignant cellular network in gliomas: Potential clinical implications. Neuro Oncol. 18, 479–485. doi:10.1093/neuonc/now014
Puts, G. S., Leonard, M. K., Pamidimukkala, N. V., Snyder, D. E., and Kaetzel, D. M. (2018). Nuclear functions of NME proteins. Lab. Invest. 98, 211–218. doi:10.1038/labinvest.2017.109
Qin, Y., Chen, H., Liu, P., Zhang, C., Yang, J., Gui, L., et al. (2021). Prognostic value of BCL2 and TP53 genetic alterations for diffuse large B-cell lymphoma patients treated with R-CHOP. Cancer Biol. Med. 19, 893–909. doi:10.20892/j.issn.2095-3941.2021.0193
Rapali, P., Szenes, A., Radnai, L., Bakos, A., Pal, G., and Nyitray, L. (2011). DYNLL/LC8: A light chain subunit of the dynein motor complex and beyond. FEBS J. 278, 2980–2996. doi:10.1111/j.1742-4658.2011.08254.x
Ren, C., Tang, X., and Lan, H. (2021). Comprehensive analysis based on DNA methylation and RNA-seq reveals hypermethylation of the up-regulated WT1 gene with potential mechanisms in PAM50 subtypes of breast cancer. PeerJ 9, e11377. doi:10.7717/peerj.11377
Roehlecke, C., and Schmidt, M. H. H. (2020). Tunneling nanotubes and tumor microtubes in cancer, 12.Cancers (Basel).
Soni, S., Anand, P., and Padwad, Y. S. (2019). MAPKAPK2: The master regulator of RNA-binding proteins modulates transcript stability and tumor progression. J. Exp. Clin. Cancer Res. 38, 121. doi:10.1186/s13046-019-1115-1
Suarez-Lopez, L., Sriram, G., Kong, Y. W., Morandell, S., Merrick, K. A., Hernandez, Y., et al. (2018). MK2 contributes to tumor progression by promoting M2 macrophage polarization and tumor angiogenesis. Proc. Natl. Acad. Sci. U. S. A. 115, E4236-E4244–E44. doi:10.1073/pnas.1722020115
Weil, S., Osswald, M., Solecki, G., Grosch, J., Jung, E., Lemke, D., et al. (2017). Tumor microtubes convey resistance to surgical lesions and chemotherapy in gliomas. Neuro Oncol. 19, 1316–1326. doi:10.1093/neuonc/nox070
Wu, D. M., Liu, T., Deng, S. H., Han, R., and Xu, Y. (2017). SLC39A4 expression is associated with enhanced cell migration, cisplatin resistance, and poor survival in non-small cell lung cancer. Sci. Rep. 7, 7211. doi:10.1038/s41598-017-07830-4
Wu, S. T., Liu, B., Ai, Z. Z., Hong, Z. C., You, P. T., Wu, H. Z., et al. (2020). Esculetin inhibits cancer cell glycolysis by binding tumor PGK2, GPD2, and GPI. Front. Pharmacol. 11, 379. doi:10.3389/fphar.2020.00379
Wu, Z., Owens, C., Chandra, N., Popovic, K., Conaway, M., and Theodorescu, D. (2010). RalBP1 is necessary for metastasis of human cancer cell lines. Neoplasia 12, 1003–1012. doi:10.1593/neo.101080
Xiong, J., Wang, N., Zhong, H. J., Cui, B. W., Cheng, S., Sun, R., et al. (2021). SLC1A1 mediated glutamine addiction and contributed to natural killer T-cell lymphoma progression with immunotherapeutic potential. EBioMedicine 72, 103614. doi:10.1016/j.ebiom.2021.103614
Zhang, T-M., Liao, L., Yang, S-Y., Huang, M-Y., Zhang, Y-L., Deng, L., et al. (2022). TOLLIP-mediated autophagic degradation pathway links the VCP-TMEM63A-DERL1 signaling axis to triple-negative breast cancer progression. Autophagy, 1–17. doi:10.1080/15548627.2022.2103992
Zwezerijnen, G. J. C., Eertink, J. J., Burggraaff, C. N., Wiegers, S. E., Shaban, E., Pieplenbosch, S., et al. (2021). Interobserver agreement on automated metabolic tumor volume measurements of deauville score 4 and 5 lesions at interim (18)F-FDG PET in diffuse large B-cell lymphoma. J. Nucl. Med. 62, 1531–1536. doi:10.2967/jnumed.120.258673
Keywords: DLBCL, microtube-associated genes, prognostic model, targeting therapy, TMEM63A
Citation: Wu W, Liu S, Tian L, Li C, Jiang Y, Wang J, Lv Y, Guo J, Xing D, Zhai Y, Sun H, Li Y, Zhang L, He X, Luo K, Zhan H and Zhao Z (2023) Identification of microtubule-associated biomarkers in diffuse large B-cell lymphoma and prognosis prediction. Front. Genet. 13:1092678. doi: 10.3389/fgene.2022.1092678
Received: 08 November 2022; Accepted: 28 December 2022;
Published: 24 January 2023.
Edited by:
Takashi Gojobori, King Abdullah University of Science and Technology, Saudi ArabiaReviewed by:
Changlu Xu, Peking Union Medical College Hospital (CAMS), ChinaBaoai Han, Wuhan University, China
Chen Yangpeng, Southern Medical University, China
Copyright © 2023 Wu, Liu, Tian, Li, Jiang, Wang, Lv, Guo, Xing, Zhai, Sun, Li, Zhang, He, Luo, Zhan and Zhao. This is an open-access article distributed under the terms of the Creative Commons Attribution License (CC BY). The use, distribution or reproduction in other forums is permitted, provided the original author(s) and the copyright owner(s) are credited and that the original publication in this journal is cited, in accordance with accepted academic practice. No use, distribution or reproduction is permitted which does not comply with these terms.
*Correspondence: Hongjie Zhan, aG9uZ2ppZXpoYW5AMTYzLmNvbQ==; Zhigang Zhao, enpoYW8wMUB0bXUuZWR1LmNu
†These authors share first authorship