 Xuping Xie
 Yan Wang
 Nan Sheng1
 Shuangquan Zhang
 Yangkun Cao
- 1Key Laboratory of Symbol Computation and Knowledge Engineering of Ministry of Education, College of Computer Science and Technology, Jilin University, Changchun, China
- 2School of Artificial Intelligence, Jilin University, Changchun, China
- 3Institute of Biological, Environmental and Rural Sciences, Aberystwyth University, Aberystwyth, United Kingdom
MicroRNAs (miRNAs) play an important role in various biological processes and their abnormal expression could lead to the occurrence of diseases. Exploring the potential relationships between miRNAs and diseases can contribute to the diagnosis and treatment of complex diseases. The increasing databases storing miRNA and disease information provide opportunities to develop computational methods for discovering unobserved disease-related miRNAs, but there are still some challenges in how to effectively learn and fuse information from multi-source data. In this study, we propose a multi-view information fusion based method for miRNA-disease association (MDA)prediction, named MVIFMDA. Firstly, multiple heterogeneous networks are constructed by combining the known MDAs and different similarities of miRNAs and diseases based on multi-source information. Secondly, the topology features of miRNAs and diseases are obtained by using the graph convolutional network to each heterogeneous network view, respectively. Moreover, we design the attention strategy at the topology representation level to adaptively fuse representations including different structural information. Meanwhile, we learn the attribute representations of miRNAs and diseases from their similarity attribute views with convolutional neural networks, respectively. Finally, the complicated associations between miRNAs and diseases are reconstructed by applying a bilinear decoder to the combined features, which combine topology and attribute representations. Experimental results on the public dataset demonstrate that our proposed model consistently outperforms baseline methods. The case studies further show the ability of the MVIFMDA model for inferring underlying associations between miRNAs and diseases.
1 Introduction
MicroRNAs (miRNAs) are endogenous non-coding RNAs of approximately 21–23 nucleotides that play an important role in the regulation of gene expression (Bartel, 2004). A large number of studies have shown that miRNAs are involved in various biological processes, including metabolism, cell proliferation, cell cycle regulation, and differentiation (Cheng et al., 2005; Miska, 2005; Carleton et al., 2007; Bartel, 2009), and abnormal expression of miRNAs is related to the pathogenesis of various diseases such as cancer (Calin and Croce, 2006; Small and Olson, 2011; Bracken et al., 2016; Metzinger-Le Meuth and Metzinger, 2019; Sereshgi et al., 2019). Considering the important roles of miRNAs in different diseases, the identification of potential associations between miRNAs and diseases is helpful for the understanding of disease pathogenesis and the diagnosis, treatment and prognosis of diseases. Traditional biological assay methods for discovering disease-related miRNAs are time-consuming and expensive. Therefore, with the accumulation of biological data and the improvement of computational power, more and more researchers propose to predict potential miRNA-disease associations (MDAs) by using computational methods.
Based on the hypothesis that miRNAs with similar functions are more likely to be associated with diseases with similar phenotypes and vice versa (Bandyopadhyay et al., 2010), many computational models have been developed to predict MDAs. For example, Jiang et al. (2010) used a hypergeometric distribution model to evaluate the probability scores of unknown MDAs based on a phenome-microRNAome network. But this model only considers the direct neighbor information of each node and ignores the indirect neighbors. Subsequently, Xuan et al. (2013) developed a computational model HDMP based on k most similar neighbors to infer disease-related miRNAs. To improve the prediction result, HDMP puts forward to estimate miRNA functional similarity by integrating the information content of disease terms and phenotypic similarity between diseases. However, HDMP only considers the local information of the network and is not suitable for predicting potential miRNAs for novel diseases without known related miRNAs. Therefore, some methods that consider global network information have been proposed by some researchers. To make good use of structural information, Chen et al. (2012) used the random walk with restart on the miRNA functional similarity network to infer the potential associations between miRNAs and diseases. The algorithm still has the limitation that it is not applicable to new diseases and new miRNAs. Although researchers have proposed many new models (Chen et al., 2016; You et al., 2017; Chen et al., 2018b) to solve this problem, the above similarity-based methods still cannot effectively capture the complex relationships of miRNA-disease pairs.
In addition, matrix completion-based methods are also often used for biomedical link prediction due to their ability to explore the intrinsic and shared structures of heterogeneous data sources (Ou-Yang et al., 2022). Specifically, we predict potential connections by filling in the missing entries of part of the observed matrix when using this method for MDA inference. Li et al. (2017) put forward an efficient matrix completion model to infer novel MDAs, called MCMDA. Subsequently, to solve the problem that MCMDA cannot be used for new diseases, Chen et al. (2018a) designed a new computational model based on inductive matrix completion to predict potential miRNAs associated with diseases, which uses integrated miRNA similarity, disease similarity and validated MDA pairs to complement missing MDAs. Meanwhile, Xiao et al. (2018) presented a graph regularized non-negative matrix factorization method to take full advantage of the intrinsic geometric structure of the data, which enables it to effectively discover potential relationships between miRNAs and diseases, including new diseases and new miRNAs. Some matrix completion-based methods have been developed to infer underlying associations between miRNAs and diseases (Gao et al., 2020; Zhang et al., 2020; Chen et al., 2021).
In recent years, as machine learning methods have been widely used in various fields, some machine learning-based models have been presented to further improve the prediction performance of miRNA-disease potential associations. For example, Xu et al. (2011) calculated four topological features of miRNAs and constructed a support vector machine classifier to reveal the relationships between diseases and miRNAs. Since samples are randomly selected from unknown miRNA-disease relationship pairs as negative samples, these negative samples are unreliable, and they may be positive samples that have not been experimentally verified. Given the limitations of existing methods, Chen and Yan (2014) used a semi-supervised learning-based computational model of regularized least squares to identify miRNAs that may be associated with diseases. This method can be used for diseases without validated relevant miRNAs and avoid the selection of negative samples by using semi-supervision. However, with the rapid growth of biomedical data, traditional machine learning methods are not suitable for complex and changeable data, while deep learning has shown good performance in utilizing unstructured data (Sheng et al., 2022; Zhang et al., 2022). Peng et al. (2019) used auto-encoder to reduce the dimensionality of features and calculated miRNA-disease relationship scores by the convolutional neural network (CNN). Li et al. (2020) proposed to use latent feature representations of miRNAs and diseases, respectively learned by graph convolutional networks (GCNs) (Kipf and Welling, 2016), as input for neural inductive matrix completion to obtain scores for unknown miRNA-disease pairs. Tang et al. (2021) presented a multi-view multichannel attention graph convolutional network (MMGCN) to identify new disease-related miRNAs, which uses GCNs to learn the embeddings of miRNAs and diseases, furthermore adopts multi-channel attention to enhance the learned latent representations. The GNN based on link representation proposed by Kang et al. (2022) employed the GCN to obtain node embeddings and then obtained the improved intermolecular relationship scores according to the designed propagation rule and layer-wise fusing rule. Although there are some methods using deep learning for MDA prediction, many of them ignore the effective learning and fusion of information from different data sources, such as some methods simply utilize one type information, some simply fill in the missing values of one type of information with other types of information, and some ignore information in known associations. Thus, the methods that better utilize multi-source data information to identify underlying disease-related miRNAs should be further explored.
In this study, we present a novel MDA prediction method based on multi-view information fusion (MVIFMDA), which attempts to effectively preserve the topological and attribute information from multi-source data. The basic idea of MVIFMDA is as follows. We firstly use multi-source data to construct the known association network of miRNA-disease and the similarity networks of miRNA and disease, including miRNA sequence similarity network, miRNA functional similarity network, disease semantic similarity network, and disease functional similarity network. And then multiple heterogeneous networks between miRNAs and diseases are constructed based on the association network and similarity networks of miRNA and disease. Secondly, GCNs are employed to learn various topological representations of miRNAs and diseases according to different heterogeneous network views, respectively. Furthermore, the attention strategy at the topology representation level is established to obtain more informative topology embeddings by effectively learning the importance of different topology features. Meanwhile, CNNs are adopted to respectively get the attribute representations of the miRNAs and diseases based on the various miRNA similarity and disease similarity views. Finally, the combined miRNA and disease embeddings are fed into a bilinear decoder to calculate the MDA scores. 5-Fold cross-validation (5-CV) and case studies demonstrate that the MVIFMDA model extracts more information from multiple biological data sources and is suitable for MDA prediction.
2 Materials and methods
In this study, we propose a new multi-view information fusion model named MVIFMDA for MDA prediction. The framework of MVIFMDA is shown in Figure 1. We firstly construct miRNA-disease heterogeneous networks based on known associations and various similarities of miRNA and disease (Figure 1A). Additionally, GCNs are adopted to encode heterogeneous network views including different information, and an attention mechanism is designed to adaptively integrate different topology representations for miRNAs and diseases obtained from GCNs (Figure 1B). Meanwhile, the attribute representations of the miRNAs and diseases are learned by utilizing the CNN encoder (Figures 1C,D). Finally, the bilinear decoder combines the topology and attribute representations of miRNAs and diseases to predict the association scores between miRNAs and diseases.
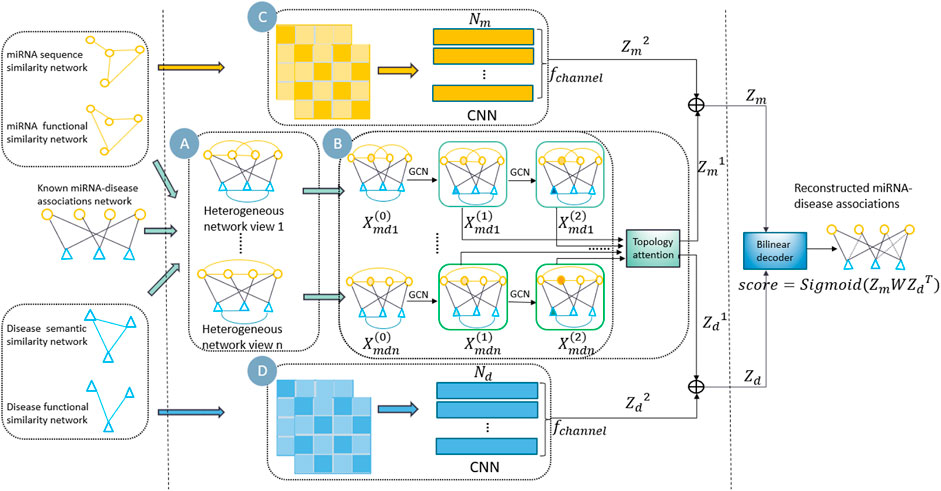
FIGURE 1. Overview of MVIFMDA. (A) Construction of multiple miRNA-disease heterogeneous networks using known MDAs and the similarities of miRNAs and diseases. (B) Encoding of heterogeneous network views by GCN to extract topology representations, and using topology representation level attention mechanism to adaptively fuse the different topology information. (C) and (D) Encoding of similarity views by CNN to obtain attribute representations of miRNAs and diseases, respectively.
2.1 Dataset
We downloaded experimentally validated human miRNA-disease relationships from HMDD v3.2 (Huang et al., 2019), which is a curated database. To take full advantage of multiple biomedical data, we obtained the medical subject headings (MeSH) descriptors from the National Library of Medicine (https://www.nlm.nih.gov/), which provides semantic information of diseases through directed acyclic graphs (DAGs). And disease-gene associations and weighted gene-gene relationships were obtained from DisGeNET (Piñero et al., 2020) and HumanNet (Hwang et al., 2019), respectively. In addition, we downloaded the sequence information of miRNAs from miRbase (Kozomara et al., 2019), and the miRNA-gene relationships were got from miRTarBase (Huang et al., 2020). By taking the intersection of data from multiple data sources and merging duplicate data, we finally acquired 12,446 associations among 853 miRNAs and 591 diseases for the next association prediction, furthermore used these processed data to calculate the similarities of miRNAs and diseases and build heterogeneous networks between miRNAs and diseases.
2.2 Construction of heterogeneous networks
2.2.1 Human miRNA-disease associations
We employ the obtained known human relationship pairs between miRNAs and diseases to construct the association matrix
2.2.2 Disease semantic similarity
As shown in (Wang et al., 2010a), DAGs can be used to compute the semantic similarity of diseases. For example, a disease
where the semantic contribution factor
According to Eq. 2, we can finally get the weight matrix of the disease semantic similarity network
2.2.3 Disease functional similarity
Driven by the hypothesis that similar disease tendencies interact with similar genes (Xu and Li, 2006; Wei and Liu, 2020), we calculate the functional similarity of diseases utilizing the relationship between disease and gene. The gene functional interaction network can be obtained from HumanNet, where it provides a log-likelihood score (LLS) for each gene interaction to assess the probability of functional connectivity between genes (Lee et al., 2011; Hwang et al., 2019). We obtain the similarity
where
where
where
2.2.4 miRNA sequence similarity
To measure the similarity of miRNA sequences, we employ the Needleman-Wunsch Algorithm (Needleman and Wunsch, 1970) to quantify the similarity between two miRNAs by sequence alignment. In addition, we normalize the sequence similarity score
where
2.2.5 miRNA functional similarity
Similar to the calculation of disease functional similarity, we utilize the relationships between miRNAs and genes to calculate miRNA functional similarity, which avoids the dependence on known associations between miRNAs and diseases and enables the similarity calculation of new miRNAs (Xiao et al., 2018; Xiao et al., 2021). Analogously, we can define the functional similarity between miRNA
where
In addition, for miRNAs and diseases, different kinds of similarity matrix views obtained from different data sources are considered as their initial attribute feature, which can be used to further learn their attribute representations.
2.2.6 Heterogeneous networks
By integrating the MDA network, two miRNA similarity networks and two disease similarity networks, multiple miRNA-disease heterogeneous networks are constructed, as shown in Figure 1A. As mentioned above, in each heterogeneous network, the weights of the edges between two miRNA nodes and between two disease nodes are equal to the similarity scores between them, respectively, while the edge weight between a miRNA node and a disease node is determined by whether there is a known association between two nodes. Given the MDA matrix
where
2.3 Multi-view topology representation learning
2.3.1 Topology representations learning by graph convolutional network encoder
Graph convolutional network (GCN) is a powerful tool for learning node embeddings of graph-structured data, which has been proven both theoretically and practically (Zhou et al., 2020). GCN generates a low-dimensional and efficient representation of a node by aggregating the information of the neighbour nodes of the node in the graph and capturing the dependencies between the data. For an undirected graph, the layer-wise propagation rule of a multi-layer GCN can be expressed as follows:
Where
For the miRNA-disease heterogeneous network views constructed in the previous chapter, we use them as the input of the GCN encoder respectively, and then obtain different embeddings of miRNAs and diseases. Taking the use of GCN to encode the heterogeneous network
where
where the GCN has
Similarly, we can obtain the embedding
Furthermore, as shown in Figure 1B, we get topological representations of miRNAs and diseases from different perspectives according to the multi-layer GCN encoder and the next section will describe how to integrate these representations, which contain different structural information.
2.3.2 Topology representations fusing by attention mechanism
The structural information of the input network captured by different GCN layers is different. For instance, the first layer captures the direct connection information between nodes, and by updating the embeddings layer by layer, multi-hop neighbour information can be captured by higher layer embeddings (He et al., 2020; Yu et al., 2021). In addition, the embeddings from different heterogeneous network views are not equally important to explore MDAs. Therefore, we design the attention strategy at the topology representation level to adaptively fuse multiple topology embeddings of miRNAs and diseases learned by GCN encoder. The multiple feature matrices of miRNAs and diseases from the heterogeneous network views are stacked to form a feature tensor
where
2.4 Multi-view attribute representations learning by convolutional neural network encoder
Convolutional neural network (CNN) can obtain the local message contained in the feature map through multiple convolution kernels, which helps us to use CNN to extract the deep attribute features of miRNAs and diseases from different information sources respectively. We take
where
In order to make full use of the information from different data sources, we combine the topological features from multiple miRNA-disease heterogeneous networks learned by GCN encoder and the attribute features from multiple similarity matrices learned by CNN encoder as the final embeddings, which is expressed as follows:
where
2.4.1 The reconstruction of miRNA-disease associations and optimization
Although the inner product of node embeddings is often used to predict relationship probabilities between nodes, it is limited in capturing complex associations between nodes. Here, we reconstruct the associations between miRNAs and diseases by introducing a bilinear decoder. Based on the obtained embedding matrices
where
In this study, we train MVIFMDA to learn the parameters of the model by utilizing the following cross-entropy loss
where
3 Results
3.1 Experiment settings
In this study, 5-CV is adopted to evaluate the performance of MVIFMDA for identifying candidate disease-associated miRNAs. For 5-CV, all known MDAs (also named positive samples) are randomly divided into five equal parts, and each part in turn is utilized for testing while the remaining is adopted for training. In each fold, the miRNA-disease heterogeneous networks are updated based on new known associations, where the known associations for testing are treated as unobserved associations. MDA prediction can be viewed as a classification task, therefore, several common classification metrics are used to evaluate the prediction performance of MVIFMDA and baseline models, including area under receiver operating characteristic (ROC) curve (AUC), area under the precision-recall (PR) curve (AUPR), accuracy, precision, recall, specificity, and precision rate and recall rate within the top
In MVIFMDA, there are several hyperparameters to adjust, such as the number of GCN layer
3.2 Ablation experiments
In the study, we combine GCN encoder and CNN encoder to enhance the feature embeddings of miRNAs and diseases. In order to validate the effectiveness of the main components in MVIFMDA, we designed two variants of MVIFMDA (MVIFMDA-noTR, MVIFMDA-noAR) for the ablation study. MVIFMDA-noTR removes the topology representations of miRNAs and diseases based on the GCN encoder. MVIFMDA-noAR only adopts the topology features without using the attribute representations based on the CNN encoder. The experimental results of MVIFMDA and two variants are shown in Table 1. The results demonstrate that MVIFMDA outperforms the other two variant models on all evaluation metrics. It means that the topological representations obtained by the GCN encoder and the attribute representations learned by the CNN encoder can play a complementary role and the combination of the two can more effectively learn the multi-view information of miRNA and disease nodes from different information sources. For MVIFMDA-noTR and MVIFMDA-noAR, the performance of MVIFMDA-noAR is better, i.e., the topological information extracted from the heterogeneous network views is very useful and the topological level attention mechanism effectively integrates the different structural information. In conclusion, the combination of topological representations from multiple heterogeneous network views learned by the GCN encoder and attribute representations from multiple similarity views learned by the CNN encoder makes our proposed model perform better.
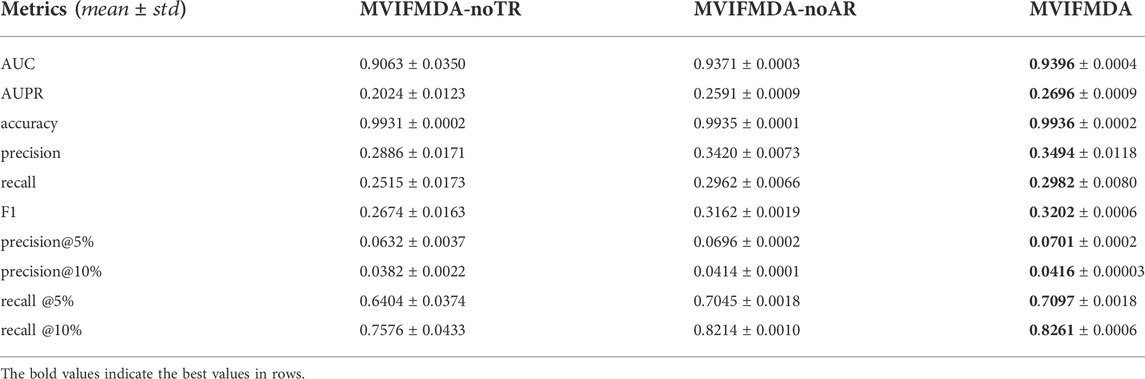
TABLE 1. Results of our model and its variant models.
3.3 Comparison with other methods
To demonstrate the performance of MVIFMDA in identifying potential disease-related miRNAs, we compared it with six state-of-the-art approaches that were developed for MDA prediction, including MDHGI (Chen et al., 2018b), ABMDA (Zhao et al., 2019), NIMGSA (Jin et al., 2022), NIMCGCN (Li et al., 2020), DANE-MDA (Ji et al., 2021), MMGCN (Tang et al., 2021).
For a fair comparison, all models are evaluated using 5-CV. Figure 2 and Table 2 show that except that the recall of MVIFMDA is slightly lower than that of MMGCN, all other metrics are significantly higher than the comparison methods, whereas compared to MMGCN, the AUC and AUPR are improved by 1.8 and 4.7%, respectively. One of the possible reasons is that MVIFMDA is able to enhance the representation of nodes by combining topological representations from different heterogeneous network views and attribute representations from different similarity views, which further shows that the design of our model is sound. Compared with MDHGI, ABMDA, NIMGSA, and NIMCGCN, MVIFMDA builds multiple heterogeneous networks with different similarities and learns topological representations from these heterogeneous networks respectively, and uses CNNs to learn high-level features from multiple similarity matrices, which replaces simply combining the multiple similarities into one like the compared methods. Although DANE-MDA considers both the attribute information and topology information, its performance is not as good as MVIFMDA. This may be because of that DANE-MDA simply uses miRNA sequence similarity and disease semantic similarity to obtain node embeddings of miRNAs and diseases, while MVIFMDA learns topological and attribute information from two different similarities more efficiently. Furthermore, although MMGCN uses a multichannel attention mechanism to capture more important topological features from different similarity network views, its performance is also not as good as that of MVIFMDA in addition to the recall, probably because MVIFMDA is capable of combining topological representations learned by GCN and attribute representations learned by CNN to more effectively capture information in multi-view networks. In addition, we further evaluate the performance of MVIFMDA and the comparison methods using the paired t-test based on 10 runs of 5-CV. Table 3 shows that MVIFMDA is significantly preferred to other computational methods in terms of AUC and AUPR (

FIGURE 2. ROC curves and PR curves of MVIFMDA with all comparison methods.
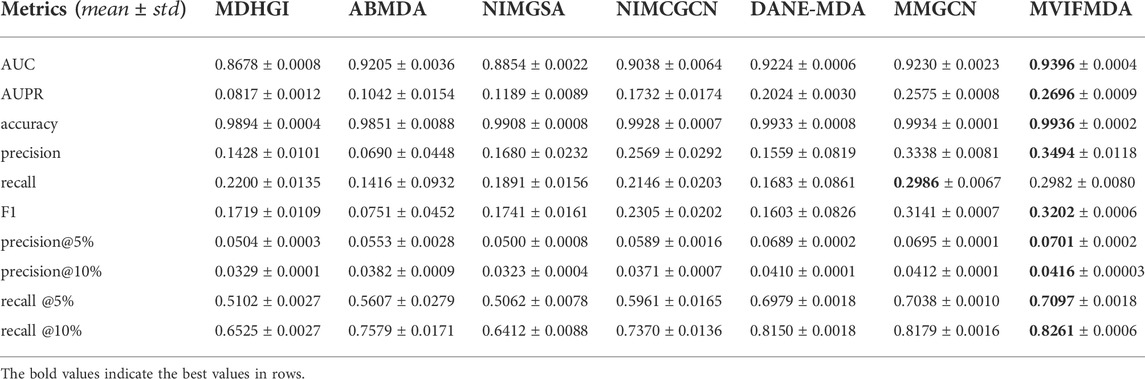
TABLE 2. The performance of MVIFMDA with all comparison methods.
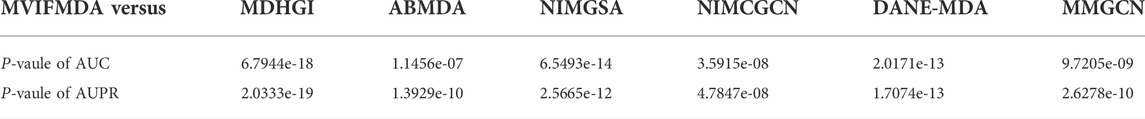
TABLE 3. The statistical results by paired t-test for MVIFMDA and all comparison methods.
3.4 Case studies: Colonic neoplasms, esophageal neoplasms and lymphoma
To further demonstrate the reliability of the MVIFMDA model in real cases, we construct case studies for colonic neoplasms, esophageal neoplasms and lymphoma. All known MDAs are used as positive samples to train the model, then this trained model is used to predict the probability scores of all unknown relationship pairs. For each disease, the predicted scores are sorted in descending order.
The top-rank 20 miRNAs associated with each disease are shown in Tables 4–6, where we use dbDEMC 3.0 (Yang et al., 2017) to validate the candidate MDAs. Colon tumours are the third leading cause of cancer-related deaths in the United States (Siegel et al., 2016). As shown in Table 4, among the top-rank 20 disease-related candidate miRNAs, 18 are identified by dbDEMC, which suggests that these miRNAs are associated with colonic neoplasms. Overexpression of hsa-miR-122 increases the sensitivity of fluorouracil (5-FU)-resistant colon cancer cells to 5-FU through PKM2 downregulation (He et al., 2014). High levels of hsa-miR-122-5p in plasma could suggest liver metastases from colorectal cancer and correlate with poorer recurrence-free survival and overall survival times (Maierthaler et al., 2017; Sun et al., 2020). Colorectal cancer is a collective term for colon cancer and rectal cancer, implying that hsa-miR-122-5p may be associated with the survival prognosis of colon cancer patients. High levels of miR-196a in colorectal cancer can actuate the Akt signaling pathway and accelerate cancer cell metastasis and infiltration (Schimanski et al., 2009; Wang et al., 2010b). Furthermore, it was mentioned in (Ge et al., 2014) that miR-196a in colorectal cancer displays an association with aggressive disease and a detrimental effect on therapeutic outcomes. Esophageal tumours are the major malignant tumours of the digestive system, with the sixth and fourth highest incidence and mortality rates, respectively, among all malignancies. Lymphoma, meanwhile, is a malignant tumour of the lymphatic hematopoietic system, the incidence of which is increasing annually. From Tables 5, 6, it can be seen that the top-rank 20 candidate miRNAs predicted by the MVIFMDA model with regard to esophageal neoplasms and lymphomas can all be confirmed by the dbDEMC dataset. In summary, the case studies further show that our model is effective in inferring new disease-related miRNAs.
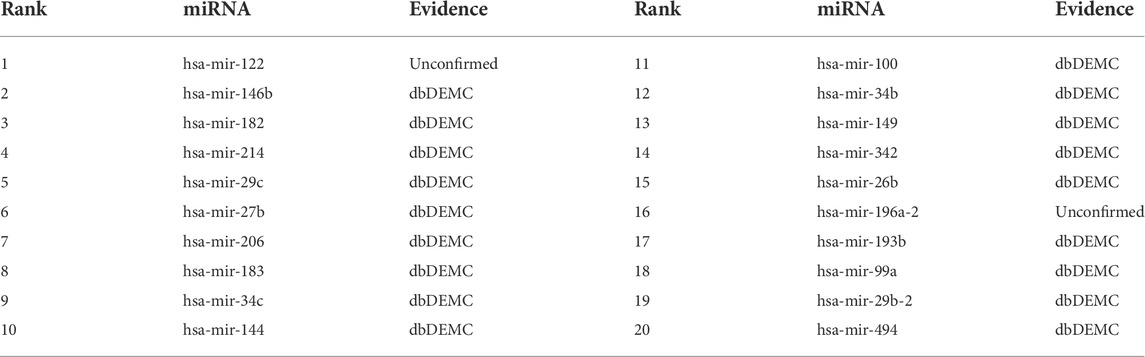
TABLE 4. Top 20 miRNA candidates related to colonic neoplasms.
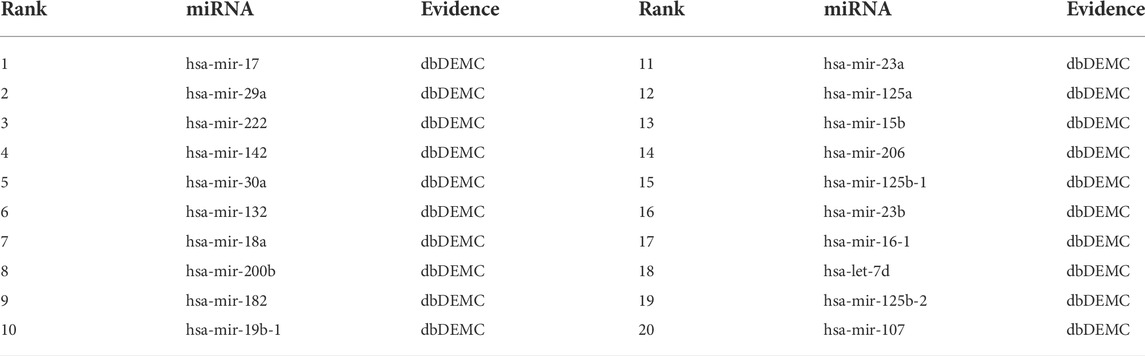
TABLE 5. Top 20 miRNA candidates related to esophageal neoplasms.
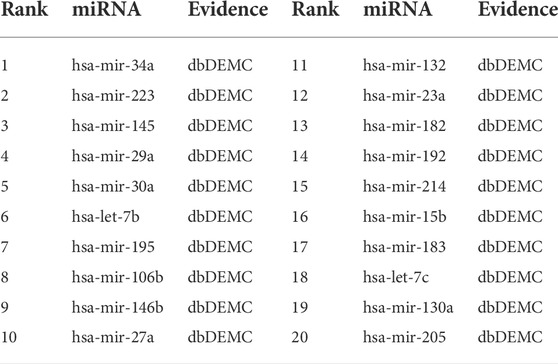
TABLE 6. Top 20 miRNA candidates related to lymphoma.
3.5 Prediction of novel diseases
To show the predictive performance of MVIFMDA for new diseases without known relevant miRNAs, we construct another case study for novel diseases in this experiment. When predicting miRNAs relevant to a new disease, we use known relationship pairs other than those associated with the specific disease as positive samples to train the MVIFMDA model and then explore the relationship probabilities between the specific disease and all miRNAs. Based on the descending ranked prediction scores, we use HMDD v3.2 to verify these top-rank 20 candidate MDA pairs.
Breast cancer is the most common cancer worldwide, and miRNAs are considered as new diagnostic and prognostic markers for it. Therefore, here we predict miRNAs associated with breast neoplasms by employing the MVIFMDA model, and as shown in Table 7, 20 of the top 20 miRNAs are validated by the HMDD dataset, which show that our model is good in identifying miRNAs associated with novel diseases.
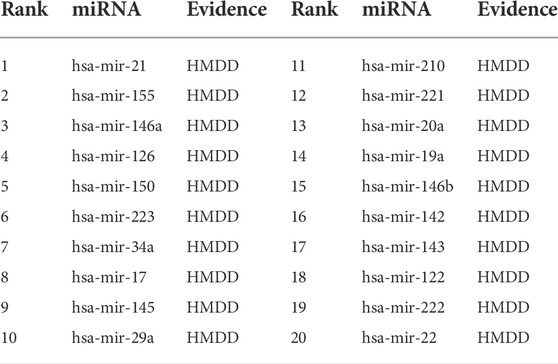
TABLE 7. Top 20 miRNA candidates related to breast neoplasms. The miRNAs associated with breast neoplasms are deleted before training the MVIFMDA model.
4 Conclusion
In this study, we propose a new end-to-end model called MVIFMDA to predict potential MDAs. This model captures topological features in multiple heterogeneous network views by GCN encoder, then adaptively fuses different topological features using an attention mechanism, furthermore employs CNN encoder to extract attribute features from different similarity views of miRNAs and diseases, respectively, finally its prediction performance is improved by combining topological and attribute features. The comparison with six advanced methods for identifying new MDAs and the case studies indicate that MVIFMDA has excellent predictive performance and can perform well in practical applications.
Although MVIFMDA has shown good predictive performance, it still has some issues that need further investigation. First, we use CNN to learn the attribute representations of miRNA and disease node levels, whether the attribute embeddings of miRNA and disease node pairs levels can improve the prediction performance of MDAs needs to be further studied. Second, we use only two similarities of both miRNAs and diseases, and more relevant evidence of miRNA and disease should be used to construct the similarity networks, such as the interaction relationships between miRNAs and lncRNAs and the association relationships between lncRNAs and diseases. In addition, though we consider using gene-related information to calculate the similarity of diseases and miRNAs, a multi-layer network among genes, miRNAs and diseases is not directly constructed to explore the miRNAs correlated with diseases. Therefore, it is still worthwhile to continue investigating how to effectively utilize the information from multiple data sources.
Data availability statement
The original contributions presented in the study are included in the article/Supplementary Material, further inquiries can be directed to the corresponding author.
Author contributions
YW and XX conceived the prediction method, and they wrote the paper. XX and SZ developed the computer programs. NS analyzed the results. NS, YC, and YF revised the paper. All authors read and approved the published version of the manuscript.
Funding
This work was supported by the National Natural Science Foundation of China (No. 62072212), the Development Project of Jilin Province of China (Nos. 20200401083GX, 2020C003, and 20200403172).
Conflict of interest
The authors declare that the research was conducted in the absence of any commercial or financial relationships that could be construed as a potential conflict of interest.
Publisher’s note
All claims expressed in this article are solely those of the authors and do not necessarily represent those of their affiliated organizations, or those of the publisher, the editors and the reviewers. Any product that may be evaluated in this article, or claim that may be made by its manufacturer, is not guaranteed or endorsed by the publisher.
References
Bandyopadhyay, S., Mitra, R., Maulik, U., and Zhang, M. Q. (2010). Development of the human cancer microRNA network. Silence 1 (1), 6–14. doi:10.1186/1758-907X-1-6
Bartel, D. P. (2004). MicroRNAs: Genomics, biogenesis, mechanism, and function. Cell. 116 (2), 281–297. doi:10.1016/s0092-8674(04)00045-5
Bartel, D. P. (2009). MicroRNAs: Target recognition and regulatory functions. Cell. 136 (2), 215–233. doi:10.1016/j.cell.2009.01.002
Bracken, C. P., Scott, H. S., and Goodall, G. J. (2016). A network-biology perspective of microRNA function and dysfunction in cancer. Nat. Rev. Genet. 17 (12), 719–732. doi:10.1038/nrg.2016.134
Calin, G. A., and Croce, C. M. (2006). MicroRNA signatures in human cancers. Nat. Rev. Cancer 6 (11), 857–866. doi:10.1038/nrc1997
Carleton, M., Cleary, M. A., and Linsley, P. S. (2007). MicroRNAs and cell cycle regulation. Cell. cycle 6 (17), 2127–2132. doi:10.4161/cc.6.17.4641
Chen, X., Liu, M.-X., and Yan, G.-Y. (2012). Rwrmda: Predicting novel human microRNA–disease associations. Mol. Biosyst. 8 (10), 2792–2798. doi:10.1039/c2mb25180a
Chen, X., Sun, L.-G., and Zhao, Y. (2021). Ncmcmda: miRNA–disease association prediction through neighborhood constraint matrix completion. Brief. Bioinform. 22 (1), 485–496. doi:10.1093/bib/bbz159
Chen, X., Wang, L., Qu, J., Guan, N.-N., and Li, J.-Q. (2018a). Predicting miRNA–disease association based on inductive matrix completion. Bioinformatics 34 (24), 4256–4265. doi:10.1093/bioinformatics/bty503
Chen, X., Yan, C. C., Zhang, X., You, Z.-H., Deng, L., Liu, Y., et al. (2016). Wbsmda: Within and between score for MiRNA-disease association prediction. Sci. Rep. 6 (1), 21106–21109. doi:10.1038/srep21106
Chen, X., and Yan, G.-Y. (2014). Semi-supervised learning for potential human microRNA-disease associations inference. Sci. Rep. 4 (1), 5501–5510. doi:10.1038/srep05501
Chen, X., Yin, J., Qu, J., and Huang, L. (2018b). Mdhgi: Matrix decomposition and heterogeneous graph inference for miRNA-disease association prediction. PLoS Comput. Biol. 14 (8), e1006418. doi:10.1371/journal.pcbi.1006418
Cheng, A. M., Byrom, M. W., Shelton, J., and Ford, L. P. (2005). Antisense inhibition of human miRNAs and indications for an involvement of miRNA in cell growth and apoptosis. Nucleic Acids Res. 33 (4), 1290–1297. doi:10.1093/nar/gki200
Gao, Z., Wang, Y.-T., Wu, Q.-W., Ni, J.-C., and Zheng, C.-H. (2020). Graph regularized L 2, 1-nonnegative matrix factorization for miRNA-disease association prediction. BMC Bioinforma. 21 (1), 61–13. doi:10.1186/s12859-020-3409-x
Ge, J., Chen, Z., Li, R., Lu, T., and Xiao, G. (2014). Upregulation of microRNA-196a and microRNA-196b cooperatively correlate with aggressive progression and unfavorable prognosis in patients with colorectal cancer. Cancer Cell. Int. 14 (1), 128–8. doi:10.1186/s12935-014-0128-2
He, J., Xie, G., Tong, J., Peng, Y., Huang, H., Li, J., et al. (2014). Overexpression of microRNA-122 re-sensitizes 5-FU-resistant colon cancer cells to 5-FU through the inhibition of PKM2 in vitro and in vivo. Cell. biochem. Biophys. 70 (2), 1343–1350. doi:10.1007/s12013-014-0062-x
He, X., Deng, K., Wang, X., Li, Y., Zhang, Y., and Wang, M. (2020). “Lightgcn: Simplifying and powering graph convolution network for recommendation,” in Proceedings of the 43rd International ACM SIGIR conference on research and development in Information Retrieval), 639–648.
Huang, H.-Y., Lin, Y.-C.-D., Li, J., Huang, K.-Y., Shrestha, S., Hong, H.-C., et al. (2020). miRTarBase 2020: updates to the experimentally validated microRNA–target interaction database. Nucleic Acids Res. 48 (D1), D148–D154. doi:10.1093/nar/gkz896
Huang, Z., Shi, J., Gao, Y., Cui, C., Zhang, S., Li, J., et al. (2019). HMDD v3. 0: A database for experimentally supported human microRNA–disease associations. Nucleic Acids Res. 47 (D1), D1013–D1017. doi:10.1093/nar/gky1010
Hwang, S., Kim, C. Y., Yang, S., Kim, E., Hart, T., Marcotte, E. M., et al. (2019). HumanNet v2: Human gene networks for disease research. Nucleic Acids Res. 47 (D1), D573–D580. doi:10.1093/nar/gky1126
Ji, B.-Y., You, Z.-H., Wang, Y., Li, Z.-W., and Wong, L. (2021). DANE-MDA: Predicting microRNA-disease associations via deep attributed network embedding. Iscience 24 (6), 102455. doi:10.1016/j.isci.2021.102455
Jiang, Q., Hao, Y., Wang, G., Juan, L., Zhang, T., Teng, M., et al. (2010). Prioritization of disease microRNAs through a human phenome-microRNAome network. BMC Syst. Biol. 4 (1), S2–S9. doi:10.1186/1752-0509-4-S1-S2
Jin, C., Shi, Z., Lin, K., and Zhang, H. (2022). Predicting miRNA-disease association based on neural inductive matrix completion with graph autoencoders and self-attention mechanism. Biomolecules 12 (1), 64. doi:10.3390/biom12010064
Kipf, T. N., and Welling, M. (2016). Semi-supervised classification with graph convolutional networks. arXiv preprint arXiv:1609.02907.
Kang, C., Zhang, H., Liu, Z., Huang, S., and Yin, Y. (2022). LR-GNN: A graph neural network based on link representation for predicting molecular associations. Brief. Bioinform. 23 (1), bbab513. doi:10.1093/bib/bbab513
Kingma, D. P., and Ba, J. (2014). Adam: A method for stochastic optimization. arXiv preprint arXiv:1412.6980.
Kozomara, A., Birgaoanu, M., and Griffiths-Jones, S. (2019). miRBase: from microRNA sequences to function. Nucleic Acids Res. 47 (D1), D155–D162. doi:10.1093/nar/gky1141
Lee, I., Blom, U. M., Wang, P. I., Shim, J. E., and Marcotte, E. M. (2011). Prioritizing candidate disease genes by network-based boosting of genome-wide association data. Genome Res. 21 (7), 1109–1121. doi:10.1101/gr.118992.110
Li, J.-Q., Rong, Z.-H., Chen, X., Yan, G.-Y., and You, Z.-H. (2017). Mcmda: Matrix completion for MiRNA-disease association prediction. Oncotarget 8 (13), 21187–21199. doi:10.18632/oncotarget.15061
Li, J., Zhang, S., Liu, T., Ning, C., Zhang, Z., and Zhou, W. (2020). Neural inductive matrix completion with graph convolutional networks for miRNA-disease association prediction. Bioinformatics 36 (8), 2538–2546. doi:10.1093/bioinformatics/btz965
Maierthaler, M., Benner, A., Hoffmeister, M., Surowy, H., Jansen, L., Knebel, P., et al. (2017). Plasma miR‐122 and miR‐200 family are prognostic markers in colorectal cancer. Int. J. Cancer 140 (1), 176–187. doi:10.1002/ijc.30433
Metzinger-Le Meuth, V., and Metzinger, L. (2019). miR-223 and other miRNA's evaluation in chronic kidney disease: innovative biomarkers and therapeutic tools. Noncoding. RNA Res. 4 (1), 30–35. doi:10.1016/j.ncrna.2019.01.002
Miska, E. A. (2005). How microRNAs control cell division, differentiation and death. Curr. Opin. Genet. Dev. 15 (5), 563–568. doi:10.1016/j.gde.2005.08.005
Needleman, S. B., and Wunsch, C. D. (1970). A general method applicable to the search for similarities in the amino acid sequence of two proteins. J. Mol. Biol. 48 (3), 443–453. doi:10.1016/0022-2836(70)90057-4
Ou-Yang, L., Lu, F., Zhang, Z.-C., and Wu, M. (2022). Matrix factorization for biomedical link prediction and scRNA-seq data imputation: An empirical survey. Brief. Bioinform. 23 (1), bbab479. doi:10.1093/bib/bbab479
Peng, J., Hui, W., Li, Q., Chen, B., Hao, J., Jiang, Q., et al. (2019). A learning-based framework for miRNA-disease association identification using neural networks. Bioinformatics 35 (21), 4364–4371. doi:10.1093/bioinformatics/btz254
Piñero, J., Ramírez-Anguita, J. M., Saüch-Pitarch, J., Ronzano, F., Centeno, E., Sanz, F., et al. (2020). The DisGeNET knowledge platform for disease genomics: 2019 update. Nucleic Acids Res. 48 (D1), D845–D855. doi:10.1093/nar/gkz1021
Schimanski, C. C., Frerichs, K., Rahman, F., Berger, M., Lang, H., Galle, P. R., et al. (2009). High miR-196a levels promote the oncogenic phenotype of colorectal cancer cells. World J. Gastroenterol. 15 (17), 2089–2096. doi:10.3748/wjg.15.2089
Sereshgi, M. M. A., Abdollahpour-Alitappeh, M., Mahdavi, M., Ranjbar, R., Ahmadi, K., Taheri, R. A., et al. (2019). Immunologic balance of regulatory T cell/T helper 17 responses in gastrointestinal infectious diseases: Role of miRNAs. Microb. Pathog. 131, 135–143. doi:10.1016/j.micpath.2019.03.029
Sheng, N., Huang, L., Wang, Y., Zhao, J., Xuan, P., Gao, L., et al. (2022). Multi-channel graph attention autoencoders for disease-related lncRNAs prediction. Brief. Bioinform. 23 (2), bbab604. doi:10.1093/bib/bbab604
Siegel, R. L., Miller, K. D., and Jemal, A. (2016). Cancer statistics, 2016. Ca. Cancer J. Clin. 66 (1), 7–30. doi:10.3322/caac.21332
Small, E. M., and Olson, E. N. (2011). Pervasive roles of microRNAs in cardiovascular biology. Nature 469 (7330), 336–342. doi:10.1038/nature09783
Sun, L., Liu, X., Pan, B., Hu, X., Zhu, Y., Su, Y., et al. (2020). Serum exosomal miR-122 as a potential diagnostic and prognostic biomarker of colorectal cancer with liver metastasis. J. Cancer 11 (3), 630–637. doi:10.7150/jca.33022
Tang, X., Luo, J., Shen, C., and Lai, Z. (2021). Multi-view multichannel attention graph convolutional network for miRNA–disease association prediction. Brief. Bioinform. 22 (6), bbab174. doi:10.1093/bib/bbab174
Wang, D., Wang, J., Lu, M., Song, F., and Cui, Q. (2010a). Inferring the human microRNA functional similarity and functional network based on microRNA-associated diseases. Bioinformatics 26 (13), 1644–1650. doi:10.1093/bioinformatics/btq241
Wang, Y. X., Zhang, X. Y., Zhang, B. F., Yang, C. Q., Chen, X. M., and Gao, H. J. (2010b). Initial study of microRNA expression profiles of colonic cancer without lymph node metastasis. J. Dig. Dis. 11 (1), 50–54. doi:10.1111/j.1751-2980.2009.00413.x
Wei, H., and Liu, B. (2020). iCircDA-MF: identification of circRNA-disease associations based on matrix factorization. Brief. Bioinform. 21 (4), 1356–1367. doi:10.1093/bib/bbz057
Xiao, Q., Luo, J., Liang, C., Cai, J., and Ding, P. (2018). A graph regularized non-negative matrix factorization method for identifying microRNA-disease associations. Bioinformatics 34 (2), 239–248. doi:10.1093/bioinformatics/btx545
Xiao, Q., Zhang, N., Luo, J., Dai, J., and Tang, X. (2021). Adaptive multi-source multi-view latent feature learning for inferring potential disease-associated miRNAs. Brief. Bioinform. 22 (2), 2043–2057. doi:10.1093/bib/bbaa028
Xu, J., Li, C.-X., Lv, J.-Y., Li, Y.-S., Xiao, Y., Shao, T.-T., et al. (2011). Prioritizing candidate disease miRNAs by topological features in the miRNA target–dysregulated network: Case study of prostate cancer. Mol. Cancer Ther. 10 (10), 1857–1866. doi:10.1158/1535-7163.MCT-11-0055
Xu, J., and Li, Y. (2006). Discovering disease-genes by topological features in human protein–protein interaction network. Bioinformatics 22 (22), 2800–2805. doi:10.1093/bioinformatics/btl467
Xuan, P., Han, K., Guo, M., Guo, Y., Li, J., Ding, J., et al. (2013). Prediction of microRNAs associated with human diseases based on weighted k most similar neighbors. PloS one 8 (8), e70204. doi:10.1371/journal.pone.0070204
Yang, Z., Wu, L., Wang, A., Tang, W., Zhao, Y., Zhao, H., et al. (2017). dbDEMC 2.0: updated database of differentially expressed miRNAs in human cancers. Nucleic Acids Res. 45 (D1), D812–D818. doi:10.1093/nar/gkw1079
You, Z.-H., Huang, Z.-A., Zhu, Z., Yan, G.-Y., Li, Z.-W., Wen, Z., et al. (2017). Pbmda: A novel and effective path-based computational model for miRNA-disease association prediction. PLoS Comput. Biol. 13 (3), e1005455. doi:10.1371/journal.pcbi.1005455
Yu, Z., Huang, F., Zhao, X., Xiao, W., and Zhang, W. (2021). Predicting drug–disease associations through layer attention graph convolutional network. Brief. Bioinform. 22 (4), bbaa243. doi:10.1093/bib/bbaa243
Zhang, S., Ma, A., Zhao, J., Xu, D., Ma, Q., and Wang, Y. (2022). Assessing deep learning methods in cis-regulatory motif finding based on genomic sequencing data. Brief. Bioinform. 23 (1), bbab374. doi:10.1093/bib/bbab374
Zhang, Z.-C., Zhang, X.-F., Wu, M., Ou-Yang, L., Zhao, X.-M., and Li, X.-L. (2020). A graph regularized generalized matrix factorization model for predicting links in biomedical bipartite networks. Bioinformatics 36 (11), 3474–3481. doi:10.1093/bioinformatics/btaa157
Zhao, Y., Chen, X., and Yin, J. (2019). Adaptive boosting-based computational model for predicting potential miRNA-disease associations. Bioinformatics 35 (22), 4730–4738. doi:10.1093/bioinformatics/btz297
Keywords: miRNA-disease associations, multi-view, deep learning, graph convolutional networks, convolutional neural networks
Citation: Xie X, Wang Y, Sheng N, Zhang S, Cao Y and Fu Y (2022) Predicting miRNA-disease associations based on multi-view information fusion. Front. Genet. 13:979815. doi: 10.3389/fgene.2022.979815
Received: 28 June 2022; Accepted: 16 August 2022;
Published: 27 September 2022.
Edited by:
Haiquan Li, University of Arizona, United StatesCopyright © 2022 Xie, Wang, Sheng, Zhang, Cao and Fu. This is an open-access article distributed under the terms of the Creative Commons Attribution License (CC BY). The use, distribution or reproduction in other forums is permitted, provided the original author(s) and the copyright owner(s) are credited and that the original publication in this journal is cited, in accordance with accepted academic practice. No use, distribution or reproduction is permitted which does not comply with these terms.
*Correspondence: Yan Wang, wy6868@jlu.edu.cn