 Wei-Min Chu1,2,3,4,5,6
 Endah Kristiani7,8Yu-Chieh Wang7Yen-Ru Lin7
 Shih-Yi Lin9Wei-Cheng Chan6
 Chao-Tung Yang7,10*Yu-Tse Tsan4,6*
- 1Department of Family Medicine, Taichung Veterans General Hospital, Taichung, Taiwan
- 2School of Medicine, National Yang Ming Chiao Tung University, Taipei, Taiwan
- 3Department of Post-baccalaureate Medicine, College of Medicine, National Chung Hsing University, Taichung, Taiwan
- 4School of Medicine, Chung Shan Medical University, Taichung, Taiwan
- 5Institue of Health Policy and Management, National Taiwan University, Taipei, Taiwan
- 6Department of Occupational Medicine, Taichung Veterans General Hospital, Taichung, Taiwan
- 7Department of Computer Science, Tunghai University, Taichung, Taiwan
- 8Department of Informatics, Krida Wacana Christian University, Jakarta, Indonesia
- 9Center for Geriatrics and Gerontology, Taichung Veterans General Hospital, Taichung, Taiwan
- 10Research Center for Smart Sustainable Circular Economy, Tunghai University, Taichung, Taiwan
Backgrounds: Falls are currently one of the important safety issues of elderly inpatients. Falls can lead to their injury, reduced mobility and comorbidity. In hospitals, it may cause medical disputes and staff guilty feelings and anxiety. We aimed to predict fall risks among hospitalized elderly patients using an approach of artificial intelligence.
Materials and methods: Our working hypothesis was that if hospitalized elderly patients have multiple risk factors, their incidence of falls is higher. Artificial intelligence was then used to predict the incidence of falls of these patients. We enrolled those elderly patients aged >65 years old and were admitted to the geriatric ward during 2018 and 2019, at a single medical center in central Taiwan. We collected 21 physiological and clinical data of these patients from their electronic health records (EHR) with their comprehensive geriatric assessment (CGA). Data included demographic information, vital signs, visual ability, hearing ability, previous medication, and activity of daily living. We separated data from a total of 1,101 patients into 3 datasets: (a) training dataset, (b) testing dataset and (c) validation dataset. To predict incidence of falls, we applied 6 models: (a) Deep neural network (DNN), (b) machine learning algorithm extreme Gradient Boosting (XGBoost), (c) Light Gradient Boosting Machine (LightGBM), (d) Random Forest, (e) Stochastic Gradient Descent (SGD) and (f) logistic regression.
Results: From modeling data of 1,101 elderly patients, we found that machine learning algorithm XGBoost, LightGBM, Random forest, SGD and logistic regression were successfully trained. Finally, machine learning algorithm XGBoost achieved 73.2% accuracy.
Conclusion: This is the first machine-learning based study using both EHR and CGA to predict fall risks of elderly. Multiple risk factors of falls in hospitalized elderly patients can be put into a machine learning model to predict future falls for early planned actions. Future studies should be focused on the model fitting and accuracy of data analysis.
Introduction
The world's population is aging rapidly (1). According to the United Nations, in 2019, 703 million people were aged 65 years or over worldwide with the number kept increasing (2). Taiwan is one the most rapidly aging countries in the world (3). In 2018, 14% of its people were in the aged population and this proportion will reach 20% by 2025, or equivalent to taking only 7 years to switch from an aged society to a super-aged society. Such rapid change causes large amounts of burdens, whether physical, psychological or social (4–6).
Fall is one of the most important concerns in the elderly population, and it is a key geriatric syndrome (7, 8). Over 1/4 of these old people experience falls every year (9). Falls have multiple devastating consequences, both physically and psychologically. Examples include hip fracture (10), head trauma (11), depression, social isolation and loneliness (12), disability (13) and even death (14).
Many important risk factors have been identified among those elderly experiencing falls. Internal risk factors include multimorbidity (15), sarcopenia (16), frailty (17), polypharmacy (18), inappropriate medication (19), malnutrition (20), poor visual acuity (21) and hearing impairment (22). External risk factors include inappropriate clothes, inappropriate shoes, inadequate light, obstacles on the ground (23). Caregivers are also important external risk factors. Kuzuya et al. (24) found that falls were associated with caregiver burden even when controlling for various possible confounding factors. Mamani et al. (25) discovered that caregivers knew about falls and its prevention, but in a superficial way, and it's important to influence their attitudes and practices regarding the prevention of fall.
The prediction of fall risks is essential especially for those healthcare professionals caring for the elderly. Many prediction methods have been proposed, such as Morse Fall Scale (26), STRATIFY Scale (27) and Hendrich Scale (28). Another tool is the short physical performance battery (SPPB) which assesses fall risk by measuring balance, gait, and muscular strength (29). However, these scales do not capture all possible fall risk factors and increase work loads of healthcare professionals in data collection and analysis.
With advancing technology and improved medical informatics, some researchers predicted falls in hospitalized patients based on electronic health records (EHR), but data from HER also have some limitations (30, 31). Since many risk factors have been found and the evolution of computer science and artificial intelligence, many scientists would like to predict falls by means of machine learning (32–35) (Table 1). However, most datasets consisted of relatively healthy people, or young people (36). Furthermore, few of such research have analyzed Asian populations, which have very different socio-economic profiles compared with the western populations. Here, we aimed to build up a fall risk prediction model for the hospitalized elderly based on machine learning, using a combination of EHR and comprehensive geriatric assessment (CGA).
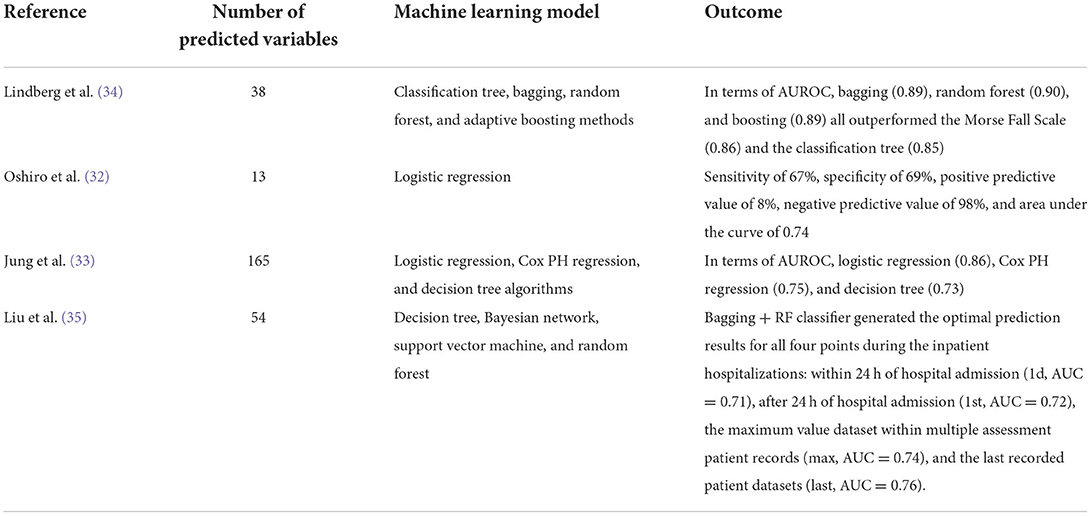
Table 1. Previous researches regarding fall risk prediction by machine learning.
Materials and methods
Dataset
Our research dataset was provided by the Clinical Data Center of Taichung Veterans General Hospital. We enrolled all elderly who were admitted to our geriatric care unit during the period from January 1, 2018 to December 31, 2019. During hospitalization, we collected patients' data regarding their general demographic data, medical history, blood examination, medication information, and CGA. Multiple assessments were performed in CGA for the elderly, including physical evaluation, psychological evaluation, and social evaluation. The parameters of CGA included the patients' demographic information, including age, gender, body mass index (kg/m2), education level, marital status, decision-making individual, caregiving support, and measurement data. The measurement data involved cognitive impairment (defined as scores <24 on the Chinese version of the Mini-Mental State Examination, MMSE), mood disorder (defined by scores ≥2 on the 5-item Chinese Geriatric Depression Scale, GDS-5), medical condition (defined by the Charlson comorbidity index, CCI), polypharmacy (defined as currently using >4 drugs), psychiatric medication (defined as using any antipsychotics, antidepressants or benzodiazepines during admission), malnutrition (defined by scores <12 on the Mini-Nutritional Assessment-Short Form, MNA-SF), physical function (assessed by the Barthel index of Activities of Daily Living, ADL and the Lawton Instrumental Activities of Daily Living Scale, IADL), health-related quality of life (measured by the Chinese version of the EQ-5D system), as well as frailty in accordance with Fried's definition of the frailty phenotype, which was evaluated based upon the presence of three or more criteria: weight loss, low physical activity, exhaustion, weakness (hand grip strength), and slowness (walking speed). In order to avoid redundant data collection from the same person, for those with multiple hospitalization data, only data from the latest hospitalization were retrieved. The final dataset contained a total of 1,115 patients with non-redundant data. Regarding fall incidence, the record of falls was derived from the CGA questionnaire. After the two datasets are merged according to the de-identified ID, we obtained a total of 1,101 records. The study was conducted according to the guidelines of the Declaration of Helsinki, and approved by the Institutional Review Board (or Ethics Committee) of Taichung Veterans General Hospital (protocol code TCVGH-IRB CE20234A and date of approval: Aug 13, 2020).
Machine learning and prediction model development
We used 6 different models to predict fall among elderly. These models included algorithms of random forest, XGBoost, Logistic regression, LightGBM, SDG and DNN.
Random forest
Random Forest belongs to Ensemble Learning. It is an advanced version of decision tree. It consists of multiple decision trees, but there is no relationship between different decision trees. During classification, each new sample will be judged and classified by each decision tree in the forest, and each decision tree will get a classification result. Finally, the random forest gathers all the classification voting results, and counts the number of votes. The highest category is designated as the final result.
The RF equation is as follows:
XGBoost
The full name of XGboost is Extreme Gradient Boosting (Extreme Gradient Boosting). It keeps the original model unchanged in each operation, and then adds a new function to the model, so that the tree generated later can correct the errors of the previous tree. In addition, XGBoost uses random feature extraction when generating trees, so all features will not be used in decision-making every time in tree generation.
The equation of XGBoost is as follows:
Logistic regression
The logistic regression model is a type of linear classifier, which is mainly used in binary classification problems. It is mainly to classify according to the data it has, and to judge the data to determine what category the data belongs to. The output value of the logistic regression model classification needs to be in [0,1].
LightGBM
LightGBM is a gradient boosting framework that uses tree-based learning algorithms. Algorithms supported by the LightGBM framework include: GBT, Gradient boosting decision tree (GBDT), Gradient Boosted Regression Trees (GBRT), Gradient Boosting Machine (GBM), Multiple Additive Regression Trees (MART), and Random Forest (RF). Sparse optimization, parallel training, various loss functions, regularization, bagging, and early halting are some features that LightGBM has over XGBoost. The structure of trees is a significant difference between the two. Unlike most other implementations, LightGBM does not grow a tree row by row. Rather, it grows trees leaf-by-leaf. It selects the leaf that it considers giving the greatest reduction in loss. Furthermore, unlike XGBoost and other implementations, LightGBM does not adopt the commonly used sorted-based decision tree learning algorithm, which searches for the optimum split point of sorted feature values. Furthermore, LightGBM offers a proprietary optimized histogram-based decision tree learning algorithm, which provides good performance and memory savings. Gradient-Based One-Side Sampling (GOSS) and Exclusive Feature Bundling (EFB), two unique techniques used in the LightGBM algorithm, provide modeling with higher speed of execution together with better performance accuracy (37).
DNN
A neural network is a mathematical computing model that imitates the construction of biological neural networks in the field of machine learning. Neural networks perform computations by connecting a large number of neurons to each other.
Data pre-processing
Given the constraint of too many relevant risk factors in establishing an accurate model, it is necessary to screen out the more relevant factors first through data pre-processing. For data classification, insufficient accuracy is likely a problem. In this part, the accuracy needs to be improved through testing and changes of different algorithms. In the model selection of deep learning and machine learning, the feedback of various models to different data factors is considered. Through multi-party testing, while avoiding the problem of overfitting or underfitting of the model to the data, a good model needs to adjust itself or initiate “Early Stopping” and other procedures for proper adjustments.
Spearman's correlation, Pearson's correlation and Kendall's correlation coefficient were used to analyze all features included in the study to show the correlations of each factors.
Since the physiological values have different range intervals in the data set, it is necessary to normalize them and map their values to (0,1) intervals. This normalization improves the convergence speed during model training. The rest of the past medication data and symptom descriptions are encoded by One-Hot Encoding, using 1 and 0 to replace the parameters that are not represented in numbers.
Data analysis by machine learning
Physical examination variables of 1,101 elderly patients were subsequently analyzed. A total of 21 potential factors were used to predict the probability of accidental misses of the elderly in the future. An expert group consisting of geriatrician, clinical physician, professor in informatics and data analyst was gathered before the study. We had regular meeting with members of the expert group, each feature was viewed and discussed by all members and selected from previous experience and research. Data of 1,101 elderly subjects were divided into three sets: training, validation, and test, at a ratio of 3:1:1. The reason why we chose three sets was because we could perform validation and testing after training immediately, and this could increase the effectiveness and usefulness of the model. Previous study also used three sets in detection of glaucomatous optic neuropathy (38). Another study also used three sets design to distinguish endometrial cancer among 926 patients (39).
Several methods are used to evaluate machine learning models. Here, we divide the data set to be used for machine learning into the training data and testing data. For validation data, the training data set is used to train the model, and the validation data set is used to evaluate the training model. Therefore, we can pay attention to the status of model training in real time. Once the model is trained and verified, it can be used for inferencing the model. The final test is performed on the test data set, so that the performance accuracy of the machine learning model can be better revealed.
In this research, we used two approaches to generate the data set. The first approach is a simple cutting of a data of set, i.e., a data set is cut from two face-image data sets, and divided at a ratio of 3:1:1 into the training set, test set, and validation set. At the end of training, the test set that has not been used in the training is fed as input to the model for prediction. The result serves as model one reference for evaluating the accuracy of model prediction.
The second approach is cross validation. During training of machine learning, the training set, validation set and test set are cut at a ratio of 3:1:1 or 7:3. Cross-validation is a method from statistics. In order to avoid errors caused by the model's excessive dependence on specific training and validation sets, the parent data set is cut into a greater number of subsets to allow different combinations of data sets. Some subsets are first arbitrarily selected as training set and validation set. In the next training, different subsets are selected as training set and validation set to minimize modeling errors.
The K-fold cross validation is the most classic and most commonly used method. The K of K-fold is the same as the K of K-mean and KNN, which refers to one Number, a number that can be defined by the user. Figure 3 shows the K-fold verification flow chart when K is equal to 5. We divide the data into three equal parts, the first part is used as the test data for verification, and the remaining two with one copy used for training. In the next round, the second aliquot is used again as the test data for verification, and use the other two for training. After three such rounds, the accuracy results of the three modeling exercises are averaged, or to return to the evaluation index of the problem. The average value provides a fair estimate of the model performance on the overall data set.
Activation function is a non-linear function, to allow neural network models to deal with non-linear features. Commonly used functions are ReLu, Sigmoid (binary classification), Tanh (binary classification), the Softmax (multivariate classification) or the function for ReLu, which we used in this study. It is also known as a linear function of rectifiers like in Supplementary Figure 1. In fact, it is a maximum value function. When the input is <0, the output is 0. When the input is >0, the output is equal to the input. The advantage of the ReLu function is its fast convergence speed compared with the Sigmoid and Tanh functions. When the input is positive, it overcomes the problem of disappearing gradient, but it has disadvantages similar to Sigmoid function. The output of ReLu is not zero-centered. When the input is negative, ReLu is complete. If it is not enabled, it means that as long as the input is a negative number, ReLu will not function.
The full name of the RMSProp optimization algorithm is Root-Mean-Square Prop. The adaptive algorithm proposed by Geoff Hinton updates and changes the iterative calculation according to the gradient and error of its calculated parameters. The calculation formula of RMSProp is as follows:
xi (t): Indicates the parameter updated for the tth time.
γ: Represents the learning rate.
gt, i: indicates the gradient of the first number.
ρt–: Represents the weight of the gradient average of the past t1 time, usually set to 0.9.
E[]: The expected value of the value.
ε: The deviation value to be corrected.
Accordingly, RMSProp introduces a coefficient, which decreases each time at a certain ratio, so that the learning rate can be scaled and corrected based on the formula. Compared with the cumulative square gradient Adagrad, RMSprop calculates the corresponding average value, and alleviates the problem of the Adagrad in its fast drop in learning rate. Hence, the momentum adjustment of RMSProp is better than that of AdaGrad. For convolutional neural networks, an algorithm that can adjust momentum parameters is undoubtedly a good choice. RMSProp is known to be a practical and effective deep learning network optimizer in practical applications and comparison tests.
Adam's name comes from Adaptive Moment Estimation, which combines Adagrad and RMSProp and performs correction of deviation terms. It retains the learning rate of RMSProp to calculate the adaptive parameters based on the average value of the first-order matrix, and also makes full use of the average value of the second-order matrix of the gradient, thereby controlling the attenuation rate. Adam's calculation formula is as follows:
x(t): Indicates the i-th updated parameter.
γ: Represents the learning rate.
mt: Represents the first-order momentum difference function of the gradient.
vt: Represents the gradient second-order momentum difference function.
β1: Adjustable parameter, usually set to 0.9.
β2: Adjustable parameters, usually set to 0.999.
ε: The deviation value to be corrected, usually set to 10−8.
When the gradient matrix is sparse, the application of Adam's second-order momentum difference and the correction of its deviation value allows it to perform faster than the RMSProp algorithm. Therefore, in the absence of special circumstances or requirements, Adam's method is typically the first choice.
After settings of the startup function, loss function and optimizer, one can adjust the number of neural layers of the machine learning model and the number of neurons at each neural network layer. Generally speaking, adding more neural layers and neurons for model training based on the number of elements, the more features can be learned. But it is also more likely to over fitting. At this time, the regular processing needs to be used, as will be described later, like the discarding method, and L1 and L2 conventional methods.
The mathematics behind the normalization is to add a normalized term after the original loss function, the purpose is to generate a smoother function.
L1 normalization is to take the absolute value of all the parameters in the model. Mathematically, because the absolute value cannot be differentiated, the difference of >0 is roughly differentiated as the derivative of 1, <0 is−1, as expressed by the sgn function.
After adding to the new loss function a term of normalization for the partial differentiation of each parameter wi, every time when updating the parameter wi, an ηλsgn(wi) will be deducted from the expression. Let the parameter wi be close to 0.
The model in the Supplementary Figure 2 is a linear regression. The blue is the contour line encountered during the optimization process. A circle represents an objective function value. The center of the circle is the sample concern value, the radius is the error value, and the restricted condition is the red boundary. The intersection of the two is the optimal parameter. The Figure shows that optimal parameters can only be on the coordinate axis, so there will be 0 weight parameters, making the model sparse.
L1 normalization simplifies the complexity of the model, sets those useless weights to 0, saving those weights that the model considers important. The sparse nature derived from L1 normalization has been widely used in feature selection mechanisms. Feature selection picks meaningful features from the available feature subset, simplifying machine learning problems.
L2 normalization is the sum of all the parameters in the model. Mathematically, the new loss function with the term of normalization is added. After the partial differentiation of the two parameters wi, each time with updating the parameter wi, it will be multiplied by (1–in front of wiηλ). Because the η heels λ are very small values, (1–ηλ) is about 0.99, which though <1, is very close to 1.
The model in the Supplementary Figure 3 is a linear regression. The blue is the contour line encountered during the optimization process. A circle represents an objective function value. The center of the circle is the sample concern value, the radius is the error value, and the restricted condition is the red boundary. The intersection of the two is the optimal parameter. From the Figure, it can be seen that the optimal parameters can only be on the coordinate axis, achieving a balance between w1 and w2 and reducing over-fitting.
L2 normalization also simplifies the model, but instead of leaving only a certain weight, it weakens all weights and makes all weights and neurons active. Make the weight smaller each time, which is called weight decay, the L2 regularization mainly prevents model overfitting.
The hyperparameters used for best modeling were as follows: max_depth = 6, learning_rate = 0.300000012, subsample = 1, colsample_bylevel = 1, colsample_bytree = 1, min_child_weight = 1, gamma = 0, scale_pos_weight = 1.
Results
Table 2 shows the demographic and clinical characteristics of 1,101 elderly patients, including 349 fallers and 752 non-fallers. Their mean age was 86.08 years old, with females predominant (60.4%). There were no significantly different among features between faller and non-fallers. However, fallers had lower ADL, lower IADL and more sleep disturbance than non-fallers, with significant difference.
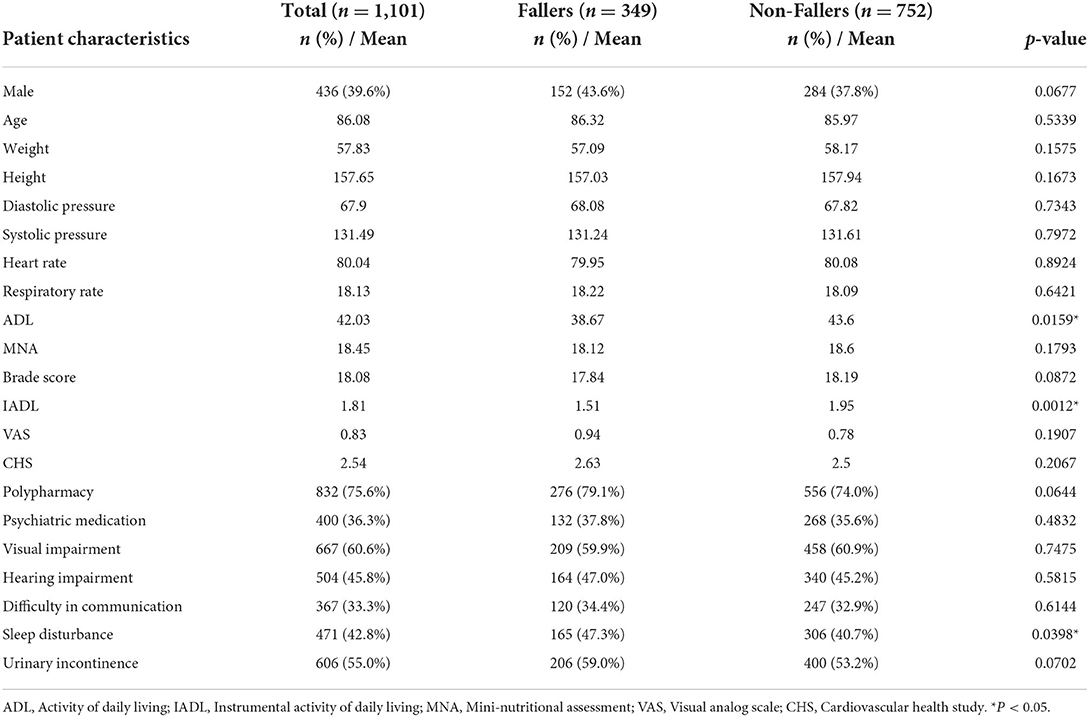
Table 2. Demographics and clinical factors of participants.
Table 3 shows the difference of accuracy, AUC, sensitivity and specificity among all models, including XGBoost, LightGBM, Random Forest, Logistic regression, SGD and DNN. In the deep learning algorithm, 5-layer neural networks are used for stacking (Supplementary Figure 4). After the experiment is completed, if the number of layers continues to be superimposed, it will cause the model to be overfitting. The fitting situation occurs, so this project only constructs a 5-layer neural network model for prediction, and the test set is used to verify the accuracy of 73.2%. When training the model for the second time, we removed the 10 least important factors in F-Score and retrained the model. But the model effect was almost the same as the first time, and the verification accuracy on the test set was again 73.2%.
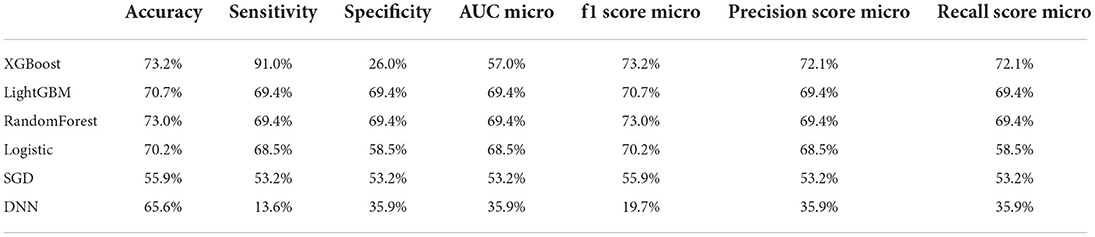
Table 3. Accuracy, sensitivity, specificity, AUC and other predictive value of all prediction models.
In the machine learning algorithm XGBoost, the maximum depth of each tree is set to 6 layers. Although increasing this value will complicate the model, it more likely over-fits. Classifying through the algorithm, the importance of the features in the classification process is calculated. From Figure 1, we found that IADL, Brade score, ADL, age and systolic pressure have a higher F-score compared to other feature factors. Results showed that these 5 features are the priority classification factors of the decision tree. Accuracy of multiple features in different prediction models are shown in Figure 2. It revealed that with only 15 features, XGBoost model gave the highest accuracy (73.0%). For the model XGBoost, we calculated 95% CI for accuracy, sensitivity, specificity and auROC (Supplementary Table 1). Independent testing was performed for XGBoost model (Supplementary Table 2). We've also calculated the predictive performance based on the top 5 features in XGBoost model, and the accuracy was 70.7% (Supplementary Table 3).

Figure 1. Feature of importance of all 21 features in XGBoost model. IADL, Instrumental activity of daily living; ADL, Activity of daily living; SP, Systolic pressure; DP, Diastolic pressure; VAS, Visual analog scale; HR, Heart rate; CD, Communication disturbance; RR, Respiratory rate; MNA, Mini nutritional assessment; VI, Visual impairment; CHS, Cardiovascular health study; SD, Sleep disturbance; HI, Hearing impairment; PM, Psychiatric medication; UI, Urinary incontinence.
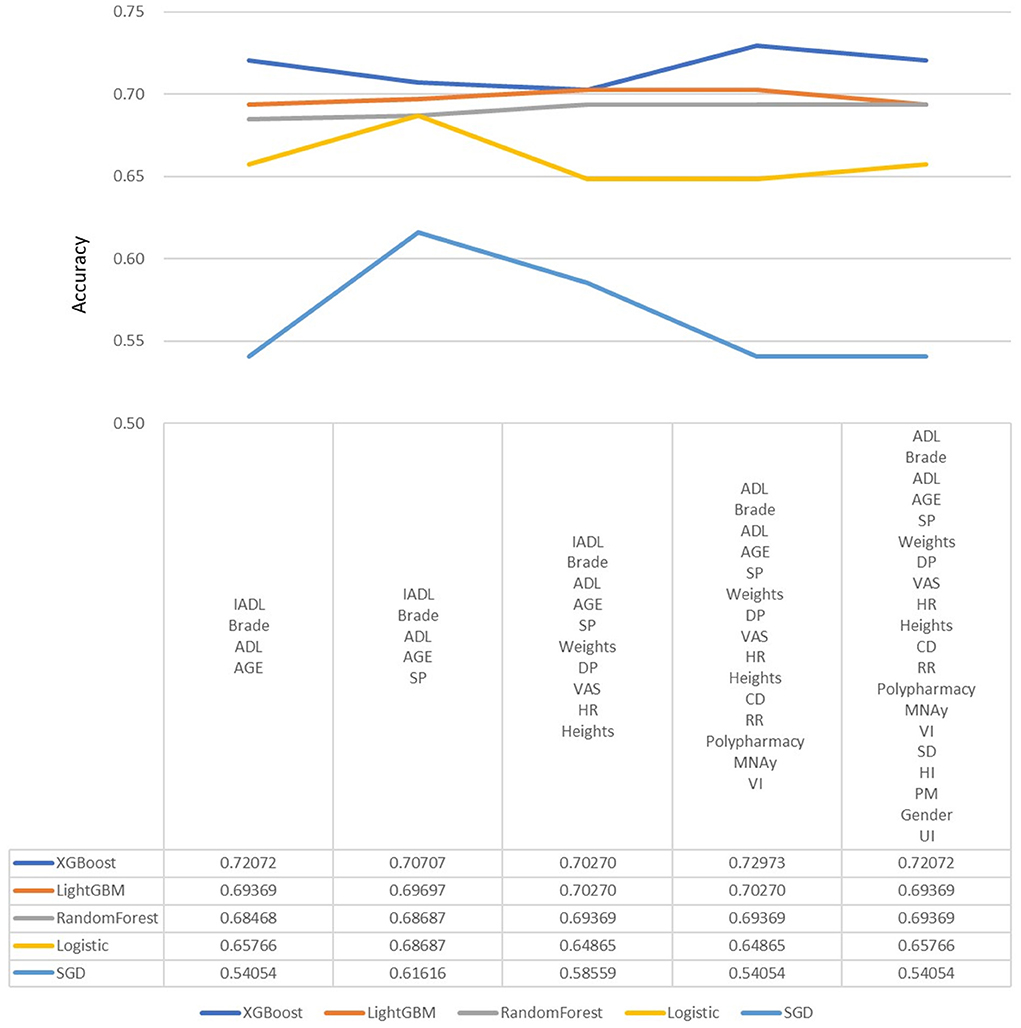
Figure 2. Predictive accuracy for combined different features in different machine learning models. DP, Diastolic pressure; ADL, Activity of daily living; HR, Heart rate; SP, Systolic pressure; IADL, Instrumental activity of daily living; CHS, Cardiovascular health study; MNA, Mini nutritional assessment; VAS, Visual analog scale; RR, Respiratory rate; CD, Communication disturbance; VI, Visual impairment; SD, Sleep disturbance; HI, Hearing impairment; UI, Urinary incontinence; PM, Psychiatric medication.
Figure 3 shows the ROC curve of XGBoost, and Figures 4–7 show ROC curve of LightGBM, RF, Logistic regression and SGD, respectively. Compared with other models, XGBoost had best auROC.
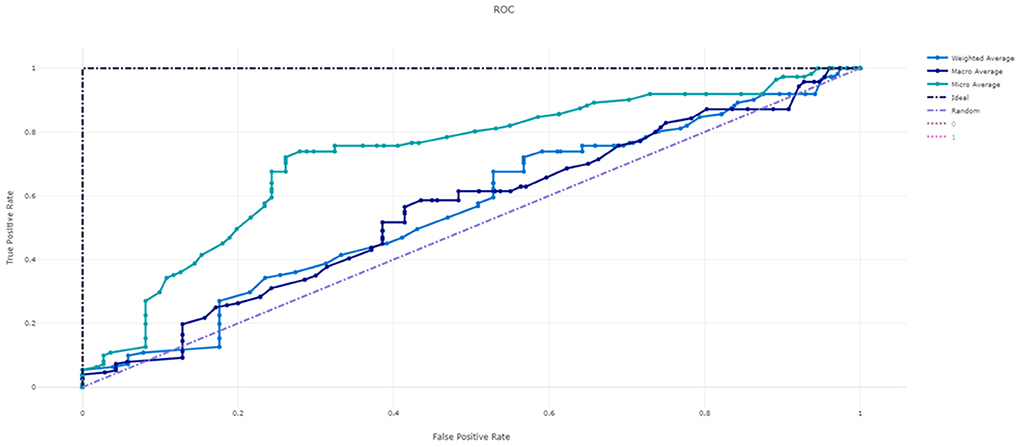
Figure 3. ROC curve of XGBoost model predicting fall risk among hospitalized elderly.
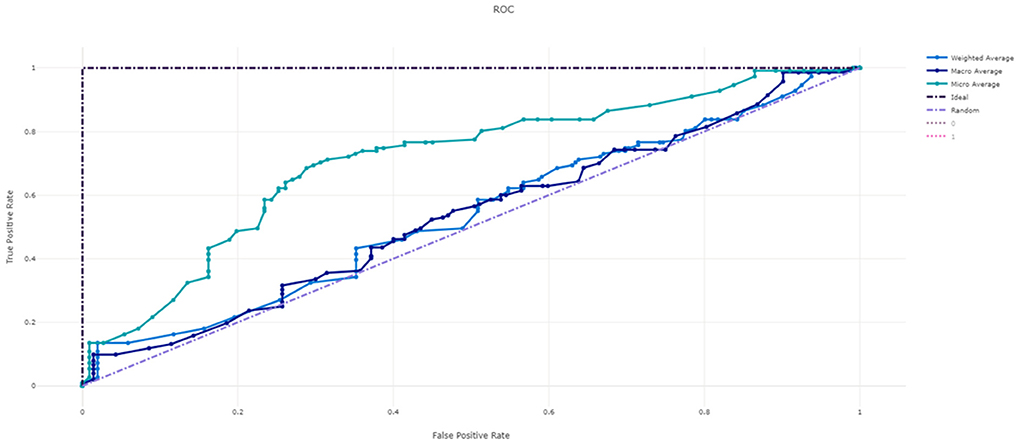
Figure 4. ROC curve of LightGBM model predicting fall risk among hospitalized elderly.
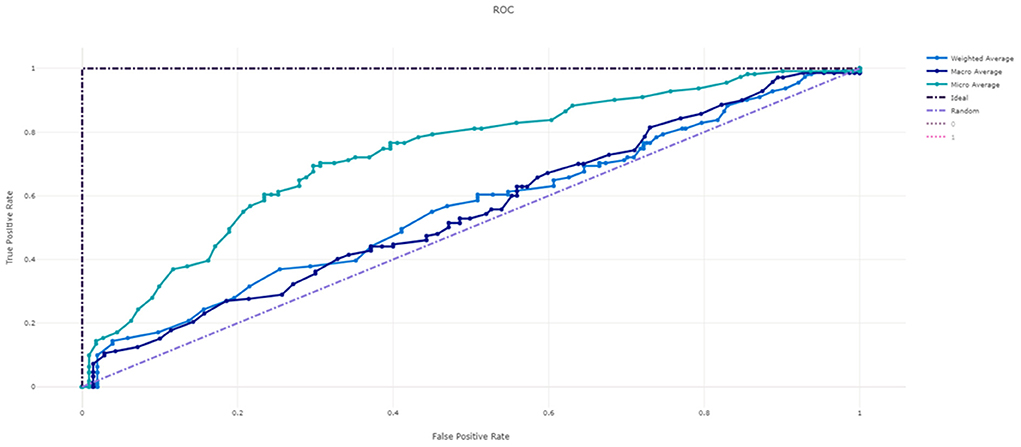
Figure 5. ROC curve of Random Forest model predicting fall risk among hospitalized elderly.
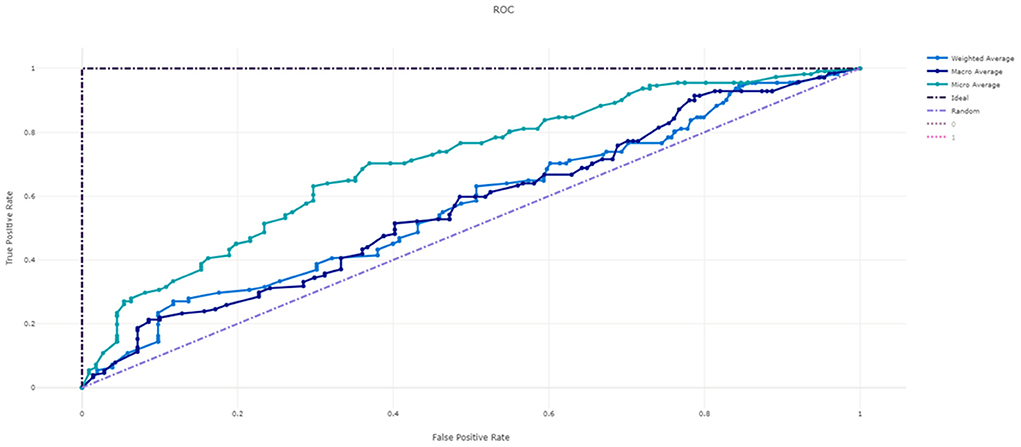
Figure 6. ROC curve of Logistic Regression model predicting fall risk among hospitalized elderly.
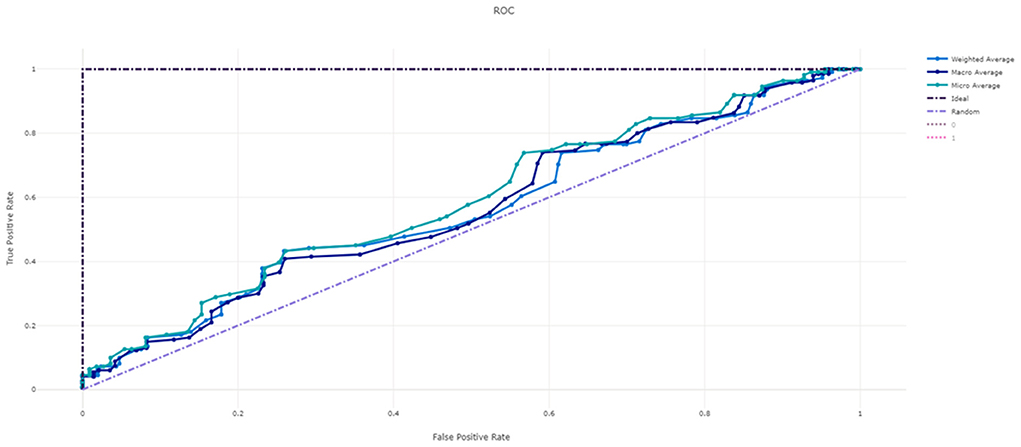
Figure 7. ROC curve of SGD model predicting fall risk among hospitalized elderly.
Pearson's correlation, Spearman's correlation and Kendall's correlation coefficient were used to analyze all features included in the study, as Figures 8–10. From Pearson's correlation, gender, weight, systolic pressure, diastolic pressure were highly related to ADL, IADL, MNA, Brade score, VAS and CHS from CGA. While age, heart rate (HR) and respiratory rate (RR) were highly related to polypharmacy, psychiatric medication (PM), visual impairment (VI), hearing impairment (HI), communication disturbance (CD), sleep disturbance (SD) and urinary incontinence (UI). Fall was positively related to age, HR, RR, polypharmacy, PM, VI, HI, CD, SD and UI, while negatively related to weight, diastolic pressure (DP), systolic pressure (SP), ADL, IADL, MNA, Brade score, VAS and CHS.
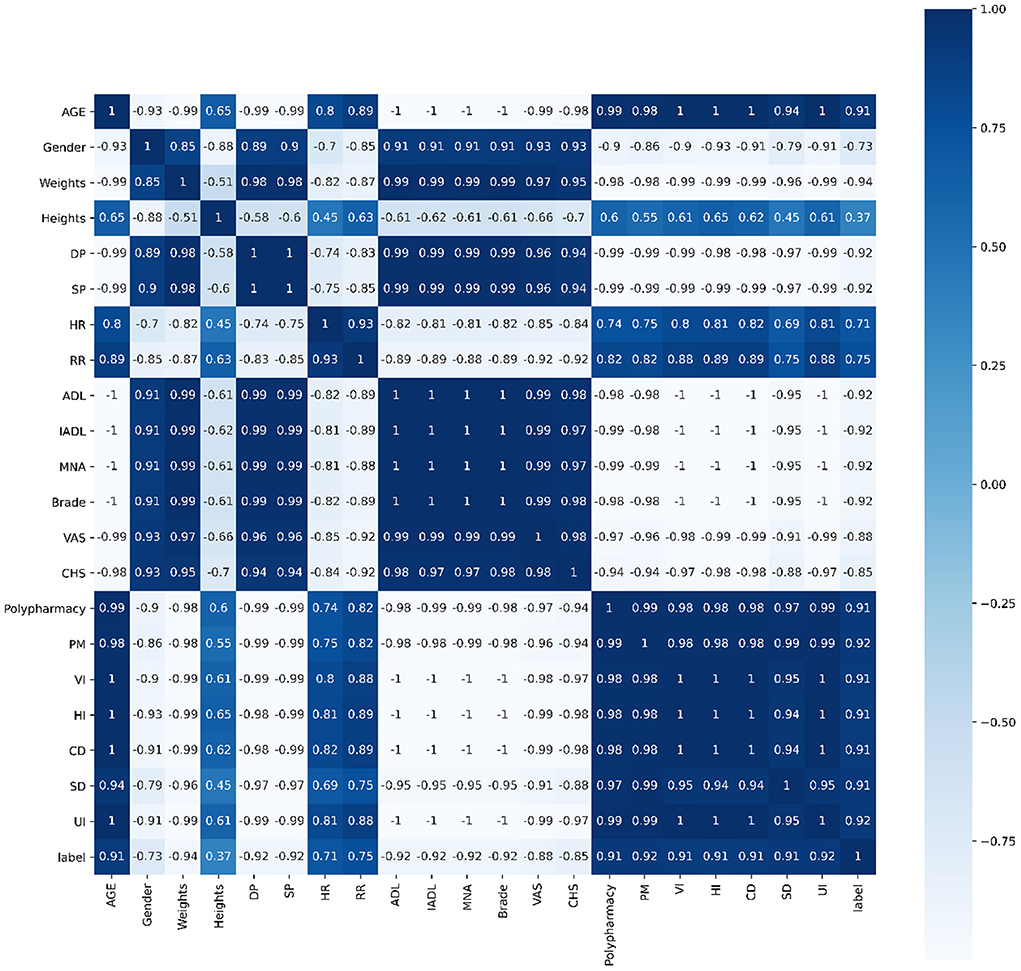
Figure 8. Pearson's correlation of all 21 features.
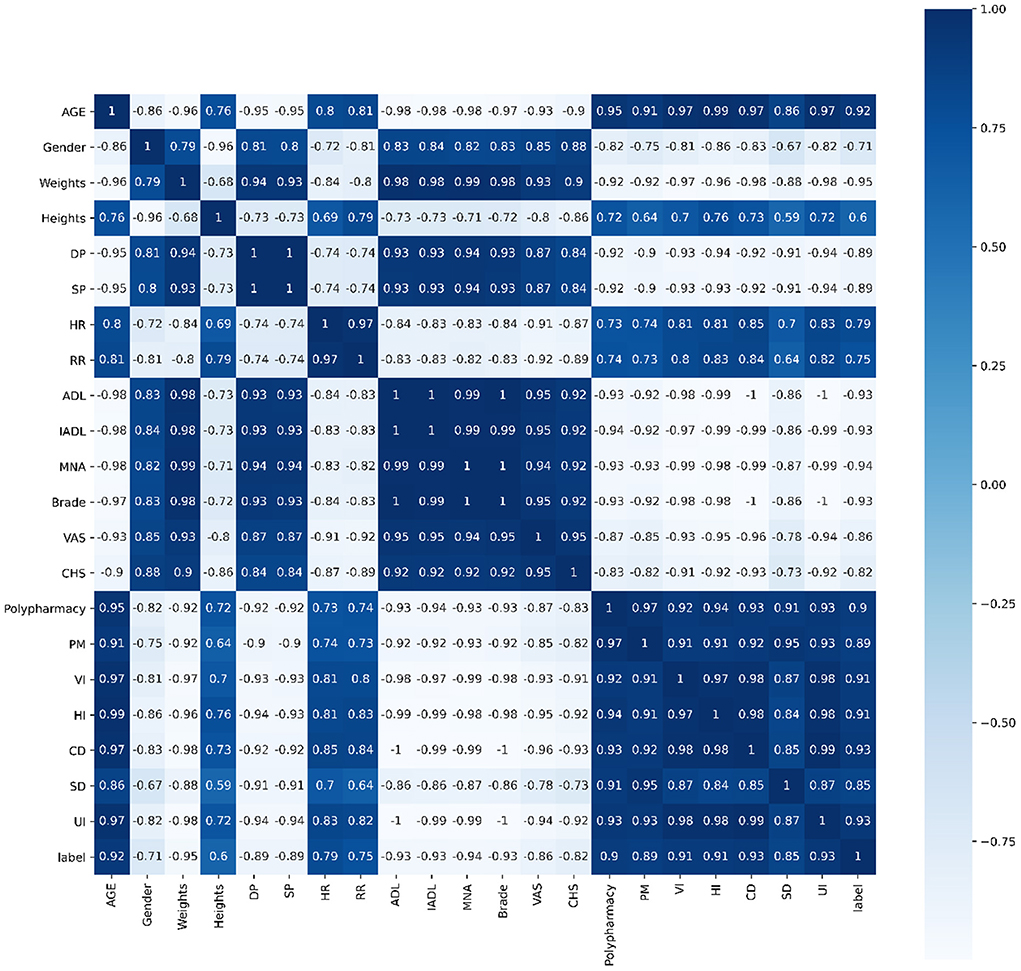
Figure 9. Spearman's correlation of all 21 features.
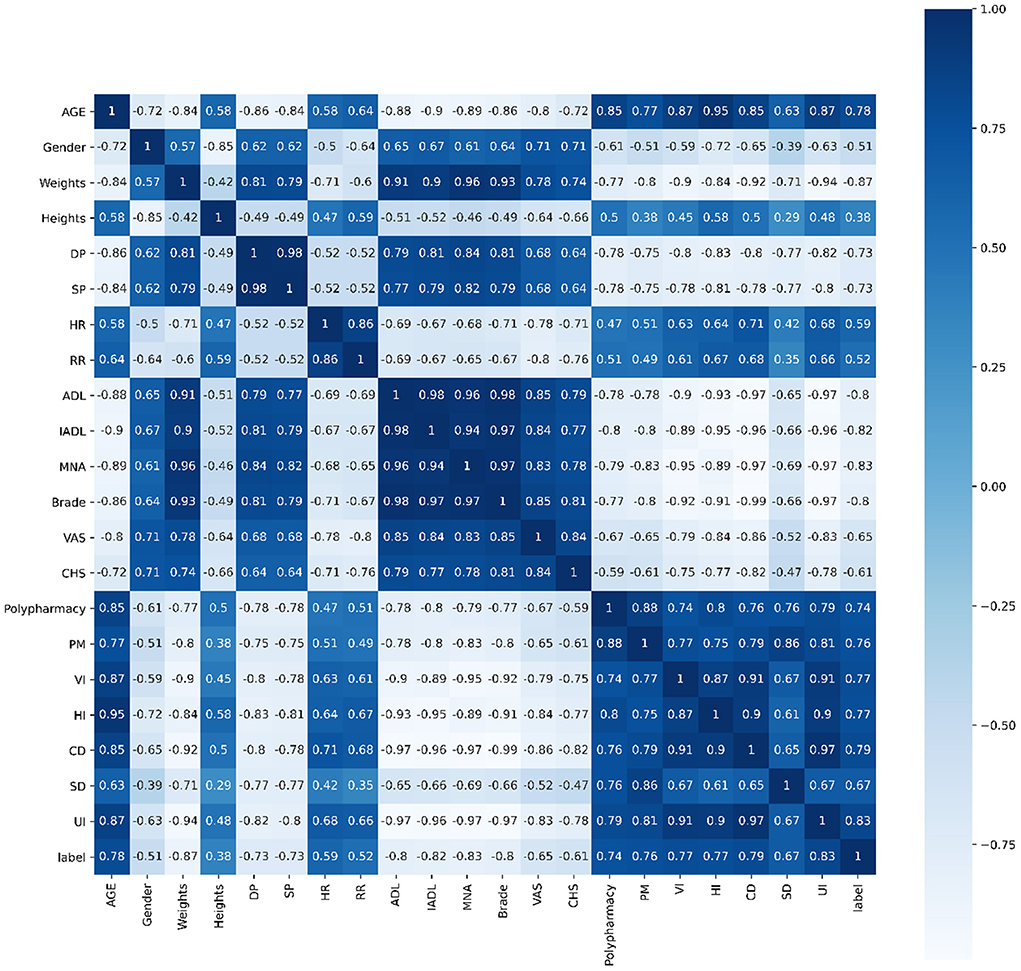
Figure 10. Kendall's correlation of all 21 features.
Discussion
In this study we adopted data analysis combined with machine learning and deep learning to analyze general factors from EHR and CGA of hospitalized elderly patients. The model predicted the risk of falls, facilitating medical staff to make hierarchical management and fall prevention strategies to reduce the elderly both in hospitalization and subsequent falls. The aim of this work is to predict fall risks among hospitalized elderly patients using an approach of artificial intelligence. Results from our study revealed that the top 5 features of importance to predict fall are IADL, Brade score, ADL, age and systolic pressure. Findings suggest that healthcare professionals treating elderly should focus more on these 5 features, as they could present risks of future falls.
Results of our study are different from previous studies exploring fall risks among elderly based on analyzing electronic health records. Lindberg et al., reported that history of falls, age, Morse Fall Scale total score, mental status, unit type, gait/transferring and the number of high risk FRIDs are the most relevant factors across bagging, random forest, and boosting models (34). Ye et al. (40) used XGBoost algorithm to capture 157 impactful predictors into their final predictive model, and identified the top-5 strongest predictors of the future fall event as cognitive disorders, abnormalities of gait and balance, Parkinson's disease, fall history and osteoporosis. From the nurses' perspective, Jung et al., reported that dysuria and lower limb weakness are important risk factors predicting fall among elderly using the analysis of logistic regression model and COX PH regression model (33). Our study using CGA demonstrated that ADL and IADL are also two important risk factors of fall risk among the elderly.
Besides, we put different features to calculate accuracy in each model, and it revealed that with only 15 features, XGBoost model gave the highest accuracy. We believed that it's useful to use only 15 features to predict fall among elderly, because it's more difficult to collect data from elderly, especially data of function, frailty and emotional status. Future study is warranted to manage appropriate feature selection to predict fall in different population or different setting.
This is the first study ever done using CGA with machine learning to predict fall risk among elderly. CGA is a multi-dimensional, multi-disciplinary diagnostic and therapeutic process conducted to determine the medical, mental, and functional problems of older people with frailty so that a coordinated and integrated plan for treatment and follow-up can be developed (41). Nowadays, CGA is used widely and regarded as the gold standard for caring for frail older people in hospitals (42). CGA has also been used to identify risk of adverse events such as mortality, functional decline, surgical complications, and chemotherapy toxicity among cancer patients (43). CGA has been used in machine learning to better evaluate older patients with atrial fibrillation (44). Our results showed that CGA is a useful tool for fall prediction, especially for ADL, IADL and Brade score. Future study is warranted for identification and intervention for prevention of fall after machine learning prediction.
There have been multiple fall risk assessment tools such as Morse Fall Scale, STRATIFY and SPPB. However, these tools are with several disadvantages as follows: 1. Their specificity was relatively low, thus there could be some unidentified high risk elderly (45); 2. Not all hospitals use these tools as routine assessments, so the clinical usefulness is doubted; 3. These tools requires time for assessment and data entry, causing more documentation burden (46). In our model, measurements such as systolic pressure, diastolic pressure, height, weight, heart rate, etc. are easily measured. As for some functional assessments such as ADL and IADL that requires more clinician time, they are currently widely accepted assessments by medical facilities and much hospitals integrated them into routine care. Thus, we still believe our model can be applied to other hospital or healthcare organization to prevent future fall of elderly owing to its simplicity and accuracy. However, the assessment and documentation burden are still not solved. Under current development of machine learning and artificial intelligence, we believe that there will be a simple way to measure and predict functional disability of elderly, as some research already did (47).
Our study has some limitations. First, the investigation was limited to data from a single hospital, thus external validity should be interpreted with caution. Further testing our models on data from other hospitals in other regions is needed to establish external validity. Second, some objective data were lacking, such as albumin and hemoglobin levels, and these blood data are likely important factors for predicting fall. Future analyses should include such data for a better model. Third, only 21 features were analyzed to reach best model in the study, this may not reflect real condition of participants. However, we selected 21 features out of CGA and EHR after carefully discussion among the expert group, and we did analyze more features from CGA but the outcome was not promising enough as there were lots of data recording as 1 or 0 in CGA. Future study will be aimed to explore more appropriate features from CGA to reflect true condition of the elderly. Fourth, some important factors related to fall risk were not considered, such as caregiver-related factor. Future project should include those important factors to reach a better fall risk prediction. Fifth, our predictive performance is not as good as previous results. However, the prediction model was used by only 21 features. We believe our model can be applied to prevent future fall of elderly as an applicable and useful approach. We hope that our study could be a touchstone of future researchers interesting in this quality of life among elderly to put more emphasis on function limitations such as ADL and IADL limitation as they are also important feature fall risk from our results.
This is the first machine-learning based study using both electronic health records and comprehensive geriatric assessment to predict fall risks of elderly. Multiple risk factors of falls in hospitalized elderly patients can be put into a machine learning model to predict future falls for early planned actions. The prediction model was used by only 21 features. We believe our model can be applied to other hospital or healthcare organization to prevent future fall of elderly and improve their quality of life.
Conclusion
We predicted fall risks among the hospitalized elderly by combination use of HER and CGA. We found that IADL, Brade score, ADL, age and systolic pressure are 5 important features in the prediction model. The accuracy rate of XGBoost evaluation reached 73.2% based on 21 features. Such a model can be a useful tool due to its simplicity and good accuracy.
In future adjustments of the model, there are several directions. First, we would like to screen the severity of chronic diseases, as chronic diseases cannot be quantified as only 1 or 0 in the model to represent true condition of elderly, to improve even more the accuracy of model prediction. Second, we will explore the application of feature selection in different machine learning models among elderly, because from our results, it was shown that feature selection was complicated as well as important. Third, we will perform validation in different settings, such as post-acute care department or long-term care facilities to validate our models.
Data availability statement
The original contributions presented in the study are included in the article/Supplementary material, further inquiries can be directed to the corresponding authors.
Ethics statement
The study was conducted according to the guidelines of the Declaration of Helsinki and approved by the Institutional Review Board (or Ethics Committee) of Taichung Veterans General Hospital (protocol code TCVGH-IRB CE20234A and date of approval: Aug 13, 2020). Written informed consent for participation was not required for this study in accordance with the national legislation and the institutional requirements.
Author contributions
Y-TT and C-TY conceived of the study and supervised all aspects of its implementation. W-MC completed the analyses and drafted the content. EK and S-YL assisted with the study design and revised the content. Y-CW, W-CC, and Y-RL assisted with the statistical analysis and revised the content. All authors helped to conceptualize ideas, interpret findings, review drafts of the manuscript, contributed to the article, and approved the submitted version.
Funding
This work was supported by Taichung Veterans General Hospital, Taiwan (Grant Number: TCVGH-T1097801 awarded to W-MC). The funders had no role in the design of the study, in the collection, analyses, or interpretation of data, in the writing of the manuscript, or in the decision to publish the results.
Conflict of interest
The authors declare that the research was conducted in the absence of any commercial or financial relationships that could be construed as a potential conflict of interest.
The handling editor W-JL declared a shared affiliation with the author W-MC at the time of review.
Publisher's note
All claims expressed in this article are solely those of the authors and do not necessarily represent those of their affiliated organizations, or those of the publisher, the editors and the reviewers. Any product that may be evaluated in this article, or claim that may be made by its manufacturer, is not guaranteed or endorsed by the publisher.
Supplementary material
The Supplementary Material for this article can be found online at: https://www.frontiersin.org/articles/10.3389/fmed.2022.937216/full#supplementary-material
References
1. Beard JR, Officer A, De Carvalho IA, Sadana R, Pot AM, Michel JP, et al. The World report on ageing and health: a policy framework for healthy ageing. Lancet. (2016) 387:2145–54. doi: 10.1016/S0140-6736(15)00516-4
2. United Nations DOE SA. Population Division. World Population Ageing 2019: Highlights (New York: the United Nations), (2019).
3. Lin YY, Huang CS. Aging in Taiwan: building a society for active aging and aging in Place. Gerontologist. (2016) 56:176–83. doi: 10.1093/geront/gnv107
4. Casey DA. Depression in older adults: a treatable medical condition. Prim Care. (2017) 44:499–510. doi: 10.1016/j.pop.2017.04.007
5. Verbrugge LM, Latham K, Clarke PJ. Aging with disability for midlife and older adults. Res Aging. (2017) 39:741–77. doi: 10.1177/0164027516681051
6. Hu HM. Facing an aging society: Taiwan's Universities in crisis. Gerontol Geriatr Educ. (2020) 41:233–41. doi: 10.1080/02701960.2018.1428576
8. Wu H, Ouyang P. Fall prevalence, time trend and its related risk factors among elderly people in China. Arch Gerontol Geriatr. (2017) 73:294–9. doi: 10.1016/j.archger.2017.08.009
9. Bergen G, Stevens MR, Burns ER. Falls and fall injuries among adults aged ≥65 Years - United States, 2014. MMWR Morb Mortal Wkly Rep. (2016) 65:993–8. doi: 10.15585/mmwr.mm6537a2
10. Koso RE, Sheets C, Richardson WJ, Galanos AN. Hip fracture in the elderly patients: a sentinel event. Am J Hosp Palliat Care. (2018) 35:612–9. doi: 10.1177/1049909117725057
11. Nilsson M, Eriksson J, Larsson B, Odén A, Johansson H, Lorentzon M. Fall risk assessment predicts fall-related injury, hip fracture, and head injury in older adults. J Am Geriatr Soc. (2016) 64:2242–50. doi: 10.1111/jgs.14439
12. Petersen N, König HH, Hajek A. The link between falls, social isolation and loneliness: a systematic review. Arch Gerontol Geriatr. (2020) 88:104020. doi: 10.1016/j.archger.2020.104020
13. Gill TM, Murphy TE, Gahbauer EA, Allore HG. The course of disability before and after a serious fall injury. JAMA Intern Med. (2013) 173:1780–6. doi: 10.1001/jamainternmed.2013.9063
14. Monteiro YCM, Vieira M, Vitorino PVO, Queiroz SJ, Policena GM, Souza A. Trend of fall-related mortality among the elderly. Rev Esc Enferm USP. (2021) 55:e20200069. doi: 10.1590/1980-220x-reeusp-2020-0069
15. Afrin N, Honkanen R, Koivumaa-Honkanen H, Lukkala P, Rikkonen T, Sirola J, et al. Multimorbidity predicts falls differentially according to the type of fall in postmenopausal women. Maturitas. (2016) 91:19–24. doi: 10.1016/j.maturitas.2016.05.004
16. Öztürk ZA, Türkbeyler IH, Abiyev A, Kul S, Edizer B, Datli F, et al. Health-related quality of life and fall risk associated with age-related body composition changes; sarcopenia, obesity and sarcopenic obesity. Intern Med J. (2018) 48:973–81. doi: 10.1111/imj.13935
17. Cheng MH, Chang SF. Frailty as a risk factor for falls among community dwelling people: evidence from a meta-analysis. J Nurs Scholarsh. (2017) 49:529–36. doi: 10.1111/jnu.12322
18. Zaninotto P, Huang YT, Di Gessa G, Abell J, Lassale C, Steptoe A. Polypharmacy is a risk factor for hospital admission due to a fall: evidence from the English longitudinal study of ageing. BMC Public Health. (2020) 20:1804. doi: 10.1186/s12889-020-09920-x
19. Yoshikawa A, Ramirez G, Smith ML, Foster M, Nabil AK, Jani SN, et al. Opioid use and the risk of falls, fall injuries and fractures among older adults: a systematic review and meta-analysis. J Gerontol A Biol Sci Med Sci. (2020) 75:1989–95. doi: 10.1093/gerona/glaa038
20. Eglseer D, Hoedl M, Schoberer D. Malnutrition risk and hospital-acquired falls in older adults: A cross-sectional, multicenter study. Geriatr Gerontol Int. (2020) 20:348–53. doi: 10.1111/ggi.13885
21. Saftari LN, Kwon OS. Ageing vision and falls: a review. J Physiol Anthropol. (2018) 37:11. doi: 10.1186/s40101-018-0170-1
22. Criter RE, Gustavson M. Subjective hearing difficulty and fall risk. Am J Audiol. (2020) 29:384–90. doi: 10.1044/2020_AJA-20-00006
23. Secretariat MA. Prevention of falls and fall-related injuries in community-dwelling seniors: an evidence-based analysis. Ont Health Technol Assess Ser. (2008) 8:1–78.
24. Kuzuya M, Masuda Y, Hirakawa Y, Iwata M, Enoki H, Hasegawa J, et al. Falls of the elderly are associated with burden of caregivers in the community. Int J Geriatr Psychiatry. (2006) 21:740–5. doi: 10.1002/gps.1554
25. Mamani ARN, Reiners AAO, Azevedo RCS, Vechia A, Segri NJ, Cardoso JDC, et al. Elderly caregiver: knowledge, attitudes and practices about falls and its prevention. Rev Bras Enferm. (2019) 72:119–26. doi: 10.1590/0034-7167-2018-0276
26. Jewell VD, Capistran K, Flecky K, Qi Y, Fellman S. Prediction of falls in acute care using the morse fall risk scale. Occup Ther Health Care. (2020) 34:307–19. doi: 10.1080/07380577.2020.1815928
27. Oliver D, Britton M, Seed P, Martin FC, Hopper AH. Development and evaluation of evidence based risk assessment tool (STRATIFY) to predict which elderly inpatients will fall: case-control and cohort studies. BMJ. (1997) 315:1049–53. doi: 10.1136/bmj.315.7115.1049
28. Swartzell KL, Fulton JS, Friesth BM. Relationship between occurrence of falls and fall-risk scores in an acute care setting using the Hendrich II fall risk model. Medsurg Nurs. (2013) 22:180–7.
29. Veronese N, Bolzetta F, Toffanello ED, Zambon S, De Rui M, Perissinotto E, et al. Association between short physical performance battery and falls in older people: the progetto veneto anziani study. Rejuvenation Res. (2014) 17:276–84. doi: 10.1089/rej.2013.1491
30. Marier A, Olsho LEW, Rhodes W, Spector WD. Improving prediction of fall risk among nursing home residents using electronic medical records. J Am Med Inform Assoc. (2015) 23:276–82. doi: 10.1093/jamia/ocv061
31. Kang L, Chen X, Han P, Ma Y, Jia L, Fu L, et al. A screening tool using five risk factors was developed for fall-risk prediction in Chinese community-dwelling elderly individuals. Rejuvenation Res. (2018) 21:416–22. doi: 10.1089/rej.2017.2005
32. Oshiro CES, Frankland TB, Rosales AG, Perrin NA, Bell CL, Lo SHY, et al. Fall ascertainment and development of a risk prediction model using electronic medical records. J Am Geriatr Soc. (2019) 67:1417–22. doi: 10.1111/jgs.15872
33. Jung H, Park HA, Hwang H. Improving prediction of fall risk using electronic health record data with various types and sources at multiple times. Comput Inform Nurs. (2020) 38:157–64. doi: 10.1097/CIN.0000000000000561
34. Lindberg DS, Prosperi M, Bjarnadottir RI, Thomas J, Crane M, Chen Z, et al. Identification of important factors in an inpatient fall risk prediction model to improve the quality of care using EHR and electronic administrative data: a machine-learning approach. Int J Med Inform. (2020) 143:104272. doi: 10.1016/j.ijmedinf.2020.104272
35. Liu CH, Hu YH, Lin YH. A machine learning-based fall risk assessment model for inpatients. Comput Inform Nurs. (2021) 39:450–9. doi: 10.1097/CIN.0000000000000727
36. Usmani S, Saboor A, Haris M, Khan MA, Park H. Latest research trends in fall detection and prevention using machine learning: a systematic review. Sensors. (2021) 21:5134. doi: 10.3390/s21155134
37. Kobayashi Y, Yoshida K. Quantitative structure-property relationships for the calculation of the soil adsorption coefficient using machine learning algorithms with calculated chemical properties from open-source software. Environ Res. (2021) 196:110363. doi: 10.1016/j.envres.2020.110363
38. Ran AR, Cheung CY, Wang X, Chen H, Luo LY, Chan PP, et al. Detection of glaucomatous optic neuropathy with spectral-domain optical coherence tomography: a retrospective training and validation deep-learning analysis. Lancet Digit Health. (2019) 1:e172–82. doi: 10.1016/S2589-7500(19)30085-8
39. Li D, Hu R, Li H, Cai Y, Zhang PJ, Wu J, et al. Performance of automatic machine learning versus radiologists in the evaluation of endometrium on computed tomography. Abdom Radiol. (2021) 46:5316–24. doi: 10.1007/s00261-021-03210-9
40. Ye C, Li J, Hao S, Liu M, Jin H, Zheng L, et al. Identification of elders at higher risk for fall with statewide electronic health records and a machine learning algorithm. Int J Med Inform. (2020) 137:104105. doi: 10.1016/j.ijmedinf.2020.104105
41. Ellis G, Gardner M, Tsiachristas A, Langhorne P, Burke O, Harwood RH, et al. Comprehensive geriatric assessment for older adults admitted to hospital. Cochrane Database Syst Rev. (2017) 9:Cd006211. doi: 10.1002/14651858.CD006211.pub3
42. Parker SG, Mccue P, Phelps K, Mccleod A, Arora S, Nockels K, et al. What is comprehensive geriatric assessment (CGA)? an umbrella review. Age Ageing. (2018) 47:149–55. doi: 10.1093/ageing/afx166
43. Hernandez Torres C, Hsu T. Comprehensive geriatric assessment in the older adult with cancer: a review. Eur Urol Focus. (2017) 3:330–9. doi: 10.1016/j.euf.2017.10.010
44. Fumagalli S, Pelagalli G, Franci Montorzi R, Li KM, Chang MS, Chuang SC, et al. Atrial fibrillation in older patients and artificial intelligence: a quantitative demonstration of a link with some of the geriatric multidimensional assessment tools-a preliminary report. Aging Clin Exp Res. (2021) 33:451–5. doi: 10.1007/s40520-020-01723-9
45. Aranda-Gallardo M, Morales-Asencio JM, Canca-Sanchez JC, Barrero-Sojo S, Perez-Jimenez C, Morales-Fernandez A, et al. Instruments for assessing the risk of falls in acute hospitalized patients: a systematic review and meta-analysis. BMC Health Serv Res. (2013) 13:122. doi: 10.1186/1472-6963-13-122
46. Baumann LA, Baker J, Elshaug AG. The impact of electronic health record systems on clinical documentation times: a systematic review. Health Policy. (2018) 122:827–36. doi: 10.1016/j.healthpol.2018.05.014
Keywords: machine learning, elderly, prediction model, comprehensive geriatric assessment, fall accident
Citation: Chu W-M, Kristiani E, Wang Y-C, Lin Y-R, Lin S-Y, Chan W-C, Yang C-T and Tsan Y-T (2022) A model for predicting fall risks of hospitalized elderly in Taiwan-A machine learning approach based on both electronic health records and comprehensive geriatric assessment. Front. Med. 9:937216. doi: 10.3389/fmed.2022.937216
Received: 05 May 2022; Accepted: 18 July 2022;
Published: 09 August 2022.
Edited by:
Wei-Ju Lee, National Yang Ming Chiao Tung University, TaiwanReviewed by:
Chung-Feng Liu, Chi Mei Medical Center, TaiwanLi-Kuo Liu, Shin Kong Wu Ho-Su Memorial Hospital, Taiwan
Copyright © 2022 Chu, Kristiani, Wang, Lin, Lin, Chan, Yang and Tsan. This is an open-access article distributed under the terms of the Creative Commons Attribution License (CC BY). The use, distribution or reproduction in other forums is permitted, provided the original author(s) and the copyright owner(s) are credited and that the original publication in this journal is cited, in accordance with accepted academic practice. No use, distribution or reproduction is permitted which does not comply with these terms.
*Correspondence: Yu-Tse Tsan, janyuhjer@gmail.com; Chao-Tung Yang, ctyang@thu.edu.tw