 Vincent Puy1,2
 Jadwiga Zmudka-Attier3,4
 Cyrille Capel3,5
 Roger Bouzerar3,6
 Jean-Marie Serot3,4Anne-Marie Bourgeois1
 Jérome Ausseil1,2
 Olivier Balédent3,6*
- 1Biochemistry Unit, CBH, Amiens University Medical Center, Amiens, France
- 2INSERM U1088, Research Group, Amiens, France
- 3BioFlowImage Research Group, Jules Verne University of Picardy, Amiens, France
- 4Geriatric Unit, General Hospital, Saint Quentin, France
- 5Neurosurgery Unit, Amiens University Medical Center, Amiens, France
- 6Medical Imaging Unit, Amiens University Medical Center, Amiens, France
The equilibrium between the ventricular and lumbar cerebrospinal fluid (CSF) compartments may be disturbed (in terms of flow and biochemistry) in patients with chronic hydrocephalus (CH). Using flow magnetic resonance imaging (MRI) and CSF assays, we sought to determine whether changes in CSF were associated with biochemical alterations. Nine elderly patients with CH underwent phase-contrast MRI. An index of CSF dynamics (Idyn) was defined as the product of the lumbar and ventricular CSF flows. During surgery, samples of CSF were collected from the lumbar and ventricular compartments and assayed for chloride, glucose and total protein. The lumbar/ventricular (L/V) ratio was calculated for each analyte. The ratio between measured and expected levels (Ibioch) was calculated for each analyte and compared with Idyn. Idyn varied from 0 to 100.103μl2.s2. In contrast to the L/V ratios for chloride and glucose, the L/V ratio for total protein varied markedly from one patient to another (mean ± standard deviation (SD): 2.63 ± 1.24). The Ibioch for total protein was strongly correlated with the corresponding Idyn (Spearman’s R: 0.98; p < 5 × 10⁻⁵).We observed correlated alterations in CSF flow and biochemical parameters in patients with CH. Our findings also highlight the value of dynamic flow analysis in the interpretation of data on CSF biochemistry.
Introduction
In 1964, Dichiro (1964) described the active circulation of cerebrospinal fluid (CSF) for the first time. Over the last two decades, our understanding of CSF dynamics has been considerably improved by the use of phase-contrast magnetic resonance imaging (PCMRI). This technique enables the reliable, non-invasive, rapid measurement of CSF and blood flows in various compartments (Barkhof et al., 1994; McCauley et al., 1995; Hoppe et al., 1998; Knobloch et al., 2014).
Chronic hydrocephalus (CH) is characterized by marked ventriculomegaly and alterations in CSF flow. The incidence of CH increases with age, and the diagnosis of this condition is based on both clinical and radiological data. Magnetic resonance imaging (MRI) can reveal severe ventricular enlargement (i.e., greater than the enlargement due to brain atrophy alone) and may also evidence CSF “flow void” in the aqueduct (Bradley et al., 1996) when very high CSF velocities are caused by active hydrocephalus. Recently, new biophysical approaches have been used to characterize the role of CSF dynamics in brain function. During the cardiac cycle (CC), the CSF oscillates between the intracranial compartment and spinal canal; this compensates for the vascular changes in brain volume and thus avoids a marked increase in intracranial pressure (ICP; Bateman, 2000; Bouzerar et al., 2012; Schmid Daners et al., 2012). In healthy individuals, the oscillations between the cranium and the spinal canal involve just 10% or so of the total CSF volume (Balédent et al., 2001). In CH, the movement of CSF between ventricular, intracranial subarachnoidal and lumbar compartments may become disorganized, and patients with CH may display abnormally low or abnormally high levels of CSF pulsatility (Chaarani et al., 2013). We reasoned that the application of PCMRI may improve the diagnosis and management of patients with CH. It has been estimated that CH accounts for up to 10% of cases of dementia. Hence, CH constitutes a modifiable risk factor because it can be treated by ventriculoperitoneal shunting. The use of PCMRI enables the volume of CSF flowing through the aqueduct in either direction during the CC (i.e., the stroke volume, SV) to be measured easily. In some patients with CH, it is not clear whether ventricular dilation is due to atrophy or another active mechanism; in this particular case, some researchers consider that a high aqueductal CSF SV in patients with dilated ventricles is a good prognostic marker for the placement of a shunt (Bradley et al., 1996; Luetmer et al., 2002; Balédent et al., 2004; Scollato et al., 2008; El Sankari et al., 2011). However, other recent studies suggest that the aqueductal SV is correlated with the aqueduct area and the ventricular volume but not with the severity or duration of clinical symptoms (Ringstad et al., 2015a). The significance of the aqueductal SV is therefore still subject to debate (Bradley, 2015; Ringstad et al., 2015a,b).
In other patients with CH, there is a blockage between the ventricles and the subarachnoid spaces. This blockage is sometimes difficult to detect on conventional, morphological images. In such cases, PCMRI shows the abnormal absence of CSF oscillations in the aqueduct and thus prompt the neurosurgeon to recommend endoscopic third ventriculostomy rather than shunt placement (Stoquart-El Sankari et al., 2009).
We hypothesized that the noted hydrodynamic alterations might also alter the CSF levels of routinely measured clinical biochemical parameters. In patients with CH, PCMRI studies have shown that the CSF flows in the ventricles or/and spinal canal are modified. The putative correlations between CSF biochemistry and CSF flow dynamics have not previously been investigated. Indeed, very few publications have even looked at biochemical differences between CSF samples in the ventricular and lumbar compartments.
The blood plasma is the source of 80% of all CSF proteins (350–500 mg/l). The total protein concentration is 2.5 times higher in the lumbar CSF than the ventricular CSF because of the gradual influx of proteins moving from the choroid plexus to the lumbar spinal canal (Regeniter et al., 2009). However, the concentration of proteins synthesized in the brain is relatively uniform in all CSF compartments but can sometimes even be lower in the lumbar region than in the ventricular region (as seen with tau protein, Reiber, 1994).
In 1958, Fishman et al. showed that the CSF protein concentration was higher in the lumbar sac than in the ventricles of patients with CH. Furthermore, the protein concentration varied greatly from one subject to another. The researchers concluded that the protein concentration gradient depended (at least in part) on the relatively high permeability to albumin of the blood-CSF barrier in the spinal subarachnoid space. However, this gradient also depends on several other factors, including: (i) mixing within the ventricles and the subarachnoid space; and (ii) removal mechanisms, which may operate in some compartments but not others (Fishman et al., 1958). Similarly, Weisner and Bernhardt’s (1978) study of samples from healthy controls showed that the CSF albumin concentration was 2.2 times greater in the lumbar region than in the ventricles.
As suggested by Milhorat (1975), the ventricles’ highly complex anatomy and the equally complex system of CSF circulation within the brain may contribute to the maintenance of a balance between the various compartments (in terms of both flow rates and CSF biochemistry). We speculated that this balance might be disturbed in patients with CH and that this disturbance might (at least in part) be attributed to abnormal CSF hydrodynamics. Hence, we used flow MRI and standard CSF assays to establish whether altered CSF flow dynamics in CH were related to the CSF’s biochemical profile.
Materials and Methods
The Study Population
All procedures involving human subjects were performed in accordance with the 1983 and 2008 revisions of the Declaration of Helsinki. The study was conducted at Amiens University Hospital (Amiens, France). All the patients included in the present research project were informed by a medical doctor of the aim of this research. They were all free to reject their participation without any implication on the following of their care. All have signed the consent before to be included in the research population. This study was approved by the local investigational review board (CPP Nord-Ouest II, Amiens, France; reference: 2010/17). For obvious ethical reasons, it was impossible to obtain samples of ventricular and lumbar CSF from healthy volunteers; we therefore studied nine elderly, shunted patients (5 women and 4 men; mean ± standard deviation (SD) age: 73 ± 8; age range: 56–83) with a documented clinical history of CH and easy access to the CSF during the tap test and the surgical shunt procedure.
Acquisition of PCMRI Data
All nine patients underwent morphological and CSF flow MRI of the brain (Table 1). All acquisitions were performed prospectively with a 3 Tesla MRI system (Signa, General Electric Medical Systems, Milwaukee, WI, USA). Conventional anatomic sequences were acquired for each patient. A sagittal T2-weighted image was used to select two PCMRI flow acquisitions (one perpendicular to the presumed direction of CSF flow through the C2-C3 subarachnoid space and the other through the cerebral aqueduct; Figure 1). Retrospective peripheral gating was used to measure 32 different time frames over the entire CC for each of the two flow acquisitions. The main PCMRI parameters were as follows: echo time: 6–9 ms; repetition time: 20 ms; flip angle: 20°; field-of-view: 16 × 12 mm2; pixel resolution: 0.6 × 0.6 mm2; slice thickness: 5 mm; views per segment: 2; velocity (encoding) sensitization: 5, 10 or 20 cm/s for the cervical aqueduct and 5 cm/s for the C2-C3 subarachnoid space. The acquisition time for each flow series was about 2 min, depending on the participant’s heart rate.
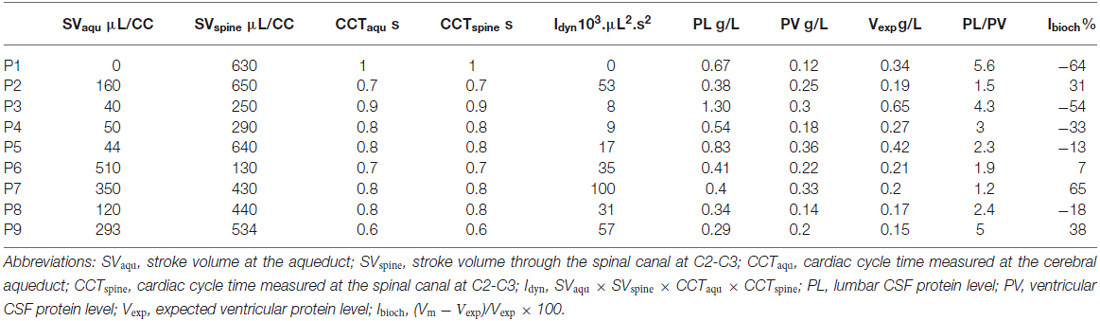
Table 1. CSF flow assessment (PC-MRI) and CSF protein assay data.
Figure 1. Quantification of cerebrospinal fluid (CSF) dynamics. A sagittal T2 weighted image (A) was used to select the phase-contrast magnetic resonance imaging (PCMRI) acquisition planes in patients with chronic hydrocephalus (CH) and ventricular dilation on the axial T2-weighted FLAIR image (B). Images (C,D) respectively show CSF flowing through the cerebral aqueduct and through the cervical (C2-C3) subarachnoid spaces during the cardiac cycle (CC). Post-processing of these PCMRI data enables the CSF oscillations during the CC to be quantified (D). Integration of these curves over time yields the CSF stroke volume (SV) for the aqueduct (SVaqu) and for the spinal canal (SVspine). The CSF SV corresponds to the volume of CSF moving through the slice over the CC and is the primary descriptor of CSF dynamics (E).
Analysis of PCMRI Data
Data were analyzed using dedicated PCMRI image processing software (Balédent et al., 2001) with an optimized CSF flow segmentation algorithm. The software automatically extracts the anatomic regions of interest and calculates the corresponding flow curves over the 32 CC segments (Figure 1).
The CSF flow curves were integrated to provide the CSF SVs, which correspond to the CSF volumes displaced in both directions through the cerebral aqueduct (SVaqu) and the spinal canal (SVspine) over the CC (Nitz et al., 1992; Enzmann and Pelc, 1993). SVs are quoted in μL/CC.
An overall index of CSF dynamics (“Idyn”) was derived as a guide to the CSF volume displaced in the ventricles and the spinal canal during the CC. It was defined as the product of the two CSF SVs and the two CC times (CCTaqu and CCTspine); Idyn = SVaqu × SVspine × CCTaqu × CCTspine.
The CCT was measured using a plethysmographic sensor worn on the patient’s finger during the MRI. The sensor monitored the changes in blood volume in the finger during the CC. The PCMRI acquisition was synchronized with the systolic pulse.
CSF Sampling and Biochemical Analysis
All patients underwent a CSF tap test during placement of their shunt. During surgery, CSF samples (at least one for the ventricular compartment and one for the lumbar compartment) were collected from each patient. The samples were collected between 9.00 and 10.30 am after overnight fasting, in accordance with our university medical center’s validated, aseptic protocols. The plastic vials were immediately sent to the university medical center’s central laboratory. Chloride, glucose and total protein levels were determined using conventional techniques (Advia 2400 analyzer, Siemens Healthcare Diagnostics, Tarrytown, NY, USA). Briefly, chloride was assayed potentiometrically using an ion-selective electrode. The glucose level was determined in an enzymatic assay based on hexokinase and glucose-6-phosphate. The CSF total protein level was determined using pyrogallol red/acidic molybdate reagent. Levels of the resulting blue pyrogallol/molybdate/protein complex were quantified by reading the optical density at 596/694 nm. Ventricular and lumbar levels were measured for each CSF component. Under physiological conditions, the ventricular CSF protein level is around half the lumbar level (Laterre et al., 2008). We therefore defined a biochemical index (“Ibioch”), in order to assess the difference between expected and measured protein levels in the ventricle:
where Vm and Vexp are respectively the measured and expected ventricular CSF protein levels. Vexp was calculated as half the lumbar CSF protein level (based on the normal L/V ratio in healthy individuals; Laterre et al., 2008). An Ibioch of ~0 indicates that CSF protein is distributed normally between the ventricular and lumbar compartments, an Ibioch above 0 reveals a higher-than-expected ventricular CSF protein level and an Ibioch below 0 reveals a lower-than-expected ventricular CSF protein level.
Statistical Analysis
A nonparametric Spearman’s test was used to assess the correlations between PCMRI and clinical biochemical parameters. A p-value below 0.05 was considered to be statistically significant. We also applied linear regression analysis, with extraction of the linear equation and calculation of the regression coefficient R2.
Results
PC-MRI Analysis
In the group of CH patients, PCMRI analysis revealed a wide range of CSF flow profiles (from stenosis to hyperdynamic flow) when measured at the cerebral aqueduct or at the spinal level. The mean ± SD (range) values of SVaqu and SVspine were 174 ± 174 (0–510) and 444 ± 188 (130–650) μL/CC, respectively. The mean values of CCTaqu and CCTspine were 0.8 ± 0.12 and 0.79 ± 0.12 s, respectively. The Idyn values ranged from 0 to 100.103 μl2.s2 (Table 1). Hence, patients with CH displayed major hydrodynamic alterations in ventricular and/or lumbar CSF compartments.
Biochemical Variations in the Lumbar and Ventricular Compartments and their Correlation with CSF Flows
We first compared the biochemical CSF parameters in the ventricular compartment with those in the lumbar compartment (Figure 2). The mean ± SD (range) ventricular and lumbar CSF chloride levels were respectively 124 ± 3.5 (121–130) and 123 ± 2.8 (117–126) m.mol.l−1, the mean ventricular and lumbar CSF glucose levels were respectively 3.8 ± 0.8 (2.9–5.3) mmol.l−1 and 3.4 ± 0.6 (3–4.9) mmol.l−1, and the mean ventricular and lumbar CSF protein levels were respectively 0.23 ± 0.08 (0.12–0.36) and 0.57 ± 0.3 (0.29–1.3) mmol.l−1 (Table 1).
Figure 2. Biochemical analyses of lumbar and ventricular CSF samples. (A) Lumbar and ventricular CSF chloride levels in individual patients; L/V ratio ≃ 1 (mean ± standard deviation (SD): 0.99 ± 0.01). (B) Lumbar and ventricular CSF glucose levels in individual patients; note the absence of a significant difference between lumbar and ventricular values, L/V ratio ≃ 1 (mean ± SD mean: 0.91 ± 0.1). (C) Lumbar and ventricular CSF protein values in individual patients, showing a significant difference in CSF protein levels between the lumbar and ventricular compartments. The L/V ratio ranged from 1.21 to 5.58 (mean ± SD: 2.63 ± 1.46). Abbreviations: L/V, lumbar/ventricular; SD, standard deviation; [ ], concentration.
There were no significant ventricular vs. lumbar differences in the chloride and glucose levels. The L/V ratios for chloride and glucose were respectively 0.99 ± 0.01 and 0.91 ± 0.10. The value of the L/V protein ratio varied greatly from one patient to another but was correlated with the CSF dynamic index (Figure 3A; Spearman’s R: 0.98; p = 4.10−6). The mean value was 2.63 ± 1.24 (Figure 2). The corresponding Ibioch values were also widely distributed (range: −64.2% to 65%; mean ± SD: −4.5 ± 43%). Nevertheless, the respective values of Idyn and Ibioch were highly correlated (Spearman’s R: 0.98; p = 5.10−5), suggesting the presence of a strong, linear relationship between CSF dynamics and CSF total protein levels.
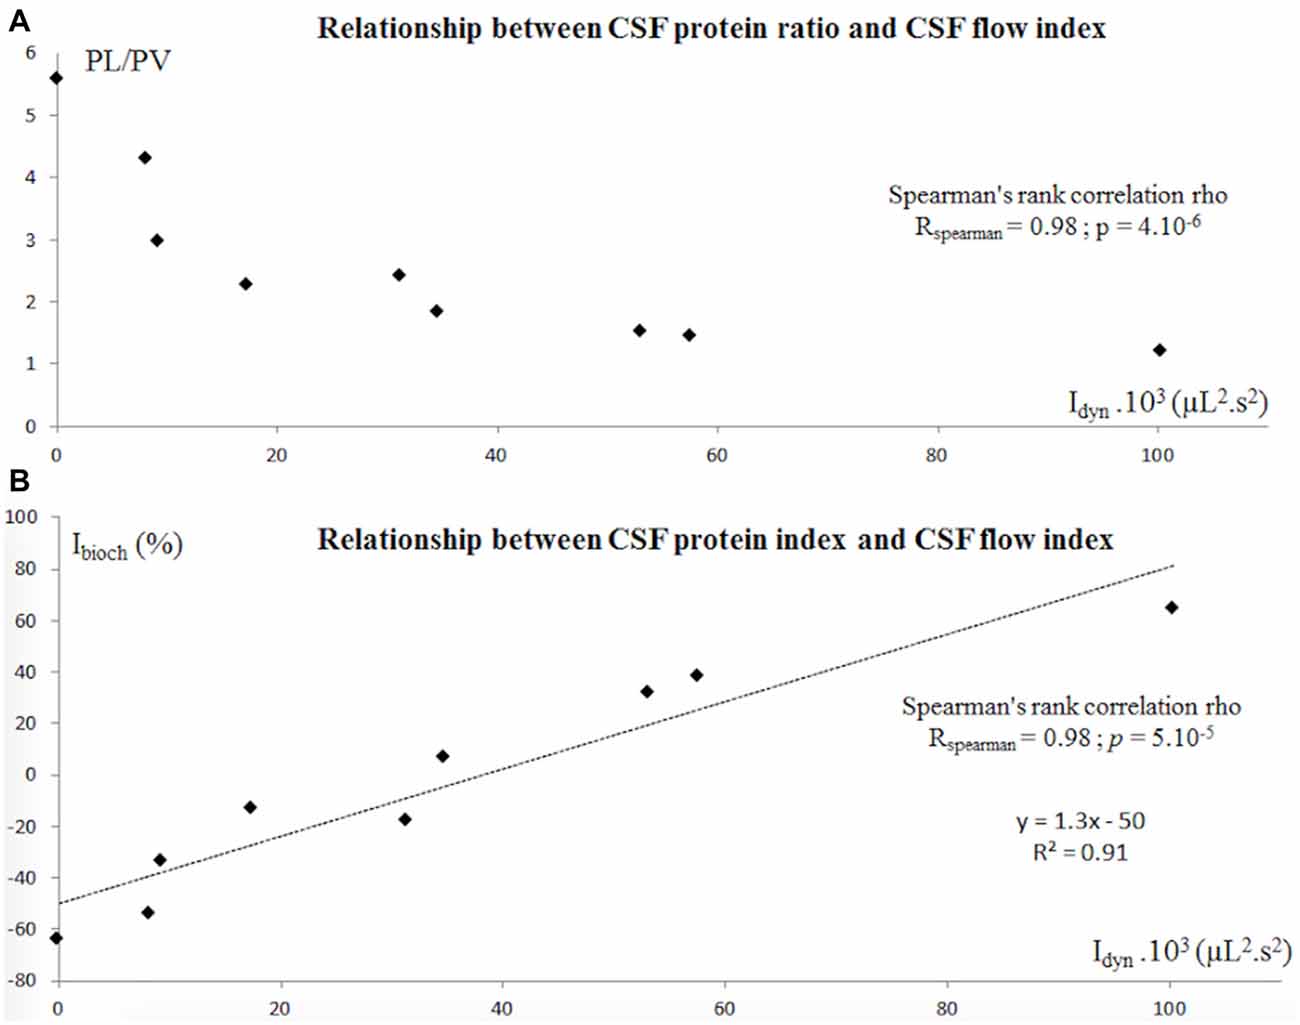
Figure 3. (A) In patients with CH, the CSF protein ratio (PL/PV) calculated for the lumbar spaces (PL) and the ventricle spaces (PV) was strongly correlated with the CSF flow from the aqueduct and the spinal spaces, represented by Idyn = SVaqu × SVspine × CCTaqu × CCTspine. (B) Similarly, Ibioch and Idyn were strongly correlated. Ibioch = (Vm−Vexp)/Vexp × 100. An Ibioch of ~0 shows that CSF protein is distributed evenly between the ventricular and lumbar compartments. An Ibioch above 0 reveals a higher-than-expected ventricular CSF protein level, and an Ibioch below 0 reveals a lower-than-expected ventricular CSF protein level. Abbreviations: CH, chronic hydrocephalus; PL, lumbar protein level; PV, ventricular protein level; SVaqu, stroke volume measured at the cerebral aqueduct; SVspine, stroke volume measured at the spinal canal at C2-C3; CCTaqu, cardiac cycle time measured at the cerebral aqueduct; CCTspine, cardiac cycle time measured at the spinal canal at C2-C3; Vexp, expected ventricular CSF protein level; Vm, measured ventricular CSF protein level.
Discussion
CSF pressure and volume have long been studied in animal models of hydrocephalus and in the context of shunt design (Chahlavi et al., 2001; Pickard et al., 2005). Consequently, there are large bodies of data on pressure-volume relationships in the ventricular-subarachnoid system and the impact of CSF turnover on brain metabolism (Silverberg et al., 2010).
In animal models, it is increasingly clear that low CSF turnover impairs brain metabolism and fluid balance both early and late in life (Silverberg et al., 2001, 2003; Owen-Lynch et al., 2003; Johanson et al., 2004; Praticò et al., 2004; Nagra et al., 2008). Although a large number of studies have focused on CSF formation and turnover, the dynamics of CSF within the cerebrospinal system have not been extensively characterized (Oresković and Klarica, 2010; Pollay, 2010). Experiments in small animal models (such as mice) are complicated by the low total volume of CSF. Hence, the composition and dynamics of the CSF in the various compartments are not easy to study.
We hypothesized that CSF dynamics have an impact on CSF biochemistry. To the best of our knowledge, the present study is the first to have evaluated the association between CSF dynamics and CSF biochemistry in humans.
The present PCMRI study was designed to obtain an overview of CSF dynamics in patients with CH. Dynamic gadoteridol-enhanced MRI studies of the guinea pig have shown that: (i) movement of the tracer between the subarachnoid space and the ventricles was proportional to the CSF pressure; and (ii) that CSF turnover may be proportional to the ICP (Yamada et al., 2005). It has long been known that an increase in the mean CSF pressure is also associated with an increase in the amplitude of CSF pressure oscillations (Nornes et al., 1977; Czosnyka et al., 1988). However, the relationship between CSF pressure and CSF SV remains unclear. In patients with CH, some researchers have found that the ICP pulse wave is positively correlated with the volume of CSF movement through the cerebral aqueduct (Hamilton et al., 2012), whereas others have not observed this relationship (Ringstad et al., 2015a). The aqueductal SV accounts for only a part of the craniospinal system. Under physiological conditions, CSF oscillations through the foramen magnum influence the ICP. We consider that CSF dynamics should be studied in the subarachnoidal spaces as well as in the aqueduct. The fact that the spinal canal receives all the CSF from the ventricles and the intracranial subarachnoïd compartments (Balédent et al., 2001) prompted us to define Idyn, a quantitative, dynamic marker that takes account of both spinal and ventricular CSF SVs and the CC duration. In previous work, we had found that the mean ± SD CSF oscillation in a population of elderly, healthy volunteers was 34 ± 16 μL/CC in the aqueduct of Sylvius and 457 ± 147 μL/CC in the cervical spaces (Stoquart-El Sankari et al., 2007). In the current study, our PCMRI data revealed a broad range of alterations in CSF flow—ranging from abnormally slow to abnormally high. Indeed, flow at the aqueduct was either stenosed, normal or elevated (i.e., huge volume oscillations through an enlarged aqueduct; Table 1). Our data also showed that movement of the CSF in both the ventricular and lumbar compartments varies over the course of the CC.
Few studies have analyzed CSF biochemistry in both the ventricular and lumbar compartments. We showed that ventricular and lumbar CSF levels of small molecules (chloride and glucose) were similar. Indeed, electrolytes diffuse passively from the CSF to the interstitial tissue. The glucose concentration appears to be much the same through the whole cerebrospinal system. In contrast, total protein levels differed markedly when comparing the ventricular and lumbar regions. In the lumbar compartment, most CSF proteins are derived from plasma proteins (as a result of close interaction with blood vessels; Laterre et al., 2008). This mechanism might explain why protein levels are higher in the lumbar compartment than in the ventricular compartment. Distribution of various substances along the CSF spaces also depends on the rate of their removal into microvessels: faster removal corresponds to more limited distribution. When interpreting experimental results, it is important to distinguish between the movement of CSF/water (99% of the CSF’s volume is water) on one hand and the distribution of substances inside the CSF system on the other (Vladić et al., 2000; Bulat and Klarica, 2011). The flow oscillations induced by the CC cause CSF with a high protein concentration (in the lumbar compartment) to mix with CSF with a lower protein concentration (in the ventricular compartment). Given that we were unable (for ethical reasons) to measure ventricular CSF protein levels in a control group, we calculated Ibioch from the expected and measured ventricular protein levels. According to Laterre et al.’s (2008) study in adults, Vexp is half the lumbar CSF protein level under physiological conditions. Ibioch ranged from −64.2 to 65%, which strongly suggests that the L/V ratio varies. Interestingly, we showed that CSF protein variations were strongly correlated with the CSF flow oscillations during the CC. Our Ibioch-Idyn correlation was independent of the exact value of the physiological L/V protein ratio and thus evidenced a relationship between oscillatory movement of the CSF and variations in CSF biochemistry. The observed variations in the CSF flow patterns (Idyn), the L/V protein ratio and Ibioch strongly support this hypothesis. (Figure 3).
Lastly, the stable isotope labeling approach recently described by Lehmann et al. (2015) could be of great value for quantifying: (i) the rates of synthesis and clearance of a large range of proteins in the lumbar and ventricular CSF; and (ii) the large interindividual differences in protein concentration found in patients with CH.
In conclusion, the results of our pilot study in a reliable human model suggest that the amplitude of the CSF flow during the CC influences CSF protein levels and the distribution of protein within the central nervous system’s cavities. This proof-of-concept study opens up new avenues in the investigation of the relationship between clinical biochemical parameters and dynamic MRI parameters, which should now be confirmed in a larger cohort. Although further research should seek to determine which proteins are the most informative, we have demonstrated the value of combining PCMRI with CSF biomarker assays. Recent studies have emphasized how difficult it is to diagnose Alzheimer’s disease—especially in patients with normal pressure hydrocephalus (Graff-Radford, 2014). CSF biomarkers and proteomic methods (Fonteh et al., 2006) are of value for the diagnosis of neurodegenerative disorders (Davidsson et al., 2002; Seppälä et al., 2012; Sweeney et al., 2015) and neurovascular ischemic disorders (Siman et al., 2005; Vilar-Bergua et al., 2015). Combining these biological tools with PCMRI (and not just conventional MRI) may improve the diagnosis and monitoring of these conditions.
Author Contributions
VP: Data analysis, writing and editing the manuscript. OB: project design, acquisition and post-processing of MRI data, data analysis, writing and editing the manuscript. JZ-A: clinical investigation. CC: neurosurgical procedures. RB: statistical and data analyses. J-MS: ethical approval, project design. A-MB: biochemical assays. JZ-A: project design.
Conflict of Interest Statement
The authors declare that the research was conducted in the absence of any commercial or financial relationships that could be construed as a potential conflict of interest.
Acknowledgments
We thank Dr. Mikhail Papisov for his help and advice during the third Cerebrospinal Fluid Dynamics Symposium 2015 (http://csfdynamics.org/), and Virginie Nourry for technical assistance with the biochemical assays.
Abbreviations
CC, cardiac cycle; CH, chronic hydrocephalus; CSF, cerebrospinal fluid; ICP, intracranial pressure; L/V, lumbar/ventricular; MRI, magnetic resonance imaging; PCMRI, phase-contrast magnetic resonance imaging; SVaqu, stroke volume measured at the cerebral aqueduct; SVspine, stroke volume measured at the spinal canal at C2-C3; CCTaqu, cardiac cycle time measured at the cerebral aqueduct; CCTspine, cardiac cycle time measured at the spinal canal at C2-C3; Vexp, expected ventricular CSF protein level; Vm, measured ventricular CSF protein level.
References
Balédent, O., Gondry-Jouet, C., Meyer, M.-E., De Marco, G., Le Gars, D., Henry-Feugeas, M.-C., et al. (2004). Relationship between cerebrospinal fluid and blood dynamics in healthy volunteers and patients with communicating hydrocephalus. Invest. Radiol. 39, 45–55. doi: 10.1097/01.rli.0000100892.87214.49
Balédent, O., Henry-Feugeas, M. C., and Idy-Peretti, I. (2001). Cerebrospinal fluid dynamics and relation with blood flow: a magnetic resonance study with semiautomated cerebrospinal fluid segmentation. Invest. Radiol. 36, 368–377. doi: 10.1097/00004424-200107000-00003
Barkhof, F., Kouwenhoven, M., Scheltens, P., Sprenger, M., Algra, P., and Valk, J. (1994). Phase-contrast cine MR imaging of normal aqueductal CSF flow. Effect of aging and relation to CSF void on modulus MR. Acta Radiol. 35, 123–130. doi: 10.1177/028418519403500204
Bateman, G. A. (2000). Vascular compliance in normal pressure hydrocephalus. Am. J. Neuroradiol. 21, 1574–1585.
Bouzerar, R., Czosnyka, M., Czosnyka, Z., and Balédent, O. (2012). “Physical phantom of craniospinal hydrodynamics,” in Hydrocephalus, eds G. A. Aygok and H. L. Rekate (Vienna: Springer-Verlag), 65–69.
Bradley, W. G. Jr. (2015). Intracranial pressure versus phase-contrast MR imaging for normal pressure hydrocephalus. Am. J. Neuroradiol. 36, 1631–1632. doi: 10.3174/ajnr.A4507
Bradley, W. G., Scalzo, D., Queralt, J., Nitz, W. N., Atkinson, D. J., and Wong, P. (1996). Normal-pressure hydrocephalus: evaluation with cerebrospinal fluid flow measurements at MR imaging. Radiology 198, 523–529. doi: 10.1148/radiology.198.2.8596861
Bulat, M., and Klarica, M. (2011). Recent insights into a new hydrodynamics of the cerebrospinal fluid. Brain Res. Rev. 65, 99–112. doi: 10.1016/j.brainresrev.2010.08.002
Chaarani, B., Daouk, J., Capel, C., Fichten, A., Zmudka, J., Gondry-Jouet, C., et al. (2013). Estimation of the lateral ventricles volumes from a 2D image and its relationship with cerebrospinal fluid flow. Biomed Res. Int. 2013:215989. doi: 10.1155/2013/215989
Chahlavi, A., El-Babaa, S. K., and Luciano, M. G. (2001). Adult-onset hydrocephalus. Neurosurg. Clin. N. Am. 12, 753–760.
Czosnyka, M., Wollk-Laniewski, P., Batorski, L., and Zaworski, W. (1988). Analysis of intracranial pressure waveform during infusion test. Acta Neurochir. (Wien) 93, 140–145. doi: 10.1007/bf01402897
Davidsson, P., Westman-Brinkmalm, A., Nilsson, C. L., Lindbjer, M., Paulson, L., Andreasen, N., et al. (2002). Proteome analysis of cerebrospinal fluid proteins in Alzheimer patients. Neuroreport 13, 611–615. doi: 10.1097/00001756-200204160-00015
Dichiro, G. (1964). Movement of the cerebrospinal fluid in human beings. Nature 204, 290–291. doi: 10.1038/204290a0
El Sankari, S., Gondry-Jouet, C., Fichten, A., Godefroy, O., Serot, J. M., Deramond, H., et al. (2011). Cerebrospinal fluid and blood flow in mild cognitive impairment and Alzheimer’s disease: a differential diagnosis from idiopathic normal pressure hydrocephalus. Fluids Barriers CNS 8:12. doi: 10.1186/2045-8118-8-12
Enzmann, D. R., and Pelc, N. J. (1993). Cerebrospinal fluid flow measured by phase-contrast cine MR. Am. J. Neuroradiol. 14, 1301–1307; discussion 1309–1310.
Fishman, R. A., Ransohoff, J., and Osserman, E. F. (1958). Factors influencing the concentration gradient of protein in cerebrospinal fluid12. J. Clin. Invest. 37, 1419–1424. doi: 10.1172/jci103732
Fonteh, A. N., Harrington, R. J., Huhmer, A. F., Biringer, R. G., Riggins, J. N., and Harrington, M. G. (2006). Identification of disease markers in human cerebrospinal fluid using lipidomic and proteomic methods. Dis. Markers 22, 39–64. doi: 10.1155/2006/202938
Graff-Radford, N. R. (2014). Alzheimer CSF biomarkers may be misleading in normal-pressure hydrocephalus. Neurology 83, 1573–1575. doi: 10.1212/WNL.0000000000000916
Hamilton, R., Baldwin, K., Fuller, J., Vespa, P., Hu, X., and Bergsneider, M. (2012). Intracranial pressure pulse waveform correlates with aqueductal cerebrospinal fluid stroke volume. J. Appl. Physiol. 113, 1560–1566. doi: 10.1152/japplphysiol.00357.2012
Hoppe, M., Heverhagen, J. T., Froelich, J. J., Kunisch-Hoppe, M., Klose, K. J., and Wagner, H. J. (1998). Correlation of flow velocity measurements by magnetic resonance phase contrast imaging and intravascular Doppler ultrasound. Invest. Radiol. 33, 427–432. doi: 10.1097/00004424-199808000-00001
Johanson, C., McMillan, P., Tavares, R., Spangenberger, A., Duncan, J., Silverberg, G., et al. (2004). Homeostatic capabilities of the choroid plexus epithelium in Alzheimer’s disease. Cerebrospinal Fluid Res. 1:3. doi: 10.1186/1743-8454-1-3
Knobloch, V., Binter, C., Kurtcuoglu, V., and Kozerke, S. (2014). Arterial, venous and cerebrospinal fluid flow: simultaneous assessment with Bayesian multipoint velocity-encoded MR imaging. Radiology 270, 566–573. doi: 10.1148/radiol.13130840
Laterre, E. C., Sindic, C., Seron, X., and Fardeau, M. (2008). Sémiologie des Maladies Nerveuses. Belgium: De Boeck Supérieur. Chapter 2, 26–28.
Lehmann, S., Vialaret, J., Combe, G. G., Bauchet, L., Hanon, O., Girard, M., et al. (2015). Stable Isotope Labeling by Amino acid in Vivo (SILAV): a new method to explore protein metabolism. Rapid Commun. Mass Spectrom. 29, 1917–1925. doi: 10.1002/rcm.7289
Luetmer, P. H., Huston, J., Friedman, J. A., Dixon, G. R., Petersen, R. C., Jack, C. R., et al. (2002). Measurement of cerebrospinal fluid flow at the cerebral aqueduct by use of phase-contrast magnetic resonance imaging: technique validation and utility in diagnosing idiopathic normal pressure hydrocephalus. Neurosurgery 50, 534–543; discussion 543–544. doi: 10.1097/00006123-200203000-00020
McCauley, T. R., Peña, C. S., Holland, C. K., Price, T. B., and Gore, J. C. (1995). Validation of volume flow measurements with cine phase-contrast MR imaging for peripheral arterial waveforms. J. Magn. Reson. Imaging 5, 663–668. doi: 10.1002/jmri.1880050608
Milhorat, T. H. (1975). The third circulation revisited. J. Neurosurg. 42, 628–645. doi: 10.3171/jns.1975.42.6.0628
Nagra, G., Li, J., McAllister, J. P. II, Miller, J., Wagshul, M., and Johnston, M. (2008). Impaired lymphatic cerebrospinal fluid absorption in a rat model of kaolin-induced communicating hydrocephalus. Am. J. Physiol. Regul. Integr. Comp. Physiol. 294, R1752–R1759. doi: 10.1152/ajpregu.00748.2007
Nitz, W. R., Bradley, W. G. Jr., Watanabe, A. S., Lee, R. R., Burgoyne, B., O’Sullivan, R. M., et al. (1992). Flow dynamics of cerebrospinal fluid: assessment with phase-contrast velocity MR imaging performed with retrospective cardiac gating. Radiology 183, 395–405. doi: 10.1148/radiology.183.2.1561340
Nornes, H., Aaslid, R., and Lindegaard, K. F. (1977). Intracranial pulse pressure dynamics in patients with intracranial hypertension. Acta Neurochir. (Wien) 38, 177–186. doi: 10.1007/bf01401089
Oresković, D., and Klarica, M. (2010). The formation of cerebrospinal fluid: nearly a hundred years of interpretations and misinterpretations. Brain Res. Rev. 64, 241–262. doi: 10.1016/j.brainresrev.2010.04.006
Owen-Lynch, P. J., Draper, C. E., Mashayekhi, F., Bannister, C. M., and Miyan, J. A. (2003). Defective cell cycle control underlies abnormal cortical development in the hydrocephalic Texas rat. Brain 126, 623–631. doi: 10.1093/brain/awg058
Pickard, J. D., Coleman, M. R., and Czosnyka, M. (2005). Hydrocephalus, ventriculomegaly and the vegetative state: a review. Neuropsychol. Rehabil. 15, 224–236. doi: 10.1080/09602010443000614
Pollay, M. (2010). The function and structure of the cerebrospinal fluid outflow system. Cerebrospinal Fluid Res. 7:9. doi: 10.1186/1743-8454-7-9
Praticò, D., Yao, Y., Rokach, J., Mayo, M., Silverberg, G. G., and McGuire, D. (2004). Reduction of brain lipid peroxidation by CSF drainage in Alzheimer’s disease patients. J. Alzheimers Dis. 6, 385–389; discussion 443–449.
Regeniter, A., Kuhle, J., Mehling, M., Möller, H., Wurster, U., Freidank, H., et al. (2009). A modern approach to CSF analysis: pathophysiology, clinical application, proof of concept and laboratory reporting. Clin. Neurol. Neurosurg. 111, 313–318. doi: 10.1016/j.clineuro.2008.12.004
Reiber, H. (1994). Flow rate of cerebrospinal fluid (CSF)–a concept common to normal blood-CSF barrier function and to dysfunction in neurological diseases. J. Neurol. Sci. 122, 189–203. doi: 10.1016/0022-510x(94)90298-4
Ringstad, G., Emblem, K. E., Geier, O., Alperin, N., and Eide, P. K. (2015a). Aqueductal stroke volume: comparisons with intracranial pressure scores in idiopathic normal pressure hydrocephalus. Am. J. Neuroradiol. 36, 1623–1630. doi: 10.3174/ajnr.a4340
Ringstad, G., Emblem, K. E., Geier, O., Alperin, N., and Eide, P. K. (2015b). Reply. Am. J. Neuroradiol. 36, 1623–1630. doi: 10.3174/ajnr.a4488
Schmid Daners, M., Bottan, S., Guzzella, L., Poulikakos, D., and Kurtcuoglu, V. (2012). Craniospinal pressure-volume dynamics in phantom models. IEEE Trans. Biomed. Eng. 59, 3482–3490. doi: 10.1109/TBME.2012.2214220
Scollato, A., Tenenbaum, R., Bahl, G., Celerini, M., Salani, B., and Lorenzo, N. D. (2008). Changes in aqueductal CSF stroke volume and progression of symptoms in patients with unshunted idiopathic normal pressure hydrocephalus. Am. J. Neuroradiol. 29, 192–197. doi: 10.3174/ajnr.a0785
Seppälä, T. T., Nerg, O., Koivisto, A. M., Rummukainen, J., Puli, L., Zetterberg, H., et al. (2012). CSF biomarkers for Alzheimer disease correlate with cortical brain biopsy findings. Neurology 78, 1568–1575. doi: 10.1212/WNL.0b013e3182563bd0
Silverberg, G. D., Heit, G., Huhn, S., Jaffe, R. A., Chang, S. D., Bronte-Stewart, H., et al. (2001). The cerebrospinal fluid production rate is reduced in dementia of the Alzheimer’s type. Neurology 57, 1763–1766. doi: 10.1212/wnl.57.10.1763
Silverberg, G. D., Mayo, M., Saul, T., Rubenstein, E., and McGuire, D. (2003). Alzheimer’s disease, normal-pressure hydrocephalus and senescent changes in CSF circulatory physiology: a hypothesis. Lancet Neurol. 2, 506–511. doi: 10.1016/s1474-4422(03)00487-3
Silverberg, G. D., Miller, M. C., Machan, J. T., Johanson, C. E., Caralopoulos, I. N., Pascale, C. L., et al. (2010). Amyloid and Tau accumulate in the brains of aged hydrocephalic rats. Brain Res. 1317, 286–296. doi: 10.1016/j.brainres.2009.12.065
Siman, R., Zhang, C., Roberts, V. L., Pitts-Kiefer, A., and Neumar, R. W. (2005). Novel surrogate markers for acute brain damage: cerebrospinal fluid levels corrrelate with severity of ischemic neurodegeneration in the rat. J. Cereb. Blood Flow Metab. 25, 1433–1444. doi: 10.1038/sj.jcbfm.9600138
Stoquart-El Sankari, S., Balédent, O., Gondry-Jouet, C., Makki, M., Godefroy, O., and Meyer, M.-E. (2007). Aging effects on cerebral blood and cerebrospinal fluid flows. J. Cereb. Blood Flow Metab. 27, 1563–1572. doi: 10.1038/sj.jcbfm.9600462
Stoquart-El Sankari, S., Lehmann, P., Gondry-Jouet, C., Fichten, A., Godefroy, O., Meyer, M.-E., et al. (2009). Phase-contrast MR imaging support for the diagnosis of aqueductal stenosis. Am. J. Neuroradiol. 30, 209–214. doi: 10.3174/ajnr.A1308
Sweeney, M. D., Sagare, A. P., and Zlokovic, B. V. (2015). Cerebrospinal fluid biomarkers of neurovascular dysfunction in mild dementia and Alzheimer’s disease. J. Cereb. Blood Flow Metab. 35, 1055–1068. doi: 10.1038/jcbfm.2015.76
Vilar-Bergua, A., Riba-Llena, I., Nafría, C., Bustamante, A., Llombart, V., Delgado, P., et al. (2015). Blood and CSF biomarkers in brain subcortical ischemic vascular disease: involved pathways and clinical applicability. J. Cereb. Blood Flow Metab. 36, 55–71. doi: 10.1038/jcbfm.2015.68
Vladić, A., Strikić, N., Jurć, D., Zmajević, M., Klarica, M., and Bulat, M. (2000). Homeostatic role of the active transport in elimination of [3H]benzylpenicillin out of the cerebrospinal fluid system. Life Sci. 67, 2375–2385. doi: 10.1016/s0024-3205(00)00823-7
Weisner, B., and Bernhardt, W. (1978). Protein fractions of lumbar, cisternal and ventricular cerebrospinal fluid. Separate areas of reference. J. Neurol. Sci. 37, 205–214. doi: 10.1016/0022-510x(78)90204-6
Keywords: cerebrospinal fluid, biochemistry, phase-contrast magnetic resonance imaging, hydrocephalus, lumbar and ventricular total protein levels
Citation: Puy V, Zmudka-Attier J, Capel C, Bouzerar R, Serot J-M, Bourgeois A-M, Ausseil J and Balédent O (2016) Interactions between Flow Oscillations and Biochemical Parameters in the Cerebrospinal Fluid. Front. Aging Neurosci. 8:154. doi: 10.3389/fnagi.2016.00154
Received: 22 February 2016; Accepted: 14 June 2016;
Published: 29 June 2016.
Edited by:
Pedro Rosa-Neto, McGill University, CanadaReviewed by:
Karl Bechter, Ulm University, GermanyMarijan Klarica, School of Medicine University of Zagreb, Croatia
Diane Alicia De Zelicourt, University of Zurich, Switzerland
Copyright © 2016 Puy, Zmudka-Attier, Capel, Bouzerar, Serot, Bourgeois, Ausseil and Balédent. This is an open-access article distributed under the terms of the Creative Commons Attribution License (CC BY). The use, distribution and reproduction in other forums is permitted, provided the original author(s) or licensor are credited and that the original publication in this journal is cited, in accordance with accepted academic practice. No use, distribution or reproduction is permitted which does not comply with these terms.
*Correspondence: Olivier Balédent, olivier.baledent@chu-amiens.fr