 Cody Loomis1,2
 Robert Peuß3
 James B. Jaggard1,2
 Yongfu Wang3
 Sean A. McKinney3
 Stephan C. Raftopoulos4
 Austin Raftopoulos4
 Daniel Whu4
 Matthew Green2
 Suzanne E. McGaugh5
 Nicolas Rohner3,6
 Alex C. Keene1,2
 Erik R. Duboue2,4*
- 1Department of Biology, Charles E. Schmidt College of Science, Florida Atlantic University, Jupiter, FL, United States
- 2Jupiter Life Science Initiative, Florida Atlantic University, Jupiter, FL, United States
- 3Stowers Institute for Medical Research, Kansas City, MO, United States
- 4Harriet L. Wilkes Honors College, Florida Atlantic University, Jupiter, FL, United States
- 5Department of Ecology, University of Minnesota, St. Paul, MN, United States
- 6Department of Molecular and Integrative Physiology, KU Medical Center, Kansas City, KS, United States
A shift in environmental conditions impacts the evolution of complex developmental and behavioral traits. The Mexican cavefish, Astyanax mexicanus, is a powerful model for examining the evolution of development, physiology, and behavior because multiple cavefish populations can be compared to an extant, ancestral-like surface population of the same species. Many behaviors have diverged in cave populations of A. mexicanus, and previous studies have shown that cavefish have a loss of sleep, reduced stress, an absence of social behaviors, and hyperphagia. Despite these findings, surprisingly little is known about the changes in neuroanatomy that underlie these behavioral phenotypes. Here, we use serial sectioning to generate brain atlases of surface fish and three independent cavefish populations. Volumetric reconstruction of serial-sectioned brains confirms convergent evolution on reduced optic tectum volume in all cavefish populations tested. In addition, we quantified volumes of specific neuroanatomical loci within several brain regions that have previously been implicated in behavioral regulation, including the hypothalamus, thalamus, and habenula. These analyses reveal an enlargement of the hypothalamus in all cavefish populations relative to surface fish, as well as subnuclei-specific differences within the thalamus and prethalamus. Taken together, these analyses support the notion that changes in environmental conditions are accompanied by neuroanatomical changes in brain structures associated with behavior. This atlas provides a resource for comparative neuroanatomy of additional brain regions and the opportunity to associate brain anatomy with evolved changes in behavior.
Introduction
Shifts in environmental conditions drive evolutionary changes in development, morphology, and behavior (Peichel et al., 2001; Shapiro et al., 2004; Jeffery, 2009). While the genetic basis of many behaviors has been studied extensively, much less is known about how changes in brain anatomy accompany behavioral evolution. Interspecies comparative approaches are often used to associate anatomical or neural circuit changes with evolved behavioral differences (Shapiro et al., 1991; Jarvis, 2004; Schenker et al., 2008). However, these studies often focus on individual brain regions of interest and interpretations may be limited by the indirect nature of comparing different species. The generation of detailed brain atlases of distinct populations of the same species with divergent behavioral traits has potential to provide insight into the relationship between neuroanatomical evolution and behavior.
The Mexican cavefish, Astyanax mexicanus, provides the unique opportunity to investigate the relationship between brain anatomy and behavioral evolution in a single species (Yoshizawa et al., 2010; Elipot et al., 2013; Alié et al., 2018; Jaggard et al., 2018; Lloyd et al., 2018). These fish exist as an eyed, pigmented population that inhabits the rivers and streams of northeast Mexico and southern Texas, and at least 29 independent populations of largely blind and depigmented fish that inhabit the caves of northeast Mexico’s Sierra de El Abra and Sierra de Guatemala regions (Mitchell et al., 1977). Both surface and cave populations are interfertile, which allows for direct comparisons of populations from the same species with different and well-described habitats and evolutionary history (Şadoğlu, 1957; Wilkens, 1971). Comparisons between surface fish and cavefish populations reveal evolved differences in diverse behavioral traits ranging from social behavior to sleep, and the emergence of these behaviors in multiple cavefish populations has established A. mexicanus as a model for convergent evolution (Duboué et al., 2011; Elipot et al., 2013; Kowalko et al., 2013a, b; Chin et al., 2018).
A number of neuroanatomical differences have been identified between surface fish and cavefish, including a reduction in brain regions associated with visual processing in cavefish, and an expansion of the hypothalamus, which is associated myriad behaviors including social interaction, aggressive, and sleep (Soares et al., 2004; Menuet et al., 2007; Alié et al., 2018; Jaggard et al., 2018). Nevertheless, A. mexicanus lacks a detailed brain atlas, and little is known about the extent of neuro anatomical changes between individual populations of cavefish. Further, the resources for a whole-brain anatomical comparison between adult cave populations have not been developed, and it remains unclear if distinct or shared changes in brain anatomy underlie the behavioral differences observed between independently evolved cavefish populations.
Here, we used serial sectioning of Nissl-stained brains, followed by volumetric reconstruction to generate brain atlases for surface fish and three different populations of cavefish. Our analysis focuses on hypothalamic, thalamic and prethalamic, and habenular regions, which have previously been associated with behaviors known to diverge between surface fish and cavefish including responses to stress, social behavior, sleep regulation, feeding, and sensory processing (Duboué et al., 2011; Elipot et al., 2013; Kowalko et al., 2013a, b; Chin et al., 2018; Jaggard et al., 2018). Our findings reveal an expansion of thalamic and other regions in cavefish, accompanied by a reduction in regions associated with visual processing. Strikingly, some hypothalamic nuclei are enlarged in cavefish, while other hypothalamic regions remain unchanged. Together, these findings provided a detailed anatomical reference for A. mexicanus and provide insight into the anatomical plasticity that accompanies the evolution of multiple behaviors.
Results
Volumetric Reconstruction of Serial Sectioned Adult Brains
To generate an adult brain atlas, we serially sectioned brains of adult A. mexicanus from surface fish and three independent populations of cavefish: Pachón, Molino and Tinaja (Figure 1A). The Pachón and Tinaja populations are “old lineage” and are closely related, while fish from the Molino population represent a “new lineage” (Bradic et al., 2012). All cave populations are thought to have evolved independent of one another (Ornelas-García et al., 2008; Bradic et al., 2013; Herman et al., 2018). Surface fish used in this experiment are derived from a lineage that is more closely related to the Molino cave fish population than to Tinaja and Pachón (Herman et al., 2018). Brains were dissected from adult animals, sectioned serially at 8 μm thickness, stained with cresyl violet dye (Nissl), and imaged, resulting in 424–728 sections per brain (Table 1). We then aligned all brain slices using image registration techniques so that they aligned with one another, and imported the data into AMIRA 3D rendering software, where serial-sections were volumetrically reconstructed to generate a three-dimensional brain (Figure 1B and Supplementary Movies S1–S4).
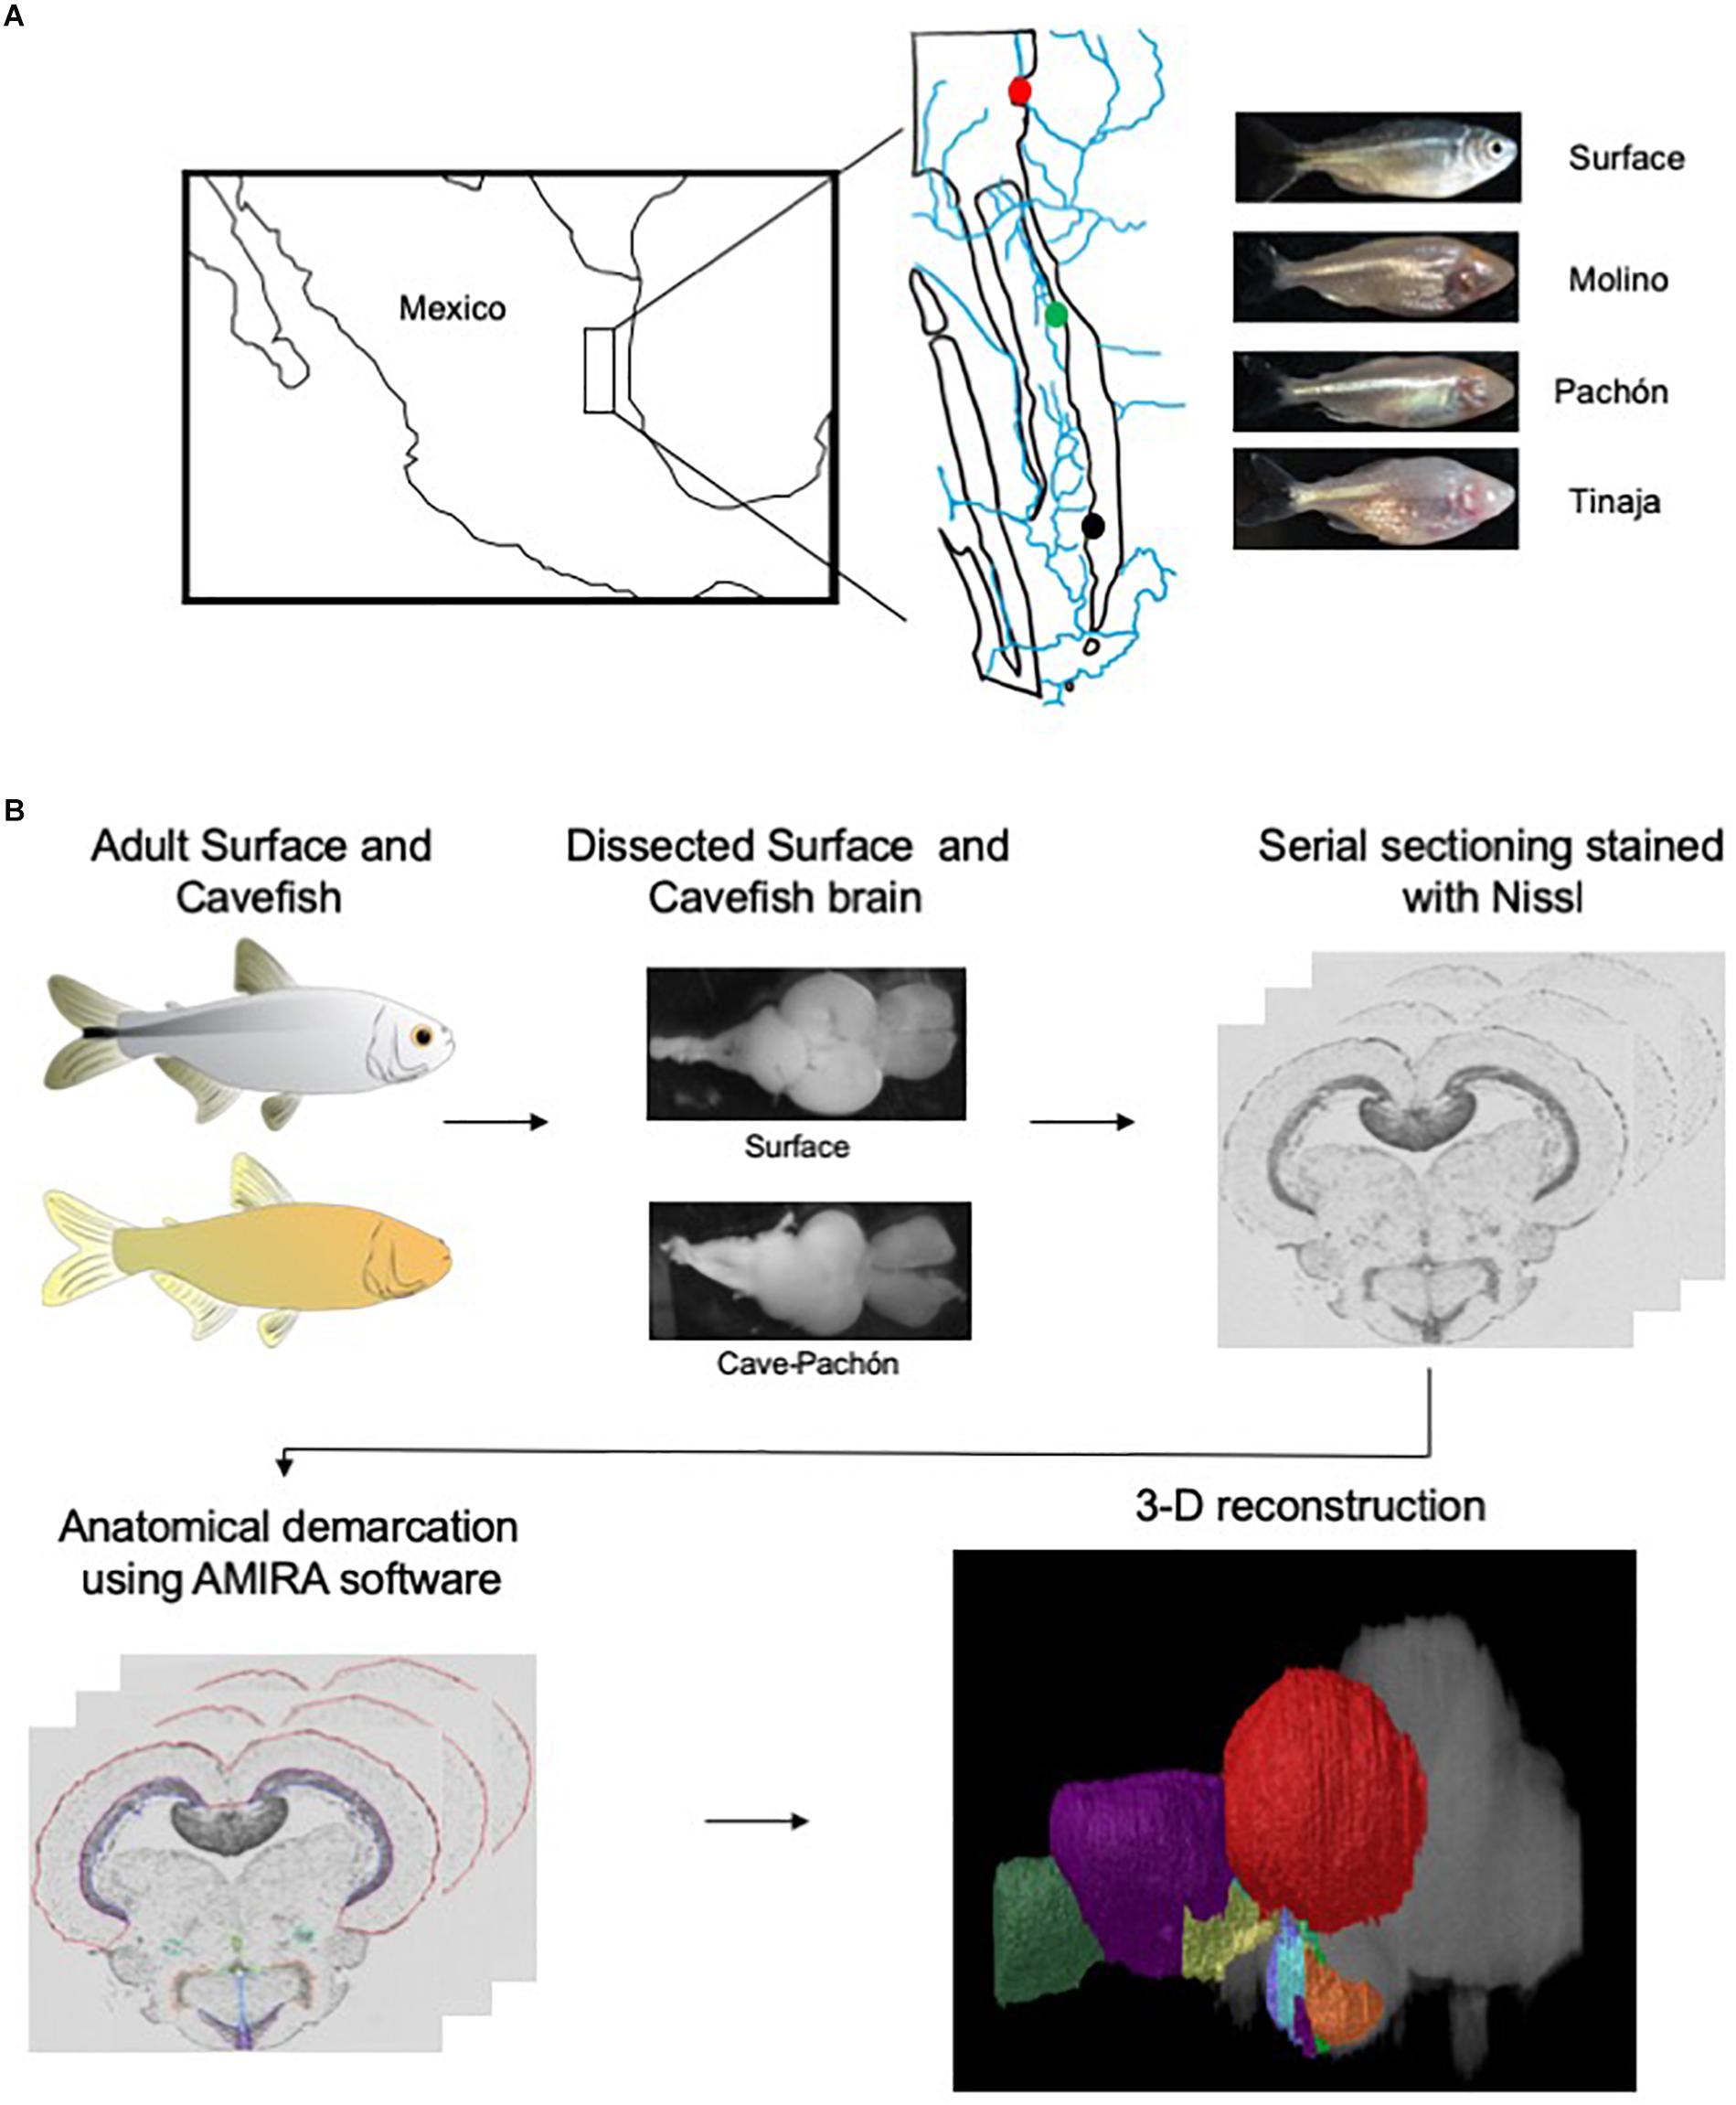
Figure 1. Overview of experimental design. (A) Map of Mexico with location of Molino (red), Pachón (green) and Tinaja (black) caves. (B) Flow chart diagraming experimental design and procedure.
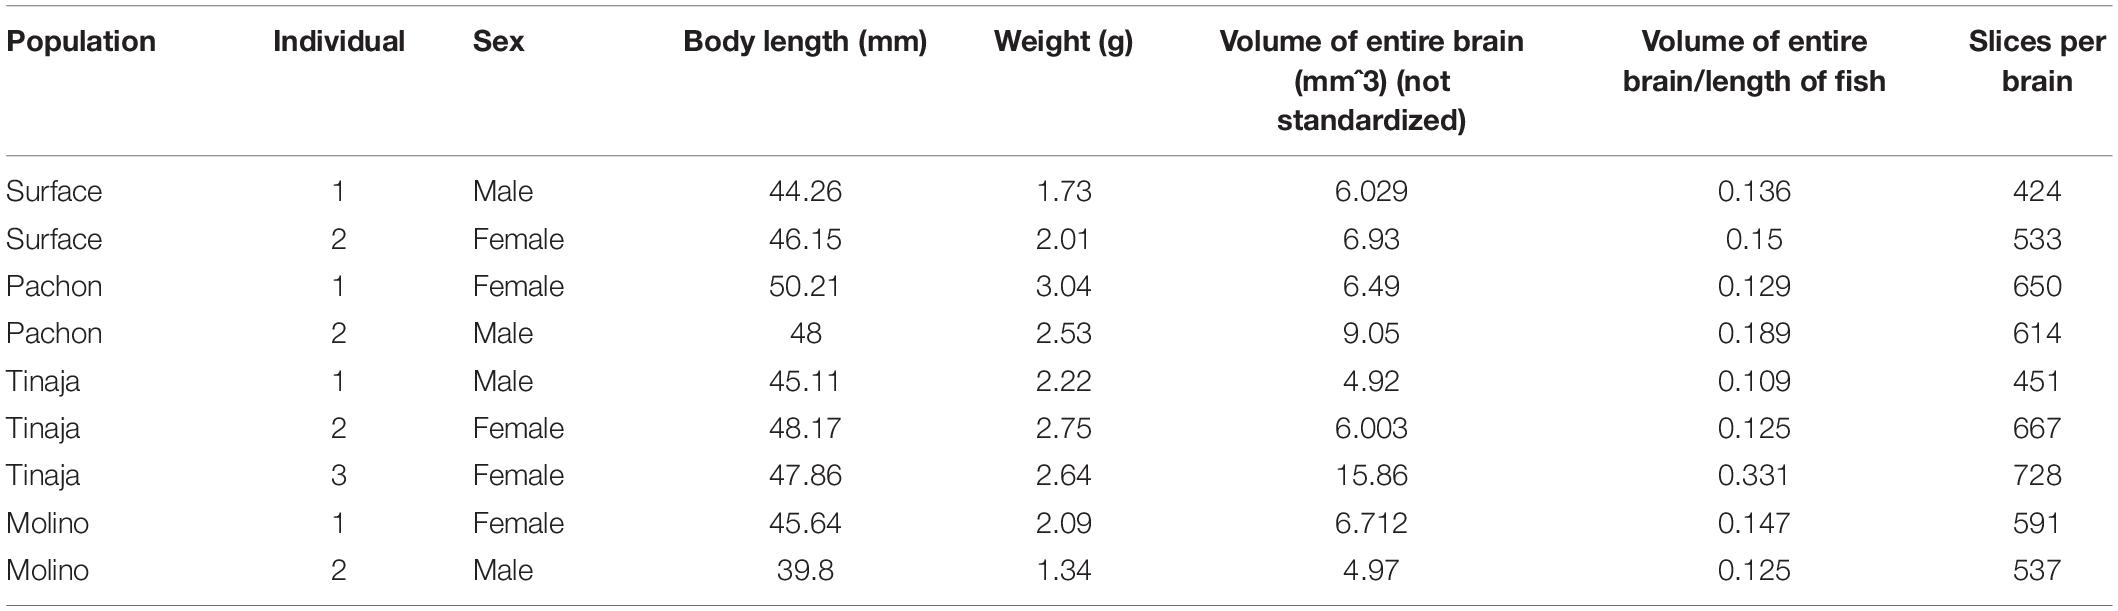
Table 1. Fish metrics.
Selected neuroanatomical regions in each brain were identified by comparing to an adult zebrafish brain atlas (Wulliman et al., 1996), and a previously annotated brain of cavefish from the Micos cave (Natke, 1999), a hybrid cave population (a cave with fish with that have both surface and cave-like traits) of the new lineage (Bradic et al., 2013). After locating individual neuroanatomical regions, we defined each brain nucleus by demarcating the boundaries of the region throughout serial sections using AMIRA (see section “Materials and Methods;” Figure 1B). We then quantified the volume of each region. The volume of each quantified region was normalized to the length of the fish, measured from the nose to the caudal tail, providing a measurement of relative volumetric enlargement or reduction in size between A. mexicanus populations (Table 2).
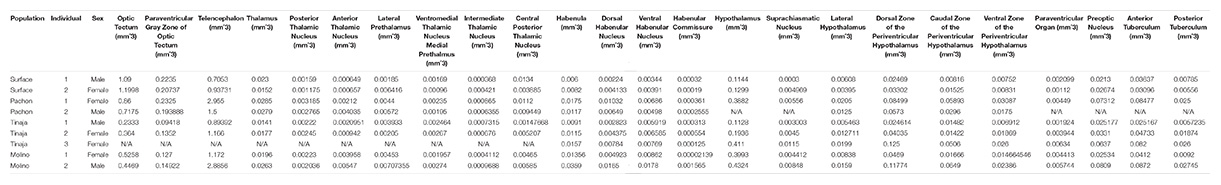
Table 2. Raw Data of neuroanatomical loci.
Regression of Optic Tectum Volume in Cavefish Populations
The optic tectum of A. mexicanus has been well studied, and the size, as well as afferent and efferent projections from the optic tectum have been established (Sligar and Voneida, 1976; Voneida and Sligar, 1976; Soares et al., 2004). As proof of principle, we first quantified the volume of the optic tectum (Figures 2A–C, red) and it’s corresponding periventricular gray zone (PGZ) (Figures 2A–C, blue), which have been reported as reduced in Pachón cavefish (Soares et al., 2004; Moran et al., 2015). The optic tectum in adult teleosts is a laminated structure. We measured the PGZ, which contains most cell bodies, as well the optic tectum minus the PGZ (TeO), which contains most fibers and synaptic connections. In agreement with previous findings, whole-brain reconstructions revealed a nearly two-fold reduction in the tectum size of Pachón, Molino and Tinaja cavefish compared to surface fish (Figures 2A–C). To increase power to detect statistical significance, we combined the total volume of the optic tectum of all cave populations and compared them to surface fish. This comparison revealed significant differences in volume between surface and cave morphs (Figure 2D). Quantification of total volumes between surface and the three cave populations revealed a substantial reduction in total volume (Pachón = 36.7% decrease in volume compared to surface fish, Tinaja = 76.2% decrease in volume compared to surface fish, Molino = 56.5% decrease in volume compared to surface fish). In addition to the optic tectum, the volume of the PGZ appeared qualitatively reduced across all three cave populations (Figure 2C), and quantification of volumes showed that the PGZ was significantly smaller in cave animals than that of surface fish (Pachón = 10.4% decrease in volume compared to surface fish, Tinaja = 50.0% decrease in volume compared to surface fish, Molino = 31.3% decrease in volume compared to surface fish) (Figure 2E). These findings extend previous observations in Pachón cavefish to Molino and Tinaja (Soares et al., 2004), revealing convergence on reduced size of the optic tectum in adult cavefish populations.
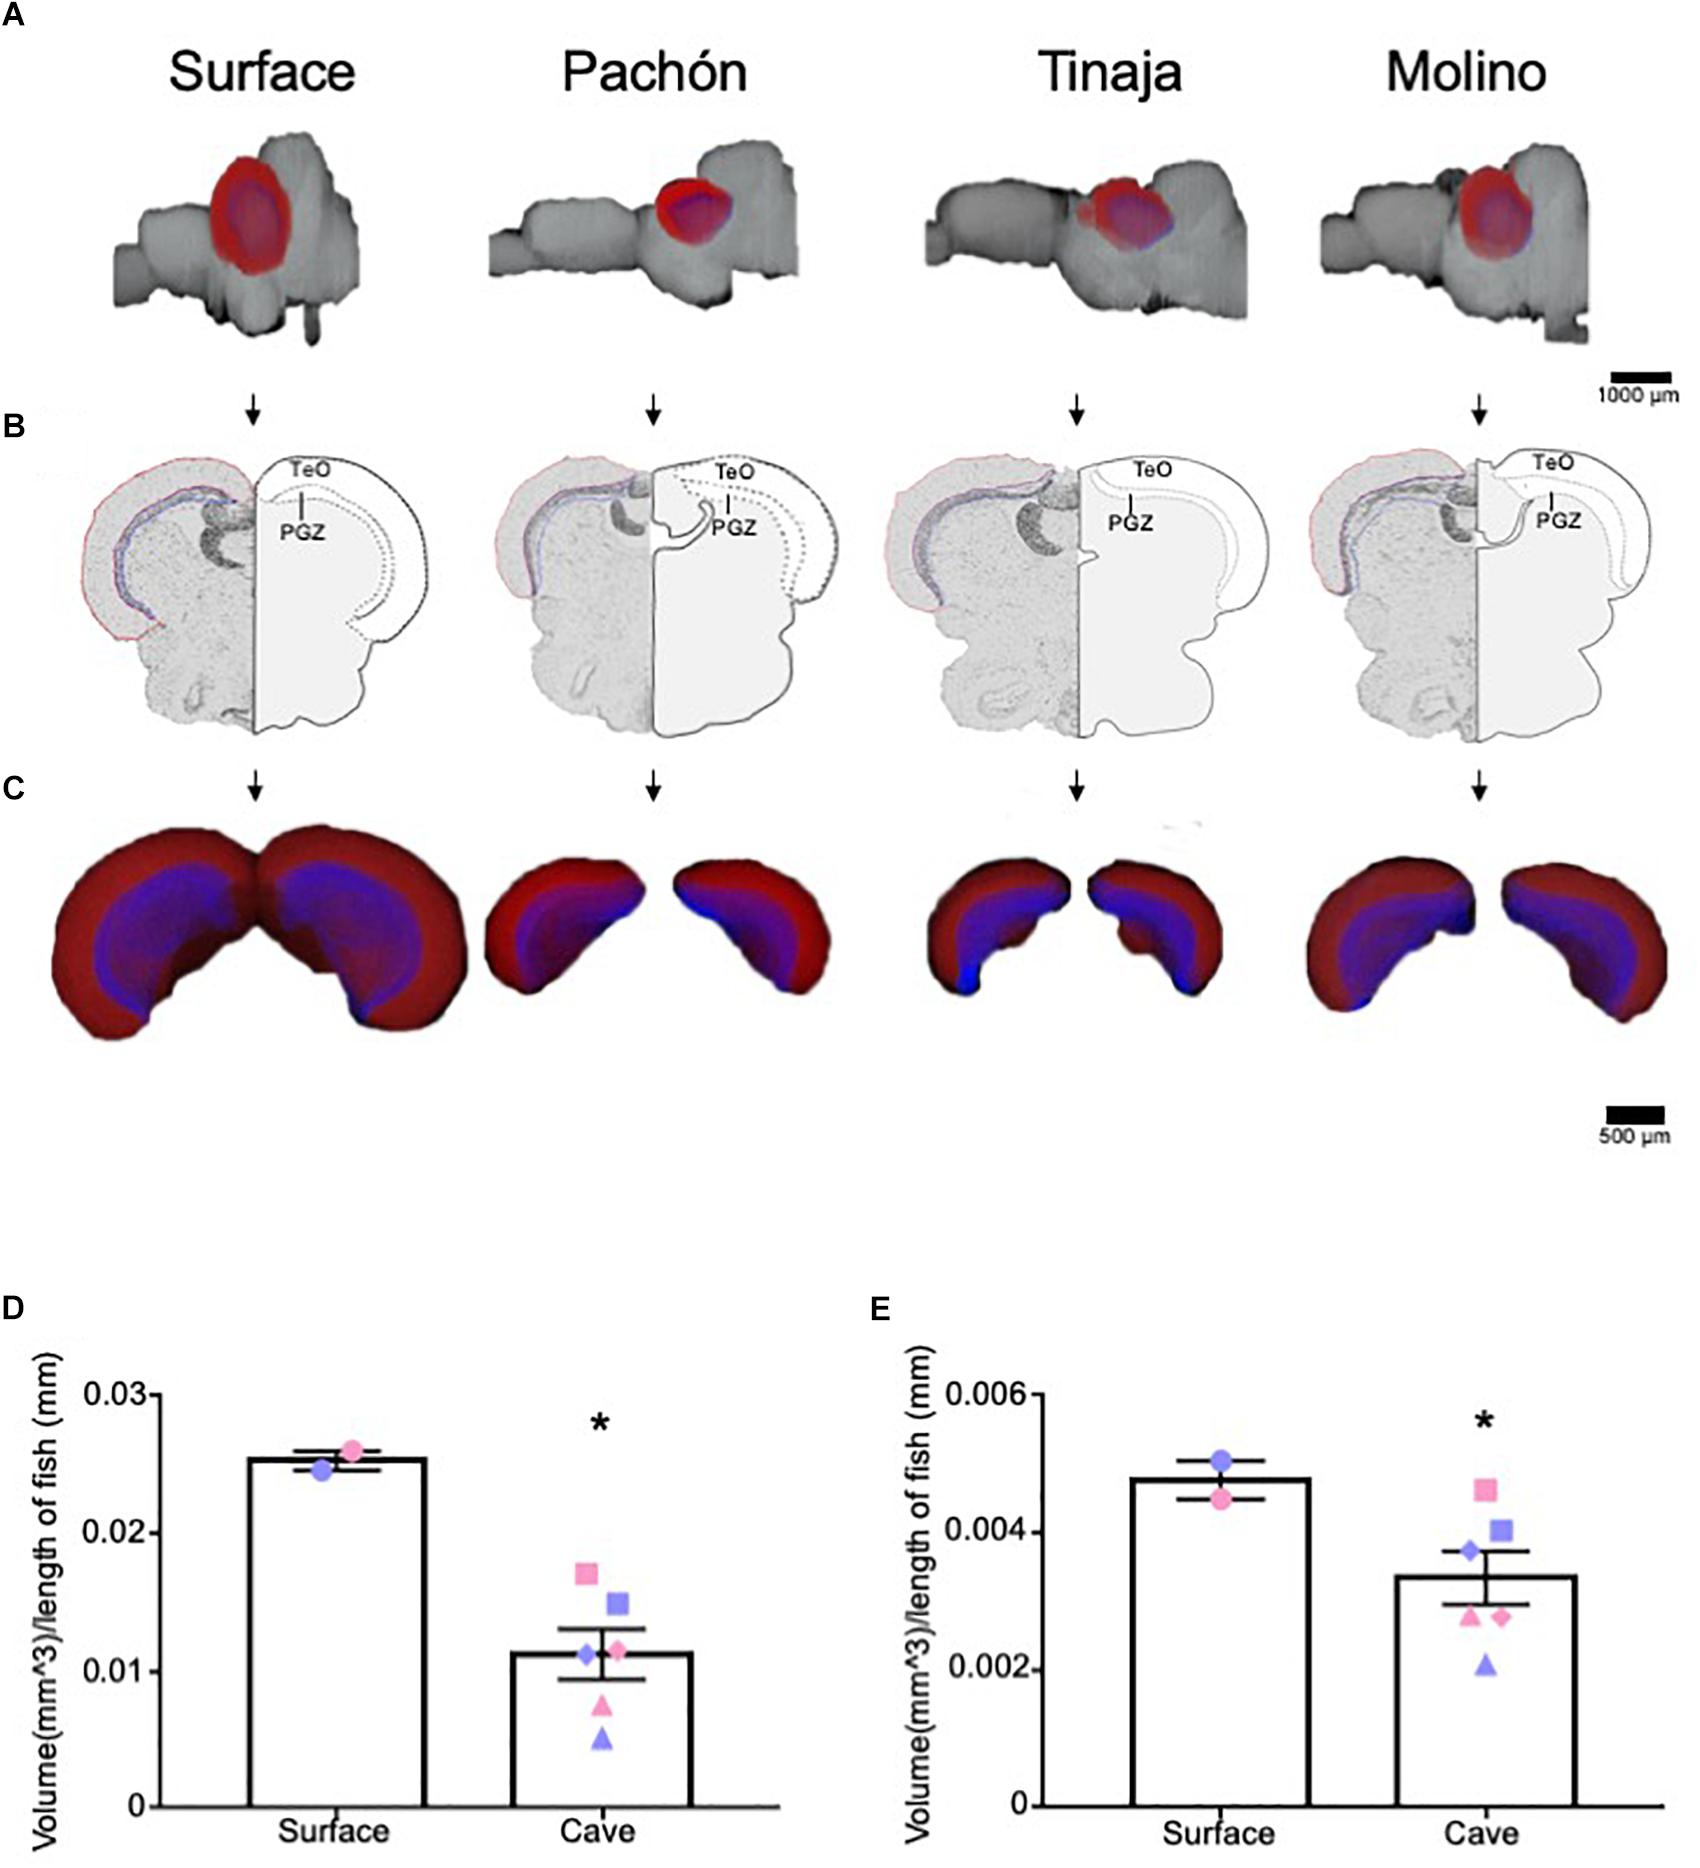
Figure 2. Three-dimensional reconstruction reveals regression of the optic tectum. (A) 3-D reconstructions of Surface, Pachón, Tinaja and Molino with optic tectum (TeO; red) and periventricular gray zone of the optic tectum (PGZ; blue) displayed. (B) Images of sections that were Nissl stained (left), and a cartoon of the demarcated TeO and PGZ shown (right). (C) 3-D reconstruction of the TeO and PGZ. Displayed from an anterior view. (D) Quantification of the volume of optic tectum, normalized to the length of the animal for surface fish and for the three cave populations. Optic tectum of cavefish was significantly smaller than those of surface fish conspecifics (surface fish 0.025 ± 0.0007, cavefish 0.011 ± 0.0018, t-test t = 4.224, df = 6, p < 0.05). Quantification of the volume of PGZ. The PGZ of most cavefish was smaller than those of surface animals (surface fish 0.005 ± 0.0003, cavefish 0.003 ± 0.0004, t-test t = 1.987, df = 6, p < 0.05). Graphs in D and E are the mean ± standard error of the mean. Asterisk represent significance below p = 0.05. Blue shapes on bar graphs denote males, whereas light red shapes denote females. Squares on graphs represent Pachón, triangles represent Tinaja and diamonds represent Molino.
Expansion of the Telencephalon in Cavefish Populations
The telencephalon modulates diverse behaviors that differ between surface and cavefish, including sleep, stress, and aggression (Kaslin et al., 2004; Portavella et al., 2004a, b; Elipot et al., 2013; Lal et al., 2018). Moreover, previous studies have mapped both the afferent and efferent projections of the telencephalon, as well as individual nuclei in the A. mexicanus brain (Riedel, 1997; Riedel and Krug, 1997). Given the importance of the telencephalon, we quantified telencephalic volume across A. mexicanus populations and found it to be expanded in all three populations of cavefish compared to surface fish (Figures 3A–C). Comparing total volume for surface fish and the combined data for cavefish populations revealed an increase in volume for all three cavefish populations, thought statistical significance was not reached (Figure 3D; Pachón = 150% increase in volume compared to surface fish, Tinaja = 22% increase in volume compared to surface fish, Molino = 172% increase in volume compared to surface fish). In addition, we observed differences in telencephalon shape between surface and cavefish populations. In all three cavefish populations the telencephalon is longer along the anterior-posterior axis than in surface fish (Figure 3A). Collectively, these data reveal a robust expansion of the telencephalon across three independent cavefish populations.
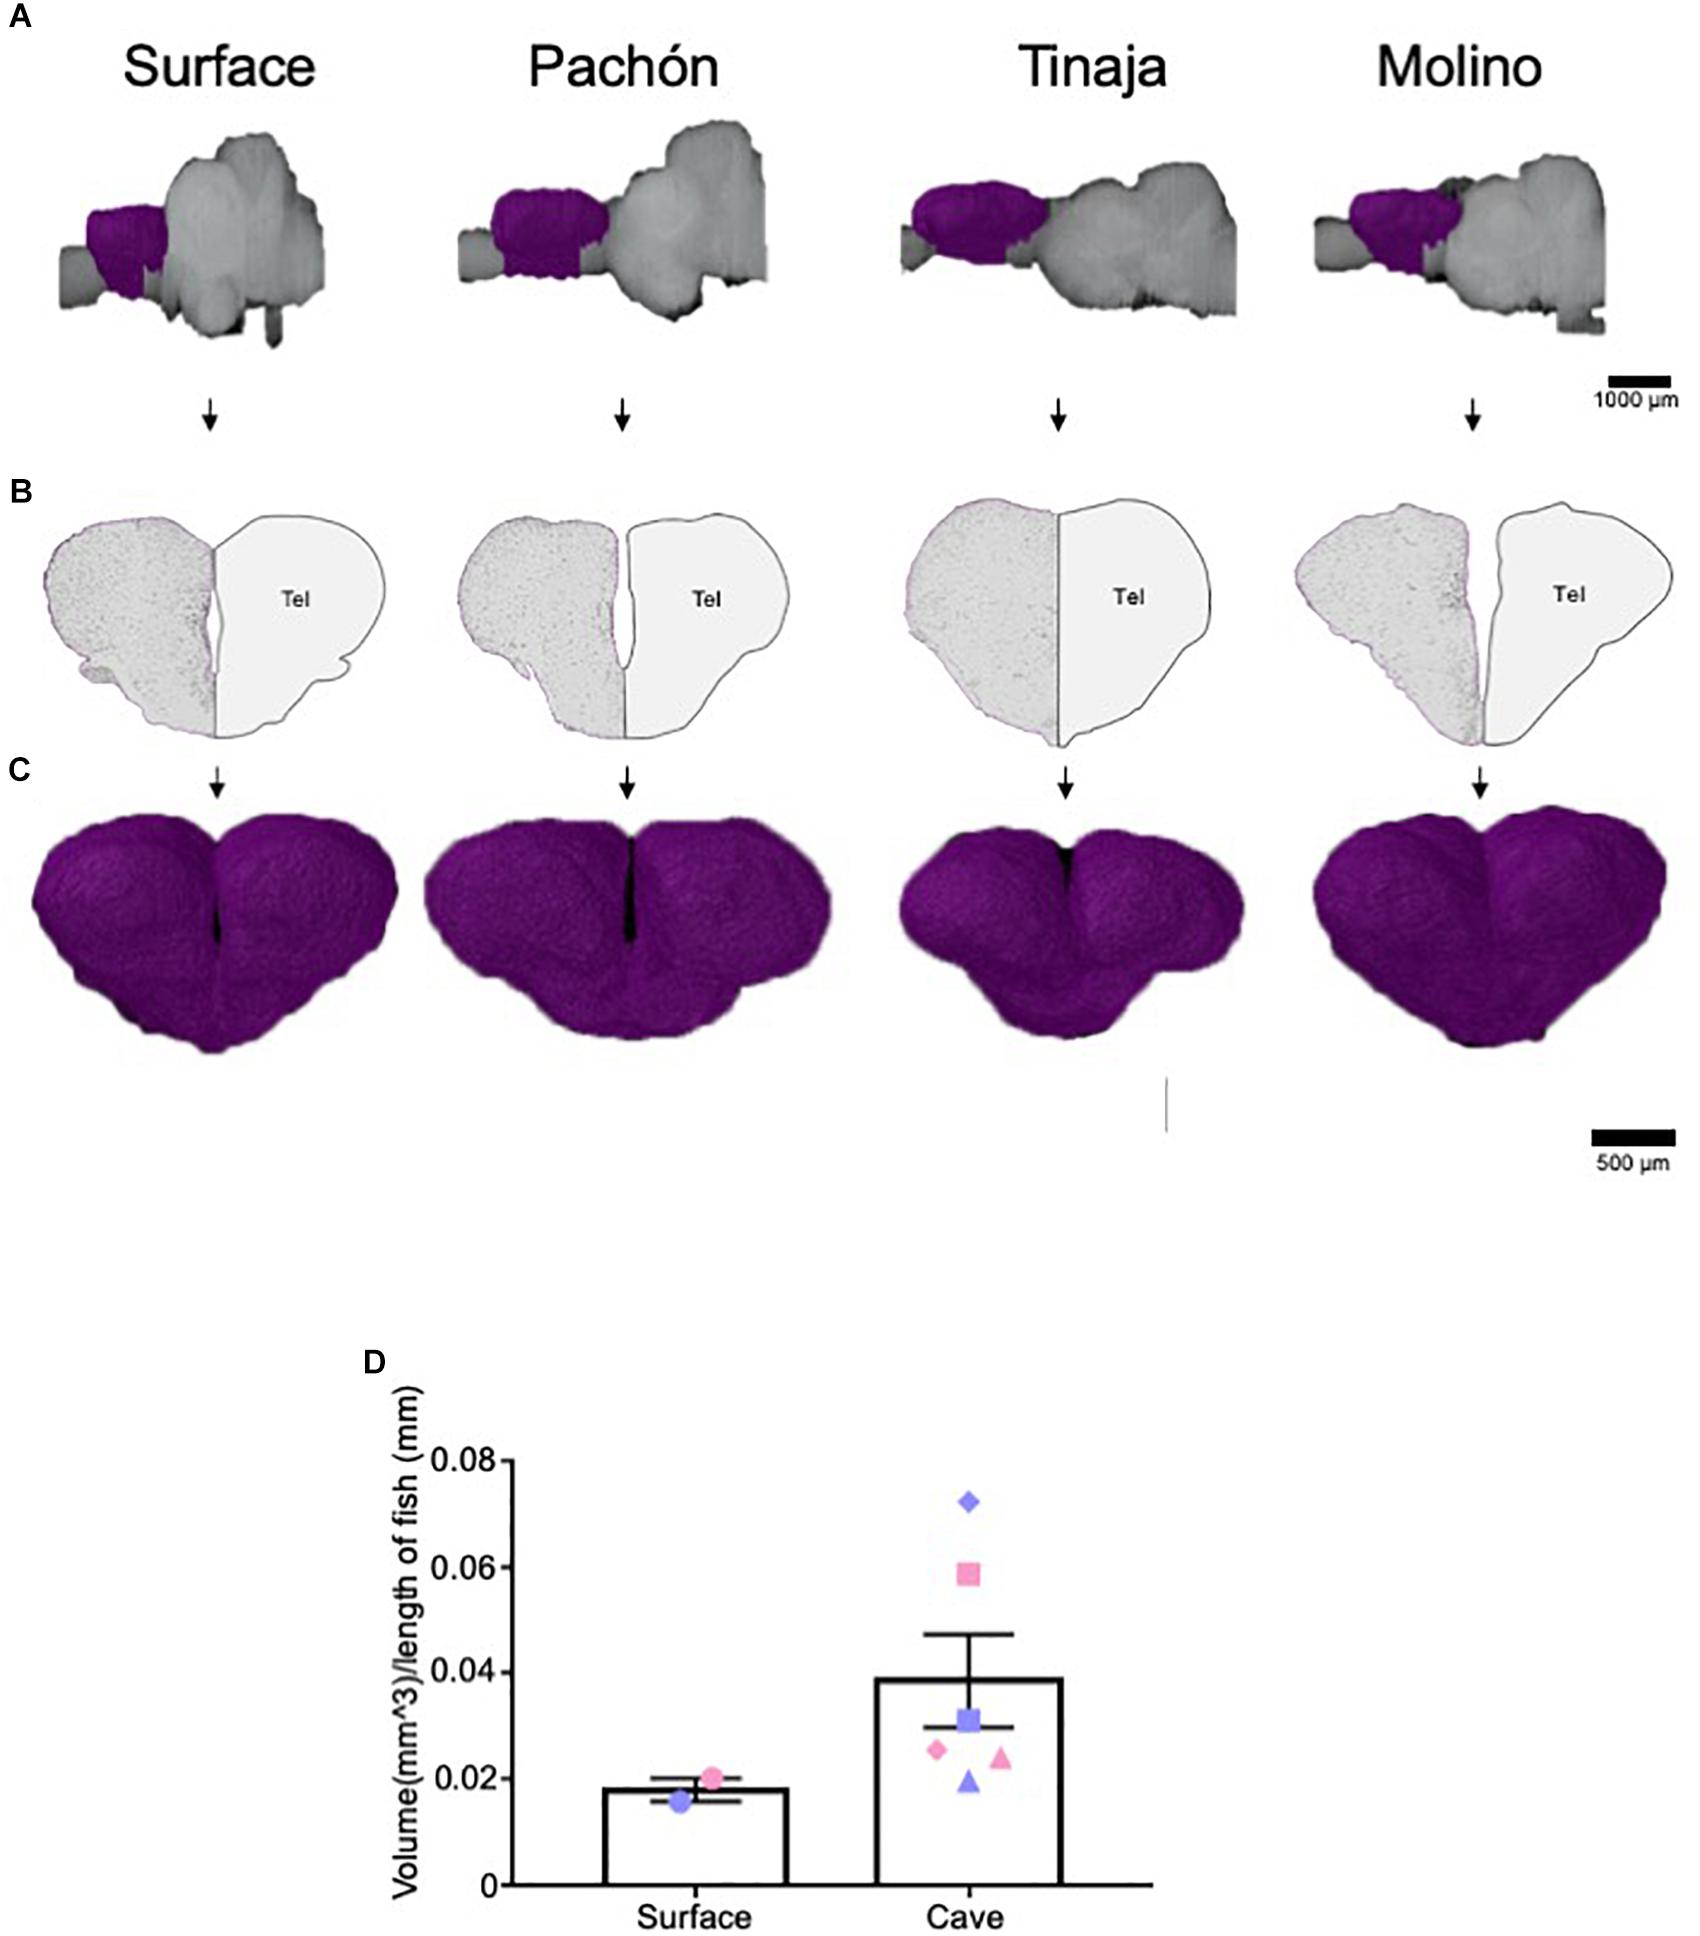
Figure 3. Expansion of telencephalon in cavefish populations. (A) 3-D reconstructions of Surface, Pachón, Tinaja, and Molino with demarcated telencephalon (purple) displayed. (B) Images of demarcated sections that were Nissl stained (left) and a cartoon of demarcated region (right). (C) Close up view of the 3-D reconstruction of the telencephalon from an anterior view. (D) The telencephalon from most cave animals was larger than that of surface conspecifics (Surface fish 0.018 ± 0.0022, Cave fish 0.039 ± 0.0088 t-test t = 1.276, df = 6, p = 0.12). Graph in panel (D) is the mean ± standard error of the mean. Blue points on bar graphs denote males, whereas light red denotes female. Square points on graphs represent Pachón, triangle points on graphs represent Tinaja and diamond points on graphs represent Molino.
Analysis of Thalamic and Habenular Nuclei
The thalamus is a central relay unit connecting the forebrain with downstream mid- and hindbrain targets, and different regions of the thalamus have been shown in mammals to modulate diverse behaviors including stress, aggression, and sleep (Chauveau et al., 2009; Shin and Liberzon, 2010; Kim et al., 2012; Li et al., 2014; Latchoumane et al., 2017; Fernandez et al., 2018). Moreover, anatomy and function of thalamic nuclei are conserved among mammals and fish (Mueller and Wullimann, 2009; Amo et al., 2010; Chou et al., 2016; Duboué et al., 2017). Quantification of the entire thalamus revealed no significant differences in gross volume between cave and surface fish (Figures 4A–D; Pachón = 28.3% increase in volume compared to surface fish, Tinaja = 20.0% decrease in volume compared to surface fish, Molino = 28.3% increase in volume compared to surface fish). We then examined volumetric differences between thalamic subnuclei, including the posterior (Tp), anterior (Ta), and central posterior (Tcp), as well as the lateral (VL), medial (VM) and intermediate (I) prethalamus [formerly called ventrolateral, ventromedial thalamus (Mueller, 2012)] (Supplementary Figure S1). Of these, the posterior thalamic nucleus and the medial prethalamus were significantly larger in the cavefish populations (Supplementary Figure S1). By contrast, no differences were observed for the other thalamic and prethalamic nuclei we examined (Supplementary Figures S1C–F); however, while not significant, all volumetric measurements for the anterior thalamic nucleus from cavefish were larger than those of the surface fish we scored (Supplementary Figure S1E).
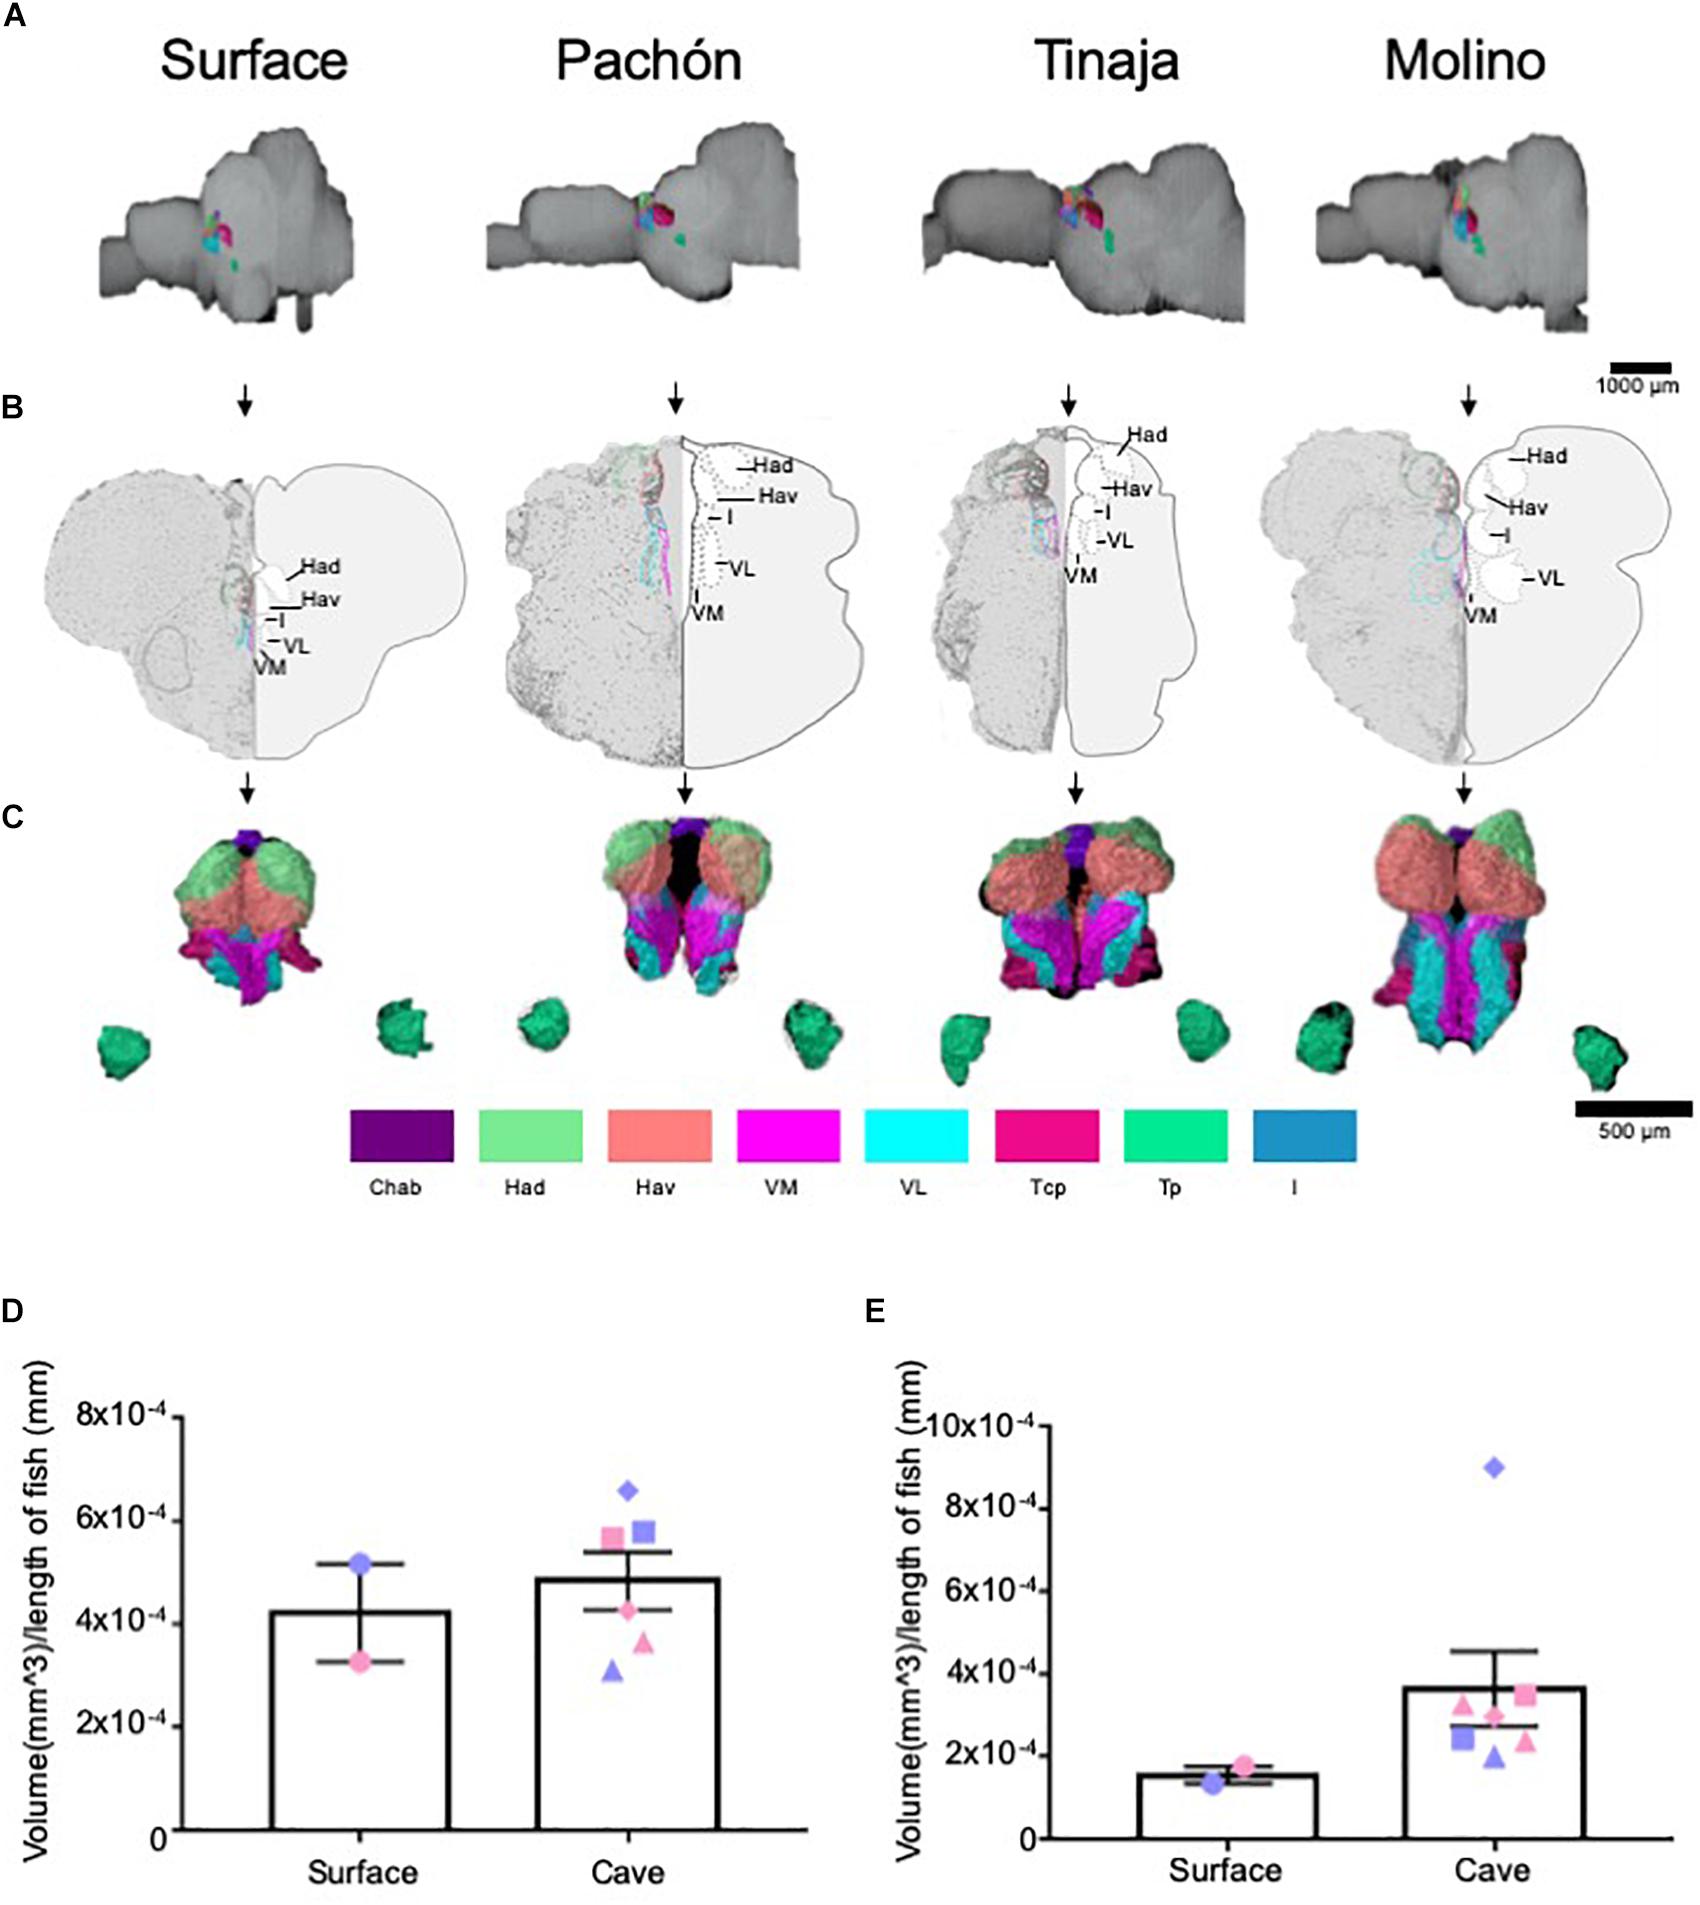
Figure 4. Quantification of the thalamus and habenulae reveals differences in some, but not all, subnuclei. (A) 3-D reconstructions of Surface, Pachón, Tinaja, and Molino with demarcated thalamus and habenula displayed. (B) Images of demarcated sections that were Nissl stained (left) and a cartoon of demarcated region (right). (C) 3-D reconstruction of subnuclei of the thalamus and habenulae, displayed from an anterior view. (D) Quantification of the total volume of the thalamus revealed no significant differences (surface fish 0.0004 ± 0.0001, cavefish 0.005 ± 0.0001, t-test t = 0.5519, df = 6, p = 0.30). (E) Quantification of the total volume of the habenulae revealed no significant differences (surface fish 0.00015 ± 0.00002, cavefish 0.0003 ± 0.00009, t-test t = 1.161, df = 6, p = 0.14). Graphs in panel (D,E) are the mean ± standard error of the mean. Color key for subnuclei (Chab = Habenula Commissure, Had = Dorsal Habenular Nucleus, Hav = Ventral Habenular Nucleus, VM = Ventromedial Prethalamus, VL = Ventrolateral Prethalamus, Tcp = Central posterior thalamic nucleus, Tp = Posterior thalamic nucleus, I = Intermediate Prethalamus). Blue points on bar graphs denote males, whereas light red denotes female. Square points on graphs represent Pachón, triangle points on graph represent Tinaja and diamond points on graph represent Molino.
The habenular nuclei are a conserved brain regions that also connect forebrain to midbrain (Sutherland, 1982; Viswanath et al., 2014). In rodents and other mammals, the habenulae have been shown to regulate diverse behaviors, including sleep, stress, feeding, and social interactions (Murray et al., 1994, Murphy et al., 1996; van Kerkhof et al., 2013; Stamatakis et al., 2016; Haun et al., 2018). Recently, the habenular nuclei have also been found to modulate similar behaviors in zebrafish (Agetsuma et al., 2010; Chou et al., 2016; Duboué et al., 2017). Because many of the behaviors modulated by the habenulae differ between surface fish and cavefish populations, we examined volumes of individual nuclei within the habenulae. The habenulae are comprised of the dorsal and ventral habenula, and its commissure (Duboué and Halpern, 2017), and this neuroanatomy is conserved among vertebrates (deCarvalho et al., 2014). The entire habenula was enlarged in all cavefish populations (Figures 4A–C,E; Pachón = 89.2% increase in volume compared to surface fish, Tinaja = 63.1% increase in volume compared to surface fish, Molino = 282.2% increase in volume compared to surface fish). Examining individual nuclei revealed an expansion of ventral habenular nucleus (Hav) in all cavefish examined, relative to surface fish though this did not reach statistical significance (Supplementary Figure S2A). By contrast, no differences were found in volumes of the dorsal habenulae (Had) or in the habenular commissure (Chab) (Supplementary Figures S2B,C). Taken together, these findings reveal differences within the ventral habenula of all cavefish studies relative to surface animals.
Analysis of the Hypothalamus Reveal Evolutionary Changes to Some but Not All Subnuclei
The hypothalamus controls numerous homeostatically regulated behaviors that are known to differ between surface fish and cavefish, including sleep, feeding, stress, and social behaviors (Duboué et al., 2011; Kowalko et al., 2013a, b; Chin et al., 2018; Lloyd et al., 2018; Zha and Xu, 2015). To determine whether these behavioral changes are accompanied by alterations in anatomy, we quantified the overall size of the hypothalamus, as well as individual subnuclei that modulate distinct behaviors in mammals (Figure 5 and Supplementary Figure S3). We found the total volume of the hypothalamus was significantly enlarged in the cavefish populations compared to surface fish (Figures 5A–D and Supplementary Movies S5–S8; Pachón = 185.2% increase in volume compared to surface fish, Tinaja = 85% increase in volume compared to surface fish, Molino = 263% increase in volume compared to surface fish). An expanded hypothalamus in cavefish has been demonstrated previously for larval forms (Menuet et al., 2007), and thus these data reveal that hypothalamic expansion is conserved through adulthood.
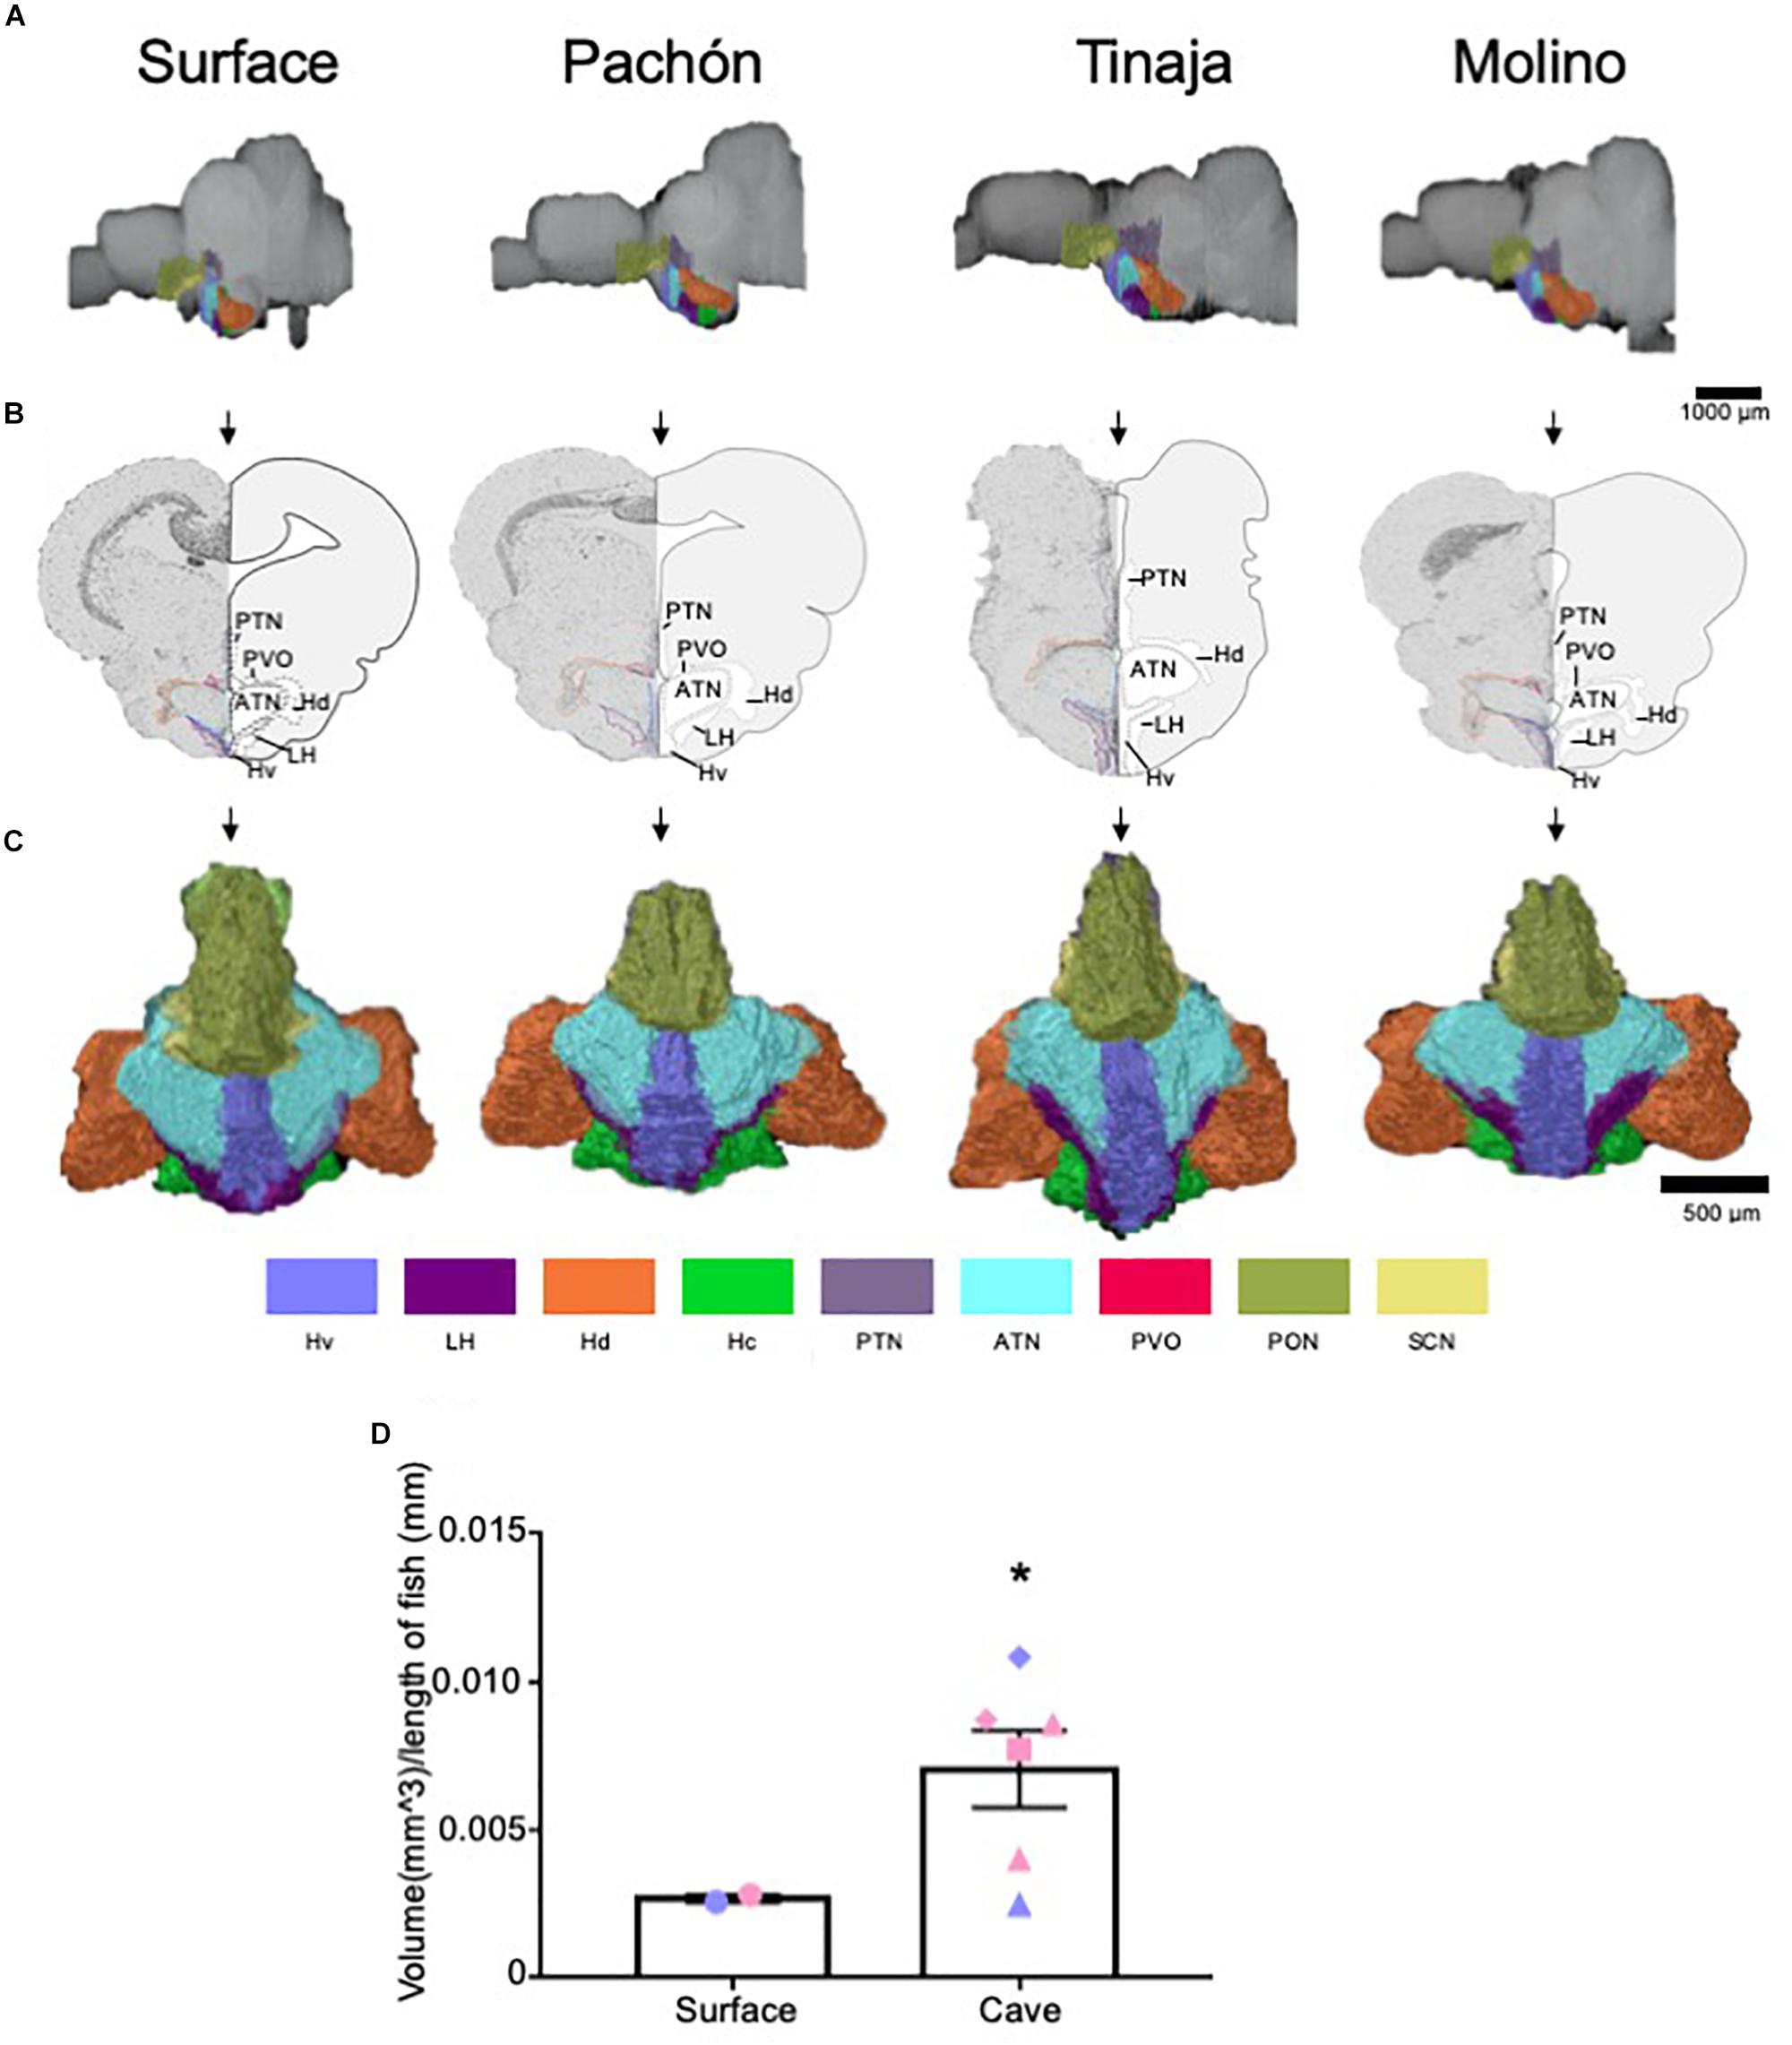
Figure 5. Quantification of the hypothalamus reveals expansion in cave populations. (A) 3-D reconstructions of Surface, Pachón, Tinaja and Molino with demarcated hypothalamus displayed. (B) Images of demarcated sections that were Nissl stained (left) and a cartoon of demarcated region (right). (C) 3-D reconstruction of the hypothalamus only, displayed from an anterior view. (D) Quantification of the total volume of the hypothalamus revealed expansion in cavefish (surface fish 0.0027 ± 0.0001, cavefish 0.0071 ± 0.0013, t-test t = 1.855, df = 6, p ≤ 0.05). Graph in D is the mean ± standard error of the mean. Color key for subnuclei (Hv = Ventral zone of periventricular hypothalamus, LH = Lateral hypothalamic nucleus, Hd = Dorsal zone of periventricular hypothalamus, Hc = Caudal zone of periventricular hypothalamus, PTN = Posterior tuberculum, ATN = Anterior tuberculum, PVO = Paraventricular organ PON = Preoptic nucleus, SCN = Superchiasmatic nucleus). Blue points on bar graphs denote males, whereas light red denotes female. Square points on graphs represent Pachón, triangle points on graphs represent Tinaja and diamond points on graphs represent Molino.
We next examined the volume of different hypothalamic subnuclei (Supplementary Figure S3). We first measured the suprachiasmatic nucleus (SCN). The SCN is a critical regulator of circadian rhythms in mammals (Moore, 1982; Moore and Whitmore, 2014). Surprisingly, no significant differences were observed in the SCN between surface and cavefish animals (Supplementary Figure S3A). By contrast, the size of the lateral hypothalamic nucleus, the ventral zone of periventricular hypothalamus, the paraventricular organ, caudal zone of periventricular hypothalamus, preoptic nucleus, the anterior tuberculum, and the posterior tuberculum appeared qualitatively larger in most cave individuals we examined. When we pooled the volumes of the cavefish and performed statistical analysis, we found the lateral hypothalamic nucleus, ventral zone of periventricular hypothalamus and the paraventricular organ were enlarged significantly in cave animals (Supplementary Figures S3B–D). Moreover, the volumes of the caudal zone of the periventricular hypothalamus and posterior tuberculum were found to approach significance (Supplementary Figures S3E,F, p = 0.07 for both). By contrast, whereas the volumes for the other hypothalamic nuclei were larger in most cave animals, the values did not reach statistical significance (Supplementary Figures S3E–I).
Discussion
We have generated an adult brain atlas for surface fish and three cavefish populations of A. mexicanus. A detailed adult brain atlas has been previously generated in zebrafish (Wulliman et al., 1996), and another brain atlas has been published in a cave/surface hybrid population of A. mexicanus cavefish (though it is untranslated from German) (Natke, 1999). These two resources provide a point of comparison for identifying neuroanatomical loci in cave and surface populations of A. mexicanus. An estimated ∼100–250 million years ago of divergence separate A. mexicanus and Danio rerio (Peng et al., 2006; Nakatani et al., 2011). We found that the gross neuroanatomy of A. mexicanus and zebrafish were largely similar, allowing for identification major brain structures.
Our analysis provides the first comparative brain atlas for surface and cave populations of A. mexicanus. The use of automated serial sectioning allows for volumetric reconstruction of brain regions and semi-quantitative comparisons of neuroanatomy between surface and cavefish populations. While this approach is technically feasible, practically it is limited due to the labor-intensive nature of manually tracing brain regions, and difficulties obtaining completely sectioned brains. In this study, we chose to focus on the visual system as a proof-of-principle, as well as the hypothalamus, thalamus, and habenula due to their known role in behavioral regulation. While the small number of replicates largely prevented statistical comparisons between individual cavefish populations, the robust volume differences observed between surface and cave populations for many brain regions suggest this approach may be practical for detailed anatomical comparison. Here, we have made all raw data available so that others may quantify additional brain regions of interest (Tables 1, 2, and data available upon request).
Brain atlases have been widely used in a number of species, including zebrafish, and have expanded greatly our understanding of how individual neuronal areas modulate myriad behaviors (Wulliman et al., 1996; Hawrylycz et al., 2011; Peng et al., 2011; Marquart et al., 2015; Milyaev et al., 2012; Mueller and Wullimann, 2015; Randlett et al., 2015). Brain atlases have been generated in larval zebrafish that provide near single-neuron resolution of brain structures (Ronneberger et al., 2012; Marquart et al., 2015; Randlett et al., 2015; Dunn et al., 2016). The transparency of zebrafish larvae allows for the application of functional imaging approaches (Ahrens et al., 2013; Muto et al., 2013), that can then be mapped on brain atlases to identify changes in activity within defined neurons (Dunn et al., 2016). A. mexicanus larvae, like zebrafish, are transparent, providing potential for the generation of a high-resolution brain atlas.
While the level of accuracy obtained with a larval atlas is not possible in adult fish using currently available technology due to the larger size of the brain and the need for sectioning, the added complexity of the adult brain and its similarity to rodents is particularly effective in comparative neuroanatomy. Further, a number of behaviors that differ between surface and cave individuals are not present in larval forms. For example, a loss of aggressive behavior has been documented in cavefish animals (Elipot et al., 2013), and other studies have demonstrated that cavefish do not school, whereas their surface conspecifics do (Kowalko et al., 2013b). Many behaviors, such as vibration attraction behavior, schooling, and differences in aggression, are not present in larval forms (Yoshizawa et al., 2010; Elipot et al., 2013; Kowalko et al., 2013b), and thus an adult atlas facilitates identification of brain regions that modulate more complex behaviors only seen in adults.
In this study, brain regions were standardized to the length of each individual fish, from the anterior most region of the nose to the beginning of the caudal tail. To correct for individual differences in size and growth rate, we normalized all brain volumes (Gallo and Jeffery, 2012). Quantitative comparisons between smaller neuroanatomical regions, such as individual nuclei within the hypothalamus or thalamus, may be confounded by large differences within other brain regions, such as the optic tectum. However, the variability in differences between subnuclei suggests localized changes in brain volume can be detected. As an example, most nuclei in the hypothalamus are expanded across cavefish populations, yet no differences are detected within the SCN for cavefish relative to surface.
Our findings identify the expansion of multiple hypothalamic nuclei, suggesting shared processes may govern evolved differences in hypothalamic development. The hypothalamus in cavefish larvae is expanded through a mechanism that is dependent on the differential expression of several morphogens and transcription factors, including sonic hedgehog and Nkx2.1 (Menuet et al., 2007). One hypothesis is that reduced anatomical constraints from eye-loss allow for hypothalamic expansion. A number of hypothalamic neuropeptides are known to be upregulated in cavefish including HCRT and NPY, which localize to the lateral hypothalamus and periventricular/lateral hypothalamus respectively (Alié et al., 2018; Jaggard et al., 2018; Jeong et al., 2018). Both of these nuclei are larger across all three populations of cavefish. Many hypothalamus-regulated behaviors including sleep (PON), feeding (Hl, PVN), aggression (PON), and sociality (PON) are altered in cavefish (Duboué et al., 2011; Elipot et al., 2013; Kowalko et al., 2013a, b; Miyasaka et al., 2014; Jaggard et al., 2018; Lloyd et al., 2018), suggesting hypothalamic function may be a under significant selective pressure.
In agreement with the previous literature, we identified convergent evolution of changes in brain regions associated with sensory processing (Soares et al., 2004; Moran et al., 2015; Hinaux et al., 2016). The optic tectum is significantly reduced across all three cavefish populations. These findings are consistent with an increased reliance on non-visual cues in cave animals (Bradic et al., 2013; Yoshizawa et al., 2013). This atlas allows for future studies examining the neuroanatomy of brain regions associated with non-visual cues. For example, taste buds are more numerous in cavefish (Bibliowicz et al., 2013; Hinaux et al., 2016) and the lateral line of cavefish is also significantly expanded, suggesting increased reliance on sensory processes that do not involve sight (Teyke, 1990; Yoshizawa et al., 2014). The sensory neurons from taste and mechanosensation neurons project to the nucleus of the solitary tract (NST) and medial octavolateralis nucleus (MON) within the brain, respectively (Puzdrowski, 1989; McCormick and Braford, 1994; Vendrell-Llopis and Yaksi, 2015). Based on findings from other sensory pathways, these regions may be predicted to be enlarged. Future analysis of serially sectioned brains will allow for detailed quantification and comparison of sensory structures between A. mexicanus populations.
Here, we used brains stained with Nissl, and demarcated manually individual regions of the adult brain. We see two main future expansions of this work. First, future efforts will streamline the labor-intensive approach of manual demarcation of individual regions. Similar large-scale neuroanatomical reconstruction efforts, such as electron microscopy tracing of the Drosophila brain have been successful in analyzing large data sets like these (Zheng et al., 2018). It is also possible that automated tracing methodology may be developed to reduce the time required for analysis. Further, future imaging of additional serially-section brains may allow for more quantitative comparisons between populations. Second, in zebrafish and other models, transgenic labeling of precise neuronal population has facilitated greatly the demarcation of individual neuronal regions (Kawakami et al., 2000; Scott et al., 2007). Moreover, transgenic labeling of neurons in the brain permits tracing of neuronal projections, something that is not possible with Nissl staining (deCarvalho et al., 2013; Miyasaka et al., 2014). Whereas transgenic technology has not been widely used in A. mexicanus, recent studies have shown that the Tol2 system, which is widely used in zebrafish, is highly effective in A. mexicanus surface and cavefish (Elipot et al., 2014; Stahl et al., 2019a, b). Future work incorporating these tools would facilitate a highly defined neuroanatomical brain atlas for the A. mexicanus adult brain.
Materials and Methods
Fish Husbandry
Animal care and husbandry was carried out as previously described (Borowsky, 2008; Jaggard et al., 2018). Briefly, adult A. mexicanus stocks were originally obtained from the Jeffery (University of Maryland) or Borowsky laboratories (New York University). These fish have been bred and maintained on a recirculating aquatics system at Florida Atlantic University. The water temperature was maintained at 23 ± 1°C, and the lights were maintained on a 14:10 LD cycle (25–40 lux at lights on). All fish were fed a mix of fish flakes (TetraMin) and California black worms (Aquatic Foods). All experiments in this study were approved by the Institutional Animal Care and Usage Committee (IACUC) at Florida Atlantic University, protocol numbers A17–21 and A15–32, or the IACUC at Stowers Institute for Medical Research. All fish used in this study were approximately 1 year old. A total of 10 brains were dissected and analyzed per population. We used 1 male and 1 female brains from surface population, 1 male and 1 female brains from Pachón population, 1 male and 2 female brains from Tinaja population, and 1 male and 1 female brains from Molino population. In some cases, brains could not be quantified for all neuroanatomical regions due to tissue damage.
Sectioning
Fish were euthanized by incubation in MS-222 (500 mg/L) for 10 min and decapitated using sharp scissors. The head was immediately fixed with freshly prepared 4% paraformaldehyde (PFA, diluted from 16% (wt/vol) aqueous solution, Electron Microscopy Sciences, cat# 15710) in 1 × PBS for 48 h at 4°C with a change of 4% PFA/1×PBS after 3 h. Heads were washed three times in 1×PBS and subsequently, brains were dissected according to Moran et al. (2015). Brains were dehydrated through graded ethanol (30, 50, and 70%) and processed with a PATHOS Delta hybrid tissue processor (Milestone Medical Technologies, Inc., MI) followed by paraffin embedding. Coronal slices of paraffin sections with 8 μm thickness were continuously cut using a Leica RM2255 microtome (Leica Biosystems Inc., Buffalo Grove, IL, United States) and mounted on Superfrost Plus microscope slides (cat# 12-550-15, Thermo Fisher Scientific). Nissl staining was performed as described in Vacca (1985). Briefly, sections were deparaffinized and hydrated in distilled water. Sections were stained in cresyl echt violet (0.5 g cresyl echt violet (CI 51010); 80 mL distilled water; 20 mL absolute alcohol) for 8 min, briefly rinsed in distilled water, dehydrated with 95% absolute alcohol 2 times, subsequently cleared in 2 changes of xylene and finally mounted. Slides were scanned using an Olympus slide scanner VS120 with a 20× objective. Images were extracted from VSI files in sequence using a customized plugin in Fiji (ver 1.51H) (Schindelin et al., 2012), a mask constructed, and registered using a multithreaded version of StackReg1 (Thévenaz et al., 1998). Blank spaces in the registered image were filled with artificial noise that matched the all-white background using a custom plugin in Fiji. Plugins are available at https://github.com/jouyun/smc-plugins and https://github.com/cwood1967/IJPlugins/.
Volumetric Reconstruction
ImageJ FIJI (ver 1.51H) (Schindelin et al., 2012) was used to convert serial sections to a .tif image sequence. Image sequence was uploaded into the AMIRA software (ver 6.2.0, Thermo Fisher, Waltham, MA, United States). To create proper demarcations, neuroanatomical regions of interest (ROIs) from Nissl stains were set under the “segmentation” tab using the lasso tool. To view 3-dimensional reconstructions of neuroanatomical ROI’s, a “volren” object was created under the “project” tab. Each volren object was connected to the original .tif image sequence as well as the label fields used to create demarcated neuroanatomical ROI’s.
Measurements and Statistical Analysis
To quantify total volume of induvial demarcated regions (i.e., each ROI), we used the “volume per VOI” result of the “material statistics” function in AMIRA (ver 6.2.0). To correct for differences in size and growth rate among different fish populations, all volumetric results were normalized to the length of the fish, from the anterior nose to the caudal tail. Volumetric measurements were thus calculated as a ratio of volume relative to this length. For statistical comparisons of ROI volumes between two groups (i.e., the pooled cavefish data compared to surface), we used a standard t-test. All statistics were performed using GraphPad Prism (ver 7.0).
Data Availability Statement
Original data underlying this manuscript can be accessed from the Stowers Original Data Repository at http://www.stowers.org/research/publications/libpb-1427. All original and analyzed data will also be provided upon request.
Ethics Statement
The animal study was reviewed and approved by Florida Atlantic University Institutional Animal Care and Usage Committee, protocol numbers A17-21 and A15-32 Florida Atlantic University Institutional Animal Care and Usage Committee, protocol number 2019-084 Stowers Institutional Animal Care and Usage Committee.
Author Contributions
CL, NR, SEM, AK, and ED designed the experiments. RP, YW, SAM, and NR collected brains and performed serial sectioning, and registration. CL oversaw analysis of data. CL, JJ, AR, SR, DW, and MG analyzed the data. CL, AK, and ED wrote the manuscript with significant input from SAM, NR, and RP.
Funding
This work was supported by grants R15MH118625 to ED, award R21NS105071 to ED and AK, and R01GM127872, NSF IOS165674, and BSF2018-190 to AK, and by institutional funding to NR. NR was supported by the Edward Mallinckrodt Foundation and JDRF. RP was supported by a grant from the Deutsche Forschungsgemeinschaft (PE 2807/1-1).
Conflict of Interest
The authors declare that the research was conducted in the absence of any commercial or financial relationships that could be construed as a potential conflict of interest.
Acknowledgments
We would like to acknowledge Nancy Thomas and the histology core at the Stowers Institute for support on the brain sectioning. Furthermore, we would like to thank the aquatics team at the Stowers Institute for husbandry of the fish.
Supplementary Material
The Supplementary Material for this article can be found online at: https://www.frontiersin.org/articles/10.3389/fnana.2019.00088/full#supplementary-material
FIGURE S1 | Analysis of different thalamic subnuclei reveals expansion of some, but not all, regions. (A) Quantification of the posterior thalamic nucleus shows a significant expansion of volume in cavefish (surface fish 3.07e-5 ± 5.2e-6, cavefish 5.35e-5 ± 2.34e-6, t-test t = 4.637, df, p < 0.05). (B) Analysis of medial prethalamus shows a significant expansion in volume of cave fish (surface fish 2.96e-5 ± 8.6e-6, cavefish 5.16e-5 ± 4.23e-6, t-test t = 2.524, df = 6, p < 0.05). (C–F) There were no differences between the lateral prethalamus (C), intermediate prethalamus (D), anterior thalamic nucleus (E) and central posterior thalamic nucleus (F) (VL = surface fish 9.04e-5 ± 4.86e-5, cavefish 0.0001 ± 1.81e-5, t-test t = 0.298, df = 6, p = 0.38; I = surface fish 1.47e-5 ± 6.34e-6, cavefish 1.55e-5 ± 2.05e-6, t-test t = 1.823, df = 6, p = 0.43; Ta = surface fish 1.45e-5 ± 2.5e-7, cavefish 6.93e-5 ± 1.72e-5, t-test t = 1.751, df = 6, p = 0.06; Tcp = surface fish 0.0002 ± 0.0001, cavefish 0.0001 ± 2.83e-5, t-test t = 0.8033, df = 6, p = 0.22). All graphs are the mean ± standard error of the mean. Blue points on bar graphs denote males, whereas light red denotes female. Asterisk represent significance below p = 0.05. Square points on graphs represent Pachón, triangle points on graphs represent Tinaja and diamond points on graphs represent Molino.
FIGURE S2 | Analysis of different habenulae subnuclei reveals expansion of subnuclei, some approaching significance. (A) Quantification of the ventral habenular nucleus shows a general expansion in cavefish (surface fish 8.12e-5 = 3.5e-6, cavefish 0.0002 = 4.45e-5, t-test t = 1.206, df = 7, p = 0.13). (B) Quantification of dorsal habenular nucleus shows no difference between surface and cavefish (surface fish 0.0002 ± 0.0001, cavefish 0.0002 ± 4.48e-5, t-test t = 0.198, df = 7, p = 0.42). (C) Analysis of the habenula commissure showed no significance between morphs (surface fish 5.67e-6 ± 1.57e-6, cavefish 1.05e-5 ± 4.94e-6, t-test t = 0.4997, df = 7, p = 0.31). All graphs are the mean ± standard error of the mean. Blue points on bar graphs denote males, whereas light red denotes female. Square points on graphs represent Pachón, triangle points on graphs represent Tinaja and diamond points on graphs represent Molino.
FIGURE S3 | Analysis of different hypothalamic subnuclei reveals significant expansion of lateral, dorsal, and caudal hypothalamus in cavefish while others remain similar to surface fish. (A) Analysis of the suprachiasmatic nucleus showed no difference between morphs (surface fish 5.69e-5 ± 5.01e-5, cavefish 0.0001 ± 2.92e-5, t-test t = 1.369, df = 6, p = 0.11). (B–D) Significant differences were observed between the lateral hypothalamic nucleus (LH) (B), ventral zone of periventricular hypothalamus (Hv) (C) and paraventricular organ (PVO) (D) (LH = surface fish 0.0001 ± 2.55e-5, cavefish 0.0003 ± 4.46e-5, t-test t = 2.062, df = 7, p < 0.05; Hv = surface fish 0.0002 ± 5e-6, cavefish 0.0004 ± 6.37e-5, t-test t = 2.01, df = 7, p < 0.05; PVO = surface fish 3.59e-5 ± 1.16e-5, cavefish 9.79e-5 ± 1.47e-5, t-test t = 2.242, df = 6, p < 0.05). (E,F) Analysis of the caudal zone of periventricular hypothalamus (Hc) (E), posterior tuberculum (PTN) (F) showed an enlargement in cavefish that approached significance (Hc = surface fish 0.0002 ± 1.58e-5, cavefish 0.0008 ± 0.0002, t-test t = 1.603, df = 7, p = 0.07; PTN = surface fish 0.001 ± 2.85e-5, cavefish 0.0004 ± 8.71e-5, t-test t = 1.627, df = 6, p = 0.07). (G–I) Quantification of the anterior tuberculum (ATN) (G), dorsal zone of periventricular hypothalamus (Hd) (H) and preoptic nucleus (PON) (I) show no difference between surface and cavefish (ATN = surface fish 0.0007 ± 7.5e-5, cavefish 0.0013 ± 0.0003 t-test t = 1.283, df = 6, p = 0.12; Hd = Surface fish 0.0006 ± 7.85e-5, Cave fish 0.0015 ± 0.0003, t-test t = 1.345, df = 7, p = 0.11; PON = Surface fish 0.0005 ± 4.95e-5, Cave fish 0.0011 ± 0.0002, t-test t = 1.275, df = 6, p = 0.12). All graphs are the mean ± standard error of the mean. Asterisk represent significance below p = 0.05. Blue points on bar graphs denote males, whereas light red denotes female. Square points on graphs represent Pachón, triangle points on graphs represent Tinaja and diamond points on graphs represent Molino.
MOVIE S1 | Three-dimensional reconstruction of whole brain from surface fish.
MOVIE S2 | Three-dimensional reconstruction of whole brain from Pachón cavefish.
MOVIE S3 | Three-dimensional reconstruction of whole brain from Tinaja cavefish.
MOVIE S4 | Three-dimensional reconstruction of whole brain from Molino cavefish.
MOVIE S5 | Three-dimensional reconstruction of hypothalamus from surface cavefish.
MOVIE S6 | Three-dimensional reconstruction of hypothalamus from Pachón cavefish.
MOVIE S7 | Three-dimensional reconstruction of hypothalamus from Tinaja cavefish.
MOVIE S8 | Three-dimensional reconstruction of hypothalamus from Molino cavefish.
References
Agetsuma, M., Aizawa, H., Aoki, T., Nakayama, R., Takahoko, M., Goto, M., et al. (2010). The habenula is crucial for experience-dependent modification of fear responses in Zebrafish. Nat. Neurosci. 13, 1354–1356. doi: 10.1038/nn.2654
Ahrens, M. B., Orger, M. B., Robson, D. N., Li, J. M., and Keller, P. J. (2013). Whole-brain functional imaging at cellular resolution using light-sheet microscopy. Nat. Methods 10, 413–420. doi: 10.1038/nmeth.2434
Alié, A., Devos, L., Torres-Paz, J., Prunier, L., Boulet, F., Blin, M., et al. (2018). Developmental evolution of the forebrain in cavefish, from natural variations in neuropeptides to behavior. eLife 7:e32808. doi: 10.7554/eLife.32808
Amo, R., Aizawa, H., Takahoko, M., Kobayashi, M., Takahashi, R., Aoki, T., et al. (2010). Identification of the Zebrafish ventral habenula as a homolog of the mammalian lateral habenula. J. Neurosci. 30, 1566–1574. doi: 10.1523/JNEUROSCI.3690-09.2010
Bibliowicz, J., Alié, A., Espinasa, L., Yoshizawa, M., Blin, M., Hinaux, H., et al. (2013). Differences in chemosensory response between eyed and eyeless Astyanax mexicanus of the Rio Subterráneo cave. Evodevo 4:25. doi: 10.1186/2041-9139-4-25
Borowsky, R. (2008). Breeding Astyanax mexicanus through natural spawning. Cold Spring Harb. Protoc. 2008:db.rot5091. doi: 10.1101/pdb.prot5091
Bradic, M., Beerli, P., García-De Leán, F. J., Esquivel-Bobadilla, S., and Borowsky, R. L. (2012). Gene flow and population structure in the Mexican blind cavefish complex (Astyanax mexicanus). BMC Evol. Biol. 12:9. doi: 10.1186/1471-2148-12-9
Bradic, M., Teotónio, H., and Borowsky, R. L. (2013). The population genomics of repeated evolution in the blind cavefish Astyanax mexicanus. Mol. Biol. Evol. 30, 2383–2400. doi: 10.1093/molbev/mst136
Chauveau, F., Piérard, C., Corio, M., Célérier, A., Christophe, T., Vouimba, R. M., et al. (2009). Mediodorsal thalamic lesions block the stress-induced inversion of serial memory retrieval pattern in mice. Behav. Brain Res. 203, 270–278. doi: 10.1016/j.bbr.2009.05.014
Chin, J. S., Gassant, C. E., Amaral, P. M., Lloyd, E., Stahl, B. A., Jaggard, J. B., et al. (2018). Convergence on reduced stress behavior in the Mexican blind cavefish. Dev. Biol. 441, 319–327. doi: 10.1016/j.ydbio.2018.05.009
Chou, M.-Y., Amo, R., Kinoshita, M., Cherng, B.-W., Shimazaki, H., Agetsuma, M., et al. (2016). Social conflict resolution regulated by two dorsal habenular subregions in Zebrafish. Science 352, 87–90. doi: 10.1126/science.aac9508
deCarvalho, T. N., Akitake, C. M., Thisse, C., Thisse, B., and Halpern, M. E. (2013). Aversive cues fail to activate fos expression in the asymmetric olfactory-habenula pathway of Zebrafish. Front. Neural Circuits 7:98. doi: 10.3389/fncir.2013.00098
deCarvalho, T. N., Subedi, A., Rock, J., Harfe, B. D., Thisse, C., Thisse, B., et al. (2014). Neurtransmitter map of the asymmetric dorsal habenular nuclei of Zebrafish. Genesis 52, 636–655. doi: 10.1002/dvg.22785
Duboué, E. R., and Halpern, M. E. (2017). Genetic, and transgenic approaches to study Zebrafish brain asymmetry, and lateralized behavior. Neuromethods 122, 553–589. doi: 10.1007/978-1-4939-6725-4_17
Duboué, E. R., Hong, E., Eldred, K. C., and Halpern, M. E. (2017). Left habenular activity attenuates fear responses in larval Zebrafish. Curr. Biol. 27, 2154–2162.e3. doi: 10.1016/j.cub.2017.06.017
Duboué, E. R., Keene, A. C., and Borowsky, R. L. (2011). Evolutionary convergence on sleep loss in cavefish populations. Curr. Biol. 21, 671–676. doi: 10.1016/j.cub.2011.03.020
Dunn, T. W., Mu, Y., Narayan, S., Randlett, O., Naumann, E. A., Yang, C. T., et al. (2016). Brain-wide mapping of neural activity controlling Zebrafish exploratory locomotion. eLife 5:e12741. doi: 10.7554/eLife.12741
Elipot, Y., Hinaux, H., Callebert, J., and Rétaux, S. (2013). Evolutionary shift from fighting to foraging in blind cavefish through changes in the serotonin network. Curr. Biol. 23, 1–10. doi: 10.1016/j.cub.2012.10.044
Elipot, Y., Legendre, L., Père, S., Sohm, F., and Rétaux, S. (2014). Astyanax transgenesis and husbandry: how cavefish enters the laboratory. Zebrafish 11, 291–299. doi: 10.1089/zeb.2014.1005
Fernandez, L. M., Vantomme, G., Osorio-Forero, A., Cardis, R., Béard, E., and Lüthi, A. (2018). Thalamic reticular control of local sleep in mouse sensory cortex. eLife 7:e39111. doi: 10.7554/elife.39111
Gallo, N. D., and Jeffery, W. R. (2012). Evolution of space dependent growth in the teleost Astyanax mexicanus. PLoS One 7:e41443. doi: 10.1371/journal.pone.0041443
Haun, F., Eckenrode, T., and Murray, M. (2018). Habenula and thalamus cell transplants restore normal sleep behaviors disrupted by denervation of the interpeduncular nucleus. J. Neurosci. 2, 3282–3290. doi: 10.1523/jneurosci.12-08-03282.1992
Hawrylycz, M., Baldock, R. A., Burger, A., Hashikawa, T., Johnson, G. A., Martone, M., et al. (2011). Digital atlasing and standardization in the mouse brain. PLoS Comput. Biol. 7:e1001065. doi: 10.1371/journal.pcbi.1001065
Herman, A., Brandvain, Y., Weagley, J., Jeffery, W. R., Keene, A. C., Kono, T. J. Y., et al. (2018). The role of gene flow in rapid and repeated evolution of cave-related traits in Mexican tetra, Astyanax mexicanus. Mol. Ecol. 27, 4397–4416. doi: 10.1111/mec.14877
Hinaux, H., Alié, A., Devos, L., Elipot, Y., Bibliowicz, J., Blin, M., et al. (2016). Sensory evolution in blind cavefish is driven by early embryonic events during gastrulation and neurulation. Development 143, 4521–4532. doi: 10.1242/dev.141291
Jaggard, J. B., Stahl, B. A., Lloyd, E., Prober, D. A., Duboue, E. R., and Keene, A. C. (2018). Hypocretin underlies the evolution of sleep loss in the Mexican cavefish. eLife 7:e32637. doi: 10.7554/eLife.32637
Jarvis, E. D. (2004). Learned birdsong and the neurobiology of human language. Ann. N. Y. Acad. Sci. 1016, 749–777. doi: 10.1196/annals.1298.038
Jeffery, W. R. (2009). Chapter 8 evolution and development in the Cavefish astyanax. Curr. Top. Dev. Biol. 86, 191–221. doi: 10.1016/S0070-2153(09)01008-4
Jeong, I., Kim, E., Kim, S., Kim, H.-K., Lee, D.-W., Jae Young, S., et al. (2018). mRNA expression and metabolic regulation of npy and agrp1/2 in the Zebrafish brain. Neurosci. Lett. 668, 73–79. doi: 10.1016/j.neulet.2018.01.017
Kaslin, J., Nystedt, J. M., Stergård, M. Ö., Peitsaro, N., and Panula, P. (2004). The orexin/hypocretin system in Zebrafish is connected to the aminergic and cholinergic systems. J. Neurosci. 24, 2678–2689. doi: 10.1523/jneurosci.4908-03.2004
Kawakami, K., Shima, A., and Kawakami, N. (2000). Identification of a functional transposase of the Tol2 element, an Ac-like element from the Japanese medaka fish, and its transposition in the Zebrafish germ lineage. Proc. Natl. Acad. Sci. U.S.A. 97, 11403–11408. doi: 10.1073/pnas.97.21.11403
Kim, A., Latchoumane, C., Lee, S., Kim, G. B., Cheong, E., Augustine, G. J., et al. (2012). Optogenetically induced sleep spindle rhythms alter sleep architectures in mice. Proc. Natl. Acad. Sci. U.S.A. 109, 20673–20678. doi: 10.1073/pnas.1217897109
Kowalko, J. E., Rohner, N., Linden, T., Rompani, S., Warren, W., Borowsky, R., et al. (2013a). Convergence in feeding posture occurs through different genetic loci in independently evolved cave populations of Astyanax mexicanus. Proc. Natl. Acad. Sci. U.S.A. 110, 16933–16938. doi: 10.1073/pnas.1317192110
Kowalko, J. E., Rohner, N., Rompani, S. B., Peterson, B. K., Linden, T. A., Yoshizawa, M., et al. (2013b). Loss of schooling behavior in cavefish through sight-dependent and sight-independent mechanisms. Curr. Biol. 23, 1874–1883. doi: 10.1016/j.cub.2013.07.056
Lal, P., Tanabe, H., Suster, M. L., Ailani, D., Kotani, Y., Muto, A., et al. (2018). Identification of a neuronal population in the telencephalon essential for fear conditioning in Zebrafish. BMC Biol. 16:45. doi: 10.1186/s12915-018-0502-y
Latchoumane, C. F. V., Ngo, H. V. V., Born, J., and Shin, H. S. (2017). Thalamic spindles promote memory formation during sleep through triple phase-locking of cortical, thalamic, and hippocampal rhythms. Neuron 95, 424–435.e6. doi: 10.1016/j.neuron.2017.06.025
Li, Y., Dong, X., Li, S., and Kirouac, G. J. (2014). Lesions of the posterior paraventricular nucleus of the thalamus attenuate fear expression. Front. Behav. Neurosci. 8:94. doi: 10.3389/fnbeh.2014.00094
Lloyd, E., Olive, C., Stahl, B. A., Jaggard, J. B., Amaral, P., Duboué, E. R., et al. (2018). Evolutionary shift towards lateral line dependent prey capture behavior in the blind Mexican cavefish. Dev. Biol. 441, 328–337. doi: 10.1016/j.ydbio.2018.04.027
Marquart, G. D., Tabor, K. M., Brown, M., Strykowski, J. L., Varshney, G. K., LaFave, M. C., et al. (2015). A 3D searchable database of transgenic Zebrafish gal4 and cre lines for functional neuroanatomy studies. Front. Neural Circuits 9:78. doi: 10.3389/fncir.2015.00078
McCormick, C. A., and Braford, M. R. (1994). Organization of inner ear endorgan projections in the goldfish, Carassius auratus. Brain Behav. Evol. 43, 189–205. doi: 10.1159/000113634
Menuet, A., Alunni, A., Joly, J.-S. J.-S., Jeffery, W. R., Retaux, S., and Rétaux, S. (2007). Expanded expression of Sonic Hedgehog in Astyanax cavefish: multiple consequences on forebrain development and evolution. Development 134, 845–855. doi: 10.1242/dev.02780
Milyaev, N., Osumi-sutherland, D., Reeve, S., Burton, N., Baldock, R. A., and Armstrong, J. D. (2012). The virtual fly brain browser and query interface. Bioinformatics 28, 411–415. doi: 10.1093/bioinformatics/btr677
Mitchell, R. W., Russell, W. H., and Elliot, W. R. (1977). Mexican Eyeless Characin Fishes, Genus Astyanax: Environment, Distribution, and Evolution. Lubbock, TX: Tech University Press.
Miyasaka, N., Arganda-Carreras, I., Wakisaka, N., Masuda, M., Sümbül, U., Seung, H. S., et al. (2014). Olfactory projectome in the Zebrafish forebrain revealed by genetic single-neuron labelling. Nat. Commun. 5:3639. doi: 10.1038/ncomms4639
Moore, H. A., and Whitmore, D. (2014). Circadian rhythmicity and light sensitivity of the Zebrafish brain. PLoS One 9:e86176. doi: 10.1371/journal.pone.0086176
Moore, R. (1982). The suprachiasmatic nucleus and the organization of a circadian system. Trends Neurosci. 5, 404–407. doi: 10.1016/0166-2236(82)90224-7
Moran, D., Softley, R., and Warrant, E. J. (2015). The energetic cost of vision and the evolution of eyeless Mexican cavefish. Sci. Adv. 1:e1500363. doi: 10.1126/sciadv.1500363
Mueller, T. (2012). What is the thalamus in Zebrafish? Front. Neurosci. 6:64. doi: 10.3389/fnins.2012.00064
Mueller, T., and Wullimann, M. (2015). Atlas of Early Zebrafish Brain Development: A Tool for Molecular Neurogenetics. Cambridge, MA: Academic Press.
Mueller, T., and Wullimann, M. F. (2009). An evolutionary interpretation of teleostean forebrain anatomy. in Brain. Behav. Evol. 74, 30–42. doi: 10.1159/000229011
Murphy, C. A., DiCamillo, A. M., Haun, F., and Murray, M. (1996). Lesion of the habenular efferent pathway produces anxiety and locomotor hyperactivity in rats: a comparison of the effects of neonatal and adult lesions. Behav. Brain Res. 81, 43–52. doi: 10.1016/S0166-4328(96)00041-1
Murray, M., Murphy, C. A., Ross, L. L., and Haun, F. (1994). The role of the habenula-interpeduncular pathway in modulating levels of circulating adrenal hormones. Restor. Neurol. Neurosci. 6, 301–307. doi: 10.3233/RNN-1994-6406
Muto, A., Ohkura, M., Abe, G., Nakai, J., and Kawakami, K. (2013). Real-time visualization of neuronal activity during perception. Curr. Biol. 23, 307–311. doi: 10.1016/j.cub.2012.12.040
Nakatani, M., Miya, M., Mabuchi, K., Saitoh, K., and Nishida, M. (2011). Evolutionary history of Otophysi (Teleostei), a major clade of the modern freshwater fishes: pangaean origin and Mesozoic radiation. BMC Evol. Biol. 11:177. doi: 10.1186/1471-2148-11-177
Natke, C. (1999). Vergleichende Untersuchungen am optischen System von Fluss- und Hohlenform des Silbersalmlers Astyanax mexicanus (Characidae, Teleostei): Faserdarstellung mit Hilfe fluoreszierender Carbocyanine. Available at: http://d-nb.info/957125798
Ornelas-García, C. P., Domínguez-Domínguez, O., and Doadrio, I. (2008). Evolutionary history of the fish genus Astyanax baird & Girard (1854) (Actinopterygii, Characidae) in mesoamerica reveals multiple morphological homoplasies. BMC Evol. Biol. 8:340. doi: 10.1186/1471-2148-8-340
Peichel, C. L., Nereng, K. S., Ohgi, K. A., Cole, B. L. E., Colosimo, P. F., Buerklet, C. A., et al. (2001). The genetic architecture of divergence between threespine stickleback species. Nature 414, 901–905. doi: 10.1038/414901a
Peng, H., Chung, P., Long, F., Qu, L., Jenett, A., Seeds, A. M., et al. (2011). BrainAligner: 3D registration atlases of Drosophila brains. Nat. Methods 8, 493–500. doi: 10.1038/nmeth.1602
Peng, Z., He, S., Wang, J., Wang, W., and Diogo, R. (2006). Mitochondrial molecular clocks and the origin of the major Otocephalan clades (Pisces: Teleostei): a new insight. Gene 370, 113–124. doi: 10.1016/j.gene.2005.11.024
Portavella, M., Torres, B., and Salas, C. (2004a). Avoidance response in goldfish: emotional and temporal involvement of medial and lateral telencephalic pallium. J. Neurosci. 24, 2335–2342. doi: 10.1523/JNEUROSCI.4930-03.2004
Portavella, M., Torres, B., Salas, C., and Papini, M. R. (2004b). Lesions of the medial pallium, but not of the lateral pallium, disrupt spaced-trial avoidance learning in goldfish (Carassius auratus). Neurosci. Lett. 362, 75–78. doi: 10.1016/j.neulet.2004.01.083
Puzdrowski, R. (1989). Peripheral distribution and central projections of the lateral-line nerves in goldfish, Carasius auratus. Brain Behav. Evol. 34, 110–131.
Randlett, O., Wee, C. L., Naumann, E. A., Nnaemeka, O., Schoppik, D., Fitzgerald, J. E., et al. (2015). Whole-brain activity mapping onto a Zebrafish brain atlas. Nat. Methods 12, 1039–1046. doi: 10.1038/nmeth.3581
Riedel, G. (1997). The forebrain of the blind cave fish Astyanax hubbsi (Characidae): I. general anatomy of the telencephalon. Brain Behav. Evol. 49, 20–38. doi: 10.1159/000112979
Riedel, G., and Krug, L. (1997). The forebrain of the blind cave fish Astyanax hubbsi (Characidae): II. Projections of the olfactory bulb. Brain Behav. Evol. 49, 39–52. doi: 10.1159/000112980
Ronneberger, O., Liu, K., Rath, M., Rue, D., Mueller, T., Skibbe, H., et al. (2012). ViBE-Z: a framework for 3D virtual colocalization analysis in Zebrafish larval brains. Nat. Methods 9, 735–742. doi: 10.1038/nmeth.2076
Şadoğlu, P. (1957). A mendelian gene for albinism in natural cave fish. Experientia 13, 394–394. doi: 10.1534/g3.114.015438
Schenker, N. M., Buxhoeveden, D. P., Blackmon, W. L., Amunts, K., Zilles, K., and Semendeferi, K. (2008). A comparative quantitative analysis of cytoarchitecture and minicolumnar organization in Broca’s area in humans and great apes. J. Comp. Neurol. 510, 117–128. doi: 10.1002/cne.21792
Schindelin, J., Arganda-Carreras, I., Frise, E., Kaynig, V., Longair, M., Pietzsch, T., et al. (2012). Fiji: an open-source platform for biological-image analysis. Nat. Methods 9, 676–682. doi: 10.1038/nmeth.2019
Scott, E. K., Mason, L., Arrenberg, A. B., Ziv, L., Gosse, N. J., Xiao, T., et al. (2007). Targeting neural circuitry in Zebrafish using GAL4 enhancer trapping. Nat. Methods 4, 323–326. doi: 10.1038/nmeth1033
Shapiro, L. E., Leonard, C. M., Sessions, C. E., Dewsbury, D. A., and Insel, T. R. (1991). Comparative neuroanatomy of the sexually dimorphic hypothalamus in monogamous and polygamous voles. Brain Res. 541, 232–240. doi: 10.1016/0006-8993(91)91023-T
Shapiro, M. D., Marks, M. E., Peichel, C. L., Blackman, B. K., Nereng, K. S., Jónsson, B., et al. (2004). Genetic and developmental basis of evolutionary pelvic reduction in threespine sticklebacks. Nature 428, 717–723. doi: 10.1038/nature02415
Shin, L. M., and Liberzon, I. (2010). The neurocircuitry of fear, stress, and anxiety disorders. Neuropsychopharmacology 35, 169–191. doi: 10.1038/npp.2009.8
Sligar, C. M., and Voneida, T. J. (1976). Tectal efferents in the blind cave fish Astyanax Hubbsi. J. Comp. Neurol. 165, 107–124. doi: 10.1002/cne.901650109
Soares, D., Yamamoto, Y., Strickler, A. G., and Jeffery, W. R. (2004). The lens has a specific influence on optic nerve and tectum development in the blind cavefish Astyanax. Dev. Neurosci. 26, 308–317. doi: 10.1159/000082272
Stahl, B. A., Jaggard, J. B., Chin, J. S. R., Kowalko, J. E., Keene, A. C., and Duboué, E. R. (2019a). Manipulation of gene function in Mexican cavefish. J. Vis. Exp. 93:e59093. doi: 10.3791/59093
Stahl, B. A., Peuß, R., McDole, B., Kenzior, A., Jaggard, J. B., Gaudenz, K., et al. (2019b). Stable transgenesis in Astyanax mexicanus using the Tol2 transposase system. Dev. Dyn. 248, 679–687. doi: 10.1002/dvdy.32
Stamatakis, A. M., Van Swieten, M., Basiri, M. L., Blair, G. A., Kantak, P., and Stuber, G. D. (2016). Lateral hypothalamic area glutamatergic neurons and their projections to the lateral habenula regulate feeding and reward. J. Neurosci. 36, 302–311. doi: 10.1523/jneurosci.1202-15.2016
Sutherland, R. J. (1982). The dorsal diencephalic conduction system: a review of the anatomy and functions of the habenular complex. Neurosci. Biobehav. Rev. 6, 1–13. doi: 10.1016/0149-7634(82)90003-3
Teyke, T. (1990). Morphological differences in neuromasts of the blind cave fish Astyanax hubbsi and the sighted river fish Astyanax mexicanus. Brain Behav. Evol. 35, 23–30. doi: 10.1159/000115853
Thévenaz, P., Ruttimann, U. E., and Unser, M. (1998). A pyramid approach to sub-pixel registration based on intensity mailing address. IEEE Trans. Image Process 7, 27–41. doi: 10.1109/83.650848
van Kerkhof, L. W. M., Damsteegt, R., Trezza, V., Voorn, P., and Vanderschuren, L. J. M. J. (2013). Functional integrity of the habenula is necessary for social play behaviour in rats. Eur. J. Neurosci. 38, 3465–3475. doi: 10.1111/ejn.12353
Vendrell-Llopis, N., and Yaksi, E. (2015). Evolutionary conserved brainstem circuits encode category, concentration and mixtures of taste. Sci. Rep. 5:17825. doi: 10.1038/srep17825
Viswanath, H., Carter, A. Q., Baldwin, P. R., Molfese, D. L., and Salas, R. (2014). The medial habenula: still neglected. Front. Hum. Neurosci. 7:931. doi: 10.3389/fnhum.2013.00931
Voneida, T. J., and Sligar, C. M. (1976). A comparative neuroanatomic study of retinal projections in two fishes: Astyanax hubbsi (the blind cave fish), and Astyanax mexicanus. J. Comp. Neurol. 165, 89–105. doi: 10.1002/cne.901650108
Wilkens, H. (1971). Genetic interpretation of regressive evolutionary processes: studies on hybrid eyes of two Astyanax cave populations (Characidae, Pisces). Evolution 25, 530–544. doi: 10.2307/2407352
Wulliman, M. F., Rupp, B., and Reichert, H. (1996). Neuroanatomy of the Zebrafish Brain. Basel: Birkhäuser Verlag.
Yoshizawa, M., Gorički, Š., Soares, D., and Jeffery, W. R. (2010). Evolution of a behavioral shift mediated by superficial neuromasts helps cavefish find food in darkness. Curr. Biol. 20, 1631–1636. doi: 10.1016/j.cub.2010.07.017
Yoshizawa, M., Jeffery, W. R., van Netten, S. M., and McHenry, M. J. (2013). The sensitivity of lateral line receptors and their role in the behavior of Mexican blind cavefish (Astyanax mexicanus). J. Exp. Biol. 217, 886–895. doi: 10.1242/jeb.094599
Yoshizawa, M., Jeffery, W. R., van Netten, S. M., and McHenry, M. J. (2014). The sensitivity of lateral line receptors and their role in the behavior of Mexican blind cavefish (Astyanax mexicanus). J. Exp. Biol. 217, 886–895. doi: 10.1242/jeb.094599
Zha, X., and Xu, X. (2015). Dissecting the hypothalamic pathways that underlie innate behaviors. Neurosci. Bull. 31, 629–648. doi: 10.1007/s12264-015-1564-2
Keywords: A. mexicanus, hypothalamus, brain evolution, brain atlas, sleep, stress, feeding
Citation: Loomis C, Peuß R, Jaggard JB, Wang Y, McKinney SA, Raftopoulos SC, Raftopoulos A, Whu D, Green M, McGaugh SE, Rohner N, Keene AC and Duboue ER (2019) An Adult Brain Atlas Reveals Broad Neuroanatomical Changes in Independently Evolved Populations of Mexican Cavefish. Front. Neuroanat. 13:88. doi: 10.3389/fnana.2019.00088
Received: 29 May 2019; Accepted: 11 September 2019;
Published: 04 October 2019.
Edited by:
Richard S. Nowakowski, Florida State University, United StatesReviewed by:
Masato Yoshizawa, University of Hawai‘i at Mānoa, United StatesRamon Anadon, University of Santiago de Compostela, Spain
Copyright © 2019 Loomis, Peuß, Jaggard, Wang, McKinney, Raftopoulos, Raftopoulos, Whu, Green, McGaugh, Rohner, Keene and Duboue. This is an open-access article distributed under the terms of the Creative Commons Attribution License (CC BY). The use, distribution or reproduction in other forums is permitted, provided the original author(s) and the copyright owner(s) are credited and that the original publication in this journal is cited, in accordance with accepted academic practice. No use, distribution or reproduction is permitted which does not comply with these terms.
*Correspondence: Erik R. Duboue, ZWR1Ym91ZUBmYXUuZWR1