 Jea Hwa Jang1,2†
 Ha Kyeong Kim1,2†Dong Woo Seo1,2Su Young Ki2Soonhong Park3Sang-Hyun Choi2
 Dong-Hoon Kim1,2Seok Jun Moon3*
 Yong Taek Jeong1,2*
- 1BK21 Graduate Program, Department of Biomedical Sciences, Korea University College of Medicine, Seoul, South Korea
- 2Department of Pharmacology, Korea University College of Medicine, Seoul, South Korea
- 3Department of Oral Biology, BK21 PLUS Project, Yonsei University College of Dentistry, Seoul, South Korea
Chemosensory receptors are expressed primarily in sensory organs, but their expression elsewhere can permit ligand detection in other contexts that contribute to survival. The ability of sweet taste receptors to detect natural sugars, sugar alcohols, and artificial sweeteners suggests sweet taste receptors are involved in metabolic regulation in both peripheral organs and in the central nervous system. Our limited knowledge of sweet taste receptor expression in the brain, however, has made it difficult to assess their contribution to metabolic regulation. We, therefore, decided to profile the expression pattern of T1R2, a subunit specific to the sweet taste receptor complex, at the whole-brain level. Using T1r2-Cre knock-in mice, we visualized the overall distribution of Cre-labeled cells in the brain. T1r2-Cre is expressed not only in various populations of neurons, but also in glial populations in the circumventricular organs and in vascular structures in the cortex, thalamus, and striatum. Using immunohistochemistry, we found that T1r2 is expressed in hypothalamic neurons expressing neuropeptide Y and proopiomelanocortin in arcuate nucleus. It is also co-expressed with a canonical taste signaling molecule in perivascular cells of the median eminence. Our findings indicate that sweet taste receptors have unidentified functions in the brain and suggest that they may be a novel therapeutic target in the central nervous system.
Introduction
The principal function of chemosensory receptors in the sensory organs is the detection of exogenous chemicals (Yarmolinsky et al., 2009; Chaudhari and Roper, 2010; Liman et al., 2014). In the oral cavity, taste receptors sensitive to sweet, umami, and bitter tasting compounds convert chemical information into biological signaling (Zhao et al., 2003; Mueller et al., 2005). Umami and sweet are detected by T1R1 and T1R2, respectively, along with T1R3, which acts with T1R1 and T1R2 as a co-receptor (Zhao et al., 2003). Bitter tastes, in contrast, are detected by bitter taste receptors, a family of proteins comprising 25 members in humans and 35 members in mice (Mueller et al., 2005).
Chemosensory receptors are also expressed in other organs and tissues where they play unexpected physiological roles responding to their cognate ligands (Calvo and Egan, 2015). For example, bitter taste receptors expressed in human airway smooth muscle respond to their ligands and induce bronchodilation to remove harmful substances from the airways (Deshpande et al., 2010). In addition to defensive roles like this, the extraoral expression patterns of taste receptors often hint at the roles they play in the regulation of metabolism and physiology. For example, in addition to their expression in taste buds, the subunits of the sweet taste receptor complex—T1R2 and T1R3—are expressed in the intestine (Howitt et al., 2020), pancreas (Nakagawa et al., 2009; Kyriazis et al., 2012), brain (Ren et al., 2009; Kohno et al., 2016), and testes (Mosinger et al., 2013). In pancreatic beta cells, sweet taste receptors detect blood fructose, which potentiates the effect of blood glucose in the release of insulin (Kyriazis et al., 2012). Sweet taste receptors are also expressed in the hypothalamus where they mediate the cellular responses to artificial sweeteners (Ren et al., 2009; Kohno et al., 2016; Benford et al., 2017), implying a role for T1R2 and T1R3 in the central regulation of metabolism. Therefore, sweet taste receptors can function as detectors of internal body state.
Several brain areas maintain metabolic homeostasis by responding, not only to circulating hormones such as insulin, leptin, ghrelin, and angiotensin II (Spanswick et al., 1997, 2000; Cowley et al., 2003; Paes-Leme et al., 2018), but also to nutrients (Sohn and Ho, 2020). According to their responses to glucose, glucose-sensing neurons can largely be divided into two groups, glucose-excited (GE) neurons and glucose-inhibited (GI) neurons (Sohn and Ho, 2020). Like pancreatic beta cells, GE neurons detect glucose primarily via glucose transporter 2 (GLUT2), glucokinase, and ATP-sensitive potassium channel (KATP) (Ashford et al., 1990; Miki et al., 2001; Jordan et al., 2010), but its incompleteness has raised other glucosensing mechanisms. Recently, sweet taste receptor has been proposed to be an alternative low affinity glucose sensor in the brain (Ren et al., 2009; Kohno et al., 2016; Benford et al., 2017). However, the lack of the whole brain expression pattern of sweet taste receptor underestimates the importance of its contribution. Therefore, it is crucial to clarify tissue distribution and neurochemical properties of T1R2 to understand the diverse nutrient sensing mechanisms in the brain.
Here, we investigated the expression of T1R2 across the whole brain. We generated knock-in mice expressing Cre recombinase under the control of the T1r2 promoter to make it easier to characterize the neurochemical properties of T1r2-expressing cells. By combining this line with the ROSA26-LSL-tdTomato fluorescent marker, we found broad but specialized expression of T1R2 across the brain. In particular, we observed intense fluorescence in hypothalamic nuclei near the ventricles. Using IHC, we found various cell types—including neurons, astrocytes, tanycytes, and perivascular cells—both labeled by T1r2-Cre and expressing canonical taste signaling molecules. In the arcuate nucleus (ARC), we observed both T1R2-expressing neuropeptide Y (NPY) and proopiomelanocortin (POMC)-expressing neurons. Moreover, in addition to the expected neuronal expression of T1r2-Cre, we unexpectedly observed T1r2-Cre labeling of cerebrovascular structures of the forebrain. According to our results, T1R2 is expressed in locations expected to be advantageous in the detection of circulating metabolites and exogenous sweeteners in the brain. Thus, our study not only broadens our understanding of the expression pattern of a single chemosensory receptor in the central nervous system, but we expect it will also contribute a novel target for the development of therapeutic approaches to metabolic regulation.
Materials and Methods
Mice
All animal experiments were approved by the Animal Care Committee of Korea University College of Medicine (KOREA-2019-0132). All mice were maintained under standard animal housing conditions [12 h light-dark cycles with ad libitum access to normal chow diet (SAFE® A03, France) and water]. The T1r2 knock-in allele was generated by Macrogen (Korea). The original founder was generated under C57BL6/N background. The donor construct sequences, including the homology arms and the Cre sequence used to achieve homology-mediated direct repair, are indicated in Supplementary Figure 1.
To generate T1r2-tdTomato mice, T1r2-Cre mice were bred to ROSA26-LSL-tdTomato mice (JAX007908). To obtain T1r2-tdTomato:Npy-hrGFP or T1r2-tdTomato:POMC-hrGFP mice, T1r2-tdTomato mice were bred to either of Npy-hrGFP (JAX006417) or POMC-hrGFP (JAX006421) mice, respectively. We confirmed the genotype of every mouse by PCR amplification of genomic DNA extracted from their tails (MyTaq Extract-PCR kit, BIO-21127, Bioline, United Kingdom). The primer sequences used for genotyping are indicated in Table 1.
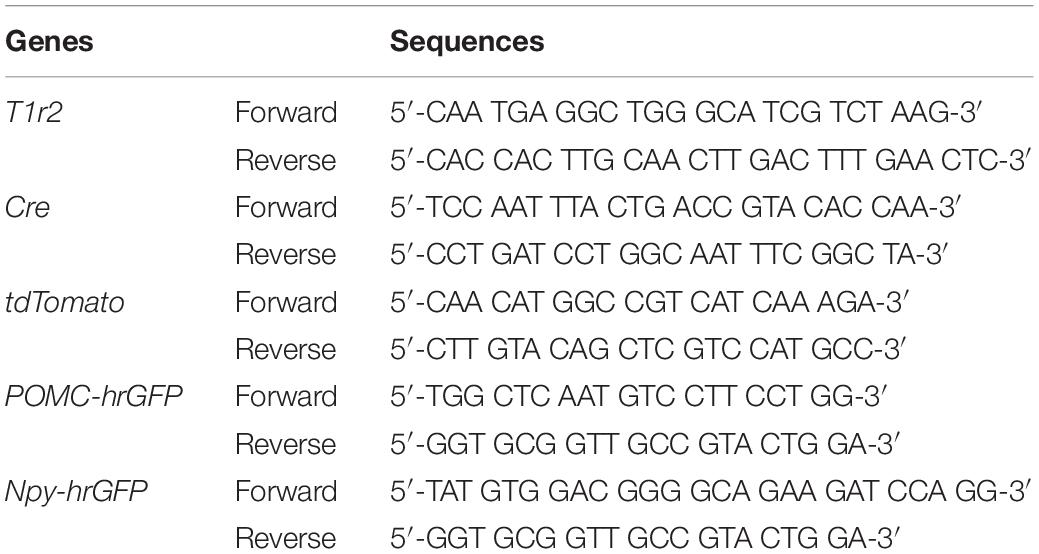
Table 1. Primer sequences used for genotyping.
Two Bottle Tests
Adult mice were acclimated individually in plastic cages with ad libitum access to food. Drinking water was supplied via two custom sipper tubes for at least 1 week. After acclimation, most of the mice did not show any position bias. A session was composed of two test days. Mice were allowed to choose between sipper tubes containing water and tastants for 2 days, and the tube positions were switched daily. Each session was separated from the next by a 5-day interval to prevent the results of later sessions from being affected by previous sessions. When identical tastants were being tested, they were presented in increasing concentrations. The volume of ingested liquid was measured and a preference index (P.I.) was calculated according to the following equation: P.I. = volume of ingested tastant solution/(volume of ingested pure water + volume of ingested tastant solution). The numbers of animals subjected to two bottle test are four and three for wild-type and T1r2 KO, respectively.
Immunohistochemistry
T1r2-tdTomato mice were serially perfused with 0.1 M phosphate buffered saline (PBS) and 4% paraformaldehyde (PFA) in PBS. Their brains were dissected from their skulls, post-fixed overnight, and cryoprotected in 30% sucrose in PBS at 4°C for several days until sinking. They were then embedded in Tissue-Tek OCT (Sakura, Japan). Cryoblocks were stored at −80°C until used. Brain samples were cut into coronal sections with a thickness of 30 μm. Every third free-floating section from the anterior olfactory bulb to the caudal cerebellum was collected. Tongue samples were cut into coronal sections with a thickness of 12 μm and directly attached to slide glass. The sections were then blocked in 5% goat or donkey serum in 0.2% Triton X-100 PBS (PBST) for 30 mins at room temperature. Primary antibodies were diluted in the corresponding blocking buffer and incubated overnight. After washing three times with PBST for 10 mins each, they were incubated in secondary antibodies dissolved in PBST for 2 h at room temperature. DAPI stain (1:5,000; D9542, Sigma) was added after three washes and the sections were mounted with Vectashield (Vector Laboratories, Burlingame, CA, United States) and a cover glass. All the primary and secondary antibodies used are listed in Table 2. Images were acquired with either an LSM 700 or LSM800 confocal microscope (Zeiss, Germany). Total 14 male and 2 female mice were subjected to immunostaining, and we could not find any sexual differences on expression pattern.
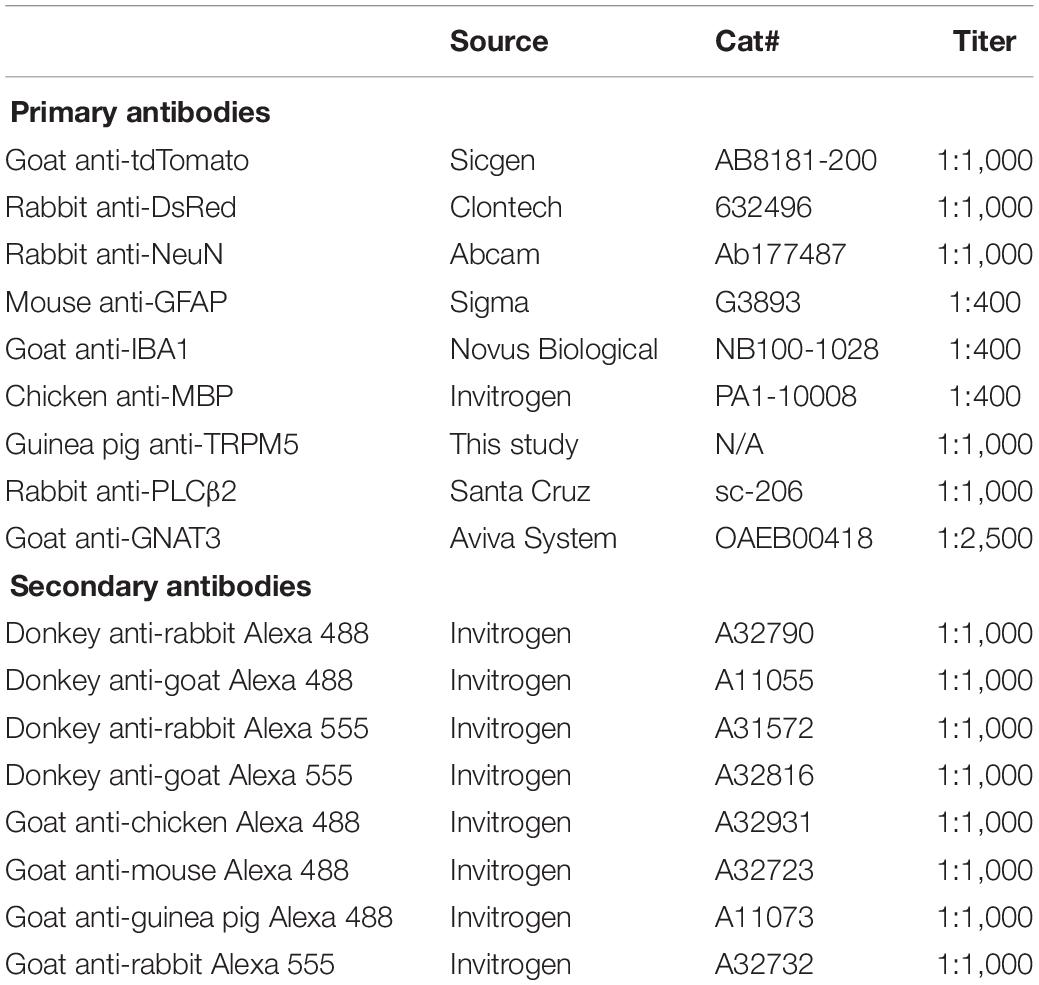
Table 2. The lists of primary and secondary antibodies used in this study.
Co-localization Analysis
Every third brain slice covering the ARC was collected and subjected to a double IHC staining protocol. Co-localization analysis was performed with Imaris (Bitplane, Zurich, Switzerland). To determine whether hrGFP fluorescent signals showed co-localization with tdTomato fluorescent signals, the merged images were analyzed with the Imaris co-localization module. Spots were assigned to specific labels based on peak mean intensities. A co-localization threshold of 0.6 μm was set as the pixel boundary occupied by a single parenchymal cell.
FITC-Dextran Perfusion
Total 2 mL of FITC-Dextran 70 kDa (5 mg/mL, Sigma, 46945) was injected into the left ventricle of deeply anesthetized T1r2-tdTomato mice at 2 mL/min. Brain was harvested immediately after perfusion, post-fixed in 4% PFA for 24 h, and immersed in 30% sucrose in PBS overnight. Following procedures were conducted similarly with conventional IHC methods.
Statistical Analyses
All data are expressed as means ± S.E.M. Statistical differences among groups were analyzed using two-sample t-tests. Asterisks indicate ∗P < 0.05, ∗∗P < 0.01, and ∗∗∗P < 0.005.
Results
Generation of a T1r2-Cre Knock-In Strain
To genetically label T1r2-expressing cells, we generated T1r2-Cre knock-in mice using the CRISPR/Cas9 system. By substituting the coding region of the first exon of T1r2 with Cre sequence using homology-directed repair, we were able to generate mice that express Cre recombinase under the control of the endogenous promoter and enhancers of the T1r2 gene (Figure 1A). We confirmed the precise genomic exchange for the target region by genomic PCR (Figure 1B). We designed this mutant allele for use, not only as a Cre driver for the T1r2 gene in the heterozygous state, but also as a T1r2 knock-out (KO) in the homozygous state.
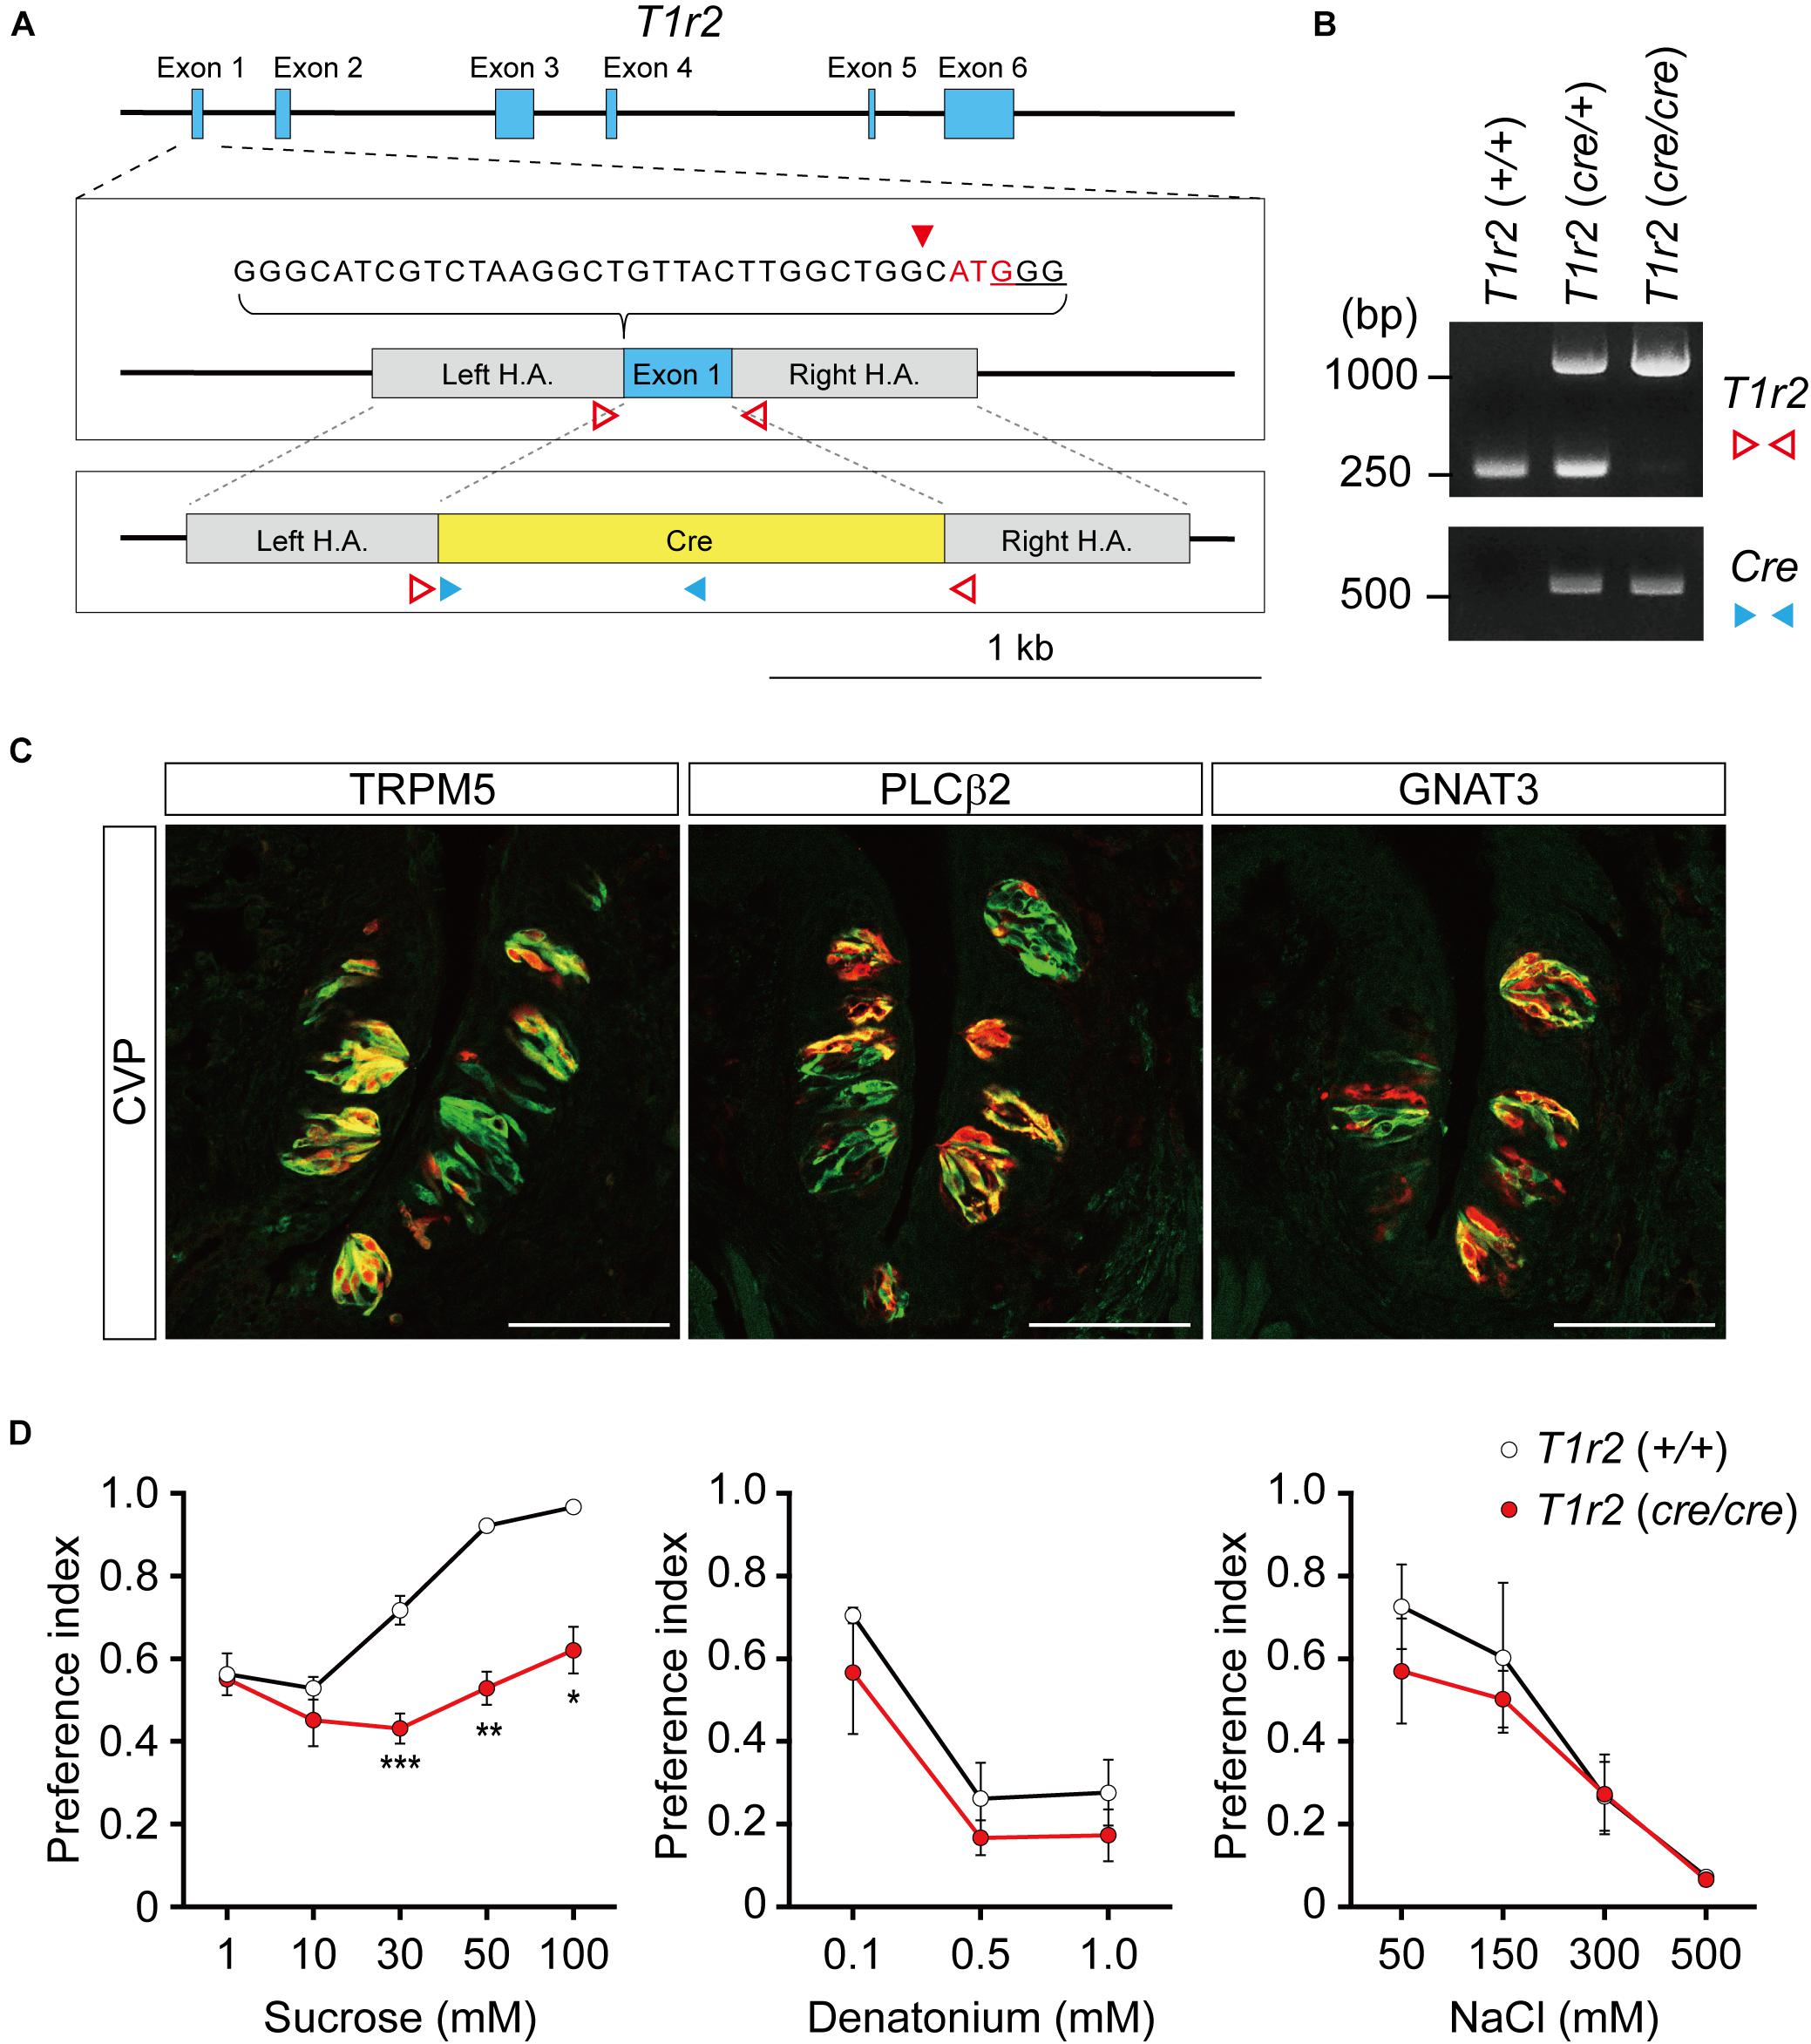
Figure 1. T1r2-Cre mouse strain generation and transgene expression analysis. (A) T1r2 locus schematic and the targeting constructs for T1R2-Cre. The genomic DNA sequences of the gRNA target are indicated. The PAM sequence used for the gRNA is underlined and the cleavage site is indicated by the red triangle. The T1r2 start codon appears in red, and the blue boxes indicate T1r2 exons. The colored triangles indicate the primers used for genomic DNA PCR: T1r2 (red blank); Cre (blue). (B) Confirmation of precise genome editing with genomic DNA PCR analysis using the primer pairs indicated in panel (A). The predicted amplicon sizes are 261 and 1,030 bp for the wild-type and mutant alleles of T1r2, respectively, and 584 bp for the Cre transgene. (C) Co-localization of tdTomato with type II taste cell markers in circumvallate papillae (CVP). (D) Confirmation of the T1r2 knock-out phenotype using two bottle tests. Data are presented as means ± S.E.M. Two-sample t-tests were performed for statistical analysis. n = 5 (wild-type) and 3 (knock-out), respectively. *P < 0.05, **P < 0.01, and ***P < 0.005.
To confirm its function, we first performed immunohistochemistry (IHC) staining of the tongue. After crossing T1r2-Cre mice to ROSA26-LSL-tdTomato mice, we visualized Cre-labeled cells in their progeny (hereafter, T1r2-tdTomato). In the tongue, we found tdTomato fluorescence restricted to taste bud-containing papillae (Figure 1C). In circumvallate papillae (CVP), T1r2-expressing cells belong to the subset of TRPM5 and PLCβ2-expressing cells. This indicates T1r2-Cre labels type II taste receptor cells (TRCs). The fluorescence we observed, however, also showed only a partial overlap with GNAT3 (Figure 1C). Given that GNAT3 is expressed preferentially in bitter TRCs in CVP (Kim et al., 2003; Kusakabe et al., 2005; Sainz et al., 2007; Shindo et al., 2008; Tizzano et al., 2008), our data suggest T1r2-Cre accurately recapitulates the expression of native T1r2 in sweet TRCs. Next, by performing two-bottle behavioral assays, we found homozygous mice showed impaired choice behaviors toward sucrose but not denatonium or NaCl (Figure 1D). This is consistent with previous studies that used other mutant T1r2 alleles (Zhao et al., 2003). Thus, our data justify the use of this novel strain in further studies.
Distribution of T1r2-Cre Expressing Cells in the Brain
We inspected the brains of T1r2-tdTomato mice from the olfactory bulb to the brain stem. The overall distribution and intensity of tdTomato fluorescence are indicated in Figure 2 and Table 3, respectively. Every brain section was subjected to double IHC against tdTomato and NeuN to recognize the overall structure. Most tdTomato-expression overlapped with anti-NeuN staining, especially in the olfactory bulb (OB), cerebral cortex, thalamus, nucleus accumbens (NAc), bed nucleus of the stria terminalis (BNST), amygdala, and septal nuclei. This overlap also included several hypothalamic nuclei, including the medial preoptic area (MPA), paraventricular nucleus (PVN), suprachiasmatic nucleus (SCN), ARC, lateral hypothalamic nucleus (LH), and dorsomedial hypothalamic nucleus (DMH) (Figures 2–7 and Table 3).
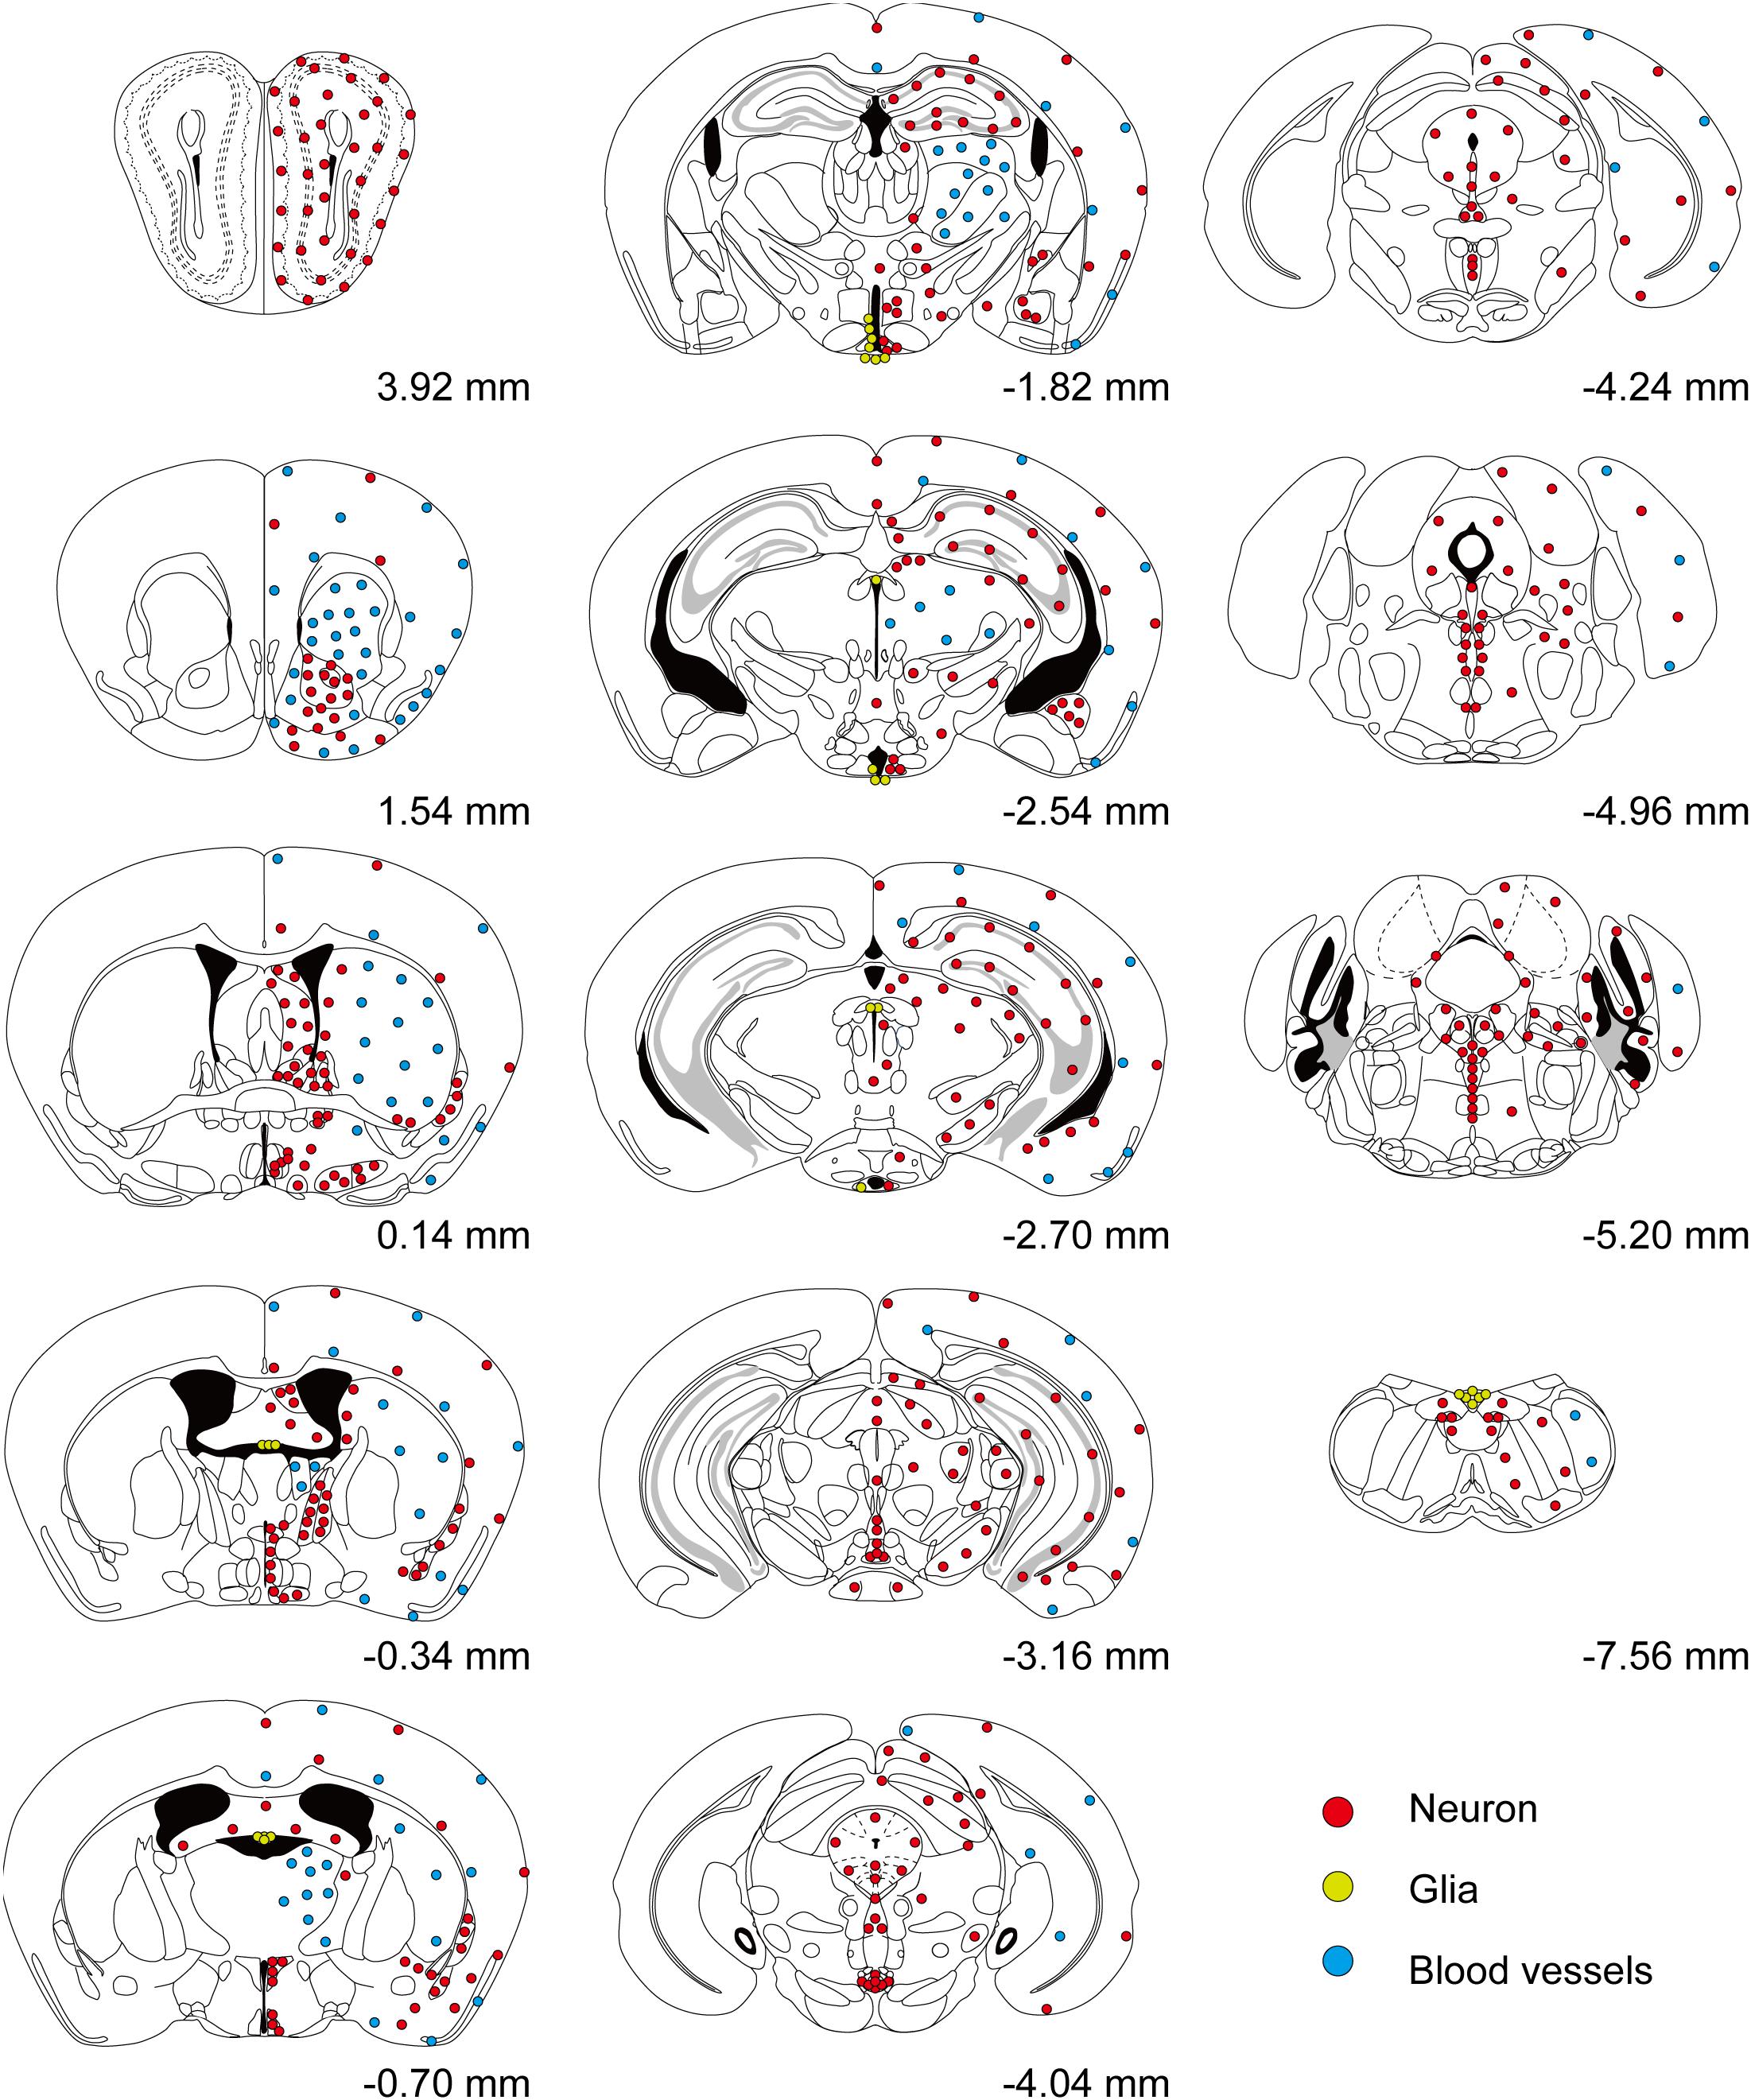
Figure 2. Overall distribution of T1r2-Cre-labeled cells in the brain. Coronal section figures were modified from the Paxinos mouse brain atlas (third edition) and re-drawn. Relative positions compared to bregma are indicated. Red circles (neurons); yellow circles (astrocytes); and blue circles (blood vessels).
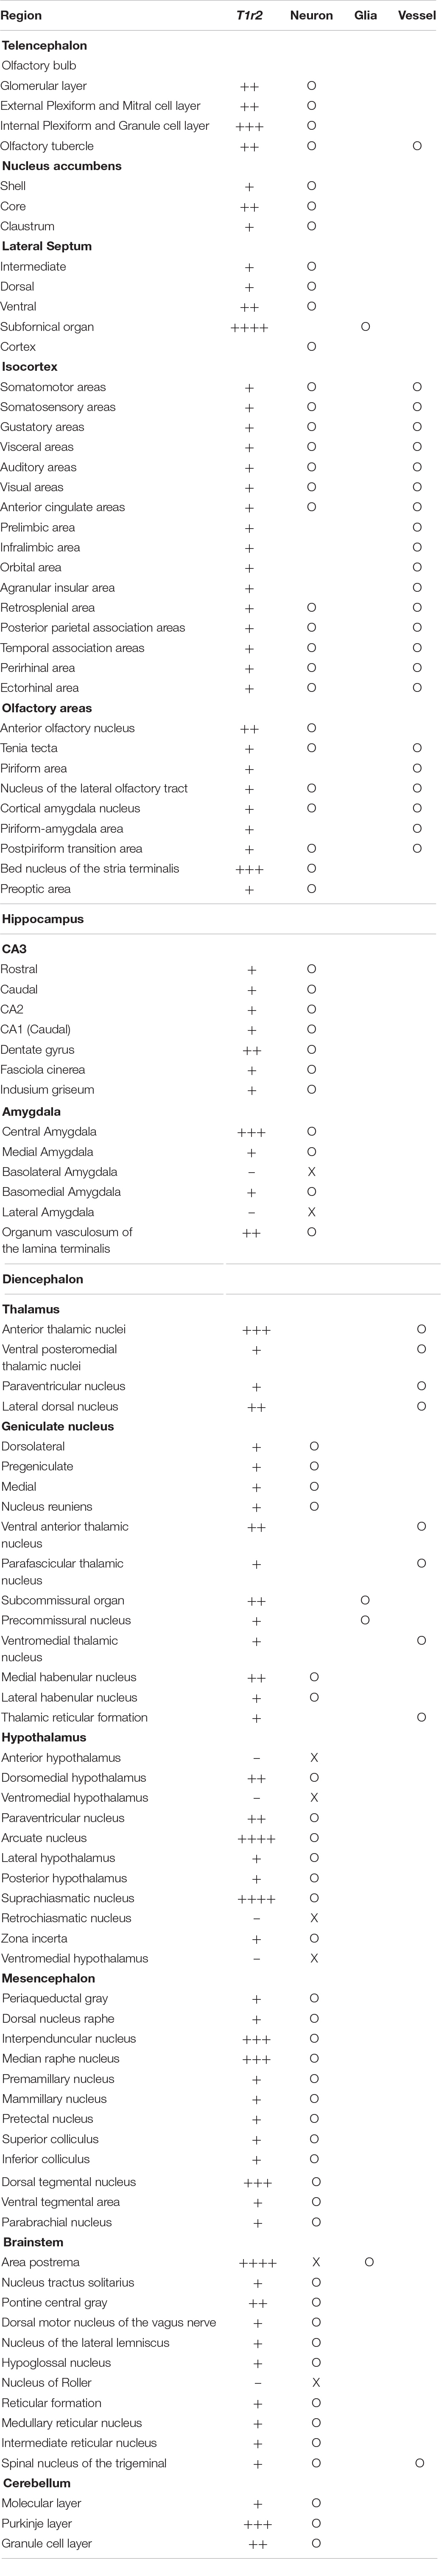
Table 3. Anatomic mapping of T1r2-expressing brain area.
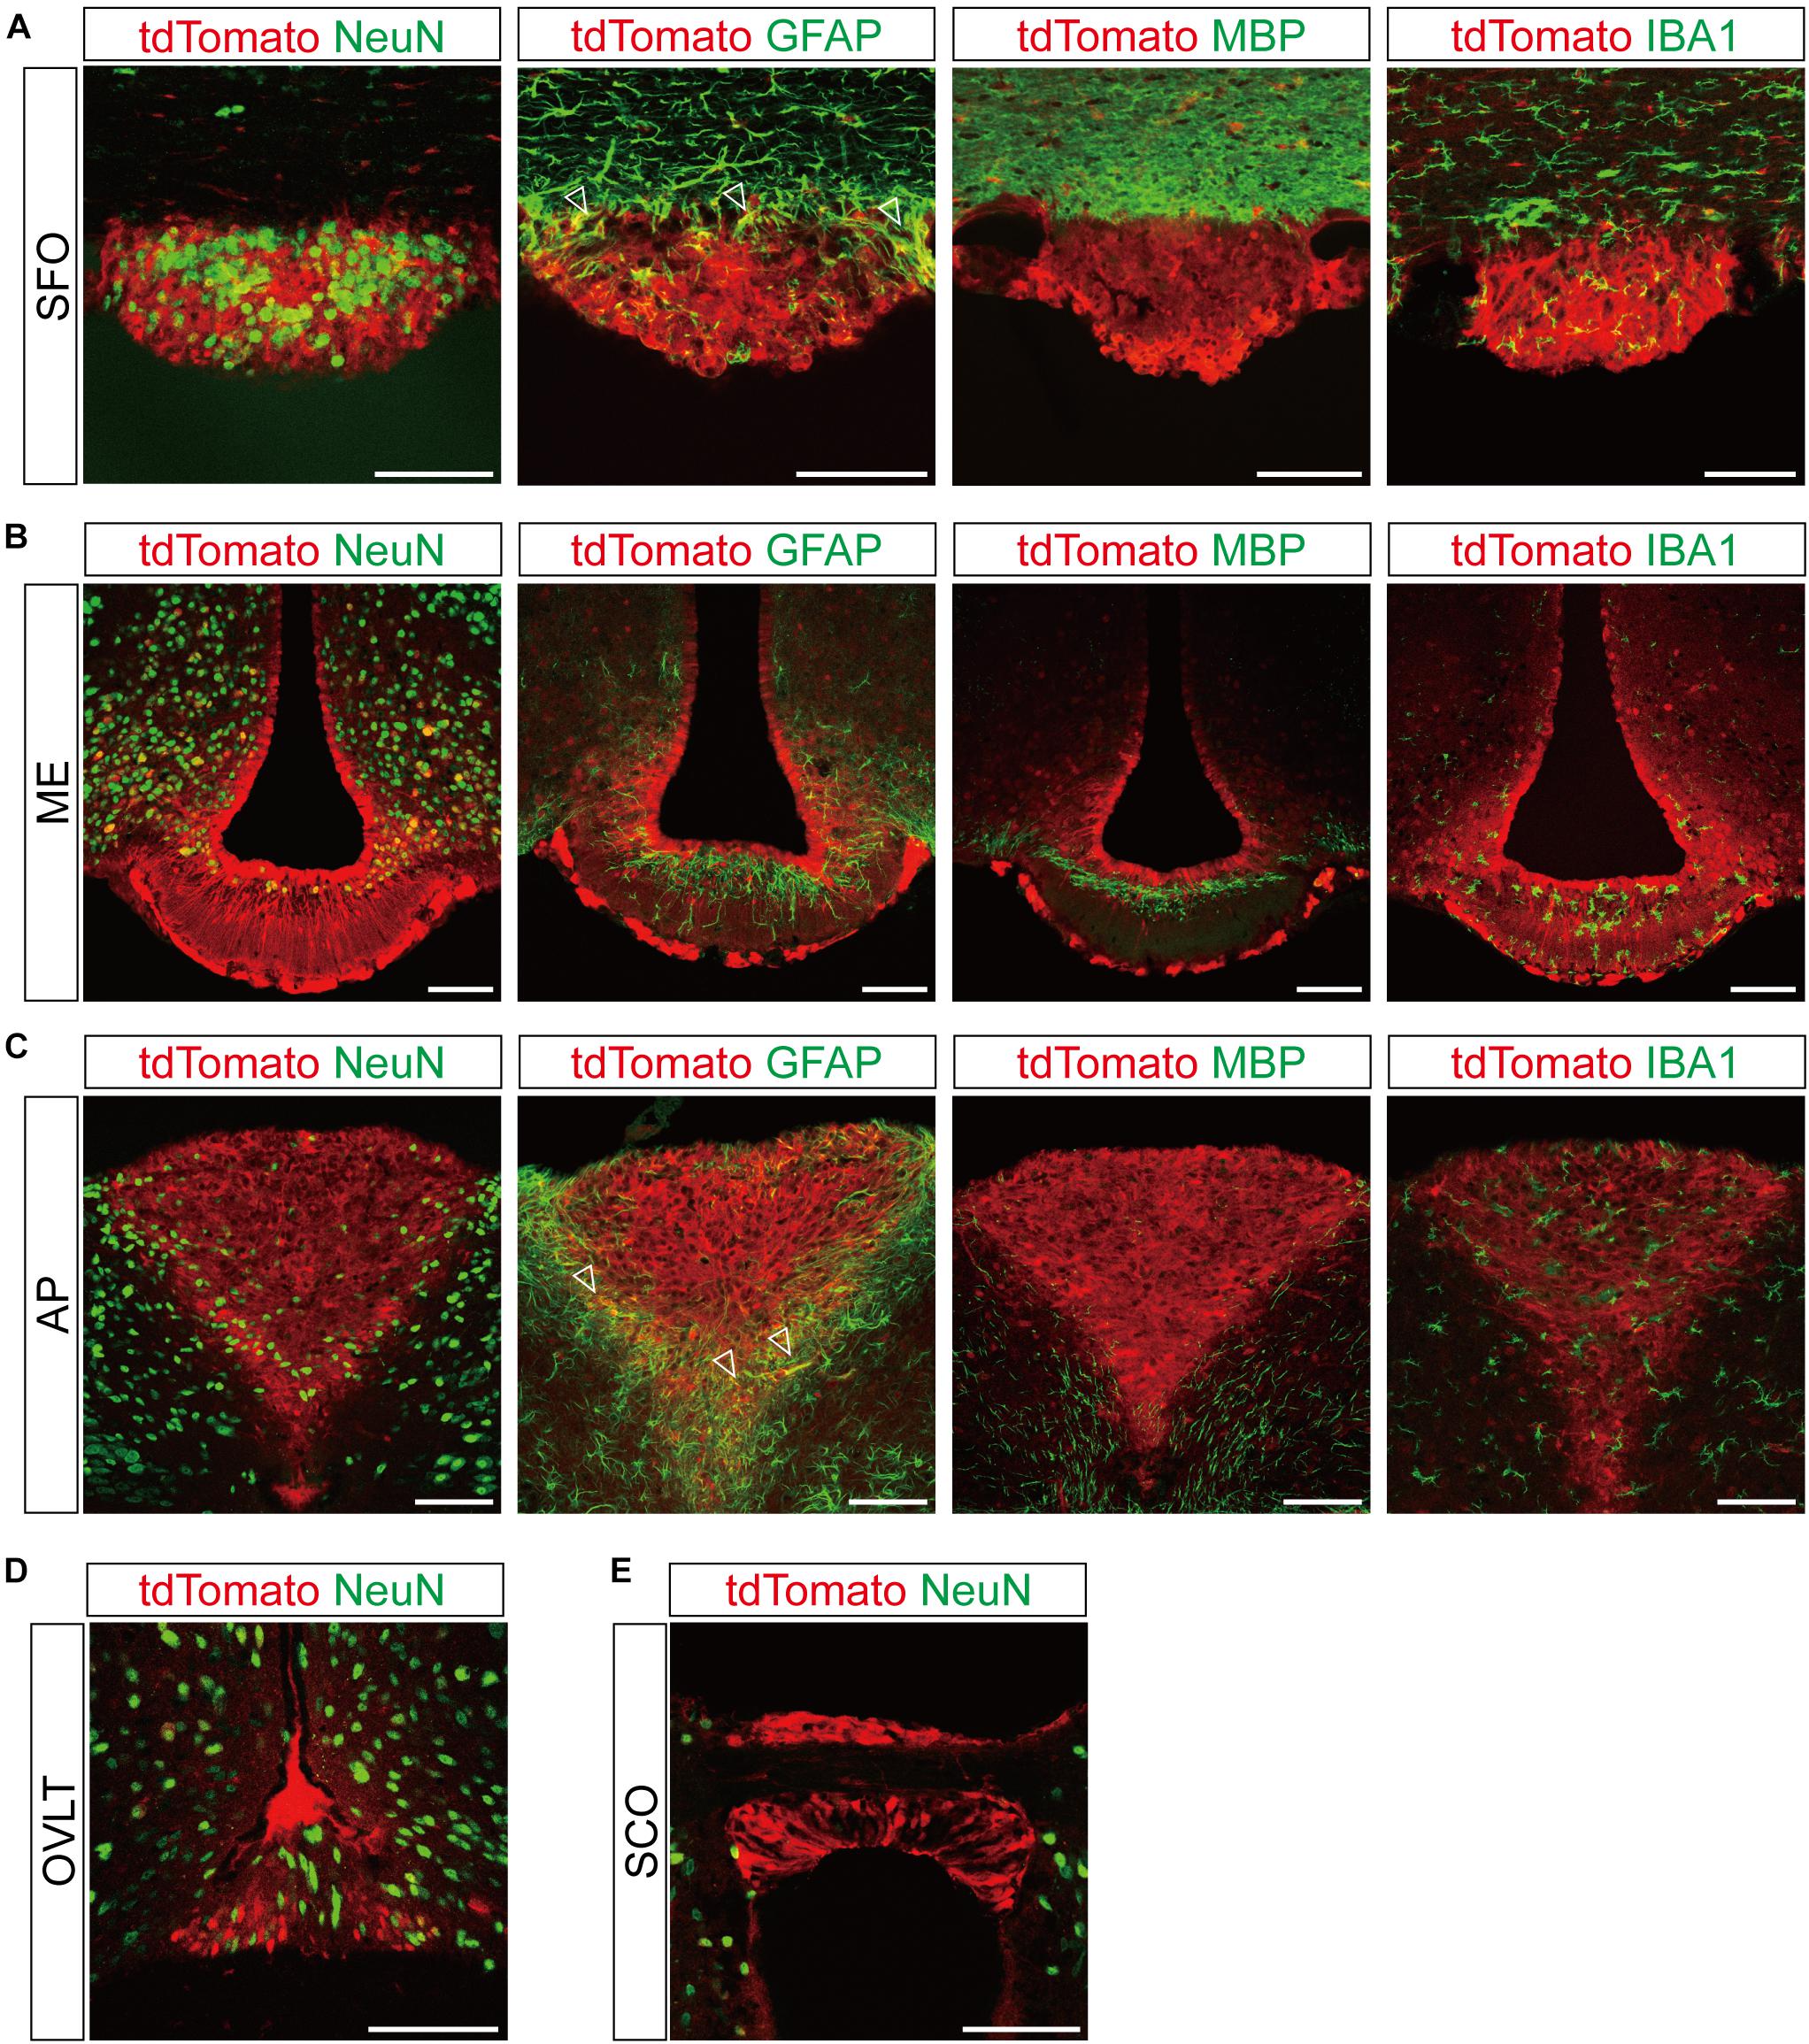
Figure 3. Representative confocal images showing tdTomato fluorescence in the circumventricular organs (CVOs) of T1r2-tdTomato mice. (A) Subfornical organ (SFO), (B) median eminence (ME), (C) area postrema (AP), (D) organum vasculosum lamina terminalis (OVLT), and (E) subcommissural organ (SCO). Representative markers for neurons (neuronal nuclei, NeuN), astrocytes (glial fibrillary acidic protein, GFAP), oligodendrocytes (myelin basic protein, MBP), and microglia (ionized calcium-binding adaptor molecule, IBA1) are indicated in green; tdTomato is indicated in red. White triangles indicate the overlap of the green and red signals. Scale bar, 100 μm.
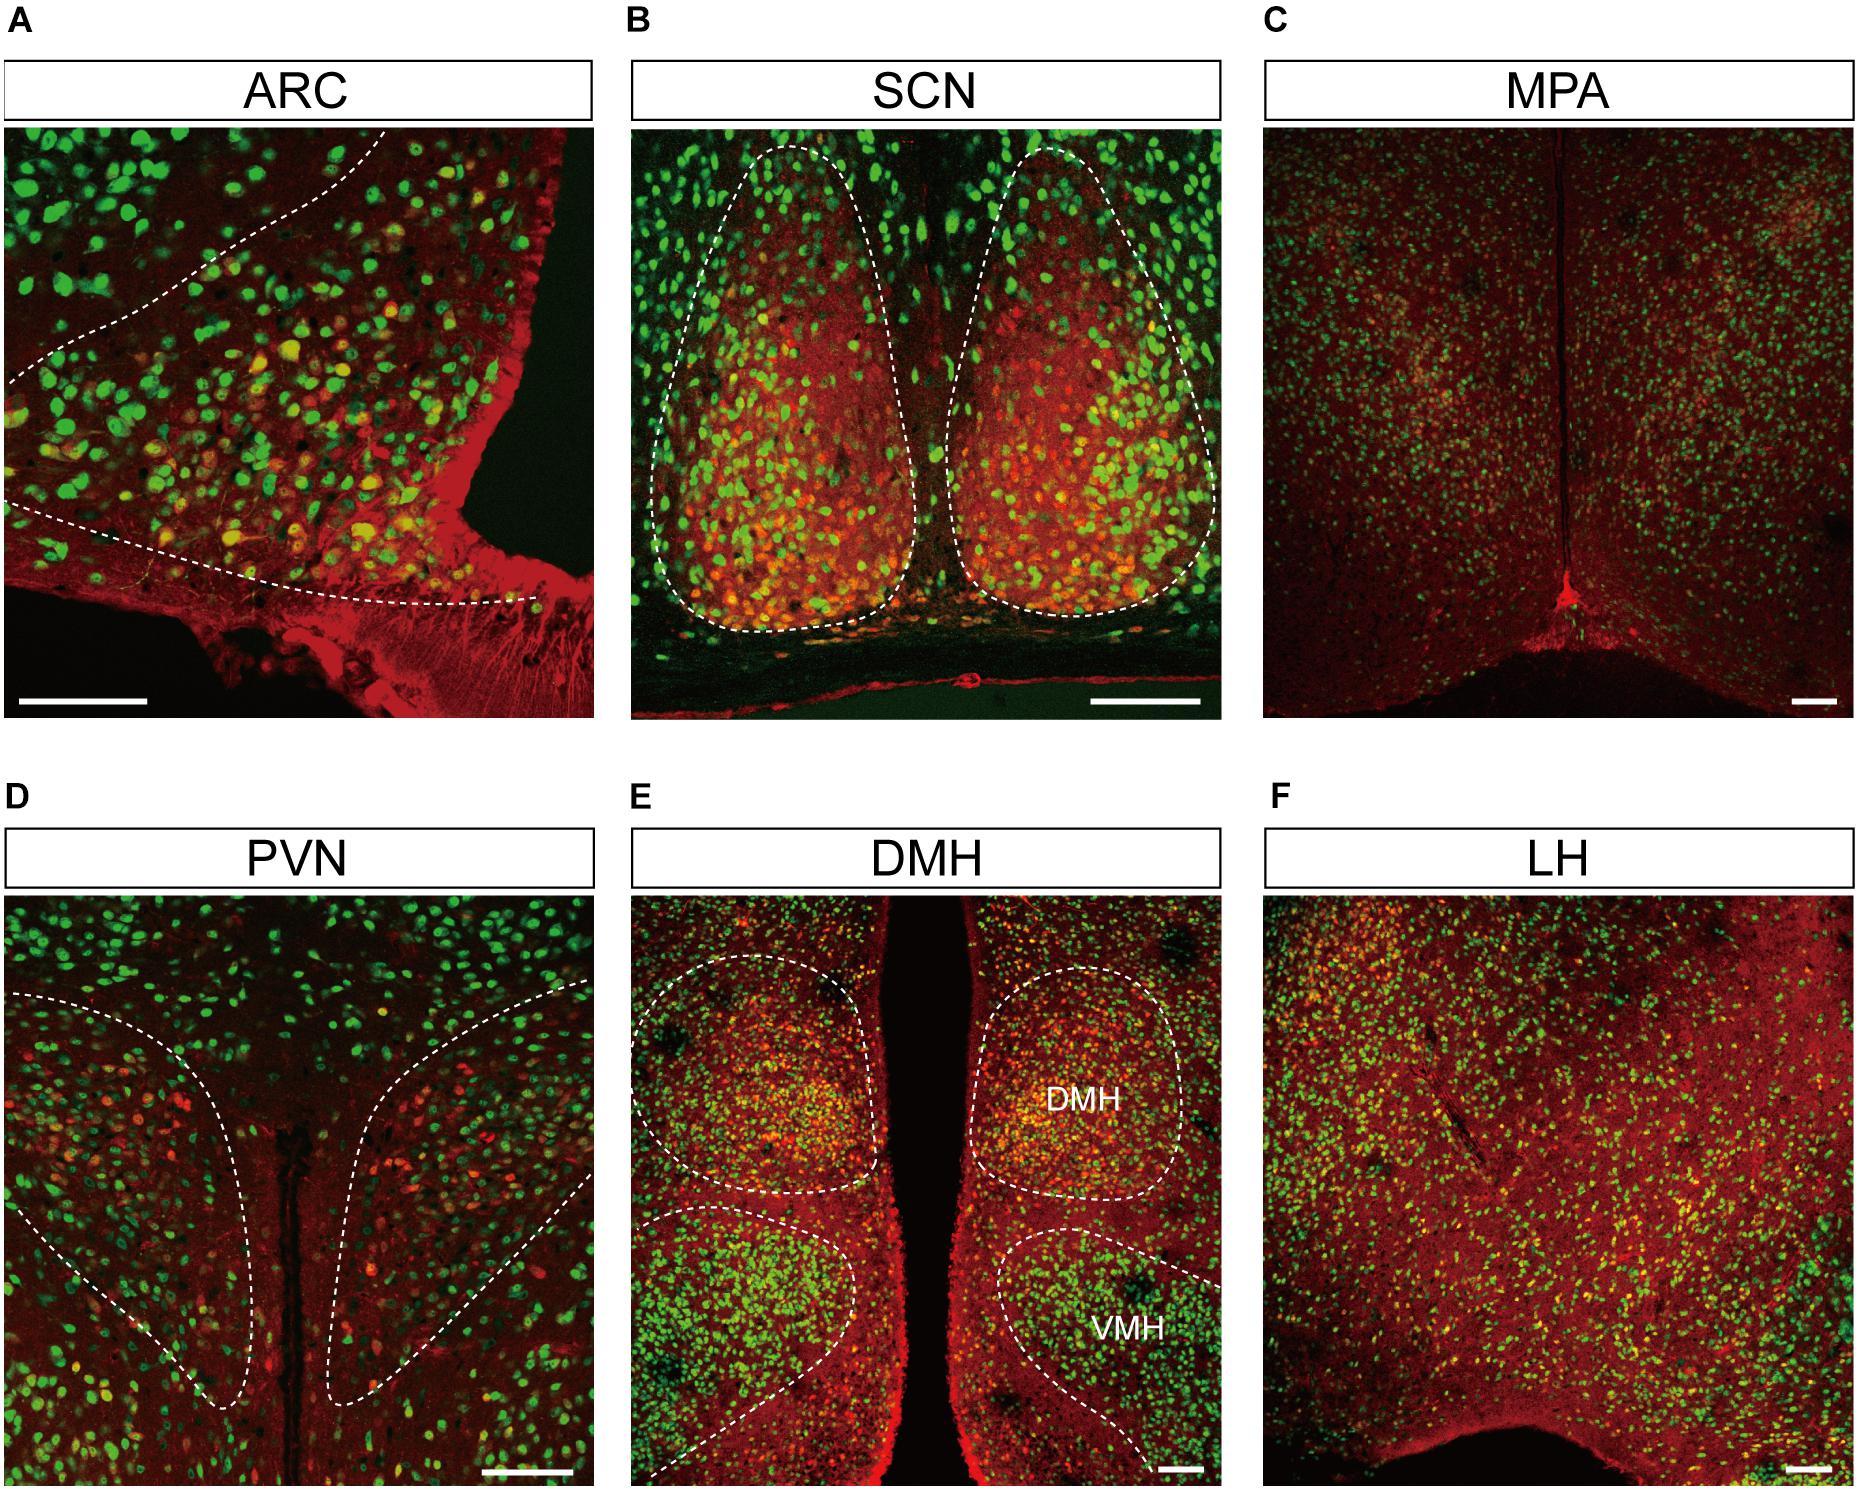
Figure 4. Representative confocal images showing tdTomato fluorescence in the hypothalamic nuclei of T1r2-tdTomato mice. (A) Arcuate nucleus (ARC), (B) suprachiasmatic nucleus (SCN), (C) median preoptic area (MPA), (D) paraventricular nucleus (PVN), (E) dorsomedial hypothalamic nucleus (DMH), and (F) Lateral hypothalmus (LH). Anti-NeuN signals (green); tdTomato (red). Scale bar, 100 μm.
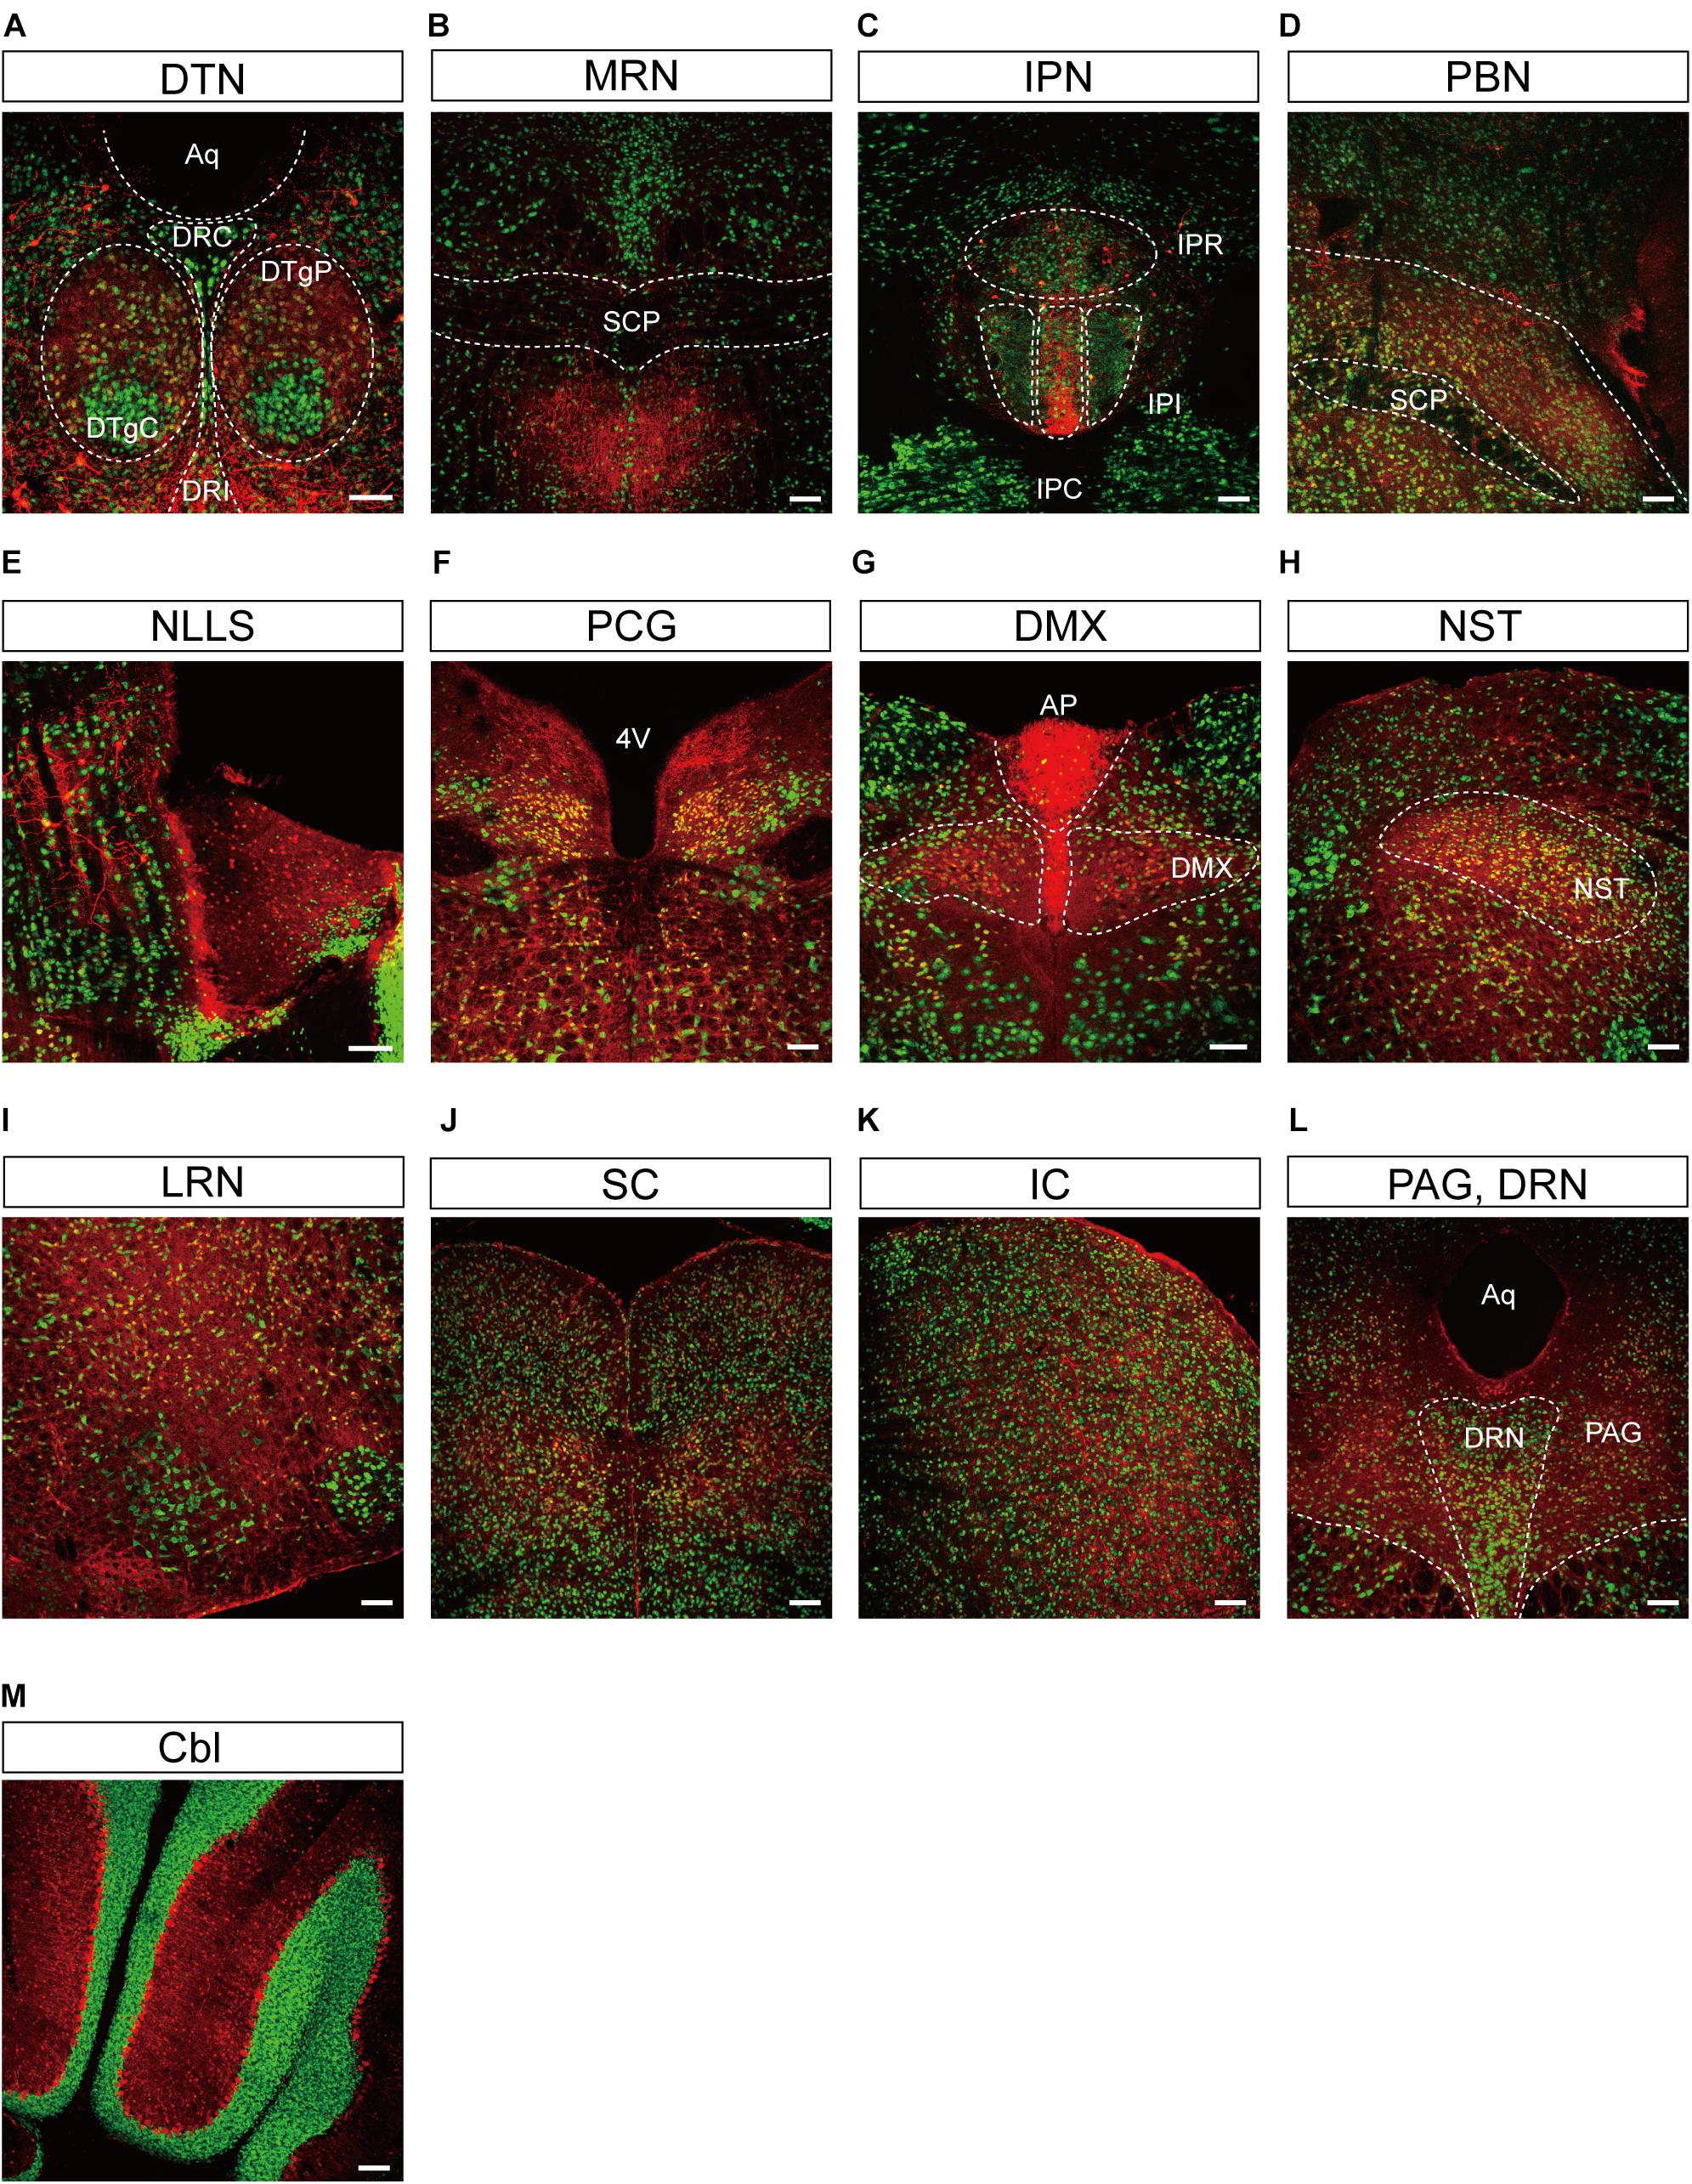
Figure 5. Representative confocal images showing tdTomato fluorescence in the midbrain, hindbrain, and cerebellum of T1r2-tdTomato mice. (A) Dorsal tegmental nucleus (DTN). The caudal (DRC), interfascicular (DRI), central (DTgC), and pericentral parts (DTgP) are marked. Aqueduct (Aq), (B) the median raphe nucleus (MRN) and superior cerebellar peduncles (SCP) are indicated, (C) interpeduncular nucleus (IPN). The rostral (IPR), caudal (IPC), and intermediate subnucleus (IPI), (D) parabrachial nucleus (PBN), (E) nucleus of the lateral lemniscus (NLLS), (F) pontine central grey (PCG). 4th ventricle (4V), (G) AP and dorsal motor nucleus of the vagus nerve (DMX), (H) nucleus of the solitary tract (NST), (I) lateral reticular nucleus (LRN), (J) superior colliculus (SC), (K) inferior colliculus (IC), (L) periaqueductal gray (PAG) and dorsal raphe nucleus (DRN), and (M) Cerebellum (Cbl). White dotted lines indicate the border of nearby areas. Anti-NeuN signals (green); tdTomato (red). Scale bar, 100 μm.
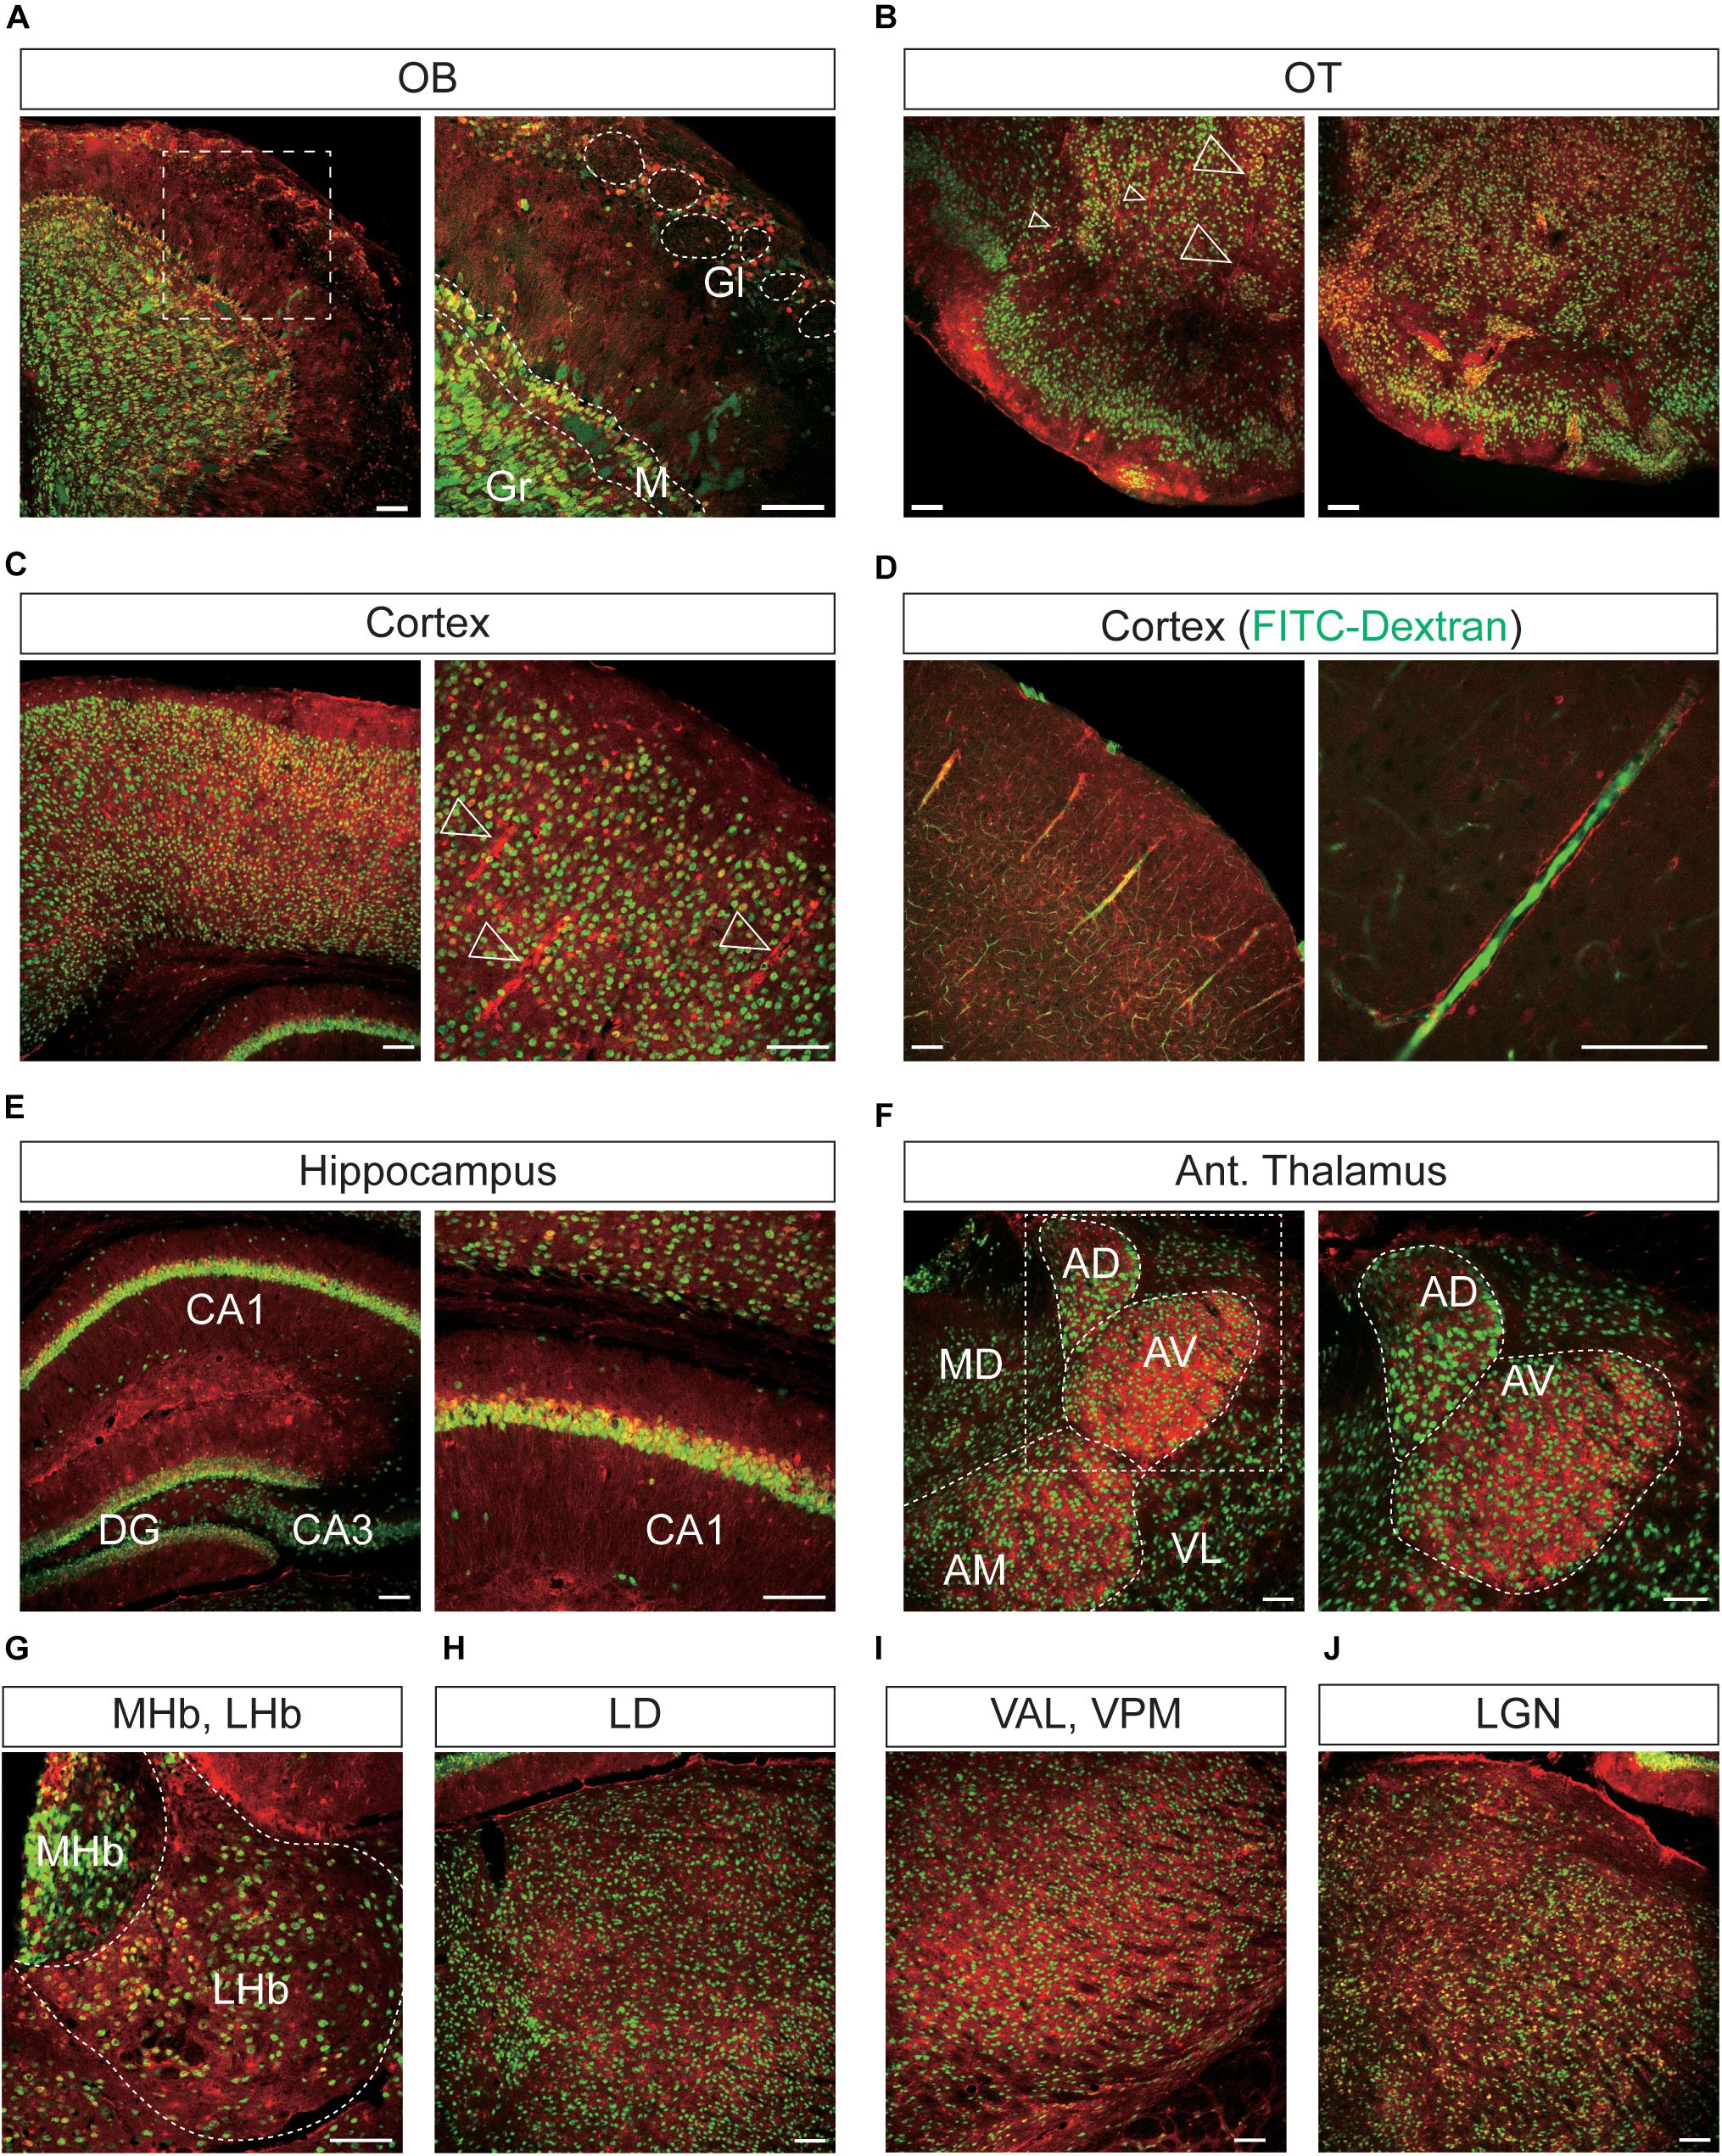
Figure 6. Representative confocal images showing tdTomato fluorescence in the olfactory bulb, cerebral cortex, and thalamus of T1r2-tdTomato mice. (A) Olfactory bulb (OB). Glomeruli (Gl), mitral layer (M), and granular layer (Gr) are indicated with white dotted lines, (B) olfactory tubercle (OT), (C) cortex, (D) cortex. FITC-Dextran (green). (E) In the hippocampus, Cornu Ammonis area 1 (CA1), CA3, and the dentate gyrus (DG) are labeled. (F) Anterior thalamus. Left: Anterodorsal (AD), anteroventral (AV), anteromedial (AM), mediodorsal (MD), and ventrolateral (VL) nuclei are labeled; Right: magnified images of the white dotted box in the left image, (G) medial (MHb) and lateral habenula (LHb), (H) laterodorsal nucleus (LD) of the thalamus, (I) ventroanterolateral (VAL) and ventroposterior medial (VPM) nuclei of the thalamus, and (J) lateral geniculate nucleus (LGN). White dotted lines indicate the borders of nearby areas. White empty triangles indicate vascular structures. Anti-NeuN signals [green except for panel (D)]; tdTomato (red). Scale bar, 100 μm.
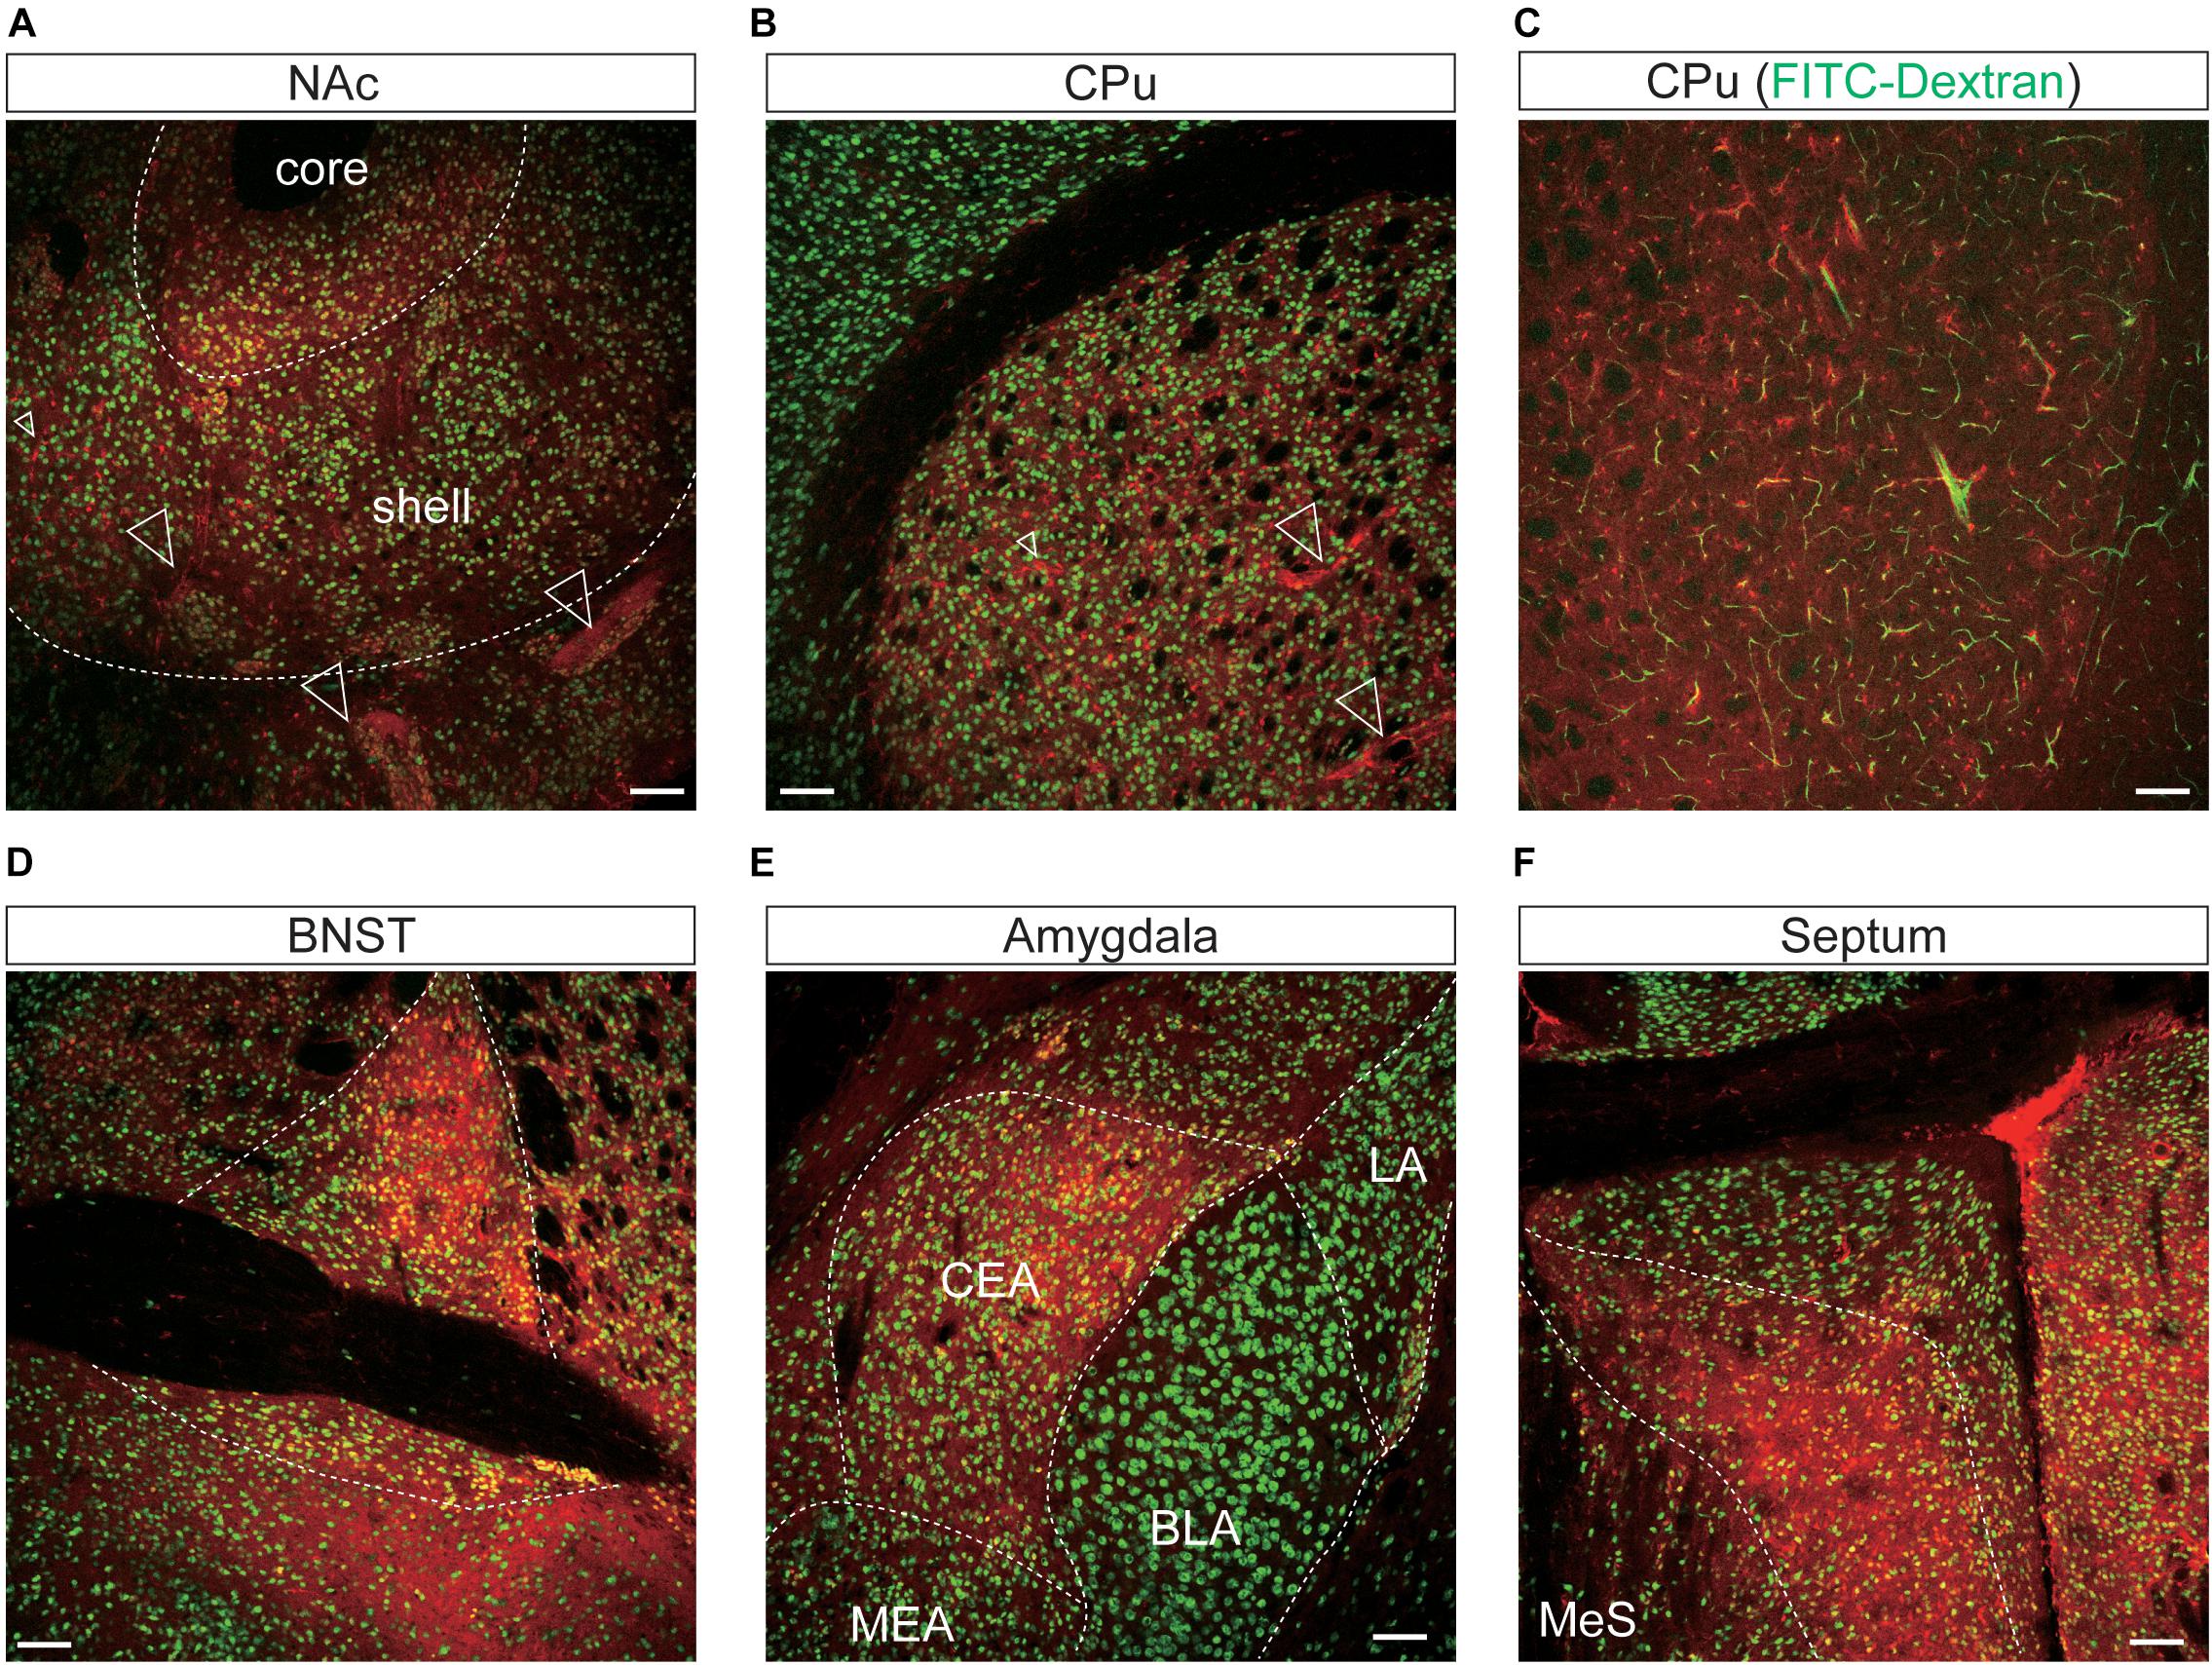
Figure 7. Representative confocal images showing tdTomato fluorescence in the mesolimbic pathways of T1r2-tdTomato mice. (A) Nucleus accumbens (NAc). The core and shell of the NAc are indicated, (B) caudate putamen (CPu), (C) caudate putamen. FITC-Dextran (green). (D) Bed nucleus of the stria terminalis (BNST). (E) In the amygdala, the central amygdala (CEA), medial amygdala (MEA), lateral amygdala (LA), and basolateral amygdala (BLA) are indicated. (F) Septal nuclei. White dotted lines indicate the borders of nearby areas. White empty triangles indicate vascular structures. Anti-NeuN signals [green except for panel (C)]; tdTomato (red). Scale bar, 100 μm.
Although we did observe tdTomato fluorescence scattered throughout the brain, there were significant concentrations in specific regions. The most prominent signals were located near the ventricular system (Figure 3 and Table 3), with intense staining in the circumventricular organs (CVOs)—the subfornical organ (SFO), the median eminence (ME), the area postrema (AP), the organum vasculosum lamina terminalis (OVLT), and the subcommissural organ (SCO) (Figure 3). There was also a morphologically heterogenous population of tdTomato-positive cells in the mediobasal hypothalamus—not only parenchymal cells with a neuron-like morphology, but also cells lining the internal wall of the third ventricle and the external wall of the ME (Figures 3, 4). The tdTomato-positive cells in the SCN and MPA, in contrast, were morphologically homogenous (Figure 4). In addition, while the dorsal hypothalamus, PVN, DMH, and LH showed significant tdTomato fluorescence, other important hypothalamic nuclei, including the anterior hypothalamic nucleus and ventromedial hypothalamic nucleus did not (Figure 4).
We also observed significant tdTomato expression in the hindbrain (Figure 5). The dorsal tegmental nucleus (DTN), median raphe nucleus (MRN), and interpeduncular nucleus (IPN) each showed a bright and densely fibrous arbor of staining arising from a relatively limited number of tdTomato-expressing cells (Figures 5A–C). In addition, we observed some tdTomato labeling in the parabrachial nucleus (PBN), the nucleus of the lateral lemniscus (NLLS), the pontine central grey (PCG), the dorsal motor nucleus of the vagus nerve (DMX), the nucleus of the solitary tract (NST), and the reticular nucleus (RN) (Figures 5D–I). In the midbrain, we observed labeling in a subset of neurons in the superior (SC) and inferior colliculi (IC), as well as in the ventrolateral PAG and DRNs (Figures 5J–L). In the cerebellum, we observed mutually exclusive expression of either tdTomato or NeuN, indicating expression of T1R2 in Purkinje cells rather than granular cells (Figure 5M).
In the OB, the tdTomato and anti-NeuN signals showed overlap outside the olfactory glomeruli and in the mitral and granular layers, indicating that periglomerular cells, mitral cells, and granular cells express T1r2 (Figure 6A). When we examined the cortex, we found most cortical regions showed some scattered fluorescence. Although some tdTomato-expressing cells showed overlap with anti-NeuN staining, most did not (Figures 6B,C). In the hippocampus, neurons in CA1, CA2, CA3, and dentate gyrus (DG) were tdTomato-positive regardless of their rostrocaudal position (Figure 6E). In the anterior thalamus, the tdTomato signal was concentrated in the anterodorsal (AD), anteroventral (AV), and anteromedial (AM) nuclei, as well as in the lateral habenula (Figures 6F,G). In contrast, we observed significant staining scattered throughout the entire posterior thalamus (Figures 6H–J).
In the mesolimbic system, the lateral septum (LS), NAc, caudate putamen (CPu), BNST, central (CEA) and median amygdala (MEA), and septal nuclei expressed tdTomato in some neurons (Figure 7), but the ventral tegmental area (VTA) did not.
Vascular Expression of T1r2-Cre
We found that the many T1r2-expressing cells in the cortex, thalamus, and striatum are negative for anti-NeuN. Moreover, we noticed that most of the non-neuronal T1r2-expressing cells have a vascular-like luminal structure (Figures 6B,C,F,H,I, 7A,B, white empty triangles). These presumed blood vessels appear to be of various sizes, implying a general T1r2 expression in the cerebrovascular system. Thick vessels run straight, finally branching into several thin ones (Figures 6B,C, 7A,B, white empty triangles). The thinnest vessels comprised single layers of cells, interconnected with one another to form a vascular web (Figures 6B,C,F,H,I, 7A,B, white empty triangles). To confirm whether the tubular structures formed by T1r2-expressing cells are blood vessels, we visualized blood vessels directly by transcardial injection of FITC-dextran (70 kDa) and found the spatial proximity between FITC signals and T1r2-expressing cells in cortex and CPu (Figures 6D, 7C). We also observed pericytic tdTomato expression distributed homogenously throughout the cortex, posterior thalamus, and dorsal striatum, as well as more prominent expression in the anterodorsal (AD), anteroventral (AV), and anteromedial (AM) nuclei of the anterolateral thalamus (Figures 6, 7). These data indicate an enrichment of T1r2 in the neurovascular system.
Glial Expression of T1r2-Cre in Circumventricular Organs
Across the entire brain, CVOs showed such strong tdTomato fluorescence that we could detect it without immunostaining. When we performed double IHC with anti-NeuN, however, we found that not all tdTomato-expressing cells in the CVOs were neurons (Figure 3). To identify their cellular identities, we next conducted double IHC with the following glial cell markers: Glial Fibrillary Acidic Protein (GFAP) for astrocytes; Ionized Calcium-Binding Adaptor molecule (IBA1) for microglia; and Myelin Basic Protein (MBP) for oligodendrocytes.
In the dorsal periphery of the SFO, a subset of tdTomato-expressing cells were positive for GFAP (Figure 3A). Due to the restricted subcellular localization of GFAP protein in astrocytic processes rather than cell bodies, we found that the cytosolic tdTomato signal showed only partial overlap with anti-GFAP signal in each labeled cell. There was, however, no overlap with anti-IBA1 or anti-MBP (Figure 3A). Similarly, the ventrolateral margin of the AP showed co-expression of tdTomato and anti-GFAP (Figure 3C), indicating T1r2 is expressed in astrocytes in the SFO and AP.
The labeled cells in the ARC-ME had heterogenous morphology owing to a heterogeneity of their cellular identities. In the ARC-ME complex parenchyma, tdTomato-expressing cells showed a neuron-like morphology and expressed NeuN (Figures 3B, 4A). The cells surrounding the wall of the third ventricle, however, expressed neither neuronal nor glial markers (Figure 3B). Instead, we were able to identify these cells as tanycytes by their long processes projecting radially from the ventricular wall to the parenchyma. We also observed strong fluorescence signal in the perivascular cells covering the ventral margin of the ME (Figure 3B). In addition, we observed tdTomato expression in the cells of the OVLT at the anterior end of the third ventricle and in the SCO at the posterior end of the third ventricle (Figures 3D,E).
Expression of T1r2-Cre in Hypothalamic Neuropeptide Y/Agouti-Related Peptide and Proopiomelanocortin Neurons
The primary centers for central metabolic regulation in the ARC-ME complex are bimodal (Sohn et al., 2013). Depletion of energy is detected by NPY/Agouti-related peptide (AgRP)-expressing neurons (Betley et al., 2015; Beutler et al., 2017; Su et al., 2017), whereas storage of energy is detected by POMC-expressing neurons (Beutler et al., 2017). To determine whether the neurons expressing T1r2 are NPY/AgRP neurons, POMC neurons, or both, we generated triple transgenic mice expressing T1r2-Cre and Rosa-LSL-tdTomato, along with either Npy-hrGFP or POMC-hrGFP. Most of the parenchymal tdTomato signal we observed showed overlap with NPY-expressing neurons (Figure 8A). In contrast, only a small number of tdTomato-labeled neurons were also positive for POMC (Figure 8B). Together, we observed tdTomato fluorescence in 75% (1,155 of 1,550 cells) of Npy positive neurons and 34% (181 of 540 cells) of POMC positive neurons (Figure 8C). These data suggest T1r2 is expressed both in hypothalamic NPY/AgRP and POMC neurons.
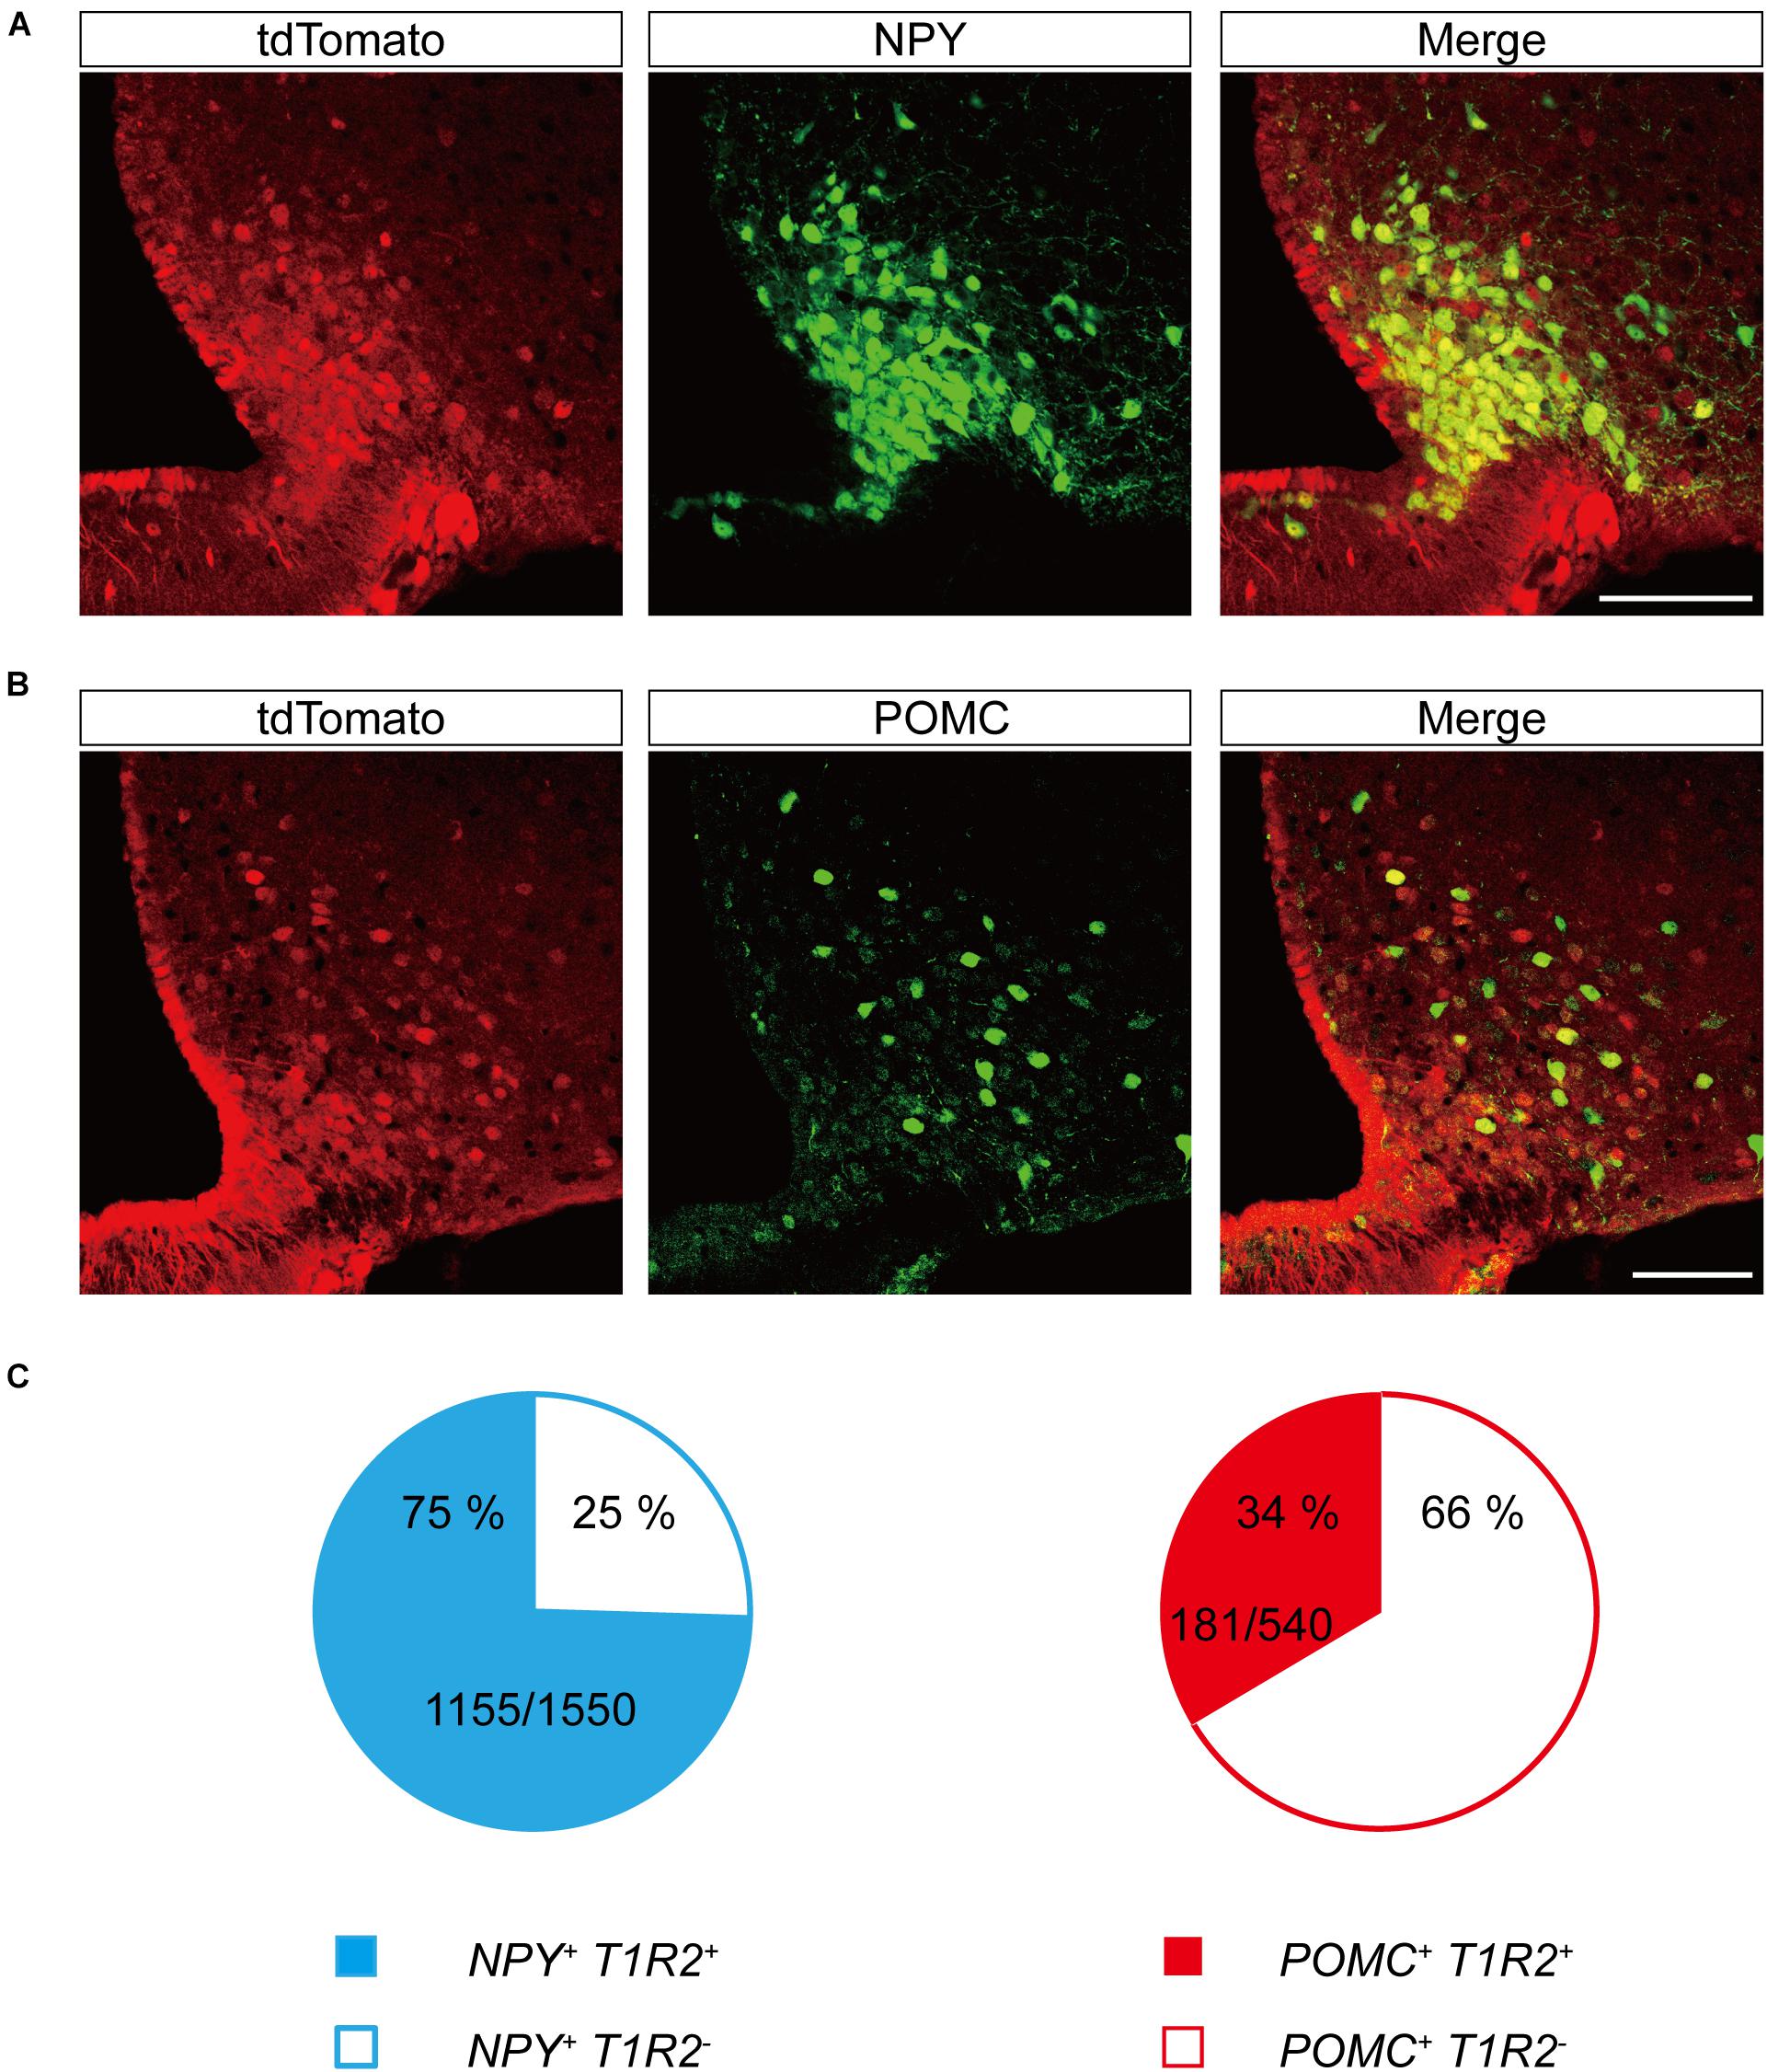
Figure 8. Representative confocal images showing tdTomato fluorescence in hypothalamic neuropeptide Y (NPY) or proopiomelanocortin (POMC)-expressing neurons of T1r2-tdTomato mice. (A) Co-expression of tdTomato with Npy-hrGFP. (B) Co-expression of tdTomato with POMC-hrGFP. Anti-GFP signals (green), and tdTomato (red). Scale bar, 100 μm. (C) Quantification of hypothalamic NPY neurons (blue) and POMC neurons (red) that co-express tdTomato. Filled and blank areas indicate the presence and absence of tdTomato expression, respectively.
Co-localization of Canonical Taste Signaling Molecules
In taste buds, type II TRCs employ proteins like GNAT3, PLCβ2, and TRPM5 downstream of taste receptor signaling (McLaughlin et al., 1992; Wong et al., 1996; Perez et al., 2002; Liu and Liman, 2003; Zhang et al., 2003; Mueller et al., 2005). We wondered whether such canonical taste signaling molecules are also co-expressed with T1R2 in the brain. Thus, we again conducted double IHC experiments to visualize PLCβ2, GNAT3, or TRPM5 expression alongside tdTomato expression.
Remarkably, we found complete co-localization of PLCβ2 with tdTomato in hypothalamic perivascular cells of the leptomeningeal layer, but not in other areas (Figure 9A). Although anti-GNAT3 marked the median eminence, it did not co-localize with tdTomato (Figure 9A). We also found that none of the brain regions that expressed tdTomato were stained with the antibody against TRPM5 (Figure 9A). Given that the specificity of the antibodies we used was already validated in taste buds (Figure 1C), the relative lack of GNAT3, PLCβ2, and TRPM5 in the central nervous system indicates a true scarcity.
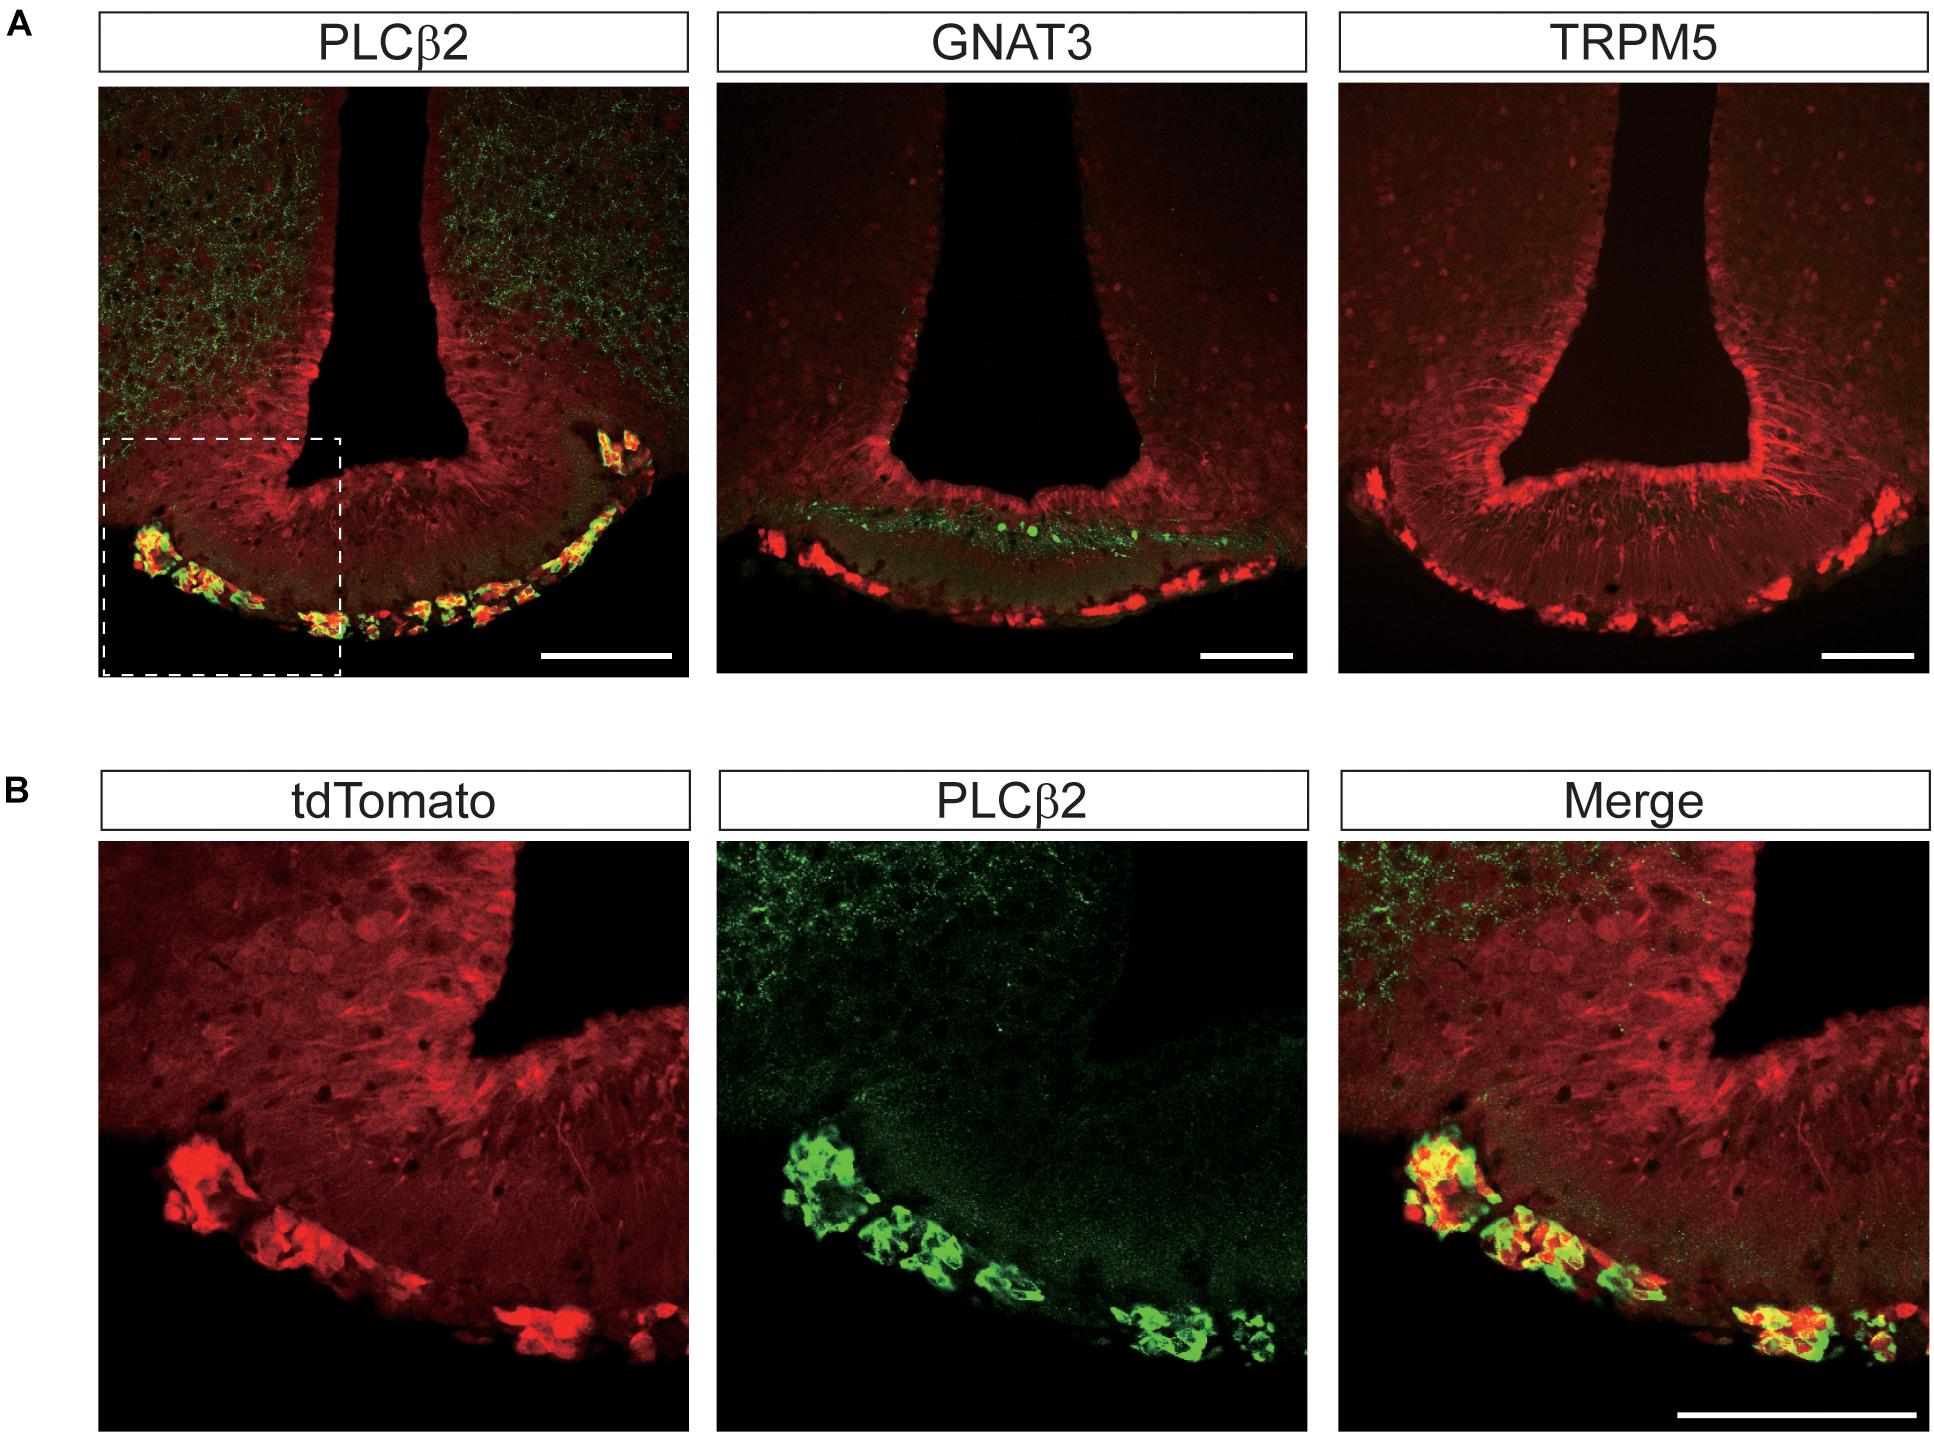
Figure 9. Representative confocal images showing tdTomato fluorescence in the perivascular cells of the median eminence (ME) in T1r2-tdTomato mice. (A) Double immunostaining of the ME for tdTomato and some canonical taste signaling molecules. Phospholipase Cβ2 (PLCβ2), α-gustducin (GNAT3), and transient receptor potential M5 (TRPM5). (B) Magnified view of the white dotted box in Figure 8A. Representative markers are green; tdTomato appears in red. Scale bar, 100 μm.
Discussion
In this study, we have described the comprehensive distribution of T1R2 across the whole brain using genetically engineered Cre-expressing mice. Moreover, we have revealed a detailed neurochemical characterization of many T1R2-expressing cells using double IHC experiments that labeled both Cre-driven fluorescence in combination with markers for specific neuronal and non-neuronal cell populations. We found that T1r2-expressing cells are distributed widely throughout the brain but especially concentrated near the ventricles. T1r2 is expressed in neurons, as previous studies suggested, but we unexpectedly discovered significant expression in cerebrovascular structures as well. This particular location for the T1r2-expressing cells provides them with access to circulating nutrient (e.g., sugars) in both the blood and brain simultaneously, suggesting a role for sweet taste receptors in the regulation of metabolic homeostasis.
Several researchers have reported the existence of glucose-sensing brain neurons that express T1R2 (Ren et al., 2009; Kohno et al., 2016). Most GE neurons detect glucose by metabolizing it. Briefly, glucose is taken up by GLUT2 and phosphorylated by glucokinase to produce ATP. The resulting increase in ATP induces the closure of the Kir6.2 channel, ultimately leading to neuronal depolarization (Ashford et al., 1990; Miki et al., 2001; Jordan et al., 2010). There are other GE neurons that are sensitive to much higher concentrations of glucose and that are thus referred to as high glucose-excited (HGE) neurons (Fioramonti et al., 2004). Diverse molecular sensors—sodium-glucose transporter 1 (SGLT1), SGLT3, and sweet taste receptors—have been proposed as the candidate mechanism of underlying the unique sensitivity of HGE neurons (Yang et al., 1999; Diez-Sampedro et al., 2003; O’Malley et al., 2006; Ren et al., 2009; Kohno et al., 2016). Especially, the low affinity of sweet taste receptors for glucose may simply explain glucose concentration-dependent selectivity (Zhao et al., 2003; Treesukosol et al., 2011).
Through a series of physiology experiments, Kohno et al. (2016) predicted the expression of sweet taste receptors in the ARC based on responses to the artificial sweetener sucralose (Kohno et al., 2016; Benford et al., 2017). They found sucralose activates a small population of hypothalamic POMC neurons that also responds to high concentrations of glucose, indicating that they are HGE neurons (Kohno et al., 2016). Thus, Kohno et al. suggested sweet taste receptors may serve as glucose sensors in HGE neurons. Our genetic labeling experiments partly support their prediction. The ratio of POMC+ neurons to sucralose responsive neurons (15%) they identified was similar to the ratio of POMC+, T1R2+ neurons to POMC+ neurons we observed in this study (34%). The subtle discrepancy seems to be due to the low number of POMC neurons recorded in the previous study (Kohno et al., 2016).
Most G-protein coupled receptors (GPCRs) can couple to multiple Gα proteins, as well as b-arrestin, depending on the context of the cell in which they are expressed (Kroeze et al., 2015; Olsen et al., 2020). Taste receptors, which belong to the GPCR superfamily, generally couple to GNAT3 in type II taste cells (McLaughlin et al., 1992; Zhang et al., 2003; Mueller et al., 2005). But not all type II taste cells express GNAT3 (Kim et al., 2003; Kusakabe et al., 2005; Sainz et al., 2007; Shindo et al., 2008; Tizzano et al., 2008). Rather than GNAT3, the sweet taste receptor-expressing cells of foliate and circumvallate papillae express Gα14, suggesting sweet taste receptors use Gα14 as an effector (Kim et al., 2003; Kusakabe et al., 2005; Sainz et al., 2007; Shindo et al., 2008; Tizzano et al., 2008). Thus, just as the leptin and insulin receptors function differently in hypothalamic POMC and NPY/AgRP neurons, it seems T1R2 may also employ distinct modes of action in different cell types. Indeed, the rare co-expression of canonical taste signaling molecules in most T1r2-expressing cells in the brain implies that the sweet taste receptors in the brain employ downstream signaling pathways distinct from those employed by the same receptors in type II taste bud cells. It is also possible that a biased agonism of T1R2 is what directs the choice of distinct intracellular signal transduction pathways depending on the ligand that activates the sweet receptor.
We expect T1R2 is expressed in the brain because it is important for some physiological function, not only in the ARC, but also in other brain regions. For example, T1R2-expressing cells in the SFO and AP may detect elevated glucose levels in the cerebrospinal fluid, inducing diabetic thirst and nausea, respectively. Alternatively, sweet taste receptors may be involved in the entrainment of circadian rhythms in the SCN in response to circadian glucose fluctuations. Indeed, a previous study using Ca2+ imaging of brain slices that covered the ARC revealed that tanycytes respond to sucralose (Benford et al., 2017). Tanycytes, pericytes, and perivascular cells regulate the permeability of the blood brain barrier (BBB) (Langlet et al., 2013). Thus, sweet taste receptors may prove to be useful targets for drugs aimed at manipulating BBB permeability.
What role do sweet taste receptors play in the brain? Can the T1r2-expressing cells we identified in this study detect metabolites like glucose? The novel mouse strain we established in this study will be useful in clarifying the function of T1R2 and the cells that express it in the brain. We will explore T1R2’s function using the strain in a homozygous state as a T1R2 KO. We will also manipulate the activity of T1r2-expressing cells using our strain in the heterozygous state as a Cre driver in combination with optogenetic and chemogenetic tools. Soon, we hope to clarify the physiology of taste receptors in the brain, providing novel insights for drug discovery and various therapeutic interventions.
Data Availability Statement
The original contributions presented in the study are included in the article/Supplementary Material, further inquiries can be directed to the corresponding authors.
Ethics Statement
The animal study was reviewed and approved by Animal Care Committee of Korea University College of Medicine.
Author Contributions
JJ and YJ conceptualized and designed the research. JJ and HK conducted the immunohistochemistry experiments and acquired confocal microscopic images. JJ conducted genomic DNA PCR and behavioral experiments. DS quantified the number of hrGFP-expressing neurons that co-express tdTomato. SK conducted the tongue histology experiments. SP, SM, and YJ designed the mutant constructs. S-HC, D-HK, SM, and YJ analyzed and interpreted the data. YJ supervised the project and wrote the manuscript. All authors read and approved the final manuscript.
Funding
This work was supported by the National Research Foundation of Korea (NRF) grants funded by the Korean Government (NRF-2016R1A5A2008630 to SM and NRF-2019R1C1C1006751 and NRF-2020R1A4A3078962 to YJ), by the Korean Fund for Regenerative Medicine (KFRM) grant funded by the Korean Government (the Ministry of Health and Welfare; 21C0712L1-11 to YJ), and by a Korea University Grant (K1925091).
Conflict of Interest
The authors declare that the research was conducted in the absence of any commercial or financial relationships that could be construed as a potential conflict of interest.
Publisher’s Note
All claims expressed in this article are solely those of the authors and do not necessarily represent those of their affiliated organizations, or those of the publisher, the editors and the reviewers. Any product that may be evaluated in this article, or claim that may be made by its manufacturer, is not guaranteed or endorsed by the publisher.
Acknowledgments
We thank K. B. Lee and J. Shim for the maintenance of the T1r2-Cre strain and for the generation of the TRPM5 antibody, respectively.
Supplementary Material
The Supplementary Material for this article can be found online at: https://www.frontiersin.org/articles/10.3389/fnana.2021.751839/full#supplementary-material
References
Ashford, M. L., Boden, P. R., and Treherne, J. M. (1990). Glucose-induced excitation of hypothalamic neurones is mediated by ATP-sensitive K+ channels. Pflugers Arch. 415, 479–483. doi: 10.1007/BF00373626
Benford, H., Bolborea, M., Pollatzek, E., Lossow, K., Hermans-Borgmeyer, I., Liu, B., et al. (2017). A sweet taste receptor-dependent mechanism of glucosensing in hypothalamic tanycytes. Glia 65, 773–789. doi: 10.1002/glia.23125
Betley, J. N., Xu, S., Cao, Z. F. H., Gong, R., Magnus, C. J., Yu, Y., et al. (2015). Neurons for hunger and thirst transmit a negative-valence teaching signal. Nature 521, 180–185. doi: 10.1038/nature14416
Beutler, L. R., Chen, Y., Ahn, J. S., Lin, Y. C., Essner, R. A., and Knight, Z. A. (2017). Dynamics of Gut-Brain Communication Underlying Hunger. Neuron 96, 461–475.e5. doi: 10.1016/j.neuron.2017.09.043
Calvo, S. S., and Egan, J. M. (2015). The endocrinology of taste receptors. Nat. Rev. Endocrinol. 11, 213–227. doi: 10.1038/nrendo.2015.7
Chaudhari, N., and Roper, S. D. (2010). The cell biology of taste. J. Cell Biol. 190, 285–296. doi: 10.1083/jcb.201003144
Cowley, M. A., Cone, R., Enriori, P., Louiselle, I., Williams, S. M., and Evans, A. E. (2003). Electrophysiological actions of peripheral hormones on melanocortin neurons. Ann. N. Y. Acad. Sci. 994, 175–186. doi: 10.1111/j.1749-6632.2003.tb03178.x
Deshpande, D. A., Wang, W. C., Mcilmoyle, E. L., Robinett, K. S., Schillinger, R. M., An, S. S., et al. (2010). Bitter taste receptors on airway smooth muscle bronchodilate by localized calcium signaling and reverse obstruction. Nat. Med. 16, 1299–1304. doi: 10.1038/nm.2237
Diez-Sampedro, A., Hirayama, B. A., Osswald, C., Gorboulev, V., Baumgarten, K., Volk, C., et al. (2003). A glucose sensor hiding in a family of transporters. Proc. Natl. Acad. Sci. U. S. A. 100, 11753–11758. doi: 10.1073/pnas.1733027100
Fioramonti, X., Lorsignol, A., Taupignon, A., and Penicaud, L. (2004). A new ATP-sensitive K+ channel-independent mechanism is involved in glucose-excited neurons of mouse arcuate nucleus. Diabetes 53, 2767–2775. doi: 10.2337/diabetes.53.11.2767
Howitt, M. R., Cao, Y. G., Gologorsky, M. B., Li, J. A., Haber, A. L., Biton, M., et al. (2020). The taste receptor TAS1R3 regulates small intestinal Tuft cell homeostasis. Immunohorizons 4, 23–32. doi: 10.4049/immunohorizons.1900099
Jordan, S. D., Konner, A. C., and Bruning, J. C. (2010). Sensing the fuels: glucose and lipid signaling in the CNS controlling energy homeostasis. Cell Mol. Life Sci. 67, 3255–3273. doi: 10.1007/s00018-010-0414-7
Kim, M. R., Kusakabe, Y., Miura, H., Shindo, Y., Ninomiya, Y., and Hino, A. (2003). Regional expression patterns of taste receptors and gustducin in the mouse tongue. Biochem. Biophys. Res. Commun. 312, 500–506. doi: 10.1016/j.bbrc.2003.10.137
Kohno, D., Koike, M., Ninomiya, Y., Kojima, I., Kitamura, T., and Yada, T. (2016). Sweet taste receptor serves to activate glucose- and leptin-responsive neurons in the hypothalamic arcuate nucleus and participates in glucose responsiveness. Front. Neurosci. 10:502. doi: 10.3389/fnins.2016.00502
Kroeze, W. K., Sassano, M. F., Huang, X. P., Lansu, K., Mccorvy, J. D., Giguere, P. M., et al. (2015). PRESTO-Tango as an open-source resource for interrogation of the druggable human GPCRome. Nat. Struct. Mol. Biol. 22, 362–369. doi: 10.1038/nsmb.3014
Kusakabe, Y., Kim, M. R., Miura, H., Shindo, Y., Ninomiya, Y., and Hino, A. (2005). Regional expression patterns of T1r family in the mouse tongue. Chem. Senses 30, i23–4. doi: 10.1093/chemse/bjh094
Kyriazis, G. A., Soundarapandian, M. M., and Tyrberg, B. (2012). Sweet taste receptor signaling in beta cells mediates fructose-induced potentiation of glucose-stimulated insulin secretion. Proc. Natl. Acad. Sci. U. S. A. 109, E524–E532. doi: 10.1073/pnas.1115183109
Langlet, F., Levin, B. E., Luquet, S., Mazzone, M., Messina, A., Dunn-Meynell, A. A., et al. (2013). Tanycytic VEGF-A boosts blood-hypothalamus barrier plasticity and access of metabolic signals to the arcuate nucleus in response to fasting. Cell Metab. 17, 607–617. doi: 10.1016/j.cmet.2013.03.004
Liman, E. R., Zhang, Y. V., and Montell, C. (2014). Peripheral coding of taste. Neuron 81, 984–1000. doi: 10.1016/j.neuron.2014.02.022
Liu, D., and Liman, E. R. (2003). Intracellular Ca2+ and the phospholipid PIP2 regulate the taste transduction ion channel TRPM5. Proc. Natl. Acad. Sci. U. S. A. 100, 15160–15165. doi: 10.1073/pnas.2334159100
McLaughlin, S. K., Mckinnon, P. J., and Margolskee, R. F. (1992). Gustducin is a taste-cell-specific G protein closely related to the transducins. Nature 357, 563–569. doi: 10.1038/357563a0
Miki, T., Liss, B., Minami, K., Shiuchi, T., Saraya, A., Kashima, Y., et al. (2001). ATP-sensitive K+ channels in the hypothalamus are essential for the maintenance of glucose homeostasis. Nat. Neurosci. 4, 507–512. doi: 10.1038/87455
Mosinger, B., Redding, K. M., Parker, M. R., Yevshayeva, V., Yee, K. K., Dyomina, K., et al. (2013). Genetic loss or pharmacological blockade of testes-expressed taste genes causes male sterility. Proc. Natl. Acad. Sci. U. S. A. 110, 12319–12324. doi: 10.1073/pnas.1302827110
Mueller, K. L., Hoon, M. A., Erlenbach, I., Chandrashekar, J., Zuker, C. S., and Ryba, N. J. (2005). The receptors and coding logic for bitter taste. Nature 434, 225–229. doi: 10.1038/nature03352
Nakagawa, Y., Nagasawa, M., Yamada, S., Hara, A., Mogami, H., Nikolaev, V. O., et al. (2009). Sweet taste receptor expressed in pancreatic beta-cells activates the calcium and cyclic AMP signaling systems and stimulates insulin secretion. PLoS One 4:e5106. doi: 10.1371/journal.pone.0005106
Olsen, R. H. J., Diberto, J. F., English, J. G., Glaudin, A. M., Krumm, B. E., Slocum, S. T., et al. (2020). TRUPATH, an open-source biosensor platform for interrogating the GPCR transducerome. Nat. Chem. Biol. 16, 841–849. doi: 10.1038/s41589-020-0535-8
O’Malley, D., Reimann, F., Simpson, A. K., and Gribble, F. M. (2006). Sodium-coupled glucose cotransporters contribute to hypothalamic glucose sensing. Diabetes 55, 3381–3386. doi: 10.2337/db06-0531
Paes-Leme, B., Dos-Santos, R. C., Mecawi, A. S., and Ferguson, A. V. (2018). Interaction between angiotensin II and glucose sensing at the subfornical organ. J. Neuroendocrinol. 30:e12654. doi: 10.1111/jne.12654
Perez, C. A., Huang, L., Rong, M., Kozak, J. A., Preuss, A. K., Zhang, H., et al. (2002). A transient receptor potential channel expressed in taste receptor cells. Nat. Neurosci. 5, 1169–1176. doi: 10.1038/nn952
Ren, X., Zhou, L., Terwilliger, R., Newton, S. S., and De Araujo, I. E. (2009). Sweet taste signaling functions as a hypothalamic glucose sensor. Front. Integr. Neurosci. 3:12. doi: 10.3389/neuro.07.012.2009
Sainz, E., Cavenagh, M. M., Lopezjimenez, N. D., Gutierrez, J. C., Battey, J. F., Northup, J. K., et al. (2007). The G-protein coupling properties of the human sweet and amino acid taste receptors. Dev. Neurobiol. 67, 948–959. doi: 10.1002/dneu.20403
Shindo, Y., Miura, H., Carninci, P., Kawai, J., Hayashizaki, Y., Ninomiya, Y., et al. (2008). G alpha14 is a candidate mediator of sweet/umami signal transduction in the posterior region of the mouse tongue. Biochem. Biophys. Res. Commun. 376, 504–508. doi: 10.1016/j.bbrc.2008.09.035
Sohn, J. W., Elmquist, J. K., and Williams, K. W. (2013). Neuronal circuits that regulate feeding behavior and metabolism. Trends Neurosci. 36, 504–512. doi: 10.1016/j.tins.2013.05.003
Sohn, J. W., and Ho, W. K. (2020). Cellular and systemic mechanisms for glucose sensing and homeostasis. Pflugers Arch. 472, 1547–1561. doi: 10.1007/s00424-020-02466-2
Spanswick, D., Smith, M. A., Groppi, V. E., Logan, S. D., and Ashford, M. L. (1997). Leptin inhibits hypothalamic neurons by activation of ATP-sensitive potassium channels. Nature 390, 521–525. doi: 10.1038/37379
Spanswick, D., Smith, M. A., Mirshamsi, S., Routh, V. H., and Ashford, M. L. (2000). Insulin activates ATP-sensitive K+ channels in hypothalamic neurons of lean, but not obese rats. Nat. Neurosci. 3, 757–758. doi: 10.1038/77660
Su, Z., Alhadeff, A. L., and Betley, J. N. (2017). Nutritive, post-ingestive signals are the primary regulators of AgRP neuron activity. Cell Rep. 21, 2724–2736. doi: 10.1016/j.celrep.2017.11.036
Tizzano, M., Dvoryanchikov, G., Barrows, J. K., Kim, S., Chaudhari, N., and Finger, T. E. (2008). Expression of Galpha14 in sweet-transducing taste cells of the posterior tongue. BMC Neurosci. 9:110. doi: 10.1186/1471-2202-9-110
Treesukosol, Y., Smith, K. R., and Spector, A. C. (2011). Behavioral evidence for a glucose polymer taste receptor that is independent of the T1R2+3 heterodimer in a mouse model. J. Neurosci. 31, 13527–13534. doi: 10.1523/JNEUROSCI.2179-11.2011
Wong, G. T., Gannon, K. S., and Margolskee, R. F. (1996). Transduction of bitter and sweet taste by gustducin. Nature 381, 796–800. doi: 10.1038/381796a0
Yang, X. J., Kow, L. M., Funabashi, T., and Mobbs, C. V. (1999). Hypothalamic glucose sensor: similarities to and differences from pancreatic beta-cell mechanisms. Diabetes 48, 1763–1772. doi: 10.2337/diabetes.48.9.1763
Yarmolinsky, D. A., Zuker, C. S., and Ryba, N. J. (2009). Common sense about taste: from mammals to insects. Cell 139, 234–244. doi: 10.1016/j.cell.2009.10.001
Zhang, Y., Hoon, M. A., Chandrashekar, J., Mueller, K. L., Cook, B., Wu, D., et al. (2003). Coding of sweet, bitter, and umami tastes: different receptor cells sharing similar signaling pathways. Cell 112, 293–301. doi: 10.1016/S0092-8674(03)00071-0
Keywords: taste receptors, G-protein coupled receptor, knock-in mouse, immunohistochemistry, neurochemistry
Citation: Jang JH, Kim HK, Seo DW, Ki SY, Park S, Choi S-H, Kim D-H, Moon SJ and Jeong YT (2021) Whole-Brain Mapping of the Expression Pattern of T1R2, a Subunit Specific to the Sweet Taste Receptor. Front. Neuroanat. 15:751839. doi: 10.3389/fnana.2021.751839
Received: 02 August 2021; Accepted: 04 October 2021;
Published: 28 October 2021.
Edited by:
James Joseph Chrobak, University of Connecticut, United StatesReviewed by:
Daisuke Kohno, Gunma University, JapanPaolo De Girolamo, University of Naples Federico II, Italy
Copyright © 2021 Jang, Kim, Seo, Ki, Park, Choi, Kim, Moon and Jeong. This is an open-access article distributed under the terms of the Creative Commons Attribution License (CC BY). The use, distribution or reproduction in other forums is permitted, provided the original author(s) and the copyright owner(s) are credited and that the original publication in this journal is cited, in accordance with accepted academic practice. No use, distribution or reproduction is permitted which does not comply with these terms.
*Correspondence: Yong Taek Jeong, anlvbmd0YWVrQGtvcmVhLmFjLmty; Seok Jun Moon, c2ptb29uQHl1aHMuYWMua3I=
†These authors have contributed equally to this work