


- 1 Center for Neuroscience, Swammerdam Institute for Life Sciences, University of Amsterdam, Amsterdam, Netherlands
- 2 Departments of Vision and Cognition/Neuromodulation and Behaviour, Netherlands Institute for Neuroscience, Amsterdam, Netherlands
- 3 Division of Pharmacology, Utrecht Institute for Pharmaceutical Sciences, Utrecht University, Utrecht, Netherlands
- 4 Department of Biophysics, Donders Institute for Brain, Cognition and Behaviour, Radboud University Nijmegen, Nijmegen, Netherlands
- 5 Biomedical Signals and Systems, MIRA, University of Twente, Enschede, Netherlands
Divisive normalization models of covert attention commonly use spike rate modulations as indicators of the effect of top-down attention. In addition, an increasing number of studies have shown that top-down attention increases the synchronization of neuronal oscillations as well, particularly in gamma-band frequencies (25–100 Hz). Although modulations of spike rate and synchronous oscillations are not mutually exclusive as mechanisms of attention, there has thus far been little effort to integrate these concepts into a single framework of attention. Here, we aim to provide such a unified framework by expanding the normalization model of attention with a multi-level hierarchical structure and a time dimension; allowing the simulation of a recently reported backward progression of attentional effects along the visual cortical hierarchy. A simple cascade of normalization models simulating different cortical areas is shown to cause signal degradation and a loss of stimulus discriminability over time. To negate this degradation and ensure stable neuronal stimulus representations, we incorporate a kind of oscillatory phase entrainment into our model that has previously been proposed as the “communication-through-coherence” (CTC) hypothesis. Our analysis shows that divisive normalization and oscillation models can complement each other in a unified account of the neural mechanisms of selective visual attention. The resulting hierarchical normalization and oscillation (HNO) model reproduces several additional spatial and temporal aspects of attentional modulation and predicts a latency effect on neuronal responses as a result of cued attention.
1. Introduction
When performing a demanding task, attention allows us to focus on relevant aspects and ignore most peripheral distracting information. By filtering out irrelevant sensory input in favor of relevant information, attention facilitates an efficient use of the brain’s limited processing capacity. There are many models that describe the possible mechanisms of top-down attentional modulation at a neuronal level, but two classes of recent models are especially prominent. The first class encompasses a broad range of divisive normalization models (e.g., Reynolds and Heeger, 2009; Lee and Maunsell, 2009; Carandini and Heeger, 2011). Such models posit that neuronal populations’ firing rates depend on bottom-up sensory input, a competitive interaction (surround-inhibition) and attentional modulation. The second class of models concerns the role of oscillatory synchronizations of neuronal activity within specific frequency bands and its association with attention (Fries et al., 2001).
The normalization and neuronal synchronization models are distinct theories, but they are not mutually exclusive. While the normalization model focuses on a functional characterization of the effects of attention, the neuronal synchronization model describes a neural correlate of attention without extensively going into the functional implications. Since these models are complementary in many respects, a combination of these theories into a single framework might provide a more comprehensive description of attentional processes than may be obtained from either model alone. Here, we unify these distinct attention models into a single framework of selective visual attention. To this end, we first describe the key aspects of both classes of models and highlight where they complement each other. Next, we demonstrate how a hierarchical normalization model that incorporates oscillation theories of inter-neuronal communication can reproduce both spatial and temporal aspects of attention that have been established experimentally.
2. Neural Correlates of Attention
Ever since the 1970s, numerous studies have found attentional modulation of neuronal responses in the visual cortex (e.g., Moran and Desimone, 1985; Sato, 1988; Motter, 1993; Luck et al., 1997; Recanzone and Wurtz, 2000; for a review, see Posner and Gilbert, 1999). Early studies measured neural activity in the parietal lobe of alert monkeys (e.g., Lynch et al., 1977; Bushnell et al., 1981; for a review, see Bisley and Goldberg, 2010), while later research has confirmed that attentional modulation is ubiquitous all over the visual cortex (for a review, see Treue, 2003). Areas higher in the cortical hierarchy, such as middle superior temporal cortex (MST) or ventral intraparietal cortex (VIP), show more attentional modulation than lower areas, such as primary visual cortex (V1) or middle temporal cortex (MT; Figure 1). However, it has recently been suggested that top-down attentional modulation, however small, can already be observed in areas as synaptically close to the retina as the lateral geniculate nucleus (LGN; McAlonan et al., 2008). Furthermore, it is now well-established that the increases in firing rates due to attention are highly correlated with behavioral performance (e.g., Bushnell et al., 1981; Treue and Maunsell, 1996; Cohen and Maunsell, 2010). Inspired by the wealth of neurophysiological data that has become available in recent years, several distinct computational mechanisms have been proposed to explain different effects of attention on neuronal firing rates (Itti and Koch, 2001; Hamker, 2003; Spratling and Johnson, 2004; Deco and Rolls, 2005; Maunsell and Treue, 2006). Examples of such mechanisms are response gain (McAdams and Maunsell, 1999; Treue and Martínez-Trujillo, 1999) and contrast-gain enhancement (Martínez-Trujillo and Treue, 2002), sharpening of neuronal tuning curves (Womelsdorf et al., 2006a), and competitive interactions between multiple simultaneously presented stimuli (Desimone and Duncan, 1995; Reynolds et al., 1999; Zhang et al., 2011).
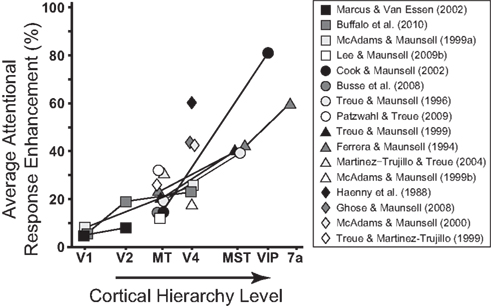
Figure 1. The strength of attentional modulation increases with level of cortical hierarchy (extended version of Figure 12 in Cook and Maunsell, 2002). The different symbols represent the different studies used in the meta analysis. Lines between two symbols indicate that these data are from the same study.
Response gain enhancement is the most straightforward modulation of a neuron’s firing rate as a function of stimulus contrast: when attention is directed to a visual stimulus, the neuron simply fires more than when attention is directed away (McAdams and Maunsell, 1999; Treue and Martínez-Trujillo, 1999; Treue, 2001). On the other hand, some studies have also found that attention can lead to a contrast-gain enhancement (Martínez-Trujillo and Treue, 2002). With contrast-gain enhancement, a neuron responds to an attended visual stimulus as if the stimulus’ contrast is higher than it actually is rather than by simply increasing its firing rate to any attended stimulus. The distinction between response gain and contrast-gain mechanisms of attention essentially comes down to whether attention multiplies a neuron’s contrast-response function by a particular factor (response gain) or whether it shifts it horizontally (contrast-gain).
Evidence for competitive interactions has been reported by Reynolds et al. (1999) in a study where two visual stimuli were presented either in isolation or simultaneously as a pair. When the two stimuli were presented simultaneously and attention was directed away from the stimuli, the recorded neuronal response magnitude was in-between the responses to either stimulus alone. However, when attention was directed toward one of the two simultaneously presented stimuli, the neuronal response closely resembled the response that was evoked by the attended stimulus in isolation (Figure 2). A more recent study reports similar results on a neuronal population level in the inferior temporal cortex (Zhang et al., 2011). These authors observed that information about an object’s identity and location is greatly reduced when the object is simultaneously presented with other stimuli, compared to when that object is presented in isolation. Directing attention toward the object, however, effectively restored its neuronal representation. While the idea that competitive interactions within the visual cortex are involved in attention has been around for a while (Anderson and Van Essen, 1987), it has recently regained a lot of interest due to its implementation in several attention models (i.e., Spratling and Johnson, 2004; Deco and Rolls, 2005). Mutual inhibition between neuronal populations, for instance, is a core concept in the influential normalization model of attention published by Reynolds and Heeger (2009).
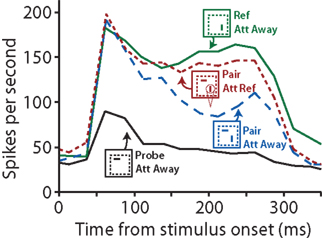
Figure 2. When presented with two visual stimuli simultaneously, attention can lead to changes in firing rates that can be explained with competitive interactions between the neuronal populations coding for either stimulus. Responses of one neuron in area V2 are plotted as a function of time (ms) after stimulus onset. The solid lines show the neuron’s response to either stimulus alone when attention is directed away (Att Away), with the black line representing the neuron’s response to the probe (horizontally oriented, non-preferred stimulus) and the green line representing the response to the reference (vertically oriented, preferred stimulus). When both stimuli are presented simultaneously (dotted lines), the neuron’s response magnitude is intermediate. Directing attention (indicated by the cone symbol) to the reference stimulus (Att Ref, in red) shifts the neuron’s response toward to reference-only response (green) compared to when attention is directed away (blue). After Figures 6A,B from Reynolds et al. (1999).
While changes in response magnitude are often observed as a result of directed attention, there are many other ways in which attention can enhance stimulus processing. Mitchell et al. (2009) observed that the response variability of neurons that represented an attended stimulus was lower than of neurons coding for unattended stimuli. Moreover, simultaneous recordings from pairs of neurons demonstrated that attention not only increased a neuron’s firing rate, but also dramatically decreased the spike-to-spike coherence. With the total information entropy (defined as the maximum amount of information in the system) within a neuronal population staying constant, a decrease in noise correlation will typically increase the amount of information available to encode the stimulus (see Averbeck et al., 2006; for a review on information theory and neural correlations). Comparing the effects of attention on increased firing rate and decreased correlations Mitchell et al. (2009) found that the rate increase due to attention would raise the signal-to-noise ratio (SNR) by 10%, while the attention-driven decrease in correlation increased the SNR by 39%.
Beside the aforementioned effects of attention on neuronal spiking, research in the last decade has revealed that top-down attention is also highly correlated with an increased power of neuronal oscillations in the gamma frequency band (Fries et al., 2001; Salinas and Sejnowski, 2001; Lakatos et al., 2008; Van Elswijk et al., 2010; Womelsdorf et al., 2006b, 2007). In one of these studies, local field potentials and multi-unit activity in monkey visual area V4 were simultaneously recorded while monkeys detected a subtle color change in one of two visual stimuli (Womelsdorf et al., 2006b). Importantly, the monkey directed its attention either toward the stimulus that changed or toward the other stimulus that did not change in color. With this paradigm, the authors observed large effects of attention on the extent to which spiking events occurred in coherence with gamma-band (40–72 Hz) oscillations of the local field potential. Moreover, when spike-field coherences were compared between the 25% of trials with the fastest behavioral responses and the 25% of trials with the slowest responses it became clear that when the target stimulus was in the neuron’s receptive field, fast responses were generally accompanied by stronger spike-field coherence in the gamma-band than slow responses. This pattern was reversed when it was the distractor stimulus that evoked the neuron’s response. These observations strongly indicate a relationship between behavior and the extent to which stimulus-evoked action potentials are synchronized with neural oscillations.
In the next two sections we will first describe some key aspects of both the normalization and the neural synchronization models of attention. Finally, we will demonstrate where the two types of models are complementary and how they can be combined into a unified framework of visual cortical attention mechanisms that reproduces both spatial and temporal aspects of attention.
3. The Normalization Model of Attention
Recently, both Reynolds and Heeger (2009) and Lee and Maunsell (2009) independently published sophisticated models of visual attention, based on the notion that attention modulates the strength of normalization processes. Computationally and conceptually their models are rather similar. However, the Lee and Maunsell model only predicts response gain changes with attention and not contrast-gain changes, whereas the Reynolds and Heeger model predicts both. We will therefore conform to the conventions used in the Reynolds and Heeger model and discuss only this model in detail for the remainder of this paper. The Reynolds and Heeger normalization model can simultaneously describe neuronal population responses for the entire retinal space and a range of different stimulus characteristics. This way the model incorporates both spatial and feature-based attention, but in an abstract way that does not directly relate to neurophysiological correlates. While this approach has some disadvantages for the neuronal interpretation of the computational operations, it comes with the great advantage of having an intuitive and simple computational model that can explain a host of neurophysiological observations remarkably well on a phenomenological level. For explanatory purposes, we limit our current description of the model to comprise a single spatial and a single feature preference dimension (orientation).
The divisive normalization model of attention (Reynolds and Heeger, 2009) posits an initial bottom-up activation or “stimulus drive” of neuronal populations that is modulated by attentional processes (represented by the “attention field”) to produce an “excitatory drive” so that attending a stimulus enhances the response of the neurons that are tuned to that stimulus. Simultaneously, an inhibitory competitive interaction, or “suppressive drive,” arises from a combination of the excitatory drive with a “suppressive field” that simulates lateral inhibition (Figure 3). The final neuronal population response depends on the orientation preferences and the receptive field (RF) center locations and is calculated by dividing the excitatory drive by the suppressive drive. This division effectively normalizes the response magnitude of individual neurons to that of the population as a whole, hence the name “normalization model.”
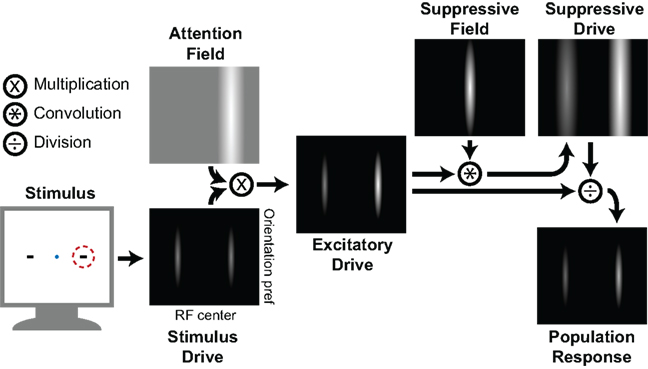
Figure 3. The divisive normalization model of attention (Reynolds and Heeger, 2009). When two stimuli are presented and one is attended (dotted red circle), this leads to an activation of neurons that have an appropriate receptive field (RF) and are tuned to the orientation that corresponds with the stimulus. This bottom-up activation (Stimulus Drive) is depicted along the two stimulus properties, with each pixel representing a single neuron and brightness representing the strength of activation. Paying attention to a certain spatial location (corresponding to the red circle in the left panel) creates an Attention Field that is selective for the RF center dimension, but not for the orientation preference dimension. Multiplying the Attention Field point-by-point with the Stimulus Drive yields an Excitatory Drive, which is then convolved with a Suppressive Field (a Gaussian representing the lateral inhibition) to produce the Suppressive Drive, or surround-inhibition. Finally, dividing the Excitatory Drive by the Suppressive Drive yields a normalized Population Response, with the attended stimulus having a larger output than the unattended stimulus. Figure adapted from Reynolds and Heeger (2009).
To summarize, the normalization model explicitly splits the population response in three components: (1) a stimulus drive or bottom-up activation from sensory stimulation; (2) an attention field or gain modulation that is selective for certain ranges of stimulus features, such as spatial location or stimulus orientation; and (3) a suppressive drive or surround-inhibition through neurons that are similarly tuned for a particular feature, e.g., neurons that have overlapping RF locations. Note however, that the suppressive drive is essentially a multiplication of the attention field and stimulus drive. It could therefore be argued that the output of the normalization model depends solely on the attention field and the stimulus drive, and that the suppressive drive represents an internal process. Mathematically, the normalization model can be expressed as the following equation:
In this equation, R(x, θ) is the population firing rate as a function of x (the receptive field (RF) center) and of θ (the orientation preference); the RF center and orientation preference are the two dimensions along which the neuronal populations are described. The firing rate R depends on the stimulus drive E(x, θ) multiplied by the attention field A(x, θ). The attention field has a value of one everywhere except for a small region at the site of directed attention, where the gain is larger than one. The firing rate also depends inversely on the suppressive drive S(x, θ) and on a constant σ that determines the neuron’s contrast-gain. To simulate spiking behavior, |.|T performs a rectification with respect to spiking threshold T. While the attention field and stimulus drive both depend on input variables of the model, σ and T are constants. The suppressive drive S(x, θ) simulates a competitive interaction between neurons that are similar in RF center and orientation preference by averaging over these dimensions with a convolution of the suppressive field s(x, θ) and the stimulus drive modulated by attention (A(x, θ)E(x, θ)). It is expressed as
Here, s(x, θ) is the suppressive field, i.e., the extent of pooling over RF center (x) and stimulus preference (θ). A(x, θ)E(x, θ) is the neuronal activity (E(x, θ)) modulated by attention (A(x, θ)) – or excitatory drive in Figure 3 – and * is the convolution. The suppressive field s(x, θ) can be made arbitrarily large to simulate general inhibition without spatial specificity, or arbitrarily small to remove inhibitory effects. An intermediate value (as is used in all simulations) allows for spatially selective inhibitory interactions.
In addition to its dependencies on x and θ, the response can be described in terms of stimulus contrast c. Adding this additional variable to the original equation; the calculation of the population response becomes:
In this equation, the contrast-response function of any single neuron within this simulated population (i.e., the population response at a single point (x; θ)) is given by
where α is a response gain constant that determines the neuron’s response at saturating contrast (r(c) ≈ α when c ≫ σ). This response gain constant is predominantly determined by the distance between the neuron’s preferred location and orientation and the actual location and orientation of the stimulus. A neuron whose preferred orientation is orthogonal to the stimulus’ orientation will have a small α, while a neuron whose preferred orientation perfectly matches the stimulus’ orientation will have a large α.
Reynolds and Heeger note that the rectification (|.|T) can approximate a power law to produce a contrast-response function that more closely resembles contrast-response functions observed from electrophysiological recordings. In this case, the contrast c gets an exponent (cn); however, the original authors also state that they performed all simulations with an exponent of 1. For simplicity, and to remain more truthful to the original description of the normalization model, we will also use an exponent of 1 in all further descriptions and simulations.
Simulations with the normalization model show that it can accurately simulate a range of observed phenomena (Reynolds and Heeger, 2009). Figure 2, for instance, demonstrates how attending to one of two stimuli changes the activity pattern of neurons selective to such a stimulus in a way that resembles the activity patterns that are observed when the attended stimulus is presented in isolation. Apart from this simulation of competitive interactions, the normalization model can also reproduce the experimentally demonstrated shifts and shrinkages in the tuning curves of visual neurons (Womelsdorf et al., 2006a; for another computational model that also reproduces shifts and shrinkages in RF size in V4, see Hamker and Zirnsak, 2006). A remarkable property of the normalization model is that it offers a possible explanation for why attentional effects on contrast-response functions sometimes show a contrast-gain enhancement, and sometimes a response gain enhancement. Simulations with the normalization model suggest that this is due to the relative sizes of the stimulus and attention field. When the attention field is large compared to the stimulus size, the modulation is predominantly a contrast-gain enhancement. If, however, the attention field is small compared to the stimulus size, the effect seems to be predominantly response gain. These specific predictions have recently been confirmed with a paradigm that used the spatial certainty of visual stimuli to modulate the size of the attention field (Herrmann et al., 2010).
The concept of an attention field is reminiscent of previously proposed theoretical constructs like a saliency map (Itti and Koch, 2001) or a priority map (Bisley and Goldberg, 2010) and their neurophysiological representations in parietal and prefrontal cortex (Gottlieb et al., 1998; Bisley and Goldberg, 2010; Bisley, 2011). A saliency map represents the relative strength of bottom-up stimulus features that are used to guide attention (Koch and Ullman, 1985; Itti and Koch, 2001). A priority map, on the other hand, combines the bottom-up saliency map with top-down endogenous factors for the selection of objects for eye movements or attention (Serences and Yantis, 2006; Bisley and Goldberg, 2010). The abstract concept of an attention field in the normalization model can perhaps best be seen as the collection of these top-down influences in the priority map. As such it more or less constitutes a top-down counterpart to the bottom-up saliency map. Since their initial reception, the concepts of saliency and priority maps have become common practice in guided visual search models (Itti and Koch, 2001; Bisley and Goldberg, 2010; Bisley, 2011). Enhanced salience of certain objects prioritizes these objects in serial search tasks so that the object that is most likely to be the target will be attended first. In a similar way, an attention field can enhance the firing rate of neurons corresponding to certain object features (orientation) and cause an early bias in neuronal activation in favor of stimuli that correspond to the template represented in the attention field.
In conclusion, the normalization model offers a useful tool to describe a range of attentional effects and their dependence on stimulus contrast and spatial attention. The normalization model’s versatility in this regard is unequaled by other models of attention and its conceptual simplicity makes it appealingly elegant. However, the fairly abstract nature of an “attention field” limits its use to a mainly theoretical framework. Another trade-off in favor of simplicity is the model’s inability to produce attentional effects that change over time (unlike for example Deco and Rolls, 2005; Hamker, 2005; Hamker and Zirnsak, 2006). This means that while the normalization model may be a step in the right direction of explaining multiple attentional effects with a single framework, the synthesis is clearly not completed yet. A final issue is that the model only describes attentional effects in terms of neuronal firing rate, while an increasing amount of neurophysiological evidence suggests that synchronization of oscillatory activity is very important for attentional processes as well.
4. Neuronal Synchronization Models of Attention
Strong correlations have been found between attention and enhanced gamma-band synchronization (Fell et al., 2003; Bichot et al., 2005; Womelsdorf and Fries, 2007). Gamma-band synchronizations are also known to be modulated by oscillations in other frequency ranges, such as the theta-cycle oscillations that are implicated in the shifting of attention (Fries, 2009), and delta-wave oscillations (Lakatos et al., 2008). The underlying network dynamics of gamma oscillations can be simplified by supposing a local neural network that contains both excitatory and inhibitory neurons, a common scenario in many areas of human cortex. In this network, excitatory pyramidal cells will have axons that go both to distant output regions and to local inhibitory interneurons. When the excitatory neurons are activated, these interneurons get activated and in turn inhibit the pyramidal cells until they fall almost silent. Because of this inhibition of the excitatory cells, the initial drive on the interneurons is also reduced and their inhibition becomes weaker. As a result, the pyramidal neurons are again free to fire action potentials and begin driving the inhibitory neurons, initiating a new cycle (Tiesinga et al., 2004; Fries et al., 2007). One important effect of this oscillatory behavior is that information coded by spike rates is converted to information coded by spike times. Under the assumption that all excitatory neurons receive a similar amount of inhibition, the excitatory neurons that receive the strongest depolarizing input will be the first to fire action potentials during the cycle when inhibition from the interneurons starts to weaken. Consequently, the extent of an excitatory neuron’s depolarizing drive is converted into the moment of spiking relative to the phase of the cycle period. This means that as the excitatory drive of a neuron increases, so does its ability to overcome inhibition earlier in the cycle (Fries et al., 2007).
Support for this hypothesis comes from measurements in the visual cortex of anesthetized cats (König et al., 1995). If the activation strength of a neuron determines the phase at which a neuron fires in a gamma cycle, then the relative activation strengths between two neurons should determine the relative phases at which they fire. König and colleagues recorded multi-unit activity (MUA) from the primary visual cortex. Pyramidal cells possess asymmetric dendritic trees and are more numerous and bigger than inhibitory interneurons. As a consequence, they produce larger extracellular potentials and they will dominate the activity that is recorded in studies such as the one of König and colleagues. The electrodes were placed close enough to each other to allow the receptive fields of different MUAs to overlap, yet distant enough for each MUA have a slightly different selectivity to stimulus features such as orientation. Neurons at both electrodes were thus driven by the same stimulus, but their degree of activation depended on the stimulus orientation (König et al., 1995). Both MUAs showed rhythmic gamma-band synchronization, but the phase difference between the two populations depended on the stimulus orientation. When a certain orientation activated one population morethan the other, the population with the stronger excitatory drive would fire earlier in the gamma cycle.
One may ask whether it is really relevant that spike rate coding gets transformed into a temporal-position coding. After all, strongly depolarized neurons will still have higher spiking rates than weakly depolarized neurons, whether they are synchronized to a gamma cycle or not. Recent studies, however, indicate that the timing of spikes is indeed important. It gives rise to the well-known spike-timing dependent Hebbian plasticity rule (Bi and Poo, 1998); and forms the basis of a more recently suggested learning rule based on covariance, formulated to better correspond to observations of in vivo spike-timing dependent plasticity in V1 (Frégnac et al., 2010).
Moreover, the gamma cycle might provide a way in which pyramidal cells engage in winner-take-all processes (Olufsen et al., 2003; Börgers et al., 2005). Whenever a pyramidal cell fires, it activates local interneurons that send inhibitory signals back to the whole population of excitatory neurons. Because of this process, when the first few pyramidal cells have started firing action potentials, inhibition of all excitatory cells will start to increase. This makes it harder for pyramidal cells that have not yet fired to produce any spikes at all. Consequently, the phase position of spikes relative to their cycle period is an important indication of the amount of information they carry. In fact, it has been shown that the first 1–5% of the spikes that encode a stimulus contain most information and that the other 95% provide relatively little additional information (VanRullen and Thorpe, 2002). In this framework, attention could then control the extent with which rate-codes are transformed into time codes. Since the gamma cycle can convert a neuron’s depolarizing drive into the moment of spiking relative to the phase of the cycle period, an increase of the amplitude of oscillations (as is observed during directed attention) could increase the extent to which rate-coded information is transformed to temporally coded information.
Another possible function of neural oscillations is formulated in the communication-through-coherence (CTC) hypothesis (Fries, 2005). This hypothesis states that neuronal communication between populations is only efficient if these populations are oscillating in synchrony and prevented if their oscillatory cycles are asynchronous. This hypothesis is based on two observations. First, as we have seen in the preceding paragraph neuronal populations have the intrinsic property to produce oscillatory activity (Kopell et al., 2000; Tiesinga et al., 2001). Second, as a neuronal population goes through an oscillatory cycle, its excitability changes drastically. While small excitatory inputs might be enough to activate a neuron when its corresponding interneurons are silent, the same neuron may require an extremely large amount of excitatory input when it is receiving large hyperpolarizing currents from the interneuron population. Accordingly, every oscillation period has a limited temporal window for effective communication that opens and closes with the phases of the oscillatory cycle. This means that only phase-locked neuronal populations are able to influence each other’s firing patterns effectively; a hypothesis that has been verified with neural network modeling (Kremkow et al., 2010).
The CTC hypothesis is depicted in Figure 4 with three oscillating neuronal populations. While two of these populations are phase-locked, the third is not oscillating coherently with the other two. Effective communication is ensured by mutual activation of populations 1 and 2 (red and blue) during their peak excitability, while population 3 (green) is excluded from influencing that communication because of its misaligned oscillatory cycle. Experiments have shown that the probability of spike generation is indeed dependent on the relative phase in an oscillatory cycle when current is injected (Volgushev et al., 1998). Other recent studies provide additional support for the CTC hypothesis. The interaction strength of two neuronal groups, for instance, has been shown to depend on the phase and precision of their rhythmic synchronization (Womelsdorf et al., 2007). Furthermore, the modulation strength of a TMS pulse has been shown to depend on the beta oscillation phase of the stimulated neural tissue, which suggests that beta band synchronization (and possibly also gamma-band synchronization) entails a rhythmic gain modulation of neuronal input (Van Elswijk et al., 2010). Such a process could very well be the underlying mechanism of winner-takes-all mechanisms that have recently been found in posterior parietal cortex (Oleksiak et al., 2011).
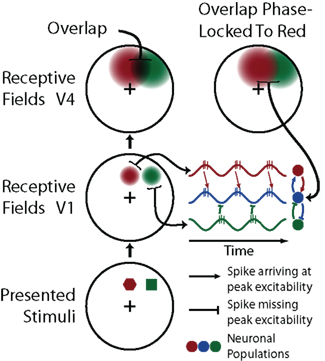
Figure 4. A schematic representation of the CTC hypothesis and its implications. This illustration shows three neuronal populations (red, green, and blue). There are two populations (red and green) that each connect to the third (blue), but only one (red) is synchronized to it via neuronal oscillations (middle right), while the other (green) is out-of-phase. Spikes from the synchronized population (red) arrive at their target population (blue) within the peak of excitability, while signals from the out-of-phase population (green) have no effect. Such phase-locking process could explain why higher cortical areas show larger attention effects. When two stimuli are simultaneously presented, the corresponding retinotopic regions in lower level visual cortex (e.g., V1) will overlap less than in higher level visual cortex (e.g., V4). Neurons in subsequent cortical areas that can in principle respond to either stimulus can only be phase-locked to input from one of the stimuli, leading to competitive interactions in the region of overlap.
Neuronal oscillations thus appear to be important binding mechanisms in neural networks. One could hypothesize that the activity of neurons that are tuned to (features of) an attended stimulus is modulated by attention through increased coherence of the neurons with their local gamma cycles. These gamma cycles can then translate the rate-coded information into temporally coded information and relay it from one neuronal assembly to another through phase-locked oscillations. The CTC hypothesis states that such process increases the likelihood of spikes arriving at the target population’s peak excitability, resulting in a higher efficiency of information transfer. Enhanced synchronization and conversion of a rate code to a temporal code also ensures a more stable signal propagation with higher fidelity through several groups of neurons in feedforward networks (Kumar et al., 2010). Consequently, in later cortical areas attended stimuli will be more strongly represented than unattended stimuli, because the latter do not receive the enhancement in spike rate and thereby a weaker conversion of rate code to temporal code. Furthermore, oscillations of neurons that encode unattended stimuli are misaligned with oscillating target populations, making it harder to get the signal registered at its destination. In the next section, we will develop a general framework in which normalization and oscillation mechanisms complement each other in explaining a broad range of experimentally demonstrated effects of visual attention.
5. A Hierarchical Normalization and Oscillation Model of Visual Attention
In the preceding paragraphs we have highlighted some of the key aspects of synchronization processes and normalization models of attention. The normalization model describes a wide range of attention-based phenomena, but its neural correlates remain relatively undefined. It also fails to reproduce any time-resolved attentional modulations and it does not describe the attention-based relationship between different visual cortical areas. Where the descriptive power of the normalization model ends, that of phase-locked oscillations begins. Gamma oscillations on the other hand cannot readily explain changes in contrast-response functions or receptive field structures, but they are an excellent candidate for the neural correlate of dynamic attentional processes. Moreover, expanding the normalization model with oscillation based functionality reproduces dynamic attentional effects over time and cortical areas. Not only are the synchronization framework and normalization model of attention not mutually exclusive, they are in fact surprisingly complementary. A unified framework that includes both theories can account for aspects of attention that neither model can account for by itself.
Neurons can be highly sensitive to changes in the correlations of their input, even when the input magnitudes remain constant (Salinas and Sejnowski, 2001). Synchronization processes can directly alter spike rates through such a mechanism, making it a potential candidate for the observed spike rate increases with attention. Synchronous oscillations also occur in spontaneous ongoing activity. When the appearance of a predictable stimulus is expected, the synchronization in ongoing oscillations can be enhanced by a top-down anticipatory signal, without any notable changes in firing rate (Riehle et al., 1997; for a review, see Engel et al., 2001; or Salinas and Sejnowski, 2001). This top-down enhancement of synchronization in the absence of stimuli strongly suggests that enhanced synchronization in the presence of stimuli truly represents an effect of directing attention toward the stimulus and is not merely a consequence of increased firing rates.
Since the normalization model does not describe attentional effects over time or different cortical areas it cannot directly account for the recent observation that an attentional enhancement in firing rates progresses backward along the visual cortical hierarchy from V4 via V2 to V1 (Buffalo et al., 2010). The attentional effects in this study were strongest and arose earliest in higher cortical areas (V4), less strong and slightly later in middle cortical areas (V2), and weakest and latest in primary visual cortex (V1). We will first expand the normalization model to enable the simulation of attentional effects over time and cortical areas without any reference to oscillatory mechanisms. This initial expansion will illustrate why it is necessary to also include the synchronization framework for our model to reproduce the experimental data.
Our model implements multiple cortical stages of visual processing that each contain a standard normalization model (Reynolds and Heeger, 2009). When two stimuli are presented simultaneously, information from both stimuli is propagated from the retina to LGN to V1 to V2 to V4. It is possible to model this information propagation using the normalization model by taking the population response of one area as input into the stimulus drive of another area. Using such a hierarchical cascade of four normalization models with their inputs and outputs linked to the outputs and inputs of their lower and higher cortical areas, it is possible to elicit a backward propagation of attentional modulation, similar to what was observed by Buffalo et al. (2010). For this to work, we also need a point of origin for the attentional effects. The frontal eye fields (FEF) are a good candidate for such a starting point, since stimulation of the FEF leads to enhancements in firing rates of neurons in V4 with corresponding retinal RF locations (Moore and Armstrong, 2003; Hamker and Zirnsak, 2006; Ekstrom et al., 2008). It has also been observed that attention increases spike-field coherence in the gamma-band frequency range (∼50 Hz) between FEF and V4, where Granger causality analysis suggests that the FEF are the origin for this long distance gamma-band phase-locking (Gregoriou et al., 2009). Finally, response properties of FEF neurons have been shown to resemble the characteristics of a priority map (Bichot and Schall, 1999). Together, these observations strongly suggest that the FEF are contributing to the process of directing attention, and might be of critical importance for attentional modulation in lower cortical areas. Since the aim here is not to explain how, why, or where attentional effects emerge, but rather to describe how attentional effects can evolve over time and cortical space, it should suffice to take the FEF as the arbitrary point of origin for an attention field in V4.
The input to any simulated cortical area in our model is an element-wise average of the output from its connected areas produced on the previous time step. Specifically, for LGN, V1, and V2, the input consists of a combination of the output from the Retina and V1; LGN and V2; and V1 and V4 respectively (Figure 5). Although it has been suggested that attention can increase stimulus discrimination by reducing noise correlations between neurons through a reduction of naturally occurring spike-spike coherences (Mitchell et al., 2009), we chose not to implement any spontaneous activity in our model in favor of simplicity. This means that the initial population response of any area at time t depends on the output of its hierarchically surrounding (input) areas at t − 1. At all time steps, the only area in our model that receives a fixed activation input map is the retina (representing a visual stimulus). All activity at higher level areas results from feedforward input from lower level areas and, slightly later, from feedback input from higher level areas. Because it takes one time step for feedforward input to travel to the next cortical level, the only area that shows activation at t = 1 is the LGN while bottom-up input first reaches V4 at t = 4. This temporal profile is in agreement with neurophysiological data (Schmolesky et al., 1998) showing that the earliest response to visual stimulation in any of the four areas in our model is seen in the LGN and the latest response in V4. Since top-down attention is thought to feed back from higher-order areas down to lower-order areas, we only provided the top level of our model (V4) with a non-uniform attention field. The bias in population response at V4 resulting from this non-uniform attention field then induces a similar bias, although of lesser magnitude, in the lower-order areas through feedback processes that again take time to be established. To quantify the strength of attentional modulation, we calculated the ratio between the population responses at the location of stimulus 1 and stimulus 2:
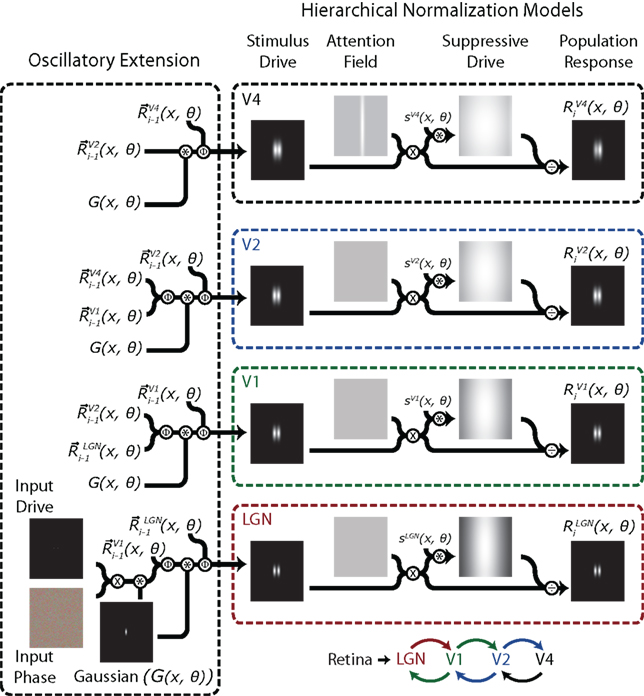
Figure 5. A schematic representation of the hierarchical normalization and oscillation (HNO) model of attention. The model consists of four different layers that all contain a complete normalization model (right). The stimulus drive of each area is formed by a combination of the population responses from the neighboring areas during the previous iteration. Calculation of the population response R(x, θ) from the stimulus drive occurs within separate unaltered normalization models. The first step of the model combines the input phase with the input drive, yielding a vector map with two small non-zero areas centered on the stimulus locations. This map is then convolved with a Gaussian and leads to activation in Stimulus Drive of LGN. The normalization model (see Figure 3) then outputs a population response which spreads to higher areas on subsequent iterations. Only V4 has a non-uniform attention field, so attentional modulation only occurs after bottom-up activation has reached V4. The biased output of V4 is then relayed back to lower cortical areas where it creates attention-driven biases at each of these areas. The connection diagram is shown in the lower right of the figure. A more complete description of the Oscillatory Extension is given in the text. Encircled x indicates multiplication; encircled * indicates convolution; encircled ÷ indicates division; and encircled Φ indicates the calculation of vector means, as described in the text.
The magnitude of this attention effect is shown for the first fifty time step iterations in Figure 6E. It is clear that the moment of earliest attentional modulation occurs later at lower areas and that this effect is also weaker there. After the initial onset, the attention effect slowly increases for several more iterations. However, the activation patterns (represented in Figures 6A,C as a horizontal cross-section through the activity map) evoked by stimulus 1 are indistinguishable from the activation patterns evoked by stimulus 2 because they blur together into a single activity blob at higher cortical areas. This degeneration of stimulus discriminability gets stronger over time. After the fourth iteration the activation pattern in V2 still has two separable peaks (Figure 6C, dotted lines), but at the fiftieth iteration only a single peak remains (Figure 6C, solid lines). It would not be very useful for attention to enhance a response at the cost of losing the discriminative power to distinguish between stimuli, suggesting that there must be an additional mechanism that avoids signal degradation and keeps the activation patterns evoked by stimulus 1 separate from those evoked by stimulus 2.
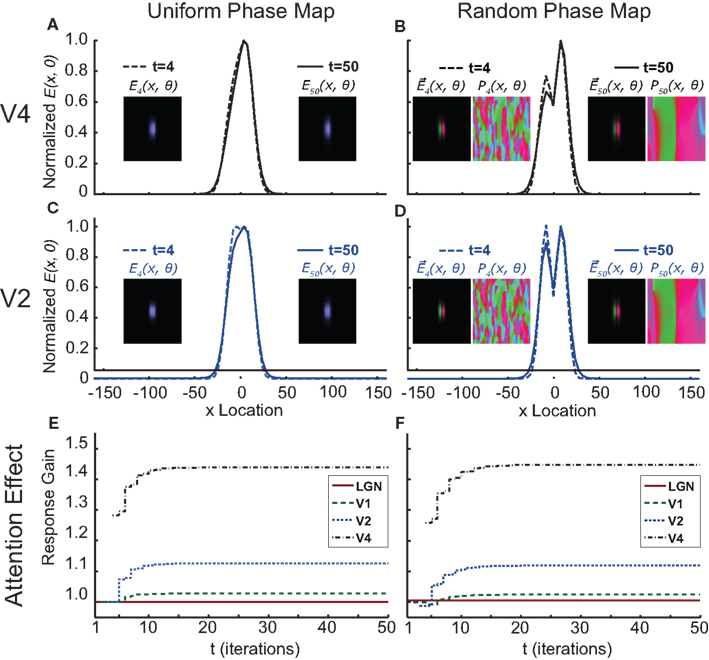
Figure 6. Output of the hierarchical normalization and oscillation (HNO) model of attention. On the left-hand side (A,C,E) show the model’s outputs when the phase maps are uniform (i.e., without phase-locking effects), (A,C) show the activity maps (E(x, θ)) of V4 (A) and V2 (C) at iterations 4 and 50, where the line-plots represent a horizontal cross-section through the activity map over preferred stimulus location (x Location) at the optimal stimulus orientation (þeta = 0). These activity patterns demonstrate that at t = 4 (dotted lines), when the attentional modulation only present in V4 has not yet back-propagated to lower areas, there is a bimodal distribution of response magnitude at V2, while the response at V4 has already degenerated into a skewed unimodal distribution. At the steady-state (t = 50), this discriminability is also lost at V2 [(C); solid line)]. (E) Shows the progression of the attention effect over time for the four simulated cortical areas. When the same simulation is run with randomized phase maps [0 − 2π] (B,D,F), a clear bimodal distribution can be observed in both V4 (B) and V2 (D); and both in an early phase of the simulation (t = 4; dotted lines) and at the steady-state (t = 50; solid lines). Also visible is that the phase maps (P(x, θ)) can be highly fragmented at the start of the simulation, but will converge to a highly structured bimodal division; where one half of the phase map is dominated by one stimulus, and the other half is dominated by the other. Note that adding a randomized phase map to the cascading normalization model does not qualitatively change the size, spread or temporal structure of the attentional effect [compare (E,F)]. Colors in the phase map are calculated as follows:
This is where the neuronal synchronization framework offers a solution. Without phase maps that represent the phase of ongoing oscillations to which a neuron’s activity is locked, each individual neuron – depicted in our model with a single pixel – is driven by input from both neuronal populations that respond to stimulus 1 and populations coding for stimulus 2. Any neuron whose selectivity is in-between these two populations in terms of receptive field location and orientation preference will then receive additive excitatory signals from both populations. In effect, the resulting activity level of neurons as measured over the receptive field location dimension will resemble the addition of two Gaussian distributions centered at the locations of the two stimuli. However, when we introduce a phase map and assume that the two populations code for the competing stimuli with opposite phases, a neuron that is similarly driven by inputs from both populations will show an activity close to zero. In other words, the overlap between the two Gaussian distributions becomes subtractive instead of additive, thereby reducing the activation level for neurons that are in-between the two driving populations. The amount to which the overlap resembles either subtraction or addition could then depend on the relative phase difference between the two driving populations; a difference of 180° will result in pure subtraction of overlap, while a difference of 0° will cause pure addition.
We implemented this phase-locking extension in the following computational way in our extended model. The input into each normalization model (or hierarchical stage) does not only contain a measure of response magnitude (E(x, θ); stimulus drive in Figure 3), but also of the oscillatory phase of the activity (P(x, θ)). Multiplying the phases in P(x, θ) point-by-point with the activation levels in E(x, θ) yields a matrix of vectors, where E(x, θ) gives the vector magnitude and P(x, θ) gives the vector angle. Therefore, for each iteration i, we can now define a phase-locked stimulus drive as follows:
The activity at any cortical area depends partly on the area’s own previous activation and its received input. Therefore, the phase-locked stimulus drive is computed every iteration by taking the mean of the phase-locked population response from the previous iteration and the current phase-locked input :
Since both and are matrices where each element is a vector with a magnitude and an angle, a simple arithmetic mean cannot be used. To compute the mean over the values in circular angle dimension P(x, θ), the operator deconstructs the elements in and into their mean sine and cosine components:
These mean horizontal and mean vertical components can then be transformed back to polar coordinates to get the mean magnitude and mean angle:
where
Furthermore, for any cortical area (i.e., V2) the mean input matrix from Eq. 7 is a weighted mean of the phase-locked population responses from its feedforward input (i.e., V1) and its feedback input (i.e., V4). The mean input is therefore computed using the same operator as previously described. Additionally, to simulate the spreading of activation, a convolution on the separate X and Y components for both input areas is computed using a two-dimensional Gaussian filter (σx = 3°; σθ = 10°). To reduce computation time of these convolutions, values lower than 5% of the peak were removed from the Gaussian.
When these computations are completed, the resulting stimulus drive (i.e., the vector magnitude map) is then inserted into an unaltered normalization model (Figure 3). The resulting population response Ri(x, θ) is then multiplied by the phase map Pi(x, θ), yielding a phase-locked population response that will serve as input for the neighboring areas in the next iteration.
Using this Hierarchical Normalization and Oscillation (HNO) model, we ran the same simulation as described above and displayed in Figures 6A,C,E, but now we randomized the phase map of the retinal input [0 − 2π]. As can be seen in Figures 6B,D,F; Movies S1 and S2 in Supplementary Material, the phase maps converge to a semi-stable steady-state, while the activation patterns induced by stimulus 1 and stimulus 2 remain quite distinct and easily separable. The first step of the HNO model (the lower left part of the model in Figure 5) is the multiplication of the phase map with the input drive at the level of the retina. This multiplication increases the vector magnitude at the location of the stimuli. When this map is convolved with a Gaussian to simulate the spreading of activation from the retina to LGN, the area around the stimuli is heavily biased to phase-lock to the random phases present at the locations of the stimuli. Since the left stimulus happened to be combined with a “green phase,” and the right stimulus with a “pinkish-red phase,” the activity map of LGN after the first iteration already shows a greenish blob around stimulus 1 and a reddish blob around stimulus 2. The fact that the phase map already shows a clear structure at this early point in time is an indication of the rapid transition of our model from the random initialization state to its steady-state.
Our HNO model does not change anything about the internal mechanics of the normalization model as described by Reynolds and Heeger (2009). Since we only couple the output of one level to the input of another, all internal properties of the model, such as its dependency on stimulus contrast and size of the attention field for determining a response gain vs. contrast-gain response function, are expected to remain unaltered. We did however optimize certain parameters to work with our extension such that its output resembles observations from electrophysiological recordings in terms of the size of attentional modulations at V1, V2, and V4 (Figure 1).
To validate that our HNO model indeed reproduces the same effects of attention as originally demonstrated by Reynolds and Heeger, we ran several additional simulations. First, we validated the contrast-gain vs. response gain dependency of the normalization model as originally presented by Reynolds and Heeger(2009; Figure 2). As can be seen in Figures 7A,B, the effect of attention in area V4 of our model resembles a contrast-gain mechanism for large attention fields (Figure 7A) and a response gain mechanism for small attention fields (Figure 7B). Simulations were run with the same parameters as in the previous simulations apart from the parameters under investigation (i.e., stimulus field; attention field and stimulus contrast). Stimulus contrast was implemented as a multiplication of the standard input into each cortical area by a stimulus contrast.
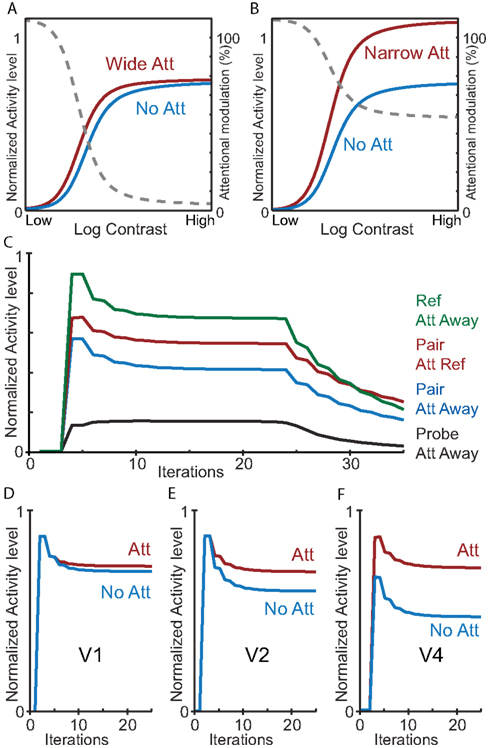
Figure 7. Simulations with the HNO model reproduce a broad range of attention effects. (A,B) Contrast dependency of a neuron responsive to a stimulus in V4 dependent on attention field size. (A) An attention field that is large (width of 30) compared to the stimulus (width of 3) produces a contrast-gain-like effect of attention similar to the original simulations by Reynolds and Heeger (2009), Figure 2. The gray dotted line shows the attentional modulation. (B) Identical to (A), but with an attention field that is small (width of 3) compared to the stimulus (width of 5) yielding a primarily response gain-like attention effect. (C) Simulation of a neuron’s response over time as measured by Reynolds et al. (1999), Figure 6. Green: response to the neuron’s preferred stimulus; red: response when presented a stimulus pair and attention directed to the preferred stimulus; blue: response when presented a stimulus pair and attention directed away; black: response when presented with the neuron’s non-preferred stimulus. (D,E,F) Simulation of progression of the attention effect as measured by Buffalo et al. (2010). Blue: response without attention; red: response with attention to the neuron’s preferred stimulus. The attentional modulation increases from V1 (D) via V2 (E) to V4 (F).
We also simulated the modulation of neuronal activity in the presence of competitive interactions induced by the presence of competing stimuli as reported by Reynolds et al. (1999; Figure 7C; compare with the original results in Figure 2); and the neuronal activity over time in V1, V2, and V4 as reported by Buffalo et al.(2010; Figures 7D,E,F). For these simulations we again used the same default model parameters used in all other simulations except for the crucial parameters under study (i.e., the presence and location of stimuli, and the location of attention). These simulations confirm that the HNO model reproduces the activity modulations for different experimental conditions as well as the evolution of neurophysiologically reported activity patterns over time.
Our HNO model incorporates feedback in an additive operation. While this is computationally straightforward, it is unclear whether this additive feedback is present in the brain. On the contrary, there is some evidence in favor of a more complex gain-control mechanism of feedback modulation (Hupé et al., 2001; Hamker, 2003, 2005; Hamker and Zirnsak, 2006). While the main aim of this paper is to present a proof of concept incorporating neuronal oscillations in a normalization model framework, it is important to validate that the simulation results do not depend on the specific type of feedback mechanism we used in the model. In addition to our simulation with additive feedback, we therefore ran all simulations again with a gain-control feedback mechanism that we implemented as:
where Cinh is an inhibitory constant and
In other words, the change in activity (dE(x, θ)/dt) depends on an effector-map minus the current activation level (E(x, θ)) multiplied by an inhibitory constant Cinh. This inhibitory factor ensures that the neuronal activity will return to baseline levels in the absence of input, while the effector-map describes the extent to which inputs drive the neuronal population. The effector-map depends on the excitatory input Ein(x, θ) and the difference in oscillatory phase Pdiff(x, θ) between the input and the target neurons. This phase difference map is calculated by taking the normalized cosine of the angular difference between the target and the input:
The new phase map is then calculated by taking the angle output of the vector means operator over the input weighted by the effector-map and the vector map of the previous iteration:
The repeated simulations with this alternative gain-control feedback implementation yielded no qualitative differences compared to the results obtained with the additive feedback mechanism (Figure A1 in Appendix). This validation demonstrates that the integration of neuronal oscillations in a normalization framework is robust under different feedback implementation regimes and does not critically depend on the details of the mechanism by which top-down signals influence lower level processing.
Finally, we performed a novel simulation to predict the effects of spatially cued attention. To this end we incorporated spontaneous activity into our model and observed that spatially cued attention creates a stable field of low activity at the attended site that induces multi-area phase-locking in the absence of stimuli. This pre-stimulus phase-locking results in a quicker build-up of response to the attended stimulus compared to when attention is only directed to the stimulus after it appears (Figure 8; Movies S3 and S4 in Supplementary Material). Neurophysiologically, this would translate to a reduction of response latency with spatially cued attention, an effect that is in line with the typically reported shortening of reaction times as a result of spatial cueing (Posner, 1980).
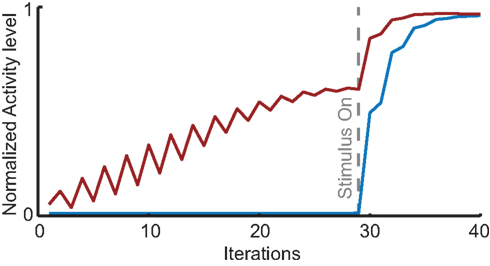
Figure 8. Simulations of the effect of cued attention performed with the HNO model in the presence of spontaneous activity. The results predict that the neuronal response to a stimulus presentation is faster and accompanied by pre-stimulus inter-areal phase-locking when attention is cued before the stimulus appears. Red line: neuronal activity in V4 at the location of a stimulus when that location receives cued attention prior to stimulus presentation at t = 28. Blue line: same situation, but without cued attention. Attention now only influences neuronal activity after stimulus-driven activity has reached V4. The gray dotted line indicates the moment when stimulus-driven activity reaches V4.
6. Discussion
While a change in spiking rate is an easy and straightforward way to measure attentional modulation, it is becoming increasingly evident that synchronization of neuronal oscillations in the gamma-band might also play an important role in the attentional modulation of information processing in visual cortex. Synchronized oscillations cannot only modulate firing rates, but they may also increase the fidelity and efficiency with which information is transferred through different populations of neurons. The normalization model of attention (Reynolds and Heeger, 2009) takes a rather abstract approach and reproduces a wide range of experimentally observed consequences of attention, such as contrast vs. response gain enhancement, changes in receptive field structure, altered tuning properties, and competitive interactions between multiple simultaneously presented stimuli. The synchronization framework complements the normalization model by providing a possible neural correlate of attentional mechanisms and by suggesting ways in which the normalization model could reproduce the temporal and spatial evolution of attentional modulation.
We have shown that an expansion of the normalization model to a multi-level hierarchical cortical network model increases its descriptive power, but that this expansion is only functional when a phase mapping mechanism is added. Incorporating a phase-locking entrainment process that closely resembles the functional mechanism previously proposed in the Communication-Through-Coherence (CTC) hypothesis, it is possible to create a biologically plausible expanded model of attentional modulation. The resulting Hierarchical Normalization and Oscillation (HNO) model does not only explain the already impressive array of phenomena that led to the inception of the original normalization model, but it also reproduces the increased oscillatory strength associated with attention, as well as the backward cortical propagation of attentional modulation.
Another interesting implication of the way we implemented the oscillatory extension within the normalization model framework is that top-down attentional control (the attention field in our model) might not entrain lower-area neuronal populations through direct phase-locking, but instead indirectly induces entrainment between a cascade of areas. This prediction follows from the observation that bottom-up input arriving at the V4 stage of our model carries a random oscillatory phase map that is determined at lower processing levels (here the retina) and independent of attentional modulation. While attention then serves to increase the power of the neural oscillations (vector magnitude) at the attended location, it does not determine the actual phase of these oscillations (vector angle). In line with neurophysiological evidence (Fries et al., 2001; Salinas and Sejnowski, 2001; Lakatos et al., 2008; Van Elswijk et al., 2010; Womelsdorf et al., 2006b, 2007), this dissociation predicts an increase in gamma-band oscillations in V4 during directed attention. It also predicts that top-down attentional processes do not set a specific gamma-oscillatory phase in lower visual areas, but merely enhance the power of oscillations that are already present. One possibility for how this could be neurophysiologically implemented is a mechanism through which feedback attention leads to a general enhancement of inter-neuronal activity in lower cortical areas. Following the gamma cycle hypothesis (Tiesinga et al., 2004; Fries et al., 2007), stronger inhibition of principal cells will lead to increased competition between pyramidal cells to fire action potentials early in the gamma cycle. This will in turn lead to an enhancement of gamma cycle phase-locking and induce an increase in observed gamma power. Such a mechanism of inhibitory feedback has recently been proposed to underlie attentional gain modulation in V1 of the mouse visual cortex (Olsen et al., 2012).
Despite the increased descriptive power of the HNO model compared to the standard normalization model, there are still a few neurophysiological observations that are difficult to account for. The attention field of the normalization model, for instance, increases both the suppressive drive and the excitatory drive. In neuronal terms, this would predict both an increase in firing rate as well as stronger inhibition. Together these effects will lead to an increase in gamma-band power by causing higher peaks and lower troughs in the oscillatory signal. While this is in concordance with data from V4 that shows an increase in gamma-band power as well as in firing rates, it has recently been observed that in V1 attention actually decreases gamma-band power (Chalk et al., 2010). A possible solution to this apparent contradiction could be that attention reduces surround suppression and gamma oscillations at a large spatial scale, while simultaneously increasing gamma oscillations at a very local level (Chalk et al., 2010).
An interesting opportunity to directly test the role of gamma oscillations in attentional modulation may result from the observation that the frequency of synchronized oscillations in the hippocampus depends on the concentration of the neurotransmitter acetylcholine (ACh; Fisahn et al., 1998; Fellous and Sejnowski, 2000; Tiesinga et al., 2001) and that injections of carbachol, an ACh agonist, can induce gamma-band oscillations in slices of rat visual cortex in vitro (Wespatat et al., 2004; Oke et al., 2010). The artificial induction of neuronal oscillations would open up great possibilities for the verification of oscillation based models.
However, some recent studies suggest that the role of gamma-band oscillations in visual processing may be rather different for lower and higher level areas of visual cortex and might depend on the task that is performed (Lima et al., 2011; Bauer et al., 2012). In one of these studies (Bauer et al., 2012), the administration of the cholinergic agonist physostigmine prior to visual spatial attention task was shown to enhance alpha/beta band attentional modulation in human visual cortex, while leaving gamma-band oscillations unaffected. The cholinergic agonist did however enhance gamma-band oscillations in more frontal brain regions, leading to the suggestion that cholinergic enhancement might be primarily implicated in modulating activity in areas that provide feedback to earlier cortical regions. In contrast with these findings (Lima et al., 2011) reported that the expectation of a cued visual target enhanced widespread gamma-band oscillations throughout monkey V1, while alpha-band oscillations were reduced. While these conflicting observations make it clear that neuronal oscillations in the visual cortex are important for attentional processes, it also shows that the precise role of these oscillations is still relatively unknown. Replication of the aforementioned results with a broader range of different parameters or behavioral tasks is required to reveal the mechanisms that underlie the different effects of gamma and alpha oscillations throughout visual cortex.
The HNO model of visual attention proposed in this paper may be compatible with, and complementary to, several other recently published computational models of attention. Some of these models accurately reproduce the timecourse of attentional modulation of neuronal activity (Spratling and Johnson, 2004; Deco and Rolls, 2005), but it is unknown whether they also capture the dissociation between response gain and contrast-gain transition as a function of attention field size. To our knowledge, the HNO model is the first model to combine response normalization and neuronal oscillation theory. The still rather abstract nature of some of the elements of the normalization components in our model could however be complemented by two other existing models to yield an even more detailed description of the neural mechanisms of attention.
A neural network model of attention-driven perceptual organization (Mihalas et al., 2011) that was also inspired by the Reynolds and Heeger normalization model describes a backward propagation of attentional effects with a more neuron-focused approach. It incorporates object-based attention and higher-order feature computation and produces similar results as the HNO model (i.e., a backward propagation of attentional effects over time from higher to lower cortical stages). It lacks neuronal oscillations but instead uses highly specialized subtypes of neurons to establish the feedback effect. A combination of the two models could provide more insight into how neuronal oscillations relate to specific feature computations and their interactions with attention. It would be interesting to see whether a single general phase map for all functional neuronal subtypes used in the Mihalas model is sufficient to modulate neuronal communication between functional subgroups and enhance competitive interactions (i.e., if a single frequency would suffice), or if different neuronal subtypes would need individual phase maps (i.e., different oscillatory frequencies). Combining feature-specific neurons with coherent oscillations at different frequencies could yield interesting new hypotheses as to why gamma-band oscillations appear to perform different roles in V1 and V4/FEF.
The Reentry Hypothesis proposed by Hamker (2003) states that attentional modulation of higher temporal stream areas (V4, IT) mainly arises due to feedback from movement cells in FEF (FEFm). Since FEFm cells receive relatively little input from visual areas (V4, IT) compared to a much stronger input from prefrontal cortex (PFC), this top-down effect is assumed to arise from a processing loop going through the PFC. This specific implementation of attentional modulation of V4 activity gives rise to feature selection and receptive field modulations (Hamker, 2005; Hamker and Zirnsak, 2006) and is conceptually similar to the framework of attention used in the HNO model. However, by establishing an attention field in V4 via feedback connections from FEF, the reentry hypothesis appears to end at the processing stage where the HNO model begins. The Reentry Hypothesis and HNO model are thus complementary in the fact that the HNO model describes the back propagation of attentional effects in the early and middle visual areas (V1, V2, V4) evoked by an attention field in V4, whose origin is described by the Reentry Hypothesis.
The Reentry Hypothesis’ central idea of a prefrontal loop required for directing visual attention is supported by a recent rTMS study that demonstrated that rTMS applied to the inferior frontal junction significantly impaired performance on a visual memory task (Zanto et al., 2011). In addition, both attentional modulation as indicated by the P1 amplitude and alpha-band coherence between frontal cortex and posterior areas was reduced. These observations are also in line with the CTC hypothesis and suggest that long-range phase-locking in the alpha frequency band between frontal and parietal/occipital regions may be crucial for the top-down attentional modulation of neural responses in visual areas like V1, V2, and V4.
In conclusion, our current work demonstrates that divisive normalization and oscillation models are not mutually exclusive interpretations of the neural mechanisms of selective visual attention. Instead, they can be combined into a single unified framework that allows the prediction of both spatial and temporal aspects of selective attention. The synthesis of these two frameworks in our Hierarchical Normalization and Oscillation model is complementary to other existing models of attention and yields new predictions about the neural mechanisms of visual perception that may be directly addressed in future experiments.
Conflict of Interest Statement
The authors declare that the research was conducted in the absence of any commercial or financial relationships that could be construed as a potential conflict of interest.
Acknowledgments
Richard J. A. van Wezel and P. Christaan Klink were supported by grants of the Utrecht University High Potential and the Neuroscience and Cognition Utrecht grant programs awarded to Richard J. A. van Wezel. P. Christaan Klink is supported by the NCU Focus and Mass program of Utrecht University.
Supplementary Material
The Supplementary Material for this article can be found online at http://www.frontiersin.org/Neural_Circuits/10.3389/fncir.2012.00022/abstract
Movie S1. Time-lapse simulation of phase map and activity map progression with uniform initial phase maps. Shown here are the outputs of every area (LGN; V1; V2 and V4) at each time step of the simulation. At t = 1, only LGN shows activity. This activity spreads upwards to V1, V2, and V4. At t = 4 the bottom-up activation reaches V4, where the attention field is centered on the right-hand side stimulus. This creates a bias in activation between stimuli 1 and 2; and this bias is back-propagated to V2, V1, and LGN. As time progresses, especially V4 and V2 are subject to signal degradation. Where V2 initially had clearly separable Gaussian activation curves for the two different stimuli, at later time steps this activation has merged into a single blob.
Movie S2. Time-lapse simulation of phase map and activity map progression with random phase maps. As Movie S1 in Supplementary Material, this movie shows the output of the HNO model for each cortical layer, but now with randomized initial phase maps. At t = 1, the input drive is multiplied by the randomized input phase (see also Figure 5). Since the activity in the input drive is highly localized, this multiplication creates strong bias for surrounding pixels (i.e., neurons) to phase-lock to this oscillatory phase when the input vector map is convolved with a two-dimensional Gaussian. In this particular simulation the left-hand side stimulus happened to be combined with a greenish phase; while the right-hand side was combined with a pinkish-red phase. Therefore the phase map at LGN at t = 1 already shows a slightly extended greenish blob around stimulus 1; and a slightly extended pinkish-red blob around stimulus 2. This bias continues to reinforce itself over subsequent iterations causing the expansion of the green phase over one half of the phase map and the expansion of the red phase over the other half. Note that in the activity maps the activation spots due to stimulus 1 and stimulus 2 remain easily dissociable.
Movie S3. Time-lapse simulation of phase map and activity map progression with no cued attention prior to the stimulus presentation. As Movie S1 in Supplementary Material, this movie shows the output of the HNO model for each cortical layer. Until t = 28, no attention and no stimulus-driven activity is present. This period shows random activity that appears to converge to a steady-state. At t = 28, stimulus-driven activity reaches V4, and attention is directed to the right-hand stimulus. Over time, the right-hand stimulus becomes more salient than the left-hand stimulus.
Movie S4. Time-lapse simulation of phase map and activity map progression with cued attention prior to the stimulus presentation. As Movie S3 in Supplementary Material, this movie shows the output of the HNO model for each cortical layer. As early as t = 1, attention is directed toward the cued location where a stimulus will appear. Over the course of several iterations, attention builds up at the cued location and causes inter-areal phase-locking at that location. At t = 28, stimulus-driven activity reaches V4, and the already present activation bias allows the right-hand stimulus to rapidly become more salient than the left-hand stimulus. While the steady-state of the activity level is identical to the non-cued attention simulation, this steady is reached more quickly due to the cued attention.
References
Anderson, C., and Van Essen, D. (1987). Shifter circuits: a computational strategy for dynamic aspects of visual processing. Proc. Natl. Acad. Sci. U.S.A. 84, 6297–6301.
Averbeck, B. B., Latham, P. E., and Pouget, A. (2006). Neural correlations, population coding and computation. Nat. Rev. Neurosci. 7, 358–366.
Bauer, M., Kluge, C., Bach, D., Bradbury, D., Heinze, H. J., Dolan, R. J., and Driver, J. (2012). Cholinergic enhancement of visual attention and neural oscillations in the human brain. Curr. Biol. 22, 1–6.
Bi, G. Q., and Poo, M. M. (1998). Synaptic modifications in cultured hippocampal neurons: dependence on spike timing, synaptic strength, and postsynaptic cell type. J. Neurosci. 18, 10464–10472.
Bichot, N. P., Rossi, A. F., and Desimone, R. (2005). Parallel and serial neural mechanisms for visual search in macaque area v4. Science 308, 529–534.
Bichot, N. P., and Schall, J. D. (1999). Effects of similarity and history on neural mechanisms of visual selection. Nature 2, 549–554.
Bisley, J. W., and Goldberg, M. E. (2010). Attention, intention, and priority in the parietal lobe. Annu. Rev. Neurosci. 33, 1–21.
Börgers, C., Epstein, S., and Kopell, N. J. (2005). Background gamma rhythmicity and attention in cortical local circuits: a computational study. Proc. Natl. Acad. Sci. U.S.A. 102, 7002–7007.
Buffalo, E. A., Fries, P., Landman, R., Liang, H., and Desimone, R. (2010). A backward progression of attentional effects in the ventral stream. Proc. Natl. Acad. Sci. U.S.A. 107, 361–365.
Bushnell, M. C., Goldberg, M. E., and Robinson, D. L. (1981). Behavioral enhancement of visual responses in monkey cerebral cortex. I. Modulation in posterior parietal cortex related to selective visual attention. J. Neurophysiol. 46, 755–772.
Carandini, M., and Heeger, D. J. (2011). Normalization as a canonical neural computation. Nat. Rev. Neurosci. 13, 51–62.
Chalk, M., Herrero, J. L., Gieselmann, M. A., Delicato, L. S., Gotthardt, S., and Thiele, A. (2010). Attention reduces stimulus-driven gamma frequency oscillations and spike field coherence in v1. Neuron 66, 114–125.
Cohen, M. R., and Maunsell, J. H. R. (2010). A neuronal population measure of attention predicts behavioral performance on individual trials. J. Neurosci. 30, 15241–15253.
Cook, E. P., and Maunsell, J. H. R. (2002). Attentional modulation of behavioral performance and neuronal responses in middle temporal and ventral intraparietal areas of macaque monkey. J. Neurosci. 22, 1994–2004.
Deco, G., and Rolls, E. T. (2005). Neurodynamics of biased competition and cooperation for attention: a model with spiking neurons. J. Neurophysiol. 94, 295–313.
Desimone, R., and Duncan, J. (1995). Neural mechanisms of selective visual attention. Annu. Rev. Neurosci. 18, 193–222.
Ekstrom, L. B., Roelfsema, P. R., Arsenault, J. T., Bonmassar, G., and Vanduffel, W. (2008). Bottom-up dependent gating of frontal signals in early visual cortex. Science 321, 414–417.
Engel, A. K., Fries, P., and Singer, W. (2001). Dynamic predictions: Oscillations and synchrony in top-down processing. Nat. Rev. Neurosci. 2, 704–716.
Fell, J., Fernández, G., Klaver, P., Elger, C. E., and Fries, P. (2003). Is synchronized neuronal gamma activity relevant for selective attention? Brain Res. Rev. 42, 265–272.
Fellous, J. M., and Sejnowski, T. J. (2000). Cholinergic induction of spontaneous oscillations in the hippocampal slice in the slow (0.5-2 hz), theta (5-12 hz) and gamma (35-70 hz) bands. Hippocampus 10, 187–197.
Fisahn, A., Pike, F. G., Buhl, E. H., and Paulsen, O. (1998). Cholinergic induction of network oscillations at 40hz in the hippocampus in vitro. Nature 394, 186–189.
Frégnac, Y., Pananceau, M., Rene, A., Huguet, N., Marre, O., Levy, M., and Shulz, D. E. (2010). A re-examination of hebbian-covariance rules and spike timing-dependent plasticity in cat visual cortex in vivo. Front Syn. Neurosci. 2:147. doi: 10.3389/fnsyn.2010.00147
Fries, P. (2005). A mechanism for cognitive dynamics: neuronal communication through neuronal coherence. Trends Cogn. Sci. (Regul. Ed.) 9, 474–480.
Fries, P. (2009). Neuronal gamma-band synchronization as a fundamental process in cortical computation. Annu. Rev. Neurosci. 32, 209–224.
Fries, P., Reynolds, J. H., Rorie, A. E., and Desimone, R. (2001). Modulation of oscillatory neuronal synchronization by selective visual attention. Science 291, 1560–1563.
Gottlieb, J. P., Kusunoki, M., and Goldberg, M. E. (1998). The representation of visual salience in monkey parietal cortex. Nature 391, 481–484.
Gregoriou, G. G., Gotts, S. J., Zhou, H., and Desimone, R. (2009). High-frequency, long-range coupling between prefrontal and visual cortex during attention. Science 324, 1207–1210.
Hamker, F. H. (2003). The reentry hypothesis: linking eye movements to visual perception. J. Vis. 3, 808–816.
Hamker, F. H. (2005). The reentry hypothesis: the putative interaction of the frontal eye field, ventrolateral prefrontal cortex, and areas v4, it for attention and eye movement. Cereb. Cortex 15, 431–447.
Hamker, F. H., and Zirnsak, M. (2006). V4 receptive field dynamics as predicted by a systems-level model of visual attention using feedback from the frontal eye field. Neural Netw. 19, 1371–1382.
Herrmann, K., Montaser-Kouhsari, L., Carrasco, M., and Heeger, D. J. (2010). When size matters: attention affects performance by contrast or response gain. Nat. Neurosci. 13, 1554–1559.
Hupé, J.-M., James, A. C., Girard, P., Lomber, S. G., Payne, B. R., and Bullier, J. (2001). Feedback connections act on the early part of the responses in monkey visual cortex. J. Neurophysiol. 85, 134–145.
Itti, L., and Koch, C. (2001). Computational modelling of visual attention. Nat. Rev. Neurosci. 2, 194–203.
Koch, C., and Ullman, S. (1985). Shifts in selective visual attention: towards the underlying neural circuitry. Hum. Neurobiol. 4, 219–227.
König, P., Engel, A. K., Roelfsema, P. R., and Singer, W. (1995). How precise is neuronal synchronization? Neural Comput. 7, 469–485.
Kopell, N., Ermentrout, G. B., Whittington, M. A., and Traub, R. D. (2000). Gamma rhythms and beta rhythms have different synchronization properties. Proc. Natl. Acad. Sci. U.S.A. 97, 1867–1872.
Kremkow, J., Aertsen, A., and Kumar, A. (2010). Gating of signal propagation in spiking neural networks by balanced and correlated excitation and inhibition. J. Neurosci. 30, 15760–15768.
Kumar, A., Rotter, S., and Aertsen, A. (2010). Spiking activity propagation in neuronal networks: reconciling different perspectives on neural coding. Nat. Rev. Neurosci. 11, 615–627.
Lakatos, P., Karmos, G., Mehta, A. D., Ulbert, I., and Schroeder, C. E. (2008). Entrainment of neuronal oscillations as a mechanism of attentional selection. Science 320, 110–113.
Lee, J., and Maunsell, J. H. (2009). A normalization model of attentional modulation of single unit responses. PLoS ONE 4, e4651. doi: 10.1371/journal.pone.0004651
Lima, B., Singer, W., and Neuenschwander, S. (2011). Gamma responses correlate with temporal expectation in monkey primary visual cortex. J. Neurosci. 31, 15919–15931.
Luck, S. J., Chelazzi, L., Hillyard, S. A., and Desimone, R. (1997). Neural mechanisms of spatial selective attention in areas v1, v2 and v4 of macaque visual cortex. J. Neurophysiol. 77, 24–42.
Lynch, J. C., Mountcastle, V. B., Talbot, W. H., and Yin, T. C. (1977). Parietal lobe mechanisms for directed visual attention. J. Neurophysiol. 40, 362–389.
Martínez-Trujillo, J. C., and Treue, S. (2002). Attentional modulation strength in cortical area mt depends on stimulus contrast. Neuron 35, 365–370.
Maunsell, J. H. R., and Treue, S. (2006). Feature-based attention in visual cortex. Trends Neurosci. 29, 317–322.
McAdams, C. J., and Maunsell, J. H. R. (1999). Effects of attention on orientation-tuning functions of single neurons in macaque cortical area v4. J. Neurosci. 19, 431–441.
McAlonan, K., Cavanaugh, J., and Wurtz, R. H. (2008). Guarding the gateway to cortex with attention in visual thalamus. Nature 456, 391–394.
Mihalas, S., Dong, Y., von der Heydt, R., and Niebur, E. (2011). Mechanisms of perceptual organization provide auto-zoom and auto-localization for attention to objects. Proc. Natl. Acad. Sci. U.S.A. 108, 7583–7588.
Mitchell, J. F., Sundberg, K. A., and Reynolds, J. H. (2009). Spatial attention decorrelates intrinsic activity fluctuations in macaque area v4. Neuron 63, 879–888.
Moore, T., and Armstrong, K. M. (2003). Selective gating of visual signals by microstimulation of frontal cortex. Nature 421, 370–373.
Moran, J., and Desimone, R. (1985). Selective attention gates visual processing in the extrastriate cortex. Science 229, 782–784.
Motter, B. C. (1993). Focal attention produces spatially selective processing in visual cortical areas v1, v2 and v4in the presence of competing stimuli. J. Neurophysiol. 70, 909–919.
Oke, O. O., Magony, A., Anver, H., Ward, P. D., Jiruska, P., Jefferys, J. G. R., and Vreugdenhil, M. (2010). High-frequency gamma oscillations coexist with low-frequency gamma oscillations in the rat visual cortex in vitro. Eur. J. Neurosci. 31, 1435–1445.
Oleksiak, A., Klink, P. C., Postma, A., van der Ham, I. J. M., Lankheet, M. J., and van Wezel, R. J. A. (2011). Spatial summation in macaque parietal area 7a follows a winner-take-all rule. J. Neurophysiol. 105, 1150–1158.
Olsen, S. R., Bortone, D. S., Adesnik, H., and Scanziani, M. (2012). Gain control by layer six in cortical circuits of vision. Nature 483, 47–52.
Olufsen, M. S., Whittington, M. A., Camperi, M., and Kopell, N. (2003). New roles for the gamma rhythm: population tuning and preprocessing for the beta rhythm. J. Comput. Neurosci. 14, 33–54.
Posner, M. I., and Gilbert, C. D. (1999). Attention and primary visual cortex. Proc. Natl. Acad. Sci. U.S.A. 96, 2585–2587.
Recanzone, G. H., and Wurtz, R. H. (2000). Effects of attention on mt and mst neuronal activity during pursuit initiation. J. Neurophysiol. 83, 777–790.
Reynolds, J. H., Chelazzi, L., and Desimone, R. (1999). Competitive mechanisms subserve attention in macaque areas v2 and v4. J. Neurosci. 19, 1736–1753.
Reynolds, J. H., and Heeger, D. J. (2009). The normalization model of attention. Neuron 61, 168–185.
Riehle, A., Grün, S., Diesmann, M., and Aertsen, A. (1997). Spike synchronization and rate modulation differentially involved in motor cortical function. Science 278, 1950–1953.
Salinas, E., and Sejnowski, T. J. (2001). Correlated neuronal activity and the J. Comput. Neurosci flow of neural information. Nat. Rev. Neurosci. 2, 539–550.
Sato, T. (1988). Effects of attention and stimulus interaction on visual responses of inferior temporal neurons in macaque. J. Neurophysiol. 60, 344–347.
Schmolesky, M. T., Wang, Y., Hanes, D. P., Thompson, K. G., Leutgeb, S., Schall, J. D., and Leventhal, A. G. (1998). Signal timing access the macaque visual system. J. Neurophysiol. 79, 3272–3278.
Serences, J. T., and Yantis, S. (2006). Selective visual attention and perceptual coherence. Trends Cogn. Sci. (Regul. Ed.) 10, 38–45.
Spratling, M. W., and Johnson, M. H. (2004). A feedback model of visual attention. J. Cogn. Neurosci. 16, 219–237.
Tiesinga, P. H., Fellous, J. M., Salinas, E., José, J. V., and Sejnowski, T. J. (2004). Inhibitory synchrony as a mechanism for attentional gain modulation. J. Physiol. Paris 98, 296–314.
Tiesinga, P. H. E., Fellous, J.-M., José, J. V., and Sejnowski, T. J. (2001). Computational model of carbachol-induced delta, theta, and gamma oscillations in the hippocampus. Hippocampus 11, 251–274.
Treue, S. (2001). Neural correlates of attention in primate visual cortex. Trends Neurosci. 24, 295–300.
Treue, S. (2003). Visual attention: the where, what, how and why of saliency. Curr. Opin. Neurobiol. 13, 428–432.
Treue, S., and Martínez-Trujillo, J. (1999). Feature-based attention influences motion processing gain in macaque visual cortex. Nature 399, 575–579.
Treue, S., and Maunsell, J. H. R. (1996). Attentional modulation of visual motion processing in cortical areas mt and mst. Nature 382, 539–541.
Van Elswijk, G., Maij, F., Schoffelen, J.-M., Overeem, S., Stegeman, D. F., and Fries, P. (2010). Corticospinal beta-band synchronization entails rhythmic gain modulation. J. Neurosci. 30, 4481–4488.
VanRullen, R., and Thorpe, S. J. (2002). Surfing a spike wave down the ventral stream. Vision Res. 42, 2593–2615.
Volgushev, M., Chistiakova, M., and Singer, W. (1998). Modification of discharge patterns of neocortical neurons by induced oscillations of the membrane potential. Neuroscience 83, 15–25.
Wespatat, V., Tennigkeit, F., and Singer, W. (2004). Phase sensitivity of synaptic modifications in oscillating cells of rat visual cortex. J. Neurosci. 24, 9067–9075.
Womelsdorf, T., Anton-Erxleben, K., Pieper, F., and Treue, S. (2006a). Dynamic shifts of visual receptive fields in cortical area mt by spatial attention. Nat. Neurosci. 9, 1156–1160.
Womelsdorf, T., Fries, P., Mitra, P. P., and Desimone, R. (2006b). Gamma-band synchronization in visual cortex predicts speed of change detection. Nature 439, 733–736.
Womelsdorf, T., and Fries, P. (2007). The role of neuronal synchronization in selective attention. Curr. Opin. Neurobiol. 17, 154–160.
Womelsdorf, T., Schoffelen, J. M., Oostenveld, R., Singer, W., Desimone, R., Engel, A. K., and Fries, P. (2007). Modulation of neuronal interactions through neuronal synchronization. Science 316, 1609–1612.
Zanto, T. P., Rubens, M. T., Thangavel, A., and Gazzaley, A. (2011). Causal role of the prefrontal cortex in top-down modulation of visual processing and working memory. Nat. Neurosci. 14, 656–661.
Zhang, Y., Meyers, E. M., Bichot, N. P., Serre, T., Poggio, T. A., and Desimone, R. (2011). Object decoding with attention in inferior temporal cortex. Proc. Natl. Acad. Sci. U.S.A. 108, 8850–8855.
Appendix
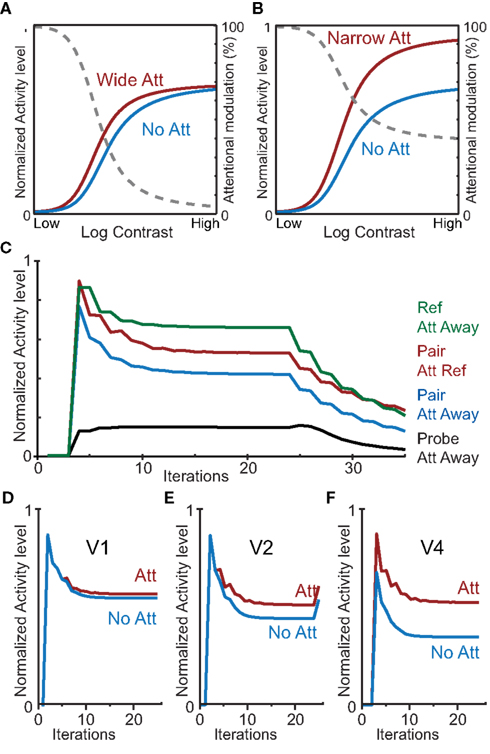
Figure A1. Simulations with the HNO model using a gain-control implementation of feedback modulation rather than an additive mechanism. All simulations show results that are qualitatively similar to those obtained with additive feedback (Figure 7). (A,B) Contrast dependency of a neuron responsive to a stimulus in V4 dependent on attention field size. (A) An attention field that is large (width of 30) compared to the stimulus (width of 3). (B) Identical to (A), but with an attention field that is small (width of 3) compared to the stimulus (width of 5). (C) Simulation of a neuron’s response over time as measured by Reynolds et al. (1999), Figure 6. (D,E,F) Simulation of progression of the attention effect as measured by Buffalo et al. (2010). Progression of attentional modulation over V1 (D), V2 (E), and V4 (F). All lines and colors are identical to the ones used in Figure 7.
Keywords: visual cortex, attention, divisive normalization, neuronal oscillations, phase-locking, communication-through-coherence, computational model, hierarchical normalization and oscillation
Citation: Montijn JS, Klink PC and van Wezel RJA (2012) Divisive normalization and neuronal oscillations in a single hierarchical framework of selective visual attention. Front. Neural Circuits 6:22. doi: 10.3389/fncir.2012.00022
Received: 05 January 2012; Accepted: 12 April 2012;
Published online: 04 May 2012.
Edited by:
Dario L. Ringach, UCLA, USAReviewed by:
German Sumbre, École Normale Supérieure, FranceFred H. Hamker, Chemnitz University of Technology, Germany
Copyright: © 2012 Montijn, Klink and van Wezel. This is an open-access article distributed under the terms of the Creative Commons Attribution Non Commercial License, which permits non-commercial use, distribution, and reproduction in other forums, provided the original authors and source are credited.
*Correspondence: Richard J. A. van Wezel, Department of Biophysics, Donders Institute for Brain, Cognition and Behaviour, Radboud University Nijmegen, Geert Grooteplein 21, 6525 EZ Nijmegen, Netherlands. e-mail:ci52YW53ZXplbEBkb25kZXJzLnJ1Lm5s