 Daniel J. Sperka1
 Jochen Ditterich1,2*
- 1 Center for Neuroscience, University of California, Davis, CA, USA
- 2 Department of Neurobiology, Physiology and Behavior, University of California, Davis, CA, USA
While computer-aided planning of human neurosurgeries is becoming more and more common, animal researchers still largely rely on paper atlases for planning their approach before implanting recording chambers to perform invasive recordings of neural activity, which makes this planning process tedious and error-prone. Here we present SPLASh (Stereotactic PLAnning Software), an interactive software tool for the stereotactic planning of recording chamber placement and electrode trajectories. SPLASh has been developed for monkey cortical recordings and relies on a combination of structural MRIs and electronic brain atlases. Since SPLASh is based on the neuroanatomy software Caret, it should also be possible to use it for other parts of the brain or other species for which Caret atlases are available. The tool allows the user to interactively evaluate different possible placements of recording chambers and to simulate electrode trajectories.
Introduction
While computer-aided planning of human neurosurgery is becoming more and more standard these days, animal researchers performing neural recordings still tend to rely on paper atlases for planning their approach. This is a tedious and error-prone procedure, especially when planning an approach that is not parallel to any of the slices in the atlas. In addition, the planning cannot be tailored to the anatomy of a particular animal. While a software-based approach could make the animal researcher’s job much easier, currently available commercial solutions developed for human neurosurgery are not attractive to animal researchers due to the associated costs and the missing support for animal applications. We have therefore set out to develop an interactive software tool for the stereotactic planning of recording chamber placement and electrode trajectories. The tool was developed with cortical recordings from macaque monkeys in mind, but it should also be applicable to other brain structures and species. Since we did not want to reinvent the wheel, we have decided to add the stereotactic planning functionality to an existing, freely available neuroanatomy application: Caret1 (Van Essen et al., 2001). In addition to the macaque cortex atlas that we will use here2 (Van Essen, 2002), there is also an atlas for the macaque cerebellum as well as a mouse and a rat atlas available for Caret. Although we have not tested this explicitly, our tool should also be able to work with these atlases as long as the required surface information can be extracted from the MRI (see below).
Having access to the brain for recording neural activity usually requires implanting a recording chamber in a sterile surgery. Going into this surgery one needs to know the desired location, orientation, and shape of the recording chamber on the skull. The implantation is usually performed with the help of a stereotactic device. Thus, it is particularly helpful to know the desired location and orientation of the recording chamber in the appropriate stereotactic coordinate system. We explain in Section “Target Selection and Default Placement of the Recording Chamber” how our software, SPLASh (Stereotactic PLAnning Software), helps determining the appropriate recording chamber location, orientation, and shape. Section “Visualizing All Parts of the Brain that can be Accessed with a Particular Recording Chamber Placement” demonstrates how SPLASh can be used to determine which additional brain areas can also be accessed from the same recording chamber. Finally, Section “Simulating Individual Electrode Tracks” explains SPLASh’s virtual electrode tool. Questions that can be answered with the help of this tool include: Do electrode tracks spare particular other brain areas in order to maintain the structural integrity of the neural tissue? How deep does an electrode have to be advanced before hitting the target area? From what range of locations within the recording chamber can different parts of the target area be reached? For example, for one project one might want to distribute access to different parts of the target area over as many electrode locations as possible to maximize the number of available penetrations, whereas for another project one might want to have access to different parts of the target area from a single electrode location, for example, when using a multi-electrode bundle. Using a toy example, we will explain in the following how all of the mentioned problems can be solved with the help of SPLASh.
Materials and Methods
Data Required by SPLASh
To be able to work with SPLASh, one needs a structural MRI of the subject’s head. This can either be the MRI that is provided with the atlas dataset (as in our example shown here) or an MRI of the actual animal that is being implanted to take the individual anatomy into account. When working with an individual MRI, the relevant part of the brain needs to be extracted, flattened, and registered with the atlas. This, however, can be done with the standard functionality of Caret and is therefore not covered here. Using the atlas MRI has the advantage of being able to use SPLASh even when no individual MRI is available. The provided MRI is of high quality and the segmentation and registration with the atlas data have been performed by experts. However, individual anatomical deviations from the template are obviously neglected. Using an individual MRI has the advantage of working with the actual anatomy of the individual animal, but the quality of the MRI and how well segmentation and registration are being performed determines the precision of the results. Surface information needs to be extracted from the chosen MRI for the outer skull surface (possible locations for placing a recording chamber) as well as the outer brain surface (reference points for measuring the depth of a penetration). We have performed this extraction with the freely available software BrainSuite3 (Shattuck and Leahy, 2002). The result of this extraction for the macaque MRI coming with the macaque cortex atlas (see above) is shown in Figure 1. Currently, SPLASh can only read skull/brain surface data in the DFS format written by BrainSuite. In addition to the structural MRI and the extracted surface information SPLASh also needs access to the (Caret) atlas data.
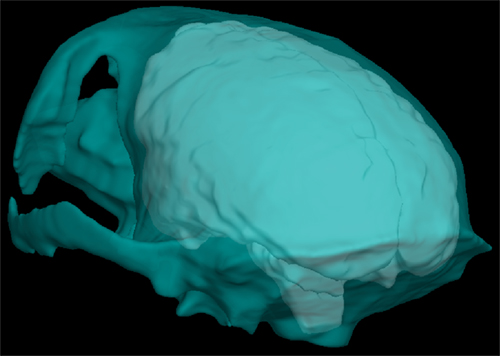
Figure 1. Surface information that has been extracted from the MRI. Looking through the outer skull surface (cyan) one can see the outer brain surface (white).
Definition of the Stereotactic Coordinate System
The stereotactic coordinate system used by SPLASh is defined as follows: The X axis is parallel to the ear bars (and therefore perpendicular to the sagittal plane) and extends from left (negative coordinates = left of midsagittal plane) to right (positive coordinates). The Y axis is perpendicular to the coronal plane and extends from posterior (negative coordinates = posterior to ear bars) to anterior (positive coordinates). The Z axis is perpendicular to the horizontal plane and extends from ventral (negative coordinates = below ear bar level) to dorsal (positive coordinates). These conventions are illustrated in Figure 2A. The origin of the coordinate system is therefore located at the intersection between the interaural axis and the midsagittal plane. This is the coordinate system that is typically used by animal stereotactic devices.
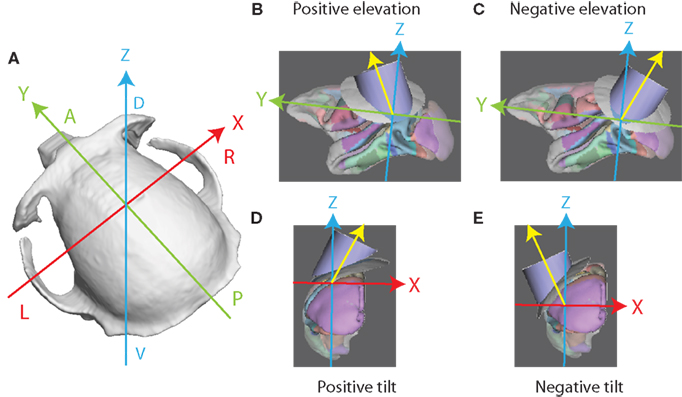
Figure 2. Coordinate system and recording chamber orientation. (A) Stereotactic coordinate system: the X axis extends from left to right, the Y axis from posterior to anterior, and the Z axis from ventral to dorsal. The axes intersect at the origin of the coordinate system. (B) Recording chamber with a positive elevation angle. The orientation of the central axis of the recording chamber is indicated by the yellow vector. Note that the axes represent a translated coordinate system. The Y and Z axes and the central axis of the recording chamber intersect at the location of the target node. (C) Recording chamber with a negative elevation angle. (D) Recording chamber with a positive tilt angle. (E) Recording chamber with a negative tilt angle.
Finding the Closest Point on the Skull for the Default Recording Chamber Placement
Caret and SPLASh represent surfaces, such as the skull surface, the outer brain surface, or layer 4 of cortex, which Caret uses as its brain surface when working with the macaque cortex atlas, as a set of nodes. Each of these nodes has a location in 3D space. After a target node has been chosen for the recording chamber placement (see Planning recording chamber placement and Simulating electrode trajectories with SPLASh) SPLASh initially places the chamber such that the target node can be reached with the shortest possible penetration. This is achieved by finding the closest point on the skull and using it as the center point for the default cylinder placement.
To accomplish this and other searches SPLASh makes use of ANN, a library for approximate nearest neighbor searching4. This library supports data structures and algorithms that can efficiently perform nearest neighbor searching and points-within-distance searching in a set of 3D points. By separately storing the coordinates of the brain and skull surfaces as well as the node coordinates of Caret’s brain model in the structures provided by ANN we can quickly and efficiently perform searches to identify points of interest in any of these structures.
Definition of the Orientation of the Recording Chamber
To describe the orientation of the recording chamber with respect to the stereotactic coordinate system two angles are specified: an “elevation” angle and a “tilt” angle. The angle formed by the projection of the central axis of the recording chamber onto the sagittal (YZ) plane and the Z axis is the “elevation” angle. Positive elevation angles denote a rotation of the recording chamber from the vertical toward the front of the skull (Figure 2B; a negative elevation angle is illustrated in Figure 2C). The angle formed by the projection of the central axis onto the coronal (XZ) plane and the Z axis is the “tilt” angle. Positive tilt angles denote rotations of the recording chamber from the vertical toward the right side of the skull when viewed from behind (Figure 2D; a negative tilt angle is illustrated in Figure 2E). Zero elevation and zero tilt therefore specify a “straight down” approach parallel to the Z axis (perpendicular to the horizontal plane) with a virtual electrode moving only ventrally when being advanced. For any given combination of elevation angle α and tilt angle β the orientation of the central axis of the recording chamber in the stereotactic coordinate system is given by the vector  with the vector pointing from the target location to the skull entry point.
Definition of the Coordinate System within the Recording Chamber for Defining the Location of an Electrode Track
SPLASh currently supports cylindrical recording chambers with a user-definable inner and outer diameter. When describing the location of an electrode track within a recording chamber, one has to indicate how far one has to move either left or right and/or forward or backward when starting at the center of the recording chamber. By default, SPLASh defines “forward” to be the direction of the positive Y axis after having applied the rotation defined by the elevation and tilt angles. The “forward” direction in the recording chamber (marked by a black line in 3D visualizations of the chamber), corresponding to the upward direction of the grid used for defining the location of electrode tracks in the SPLASh user interface (see Figure 8), is therefore given by the vector  The user can change the orientation of this coordinate system by defining a rotation angle with respect to the default orientation (“Grid orientation” in Figure 8).
Finding the Intersection between a Cylinder and the Brain Nodes
Caret stores brain models as a set of nodes with associated coordinates. Identifying the set of nodes that can be reached from a particular recording chamber or from a particular location in a recording chamber, potentially with depth constraints, always requires finding the intersection between a cylinder in 3D space and the brain volume. We use the ANN library (see above) to conduct these searches. This is accomplished by performing a series of searches along an electrode trajectory to find points with a maximum distance from the search points. The radius of these initial searches is chosen larger than the radius of the cylinder and the search points are spaced appropriately in order not to miss any nodes inside the cylinder. Each node that is returned by these initial searches is tested to determine if it is inside the search cylinder or not.
Availability of SPLASh
SPLASh can be downloaded for free from “http://systems.ucdavis.edu/splash/splash.html”. At the time of this writing it is only available for the Linux platform, but it works well in virtual machines. In addition to the software tool itself, the web page also provides a modified version of the macaque cortex atlas in ear bar-referenced stereotactic coordinates with everything added that is required to use it in SPLASh. Please check the web page for information on availability for other platforms, tested distributions, and virtual machines, etc.
Planning Recording Chamber Placement and Simulating Electrode Trajectories with SPLASh
In the following we will explain how the software can be used to solve a variety of problems that one might face when planning how to approach a particular brain area for a neural recording. Assume that we want to record from extrastriate visual area MT or V5 in the left hemisphere of macaque cortex, an area specialized on the processing of visual motion, which is located in the superior temporal sulcus (Desimone and Ungerleider, 1986).
Target Selection and Default Placement of the Recording Chamber
Figure 3 shows how a central location within this target area has been selected as the recording target using Caret’s standard node selection tool. The target location is visualized both on the flattened representation of the cortical surface on the left side (filled green square on red background) as well as in the structural MRI on the right side (cross-hair cursors). SPLASh then automatically chooses a default placement of the recording chamber in such a way that this target could be reached with the shortest possible penetration. This is accomplished by finding the point on the outer skull surface that is closest to the target (for details please see Materials and Methods). The recording chamber is oriented such that its symmetry axis contains both the target as well as the identified skull location for placing the chamber. This default placement (skull – light gray, recording chamber – blue) can be seen on the central panel (gray background) of Figure 3. Figure 4 shows the main SPLASh interface after this placement has been made. The “Target” section shows the stereotactic coordinates of the target location. The “Cylinder Placement” section shows the stereotactic coordinates of the skull location where the recording chamber would have to be implanted (Center X/Y/Z), the orientation of the recording chamber with respect to the stereotactic coordinate system (Elevation/Tilt; see Materials and Methods for details), as well as an estimate of the required shape of the recording chamber (at what angle the chamber would have to be cut to provide the best possible fit to the skull surface with a flat cut; “Rest angle”).
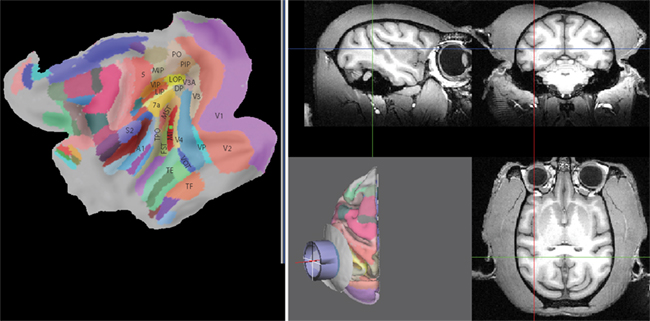
Figure 3. Target selection and default recording chamber placement. The left panel shows a flattened map of the cortical sheet. Identified cortical areas are superimposed in color (Lewis and Van Essen, 2000) with some of them being labeled. A central location in area MT (red in the map) has been selected as the target (filled green square). The corresponding location is also shown in the structural MRI on the right side with the cross-hair cursors. The central panel on the gray background shows the cortical hemisphere in 3D (with identified areas again being marked in color), a circular part of the outer skull surface (light gray), and a recording chamber (blue) that has been placed according to SPLASh’s default placement algorithm.
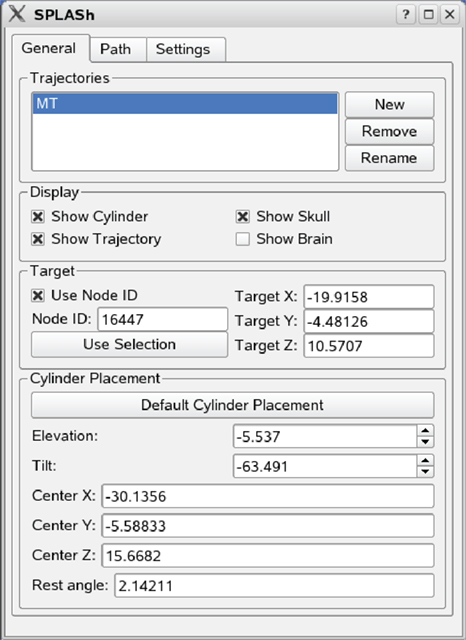
Figure 4. Main SPLASh user interface. The “Target” section contains information about the stereotactic location of the recording target. The “Cylinder Placement” section contains information about the stereotactic location and the orientation of the recording chamber.
Visualizing All Parts of the Brain that Can be Accessed with a Particular Recording Chamber Placement
A research project sometimes requires recordings not only from a single, but from multiple brain areas. The question therefore arises whether it is possible to implant a recording chamber such that multiple areas of interest can be accessed from the same recording chamber. To aid this kind of planning, SPLASh can display all parts of the brain that can be accessed with a particular recording chamber placement. This is shown in Figure 5 for the default recording chamber placement from the previous section. All nodes marked in white on the flat map on the left side of the figure as well as all nodes marked in red on the MRI on the right side of the figure can be accessed with this particular approach. The visualization is achieved by asking SPLASh to mark all nodes whose distance from the symmetry axis of the recording chamber is less than the chamber’s inner radius (“Path radius” setting in Figure 8). In addition to giving access to most of MT, this particular approach would also give access to parts of V4, MST, FST, and TPO.
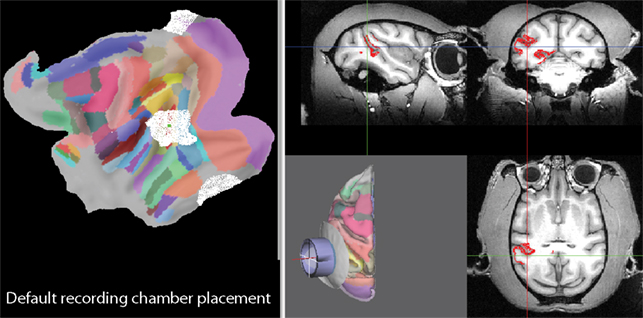
Figure 5. Visualization of all parts of the brain that can be accessed with the default recording chamber placement. The left panel shows all accessible nodes marked in white on the flattened representation of the cortical sheet. Likewise, all accessible nodes are marked in red on the MRI on the right side.
An alternative approach is shown in Figure 6. Elevation and tilt have been changed to zero to approach the same target location from straight above (parallel to the Z axis). As can be seen from the location of the white nodes on the flat map, this approach, in addition to giving access to almost all of MT, would also give access to parts of V4, VP, TE, TF, VOT, MST, FST, TPO, area 7a, LIP, and area 5. Another alternative is illustrated in Figure 7. In this case an elevation of −70° and a tilt of zero have been chosen. The symmetry axis of the recording chamber is therefore parallel to the sagittal plane and 20° above horizontal. This kind of approach is sometimes chosen to align the orientation of the electrode roughly with the orientation of the direction columns in MT. As can be seen from the flat map, this approach, in addition to giving access to almost all of MT, would also give access to parts of V1, V2, V3, V4, VP, MST, FST, TPO, as well as parts of auditory and somatosensory cortex.
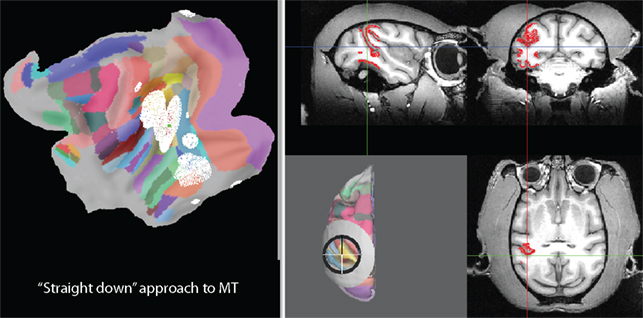
Figure 6. Visualization of all parts of the brain that can be accessed with an alternative “straight down” approach (elevation and tilt of zero).
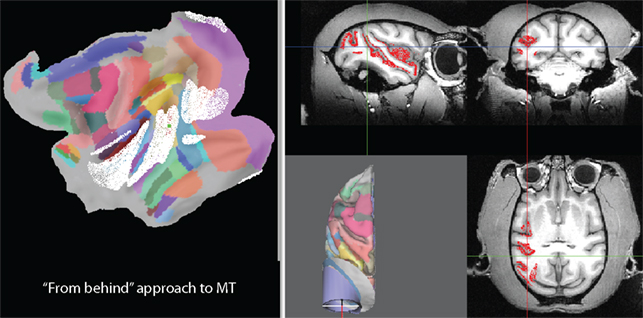
Figure 7. Visualization of all parts of the brain that can be accessed with an approach “from behind” (symmetry axis parallel to sagittal plane and 20° above horizontal; elevation of −70° and tilt of zero).
Simulating Individual Electrode Tracks
In addition to being able to visualize all nodes that lie within a maximum distance of the symmetry axis of the recording chamber, SPLASh can also simulate individual electrode tracks at some specified location within the recording chamber, parallel to its symmetry axis. This allows answering questions like “At what depth am I expected to hit my target area?” and “What other brain areas do I have to pass through (and at what depth am I expected to hit them) before hitting my actual target area?”. Figure 8 shows the control interface for simulating electrode trajectories. After specifying the electrode location, a virtual electrode can be advanced by moving a slider. As the virtual electrode is moved, search results are updated in real-time. Nodes surrounding the “tip” of the virtual electrode are marked on the flat map, the shown MRI slices are updated to intersect at the location of the virtual electrode tip (with the cross-hair cursors indicating the tip location), and nodes surrounding the tip are also marked on the MRI. The depth of the virtual electrode tip is measured along the electrode track with zero depth being defined by the intersection of the trajectory with the outer brain surface. Figure 9 shows an example of a virtual electrode track along the symmetry axis (center) of the default placement. Three different depths (2, 5, and 10 mm) are illustrated in Figures 9A–C. The white nodes on the flat maps as well as red nodes on the MRI indicate locations surrounding the electrode tip. A comparison between Figures 9A–C also illustrates how the MRI slices are being updated as the virtual electrode is advanced. In this particular penetration, one would hit different parts of V4 at depths of 2 and 5 mm before hitting MT at a depth of 10 mm.
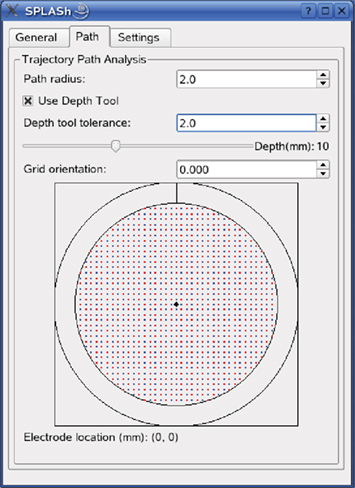
Figure 8. Control interface for simulating electrode trajectories. From top to bottom: “Path radius” defines the maximum distance of visualized nodes from the virtual electrode. “Use Depth Tool” visualizes only nodes near the “tip” of the virtual electrode by constraining the depth. Only nodes whose depth does not deviate more than “Depth tool tolerance” are marked. Depth is measured along the virtual electrode track with zero depth being defined as the intersection of the electrode track with the outer brain surface. The virtual electrode is advanced by moving the slider below “Depth tool tolerance.” The current depth is indicated to the right of the slider and the search results are updated in real-time. “Grid orientation” allows specifying electrode locations relative to the center of the recording chamber in a coordinate system that is rotated with respect to the default coordinate system (see Materials and Methods). The electrode location is specified by clicking on one of the red and blue grid points.
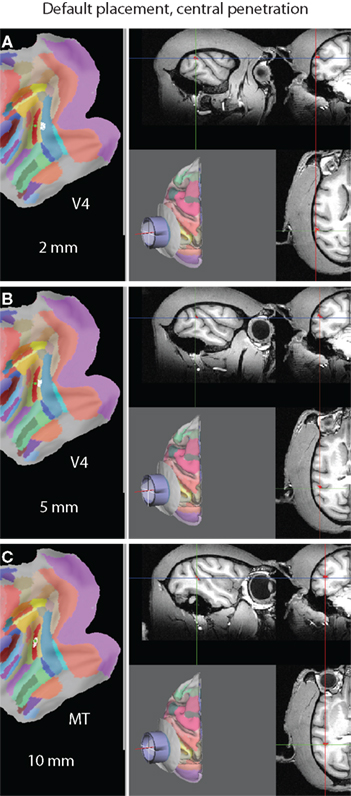
Figure 9. A virtual electrode trajectory along the symmetry axis of the default placement. (A) Hitting V4 at a depth of 2 mm. White nodes on the flat map as well as red nodes on the MRI indicate locations surrounding the virtual electrode tip. The MRI slices intersect at the location of the electrode tip, also marked by the cross-hair cursors. (B) Hitting a different part of V4 at a depth of 5 mm. (C) Hitting MT at a depth of 10 mm. Note that the MRI slices are being updated as the virtual electrode is advanced.
Figure 10 illustrates a virtual electrode track along the central axis of the “straight down” approach (parallel to the Z axis). In this case MT is hit at a depth of 15.5 mm (Figure 10C) after going through area 7a at a depth of 2 mm (Figure 10A) and MST at a depth of 9.5 mm (Figure 10B). The approach “from behind” is illustrated in Figure 11. In this case the electrode would move through V1 (at a depth of 2 mm) and V2 (6 mm) before hitting MT at a depth of 19 mm. Advancing the electrode further would result in hitting FST/TPO at a depth of 25.5 mm. Since the maximum achievable depth in a real electrode penetration is usually limited by the microdrive used, the information about which areas would be hit at what depth can be used to determine which areas could actually be targeted in a real recording.
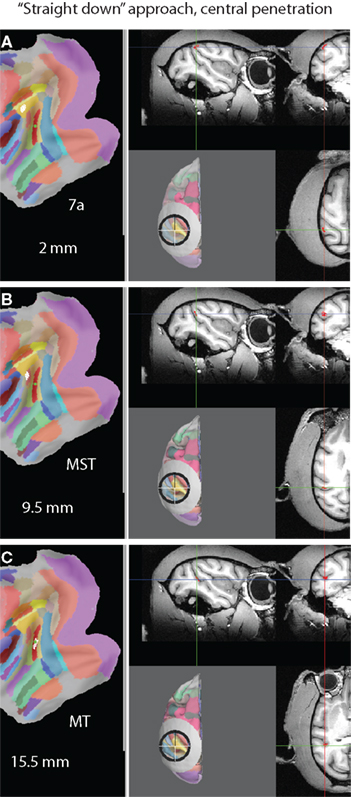
Figure 10. A virtual electrode trajectory along the symmetry axis of the “straight down” approach (elevation and tilt of zero). (A) Hitting area 7a at a depth of 2 mm. (B) Hitting MST at a depth of 9.5 mm. (C) Hitting MT at a depth of 15.5 mm.
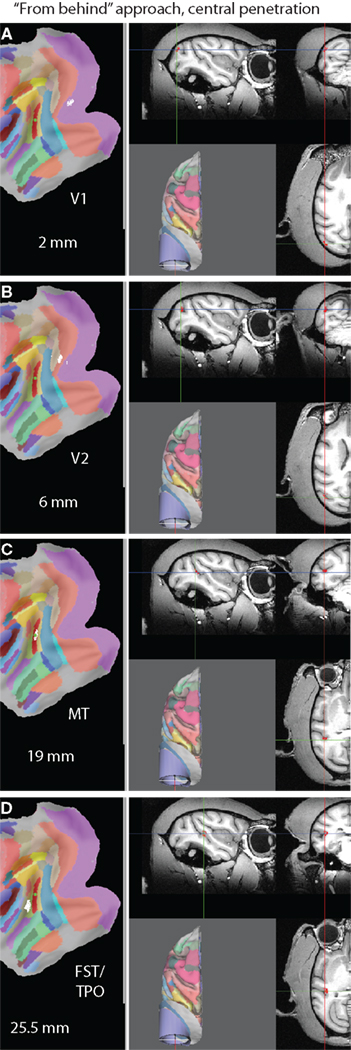
Figure 11. A virtual electrode trajectory along the symmetry axis of the “from behind” approach (elevation of −70° and tilt of zero). (A) Hitting V1 at a depth of 2 mm. (B) Hitting V2 at a depth of 6 mm. (C) Hitting MT at a depth of 19 mm. (D) Hitting FST/TPO at a depth of 25.5 mm.
SPLASh is also able to simulate electrode tracks at eccentric locations within the recording chamber, but still parallel to the central axis. Two such eccentric penetrations for the case of the default recording chamber placement are visualized in Figure 12. The penetration shown on the left side of the figure is for an electrode location 5 mm to the left of the center of the recording chamber (using SPLASh’s default coordinate system for defining electrode locations; see Materials and Methods), the penetration shown on the right side is for an electrode location 5 mm to the right of the center. The desired electrode location is defined using the virtual electrode grid shown in Figure 8. The electrode axis is visualized as a red line in the 3D rendering of the recording chamber. Figures 12A,B illustrate that when inserting an electrode 5 mm to the left of the center a different part of MT than the one that is accessed with a central penetration (see Figure 9C) is hit at a depth of 10 mm after passing through V4. Likewise, another different part of MT is hit at a depth of 8 mm when inserting the electrode 5 mm to the right of the center (Figure 12D).
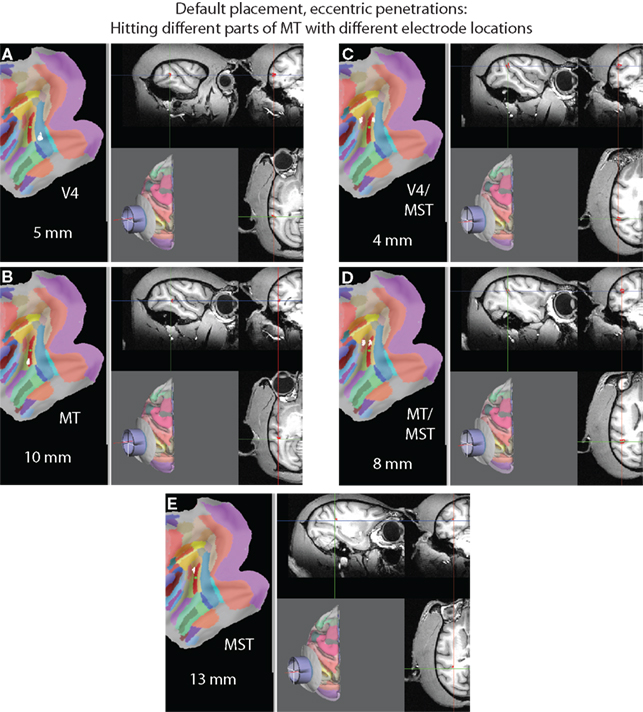
Figure 12. Eccentric virtual electrode tracks when using the default placement. (A) A virtual electrode placed 5 mm to the left of the center of the recording chamber hitting V4 at a depth of 5 mm and (B) MT at a depth of 10 mm. (C) A virtual electrode placed 5 mm to the right of the center of the recording chamber hitting V4/MST at a depth of 4 mm, (D) MT/MST at a depth of 8 mm, and (E) MST at a depth of 13 mm. Note that different parts of MT are accessed when choosing different electrode locations.
Such a configuration, hitting different parts of a cortical area with different electrode locations, might be desirable when one wants to explore different parts of an area in different experimental sessions. However, imagine the following scenario: You have a tight bundle of individually movable electrodes in a multi-electrode drive and you want to record simultaneously from different parts of an area in a single experiment. The default placement would certainly not be optimal to achieve this. However, SPLASh can also help finding an approach that would make exactly this possible. We can ask how the orientation of the recording chamber has to be adjusted for a narrow cylinder around the symmetry axis to cover as much of MT as possible. Figure 13 shows such an approach with an elevation angle of −25° and a tilt angle of +30°. The flat map shows that most of MT (the red area with the green square) is covered by white nodes, which are the nodes that can be accessed with central penetrations.
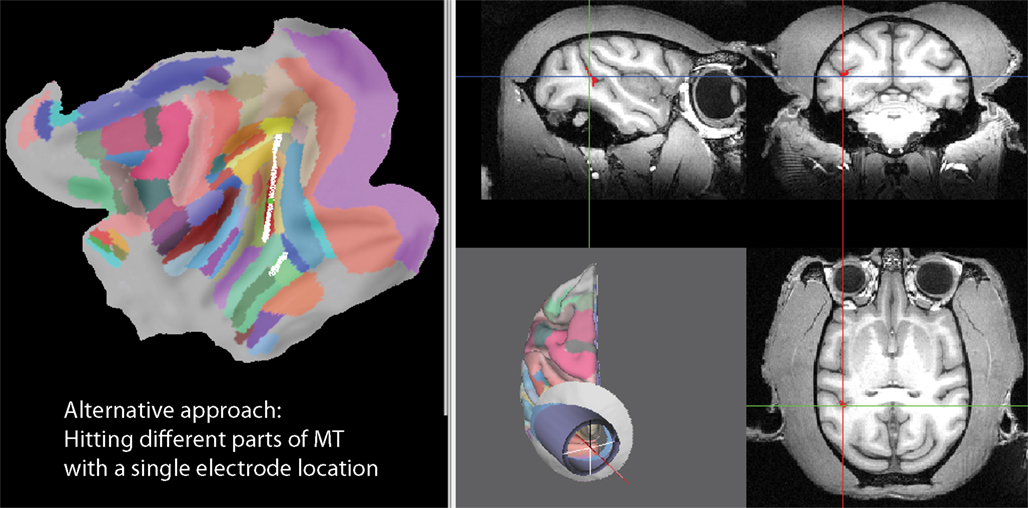
Figure 13. An approach giving access to different parts of a cortical area (in this case MT) with all central penetrations. The elevation (−25°) and tilt (+30°) angles have been adjusted interactively such that the white nodes on the flat map (left side), representing nodes that can be accessed with central penetrations, cover most of the cortical area of interest (in this case MT, shown in red with the green square representing the target location).
Discussion
We have presented SPLASh, a software tool for stereotactic planning of recording chamber placement and electrode trajectories. SPLASh has an easy-to-use graphical interface and allows the user to interactively explore different scenarios. Search results are updated and visualized in real-time as the user changes the orientation of the recording chamber or moves the virtual electrode. Results are visualized on a flat representation of the cortical sheet, which also allows the simultaneous display of atlas information, like identified functional areas, as well as in the actual 3D space in the form of orthogonal slices through the structural MRI volume, building upon Caret’s (Van Essen et al., 2001) visualization capabilities, upon which SPLASh is based. Its interactive design might make SPLASh not only useful for animal researchers, but also for students who want to learn brain anatomy in a hands-on and very practically oriented manner.
Types of Questions that Can be Addressed with the Current SPLASh Functionality
Using a toy example, we have demonstrated in the Section “Results” what types of questions can be addressed with SPLASh. Given that one wants to record from a particular cortical area, there is an infinite number of possible approaches. Which approach should one choose? There are a number of considerations one might want to take into account. For example, how deep an electrode has to be introduced into the brain to record from the target area could be of importance if one wants to minimize the overall impact of the recordings on the neural tissue or if the microdrive used limits the depth of the penetration. To this end SPLASh is able to provide the approach with the shortest possible penetration depth and for all other possible approaches it can measure at what depth the area of interest would be hit. Once a particular approach has been selected, SPLASh provides the stereotactic coordinates of the center of the recording chamber on the skull as well as two angles defining the orientation of the recording chamber in the stereotactic coordinate system, which can be used in surgery for implanting the recording chamber with the help of a stereotactic device.
SPLASh also provides information about what other brain areas, in addition to the original target area, can be accessed with a particular recording chamber placement. Thus, an approach can be planned interactively such that multiple areas of interest could be recorded from using a single recording chamber. Furthermore, SPLASh can also provide information about which other brain areas an electrode has to pass through before hitting the target area. This information is helpful if one wants to avoid particular brain areas. It also helps verifying whether real electrode penetrations after implanting a recording chamber are consistent with the planned approach by making predictions for each possible electrode location in the recording chamber which brain area should be hit at which depth. The physiological properties of neural responses observed during real electrode penetrations can therefore be compared with the expected ones on the basis of these predictions.
SPLASh’s ability to explore virtual electrode trajectories at different locations inside a recording chamber provides further useful planning resources. For example, an approach can be optimized such that different parts of the target area are distributed over as many electrode locations inside the recording chamber as possible. This would maximize the number of possible electrode penetrations for recording from the target area before the area is exhausted. Alternatively, one might want to target different parts of the area of interest simultaneously with a tight bundle of multiple electrodes. In this case one would choose an approach where different parts of the target are spatially arranged along a line that is parallel to the central axis of the recording chamber.
This discussion should have made clear that SPLASh’s interactive design with real-time visualization together with its flexible search parameters allowing the identification of nodes that have a certain maximum user-specified distance (search radius) from any user-specified axis parallel to the central axis of the recording chamber (electrode location) and depth constraints that only report nodes near a user-specified depth (depth of virtual electrode tip) with a user-specified tolerance ensure that SPLASh can be used for addressing a broad range of planning questions. At the same time, it is an easy-to-use tool with an intuitive graphical user interface once the first basic steps have been mastered.
Other Software Tools with Related Functionality
While we are currently not aware of directly comparable software for interactive stereotactic planning of recording chamber placement and electrode trajectories in preparation for recordings from monkey cortex, some tools with related functionality have been released. Monkey Cicerone (Miocinovic et al., 2007a,b) has been designed for planning deep brain stimulation (DBS) experiments. As such, it comes with an atlas of deep brain nuclei, in particular in the basal ganglia or the thalamus, which are popular targets for DBS. Like SPLASh, it provides functionality for stereotactic planning of stimulation chamber placement, and markers representing an electrode at a particular depth and location can be created and visualized. Given that Monkey Cicerone focuses on deep brain nuclei without providing detailed atlases of the cortex or the cerebellum and given that SPLASh relies on the cortical and cerebellar atlases available for Caret with currently no access to an atlas of deep brain nuclei, both tools have to be seen as complementing each other rather than being competitors.
Other efforts have focused on the situation after a recording chamber has already been implanted. Different protocols for mapping the location of an actual recording site onto a brain atlas have been developed. This usually starts with obtaining a structural MRI after the implantation with markers that show up in the MRI being placed inside the recording chamber. Baker et al. (2008) have described how the existing functionality of Caret can be used to achieve the mapping. The procedure involves a manual alignment between the imaged markers in the recording chamber and a user-defined coordinate system for defining the location of a recording site. Recording sites can then be projected onto any brain representation that is available in Caret, including atlas data. Kalwani et al. (2009) have published a procedure that uses a plug-in for AFNI (Cox, 1996) to automatically generate a volume that resembles the cylinder containing all points that can be reached from the implanted recording chamber. This volume can then be visualized in Caret in combination with any available brain representation, and oblique brain slices perpendicular to the long axis of the recording chamber can be used to map individual recording sites.
Plans for Future Extension of SPLASh’s Functionality
SPLASh’s current functionality focuses on the planning process before a recording chamber is actually implanted. The next major step will be to extend the functionality to also make it a useful tool after a recording chamber has already been implanted. The idea is to obtain a structural MRI after the implantation with markers that show up in the MRI being placed inside the recording chamber. Knowing the geometry of these markers, SPLASh should then be able to automatically extract the location and orientation of the recording chamber from the MRI and to use this information to plan electrode tracks based on the actual geometry of the implanted chamber. Thus, the goal is to combine SPLASh’s current pre-op planning functionality with a user-friendly and as automated as possible implementation of the post-op mapping of recording sites (Baker et al., 2008; Kalwani et al., 2009).
Further extensions of the functionality that are currently being considered are the ability to handle multiple electrode trajectories or even multiple recording chambers and the possibility of SPLASh to communicate with microdrive systems to provide an online visualization of electrode tracks during an experiment.
Conflict of Interest Statement
The authors declare that the research was conducted in the absence of any commercial or financial relationships that could be construed as a potential conflict of interest.
Acknowledgment
This work has been supported by NIH core grant EY 12576.
Footnotes
References
Baker, J., Vytlacil, J., Reid, E., and Van Essen, D. (2008). Using Caret to guide single unit physiology. Available at: http://sumsdb.wustl.edu/sums/directory.do?id=6526890&dir_name=MAP_RECORDING_SITES
Cox, R. W. (1996). AFNI: software for analysis and visualization of functional magnetic resonance neuroimages. Comput. Biomed. Res. 29, 162–173.
Desimone, R., and Ungerleider, L. G. (1986). Multiple visual areas in the caudal superior temporal sulcus of the macaque. J. Comp. Neurol. 248, 164–189.
Kalwani, R. M., Bloy, L., Elliott, M. A., and Gold, J. I. (2009). A method for localizing microelectrode trajectories in the macaque brain using MRI. J. Neurosci. Methods 176, 104–111.
Lewis, J. W., and Van Essen, D. C. (2000). Mapping of architectonic subdivisions in the macaque monkey, with emphasis on parieto-occipital cortex. J. Comp. Neurol. 428, 79–111.
Miocinovic, S., Noecker, A. M., Maks, C. B., Butson, C. R., and McIntyre, C. C. (2007a). Cicerone: stereotactic neurophysiological recording and deep brain stimulation electrode placement software system. Acta Neurochir. Suppl. 97, 561–567.
Miocinovic, S., Zhang, J., Xu, W., Russo, G. S., Vitek, J. L., and McIntyre, C. C. (2007b). Stereotactic neurosurgical planning, recording, and visualization for deep brain stimulation in non-human primates. J. Neurosci. Methods 162, 32–41.
Shattuck, D. W., and Leahy, R. M. (2002). BrainSuite: an automated cortical surface identification tool. Med. Image Anal. 6, 129–142.
Van Essen, D. C. (2002). Windows on the brain: the emerging role of atlases and databases in neuroscience. Curr. Opin. Neurobiol. 12, 574–579.
Keywords: electrode trajectories, monkey, recording chamber, software, stereotactic coordinates
Citation: Sperka DJ and Ditterich J (2011) SPLASh: a software tool for stereotactic planning of recording chamber placement and electrode trajectories. Front. Neuroinform. 5:1. doi: 10.3389/fninf.2011.00001
Received: 12 November 2010;
Accepted: 10 March 2011;
Published online: 22 March 2011.
Edited by:
Jan G. Bjaalie, University of Oslo, NorwayReviewed by:
Alexander C. Huk, The University of Texas at Austin, USAJohn Harwell, Washington University School of Medicine, USA
Copyright: © 2011 Sperka and Ditterich. This is an open-access article subject to an exclusive license agreement between the authors and Frontiers Media SA, which permits unrestricted use, distribution, and reproduction in any medium, provided the original authors and source are credited.
*Correspondence: Jochen Ditterich, Center for Neuroscience, University of California, 1544 Newton Ct, Davis, CA 95618, USA. e-mail:amRpdHRlcmljaEB1Y2RhdmlzLmVkdQ==