 Wei Wu1,2
 Diek W. Wheeler1,2 and Gordon Pipa1,2*
- 1 Frankfurt Institute for Advanced Study, Johann Wolfgang Goethe University, Frankfurt am Main, Germany
- 2 Department of Neurophysiology, Max Planck Institute for Brain Research, Frankfurt am Main, Germany
Synchronous neuronal firing has been proposed as a potential neuronal code. To determine whether synchronous firing is really involved in different forms of information processing, one needs to directly compare the amount of synchronous firing due to various factors, such as different experimental or behavioral conditions. In order to address this issue, we present an extended version of the previously published method, NeuroXidence. The improved method incorporates bi- and multivariate testing to determine whether different factors result in synchronous firing occurring above the chance level. We demonstrate through the use of simulated data sets that bi- and multivariate NeuroXidence reliably and robustly detects joint-spike-events across different factors.
1 Introduction
Synchronous neuronal spiking has been proposed as a code that carries, groups, or binds information (von der Malsburg, 1981; Victor and Purpura, 1996; Fetz, 1997; Singer et al., 1997; Singer, 1999; Pillow et al., 2008; Uhlhaas et al., 2009); supports information processing and selection (Fries et al., 2001, 2002; Womelsdorf and Fries, 2007); and maintains and recollects information for short-term memory (Compte et al., 2000; Miller et al., 2003). However, even though this synchrony-coding hypothesis has been investigated intensively for the last two decades, its actual role and importance are still controversially debated. One of the reasons for this ongoing debate has been the lack of tools to identify synchronous activity and to decipher its relative importance compared to complementary features of neuronal spiking, such as the firing rate (Barlow, 1972; Bialek et al., 1991; Bialek and Rieke, 1992; Shadlen and Newsome, 1994, 1998; Brody, 1999; Oram et al., 1999; Baker and Lemon, 2000; Nakahara and Amari, 2002). A second reason for the continuing debate is that one must be able to demonstrate that synchronous activity is indeed involved in information processing.
Recently, however, very important steps have been taken to address these two points. In order to identify relevant synchronous spiking activity, recently developed tools enable the tracking of the temporal modulation of neuronal synchronization (Brown et al., 1998, 2004; Grün et al., 1999, 2002a,b, 2003; Martignon et al., 2000; Aertsen et al., 2001; Kuhn et al., 2003; Kass et al., 2005; Truccolo et al., 2005; Schneider et al., 2006) and the comparison of this temporal modulation to the modulations of other properties of neuronal firing, such as the firing rate (Riehle et al., 1997; Pipa et al., 2007). The use of these tools allows one to demonstrate that the synchronization of spiking activity is often tightly linked to relevant temporal periods of an experiment, which indicates that neuronal synchronization is correlated with processes that underlie neuronal information processing. In 2008, the method NeuroXidence was developed to reliably identify synchronous spiking activity in a large number of simultaneously recorded neurons (more than 100; Pipa et al., 2008, source code available at http://www.NeuroXidence.com). NeuroXidence does not fall prey to the false detection of neuronal synchrony due to properties of the data, such as auto-correlations, strong auto-structure in the spiking activity, or changes in the spiking rate over time and across trials.
Reliably detecting neuronal synchrony, however, is not sufficient for claiming that neuronal synchronization is indeed relevant for neuronal information processing. To test the relevance of synchronous neuronal firing for information processing in the brain, one has to investigate if the presence and strength of synchronous firing are correlated to the state of the neuronal system or to the behavior and the task of the experimental subject (Baker and Gerstein, 2001). To test whether the strength of synchronous activity varies across different factors, i.e., different experimental conditions, we present a new bi- and multivariate extension of the original univariate method, NeuroXidence, which originally tested whether synchronous activity occurs beyond chance for a single experimental condition (Pipa et al., 2008). For a given spiking pattern, this extension enables one to compare the amount and strength of synchronous firing across different factors, in a way that is robust against the rate changes of individual neurons and the rate covariation of groups of neurons and that considers the full auto-structure as well as any trial-by-trial variability. Pipa and Munk (2011) have applied this extension, for the first time, to detect modulations of synchronous firing of cells in the ventral prefrontal cortex, across task conditions, stimuli, and behaviors of an awake monkey performing a short-term memory paradigm.
The basic premise behind the bi- and multivariate extension of NeuroXidence is the determination of the frequency of a certain joint-spike-event (JSE), defined as a specific firing pattern, for each trial and for each experimental/behavioral factor. To account for the stochasticity of spike times, a JSE is defined by a model pattern of precise spike times and a millisecond-scale temporal window, which accounts for the maximal uncertainty around each of these exact spike times (Figure 1). Surrogate data, derived by jittering each individual spike train in the original data, is used to estimate the frequencies of chance JSEs under the H0 assumption that neurons are not coupled on a fine temporal time scale. For each trial and each experimental/behavioral factor, the differences in the frequencies of JSEs between the original and the surrogate data sets are computed. Finally, bi- and multi-variate NeuroXidence tests whether the mean or median of the frequencies of JSEs is significantly different across factors.
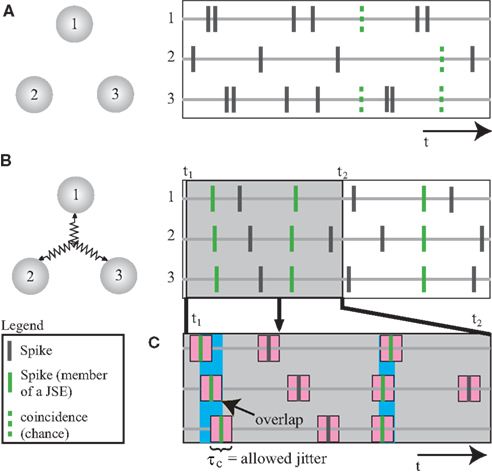
Figure 1. Detection of synchronized firing patterns. (A,B) Numerals 1–3 stand for three neurons or three neuronal populations. The right sub-panel shows the spike trains. Synchronized spikes (marked in green) are defined as joint-spike-events (JSE). (A) The three units are not coupled, so the spike trains exhibit synchronized spikes that occur at the chance level (indicated by dashed green lines). (B) A third-order coupling between three units. (C) A schematic description of a JSE. Spikes, which are defined as belonging to the same JSE, share overlapping regions within the maximally allowed jitter (τc). Modified from a previously published figure (Pipa et al., 2008).
2 Materials and Methods
In order to determine the relationship between the frequency of a certain JSE and the state of the neuronal system, the bi- and multi-variate NeuroXidence contains two main steps: detection and comparison.
The detection step identifies the frequency of JSEs in the original and surrogate data sets. The comparison step tests whether the frequencies of a particular JSE, which are estimated in the detection step, vary across different experimental/behavioral factors. Here, the null hypothesis H0 states that the precise timing of neuronal firing is irrelevant to the state of the neuronal system. The alternative hypothesis (H1) assumes that there are more (or less) coordinated firing events according to different conditions of the system. Therefore, different statistical tests (t-test, Mann–Whitney U test, etc.) are applied to the frequencies of JSEs from different factors to test the null hypothesis.
2.1 Detection of JSEs
In order to detect JSEs in simultaneously recorded spike trains, we define two time-scale parameters, τc and τr. The time scale of synchronous firing determines the parameter τc, which ranges between 1 and 10 ms and defines the expected systematic precision of a JSE. Time scale τc is, therefore, equivalent to the maximal deviation of the individual spikes in the assumed model pattern (Figure 1). The parameter τr defines the lower bound of the rate modulation and is distinguishably slower than τc by a factor of η, which ranges from 2 to 5. Next, surrogate data sets are generated by jittering the original individual spike trains by a random interval τt, n (t indexes the trials, n indexes the neurons), which is determined by either a uniform or Gaussian distribution. The extent of the jittering is on the slow time scale τr, which destroys any fine temporal cross-structure between the spike trains that is less than τr, but maintains the auto-structure and other features of each individual spike train.
We define the identity of a JSE by the set of neurons that exhibits the coordinated firing, and we refer to this set of neurons as a joint-spike pattern (JS-pattern). Here we distinguish the complexity of a JSE (Shadlen and Newsome, 1994), which is defined by the number of neurons participating in the spike pattern, from the order of correlation (Singer et al., 1997; Shadlen and Newsome, 1998; Singer, 1999), which is defined by the number of neurons that are directly coupled and are the primary cause of the coordinated firing. Due to an excess or lack of one or more chance events, the order is not necessarily the same as the complexity.
Between the original and the surrogate data sets, we compute the difference in the raw counts of how many times a specific JS-pattern k appears in trial t of experimental/behavioral factor ξ. This difference is expressed as
where  is the raw count in the original data set, and
  is the raw count in each surrogate data set s. Here,
  and
and  for trial t = 1,2, …,T; JS-pattern k = 1,2, …,K; surrogate s = 1,2, …,S; and experimental/behavioral factor ξ = 1,2, …., M.
2.2 Comparison of JSEs across Different Factors
There exists an underlying distribution of frequencies of JSEs,  for each specific JS-pattern k and experimental/behavioral factor ξ. Under the bivariate condition, we wish to compare the distributions for factors ξ = 1, 2. For each factor ξ, we approximate the distribution
  with the set of mean frequencies defined by equation (1) taken across all trials t,
  To test whether the frequencies of JSEs are different across factors, we define a test statistic that is the difference in frequencies of JSEs across the two factors,

where  is a sample from trial t taken from the set
  for a given experimental/behavioral factor. Because each sample in a given set is independent and identically distributed, the values of
  computed for all the trials can form a set
When  is not zero, there is an excess in the frequency of occurrence of JS-pattern k for trial t in one experimental/behavioral factor or the other. The statistical significance of the differences in the means or medians of the sampled distributions
  is evaluated by t-test or Mann–Whitney U test, respectively. To account for distributions that might have different variances, the Behrens–Fisher t-test is applied instead of the normal Student’s t-test. All future references to t-tests in this manuscript refer to t-tests with unequal variances.
In analogy with the bivariate condition, under the multivariate condition the underlying distribution of frequencies of JSEs  is approximated by forming the sets
  The statistical significance of the differences in the means and medians of the sampled distributions
  across factors is evaluated by analysis of variance (ANOVA) or a Kruskal–Wallis one-way test, respectively. To account for distributions that might have different variances, the Kruskal–Wallis one-way test is highly recommended over an ANOVA. In some simulations, we apply an ANOVA test during the method calibration in order to verify whether or not the test will fail.
Finally, after gathering all of the significance levels for each JS-pattern k, one can evaluate which factor plays the most important role in modulating the strength of synchronous firing.
3 Results
We demonstrate the robustness and sensitivity of this bi- and multi-variate extension of NeuroXidence in two stages. We first present results for the bivariate case that tests the modulation of spike–spike synchronization across exactly two conditions or factors. Secondly, we examine the multivariate case, which tests for modulations of spike–spike synchronization across more than two conditions.
3.1 Part I: Bivariate Neuroxidence
We establish the robustness of the bivariate method, by showing false-positive rates estimated for different spike-train models. Next, we reveal the sensitivity and test power of the presented method and discuss the detectability of sub-patterns and supra-patterns of synchronized neuronal ensembles. In the last step, we demonstrate the robustness of the method when applied to simulated spike trains that contain various properties, which often occur in real neuronal firing activities, such as rate covariations, and regular or bursty firing.
3.1.1 False positives for two stationary processes
Two simulated data sets are generated for the bivariate case. The generation of simulated data is described in detail in Pipa et al. (2008), but we provide a brief description here. Each of the two simulated data sets contains eight neurons, and each spike train is generated by an independent and homogeneous Poisson process. Such spike trains are generated for each of the two experimental conditions being examined. For each condition, we apply NeuroXidence to detect the occurrence frequencies of JSEs for each JS-pattern and for S surrogates. Next, the test level is set for comparing the corrected frequencies of JSEs across the two experimental conditions. Therefore, NeuroXidence yields an estimate of whether or not JS-patterns show a significant difference across the two conditions.
In order to study the effect of rate covariation on the estimation of JSEs, two scenarios are used to generate the rate profile for each Poisson model.
Scenario I: Two simulated Poisson models exhibit rate covariation, such that the rate profiles of the two simulated data sets are identical.
Scenario II: Two simulated Poisson models exhibit no rate covariation, such that the rate profiles of the two simulated data sets are different. For example, the mean firing rate of one simulated data set is chosen as 15 spikes/s, while the other changes from 7 to 90 spikes/s.
For both scenarios, bivariate NeuroXidence is applied to detect an excess or lack of JSEs between the two sets of model data (Figures 2 and 3). Based on the parameter analysis and Appendix 6 recommendations from the original NeuroXidence publication by Pipa et al. (2008), the standard parameters for both scenarios include a sliding window with a duration of l = 200 ms, T = 50 trials, a mean spike rate of 15 spikes/s, and η equals 5. Scenario I utilizes 20 surrogates samples, and 15 different combinations of parameters are derived for the model data by taking all combinations of the number of trials (T = 20, 50, 100) and the covarying mean spiking rates (r1 = r2= 7, 10, 30, 60, 90 spikes/s). Scenario II uses 1 surrogate sample, and 15 different parameter combinations are derived by varying the number of trials (T = 20, 50, 100) and the second mean spiking rate (r1 = 15, r2 = 7, 10, 30, 60, 90 spikes/s). In both scenarios, the simulated data sets are generated in order to determine the false-positive rate for JS-patterns of complexities 2–6.
In both scenario I and II, in order to compute the false-positive rate, eight simulated spike trains are generated for each condition, which are taken to be signals from eight channels. The number of JS-patterns for each condition is defined by combinations of the different spike trains. In this case, there are 247 JS-patterns, including all second-order to eighth-order JS-patterns. By comparing the occurrence frequencies of these 247 JS-patterns across two conditions with a selected test level, some of the JS-patterns shows a significant difference between the two conditions. After gathering this information for JS-patterns of the same complexity, one can determine the false-positive rate for each complexity of JS-pattern. This procedure is repeated 200 times resulting in the final percentile plots for scenarios I and II (Figures 2 and 3).
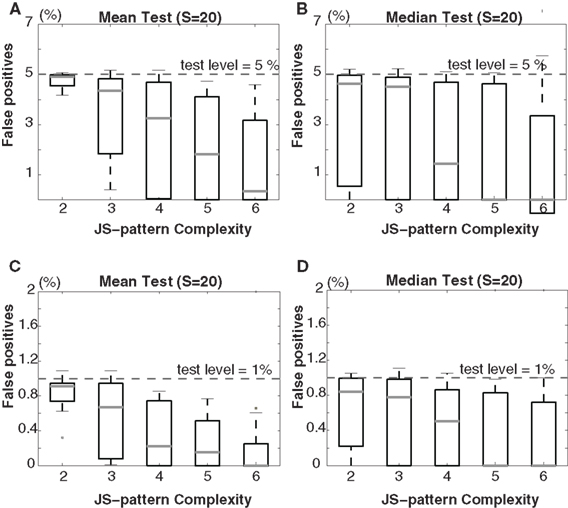
Figure 2. Scenario I: Percentage of false-positives estimated by bivariate NeuroXidence in the detection of JS-patterns of complexity 2 to 6 between two models with covarying firing rates. A comparison of (A) the means and (B) the medians for a test level of 5%, and a comparison of (C) the means and (D) the medians for a test level of 1%. t-Tests are used to compare the means, and Mann–Whitney U tests are used to test the medians. The standard set of parameters for scenario I is defined by 50 trials (T), a mean spike rate of 15 spikes/s (r), 20 surrogates samples (S), and η equal to 5. From the standard parameter set, 15 different combinations of parameters are derived by using all combinations of the number of trials (T = 20, 50, 100) and the mean covarying spiking rates (r1 = r2 = 7, 10, 30, 60, 90 spikes/s).
In both scenarios, none of the results from the model data sets for any of the parameter combinations exceed the chance level, for either a test level of 5% (Figures 2A,B and 3A,B) or 1% (Figures 2C,D and 3C,D), according to both t-tests (Figures 2A,C and 3A,C) and Mann–Whitney U tests (Figures 2B,D and 3B,D). The false-positive rates are much smaller for the high-complexity JS-patterns compared to the rates for low-complexity JS-patterns. When there is no rate-covariation between two conditions, as in scenario II, increasing the number of surrogates above 1 leads to a biased estimate of the excess or lack of JSEs due to the skewness of the distribution of JSEs. Setting S = 20 for non-covarying rates results in a false-positive rate that is above the chance level (data not shown). Therefore, if there is no rate-covariation between two conditions, the surrogate number should be set to 1 to ensure a reasonable false-positive rate. By properly adjusting the number of surrogates in this way, bivariate NeuroXidence provides a conservative method for detecting the excess or lack of JSEs between two groups of neurons, no matter whether rate-covariations exist between the groups or not.
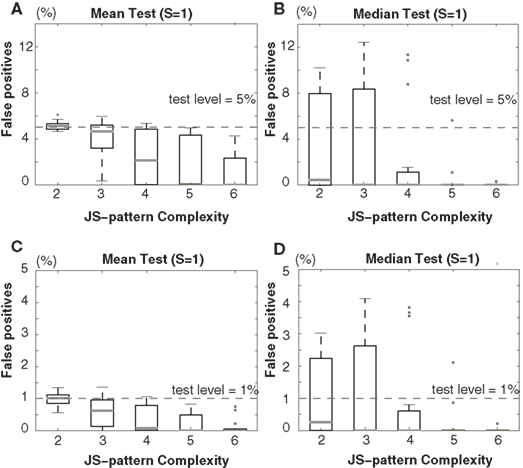
Figure 3. Scenario II: Percentage of false-positives estimated by bivariate NeuroXidence in the detection of JS-patterns of complexity 2 to 6 between two models with different firing rates. A comparison of (A) the means and (B) the medians for a test level of 5%, and a comparison of (C) the means and (D) the medians for a test level of 1%. t-Tests are used to compare the means, and Mann–Whitney U tests are used to test the medians. The standard set of parameters for scenario II is defined by 50 trials (T), a mean spike rate of 15 spikes/s (r), one surrogate sample (S), and η equal to 5. From the standard parameter set, 15 different combinations of parameters are derived by using all combinations of the number of trials (T = 20, 50, 100) and the second mean spiking rate (r1 = 15, r2 = 7, 10, 30, 60, 90 spikes/s).
3.1.2 Test power for two stationary processes
To assess the test power of bivariate NeuroXidence, one simulated data set is generated by a single-interaction process based on a Poisson process (Fries et al., 2001), while the other is generated by an independent and homogenous Poisson process. Each data set contains eight simultaneous spike trains. For the single-interaction process, correlated spike trains were characterized by a background rate, which corresponds to the independent spiking of neurons, and by a JSE rate, which defines the expected frequency of the JS-pattern of interest.
The standard parameter set is chosen as 50 trials (T), a background spike rate of 15 spikes/s (r), 20 surrogates (S), and η equals 5. To study how the test power of bivariate NeuroXidence is affected by the number of trials (T = 20, 50, 100), the background spike rates (r1 = r2 = 10, 15, 30, 60, 90 spikes/s), and the number of surrogates (S = 1, 20, 50), each parameter is varied in turn. The test power is derived for JS-patterns of complexity 2–6, with a test level set to 5%. It is clear in Figure 4 that an increase in the number of trials leads to an increase of the test power, as exhibited by the leftward shift and increase in steepness of the curves. With an increase in the background rate, more JSEs are required to achieve a high test power, as demonstrated by the rightward shift and decrease in steepness of the curves. However, for higher complexity patterns, this effect is reduced. For lower complexity patterns, a larger number of surrogates (for example, S = 20) is required to reliably detect the excess of JSEs between the two conditions, while for higher complexity patterns, the number of surrogates has no effect on the test power. Thus, S = 1 is a reasonable choice for higher complexity JS-patterns.
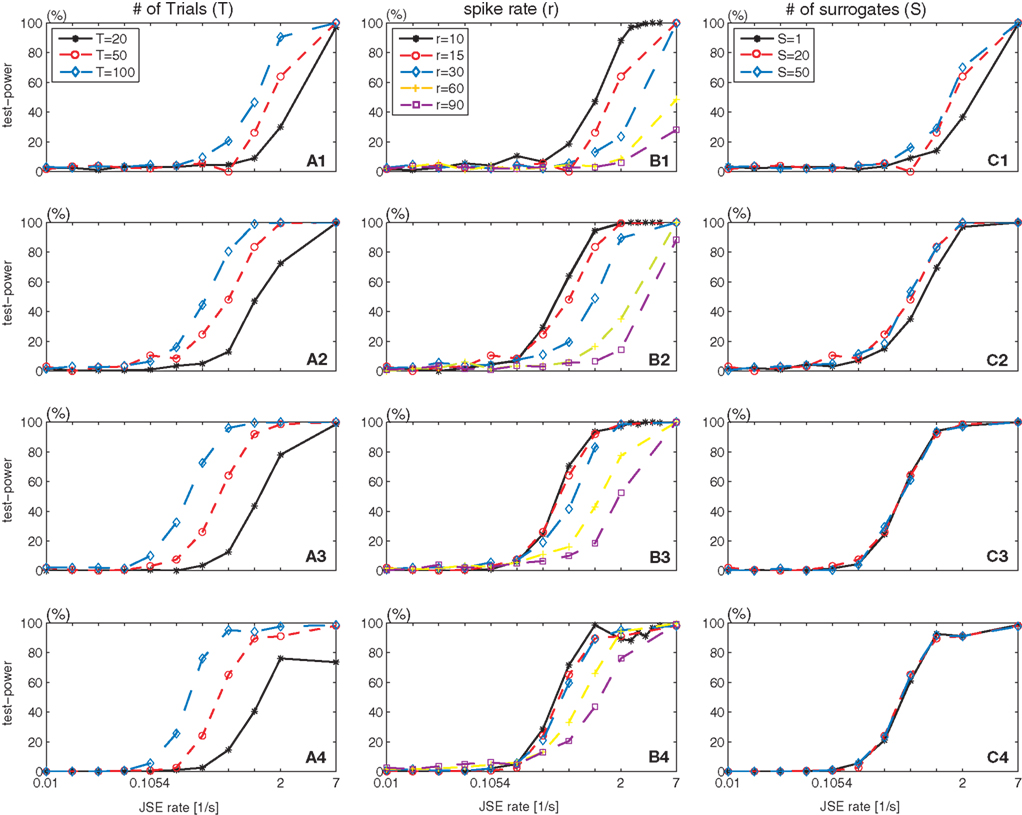
Figure 4. Test power of bivariate NeuroXidence in relation to the number of trials (T), spike rate (r), and number of surrogates (S). Rows 1–4 show the test-power dependencies on the complexities of the analyzed JS-patterns with complexities from 2 to 5. (A1–A4) Variations in the number of trials T, (B1–B4) variations in the background spike rate r, and (C1–C4) variations in the number of surrogates S from the standard parameter set (T = 50, r = 15 spikes/s, S = 20, η = 5, l = 200 ms).
3.1.3 Sub- and supra-patterns of induced JS-patterns
To study the different occurrence frequencies of sub- and supra-patterns between two conditions, a single-interaction process and an independent and homogenous Poisson process were used to generate two simulated data sets. Each data set contained 50 trials of eight simultaneous spike trains. The JS-patterns induced by the single-interaction process are called mother-patterns. Bivariate NeuroXidence is then applied to evaluate the occurrence frequencies between the two conditions of any JS-patterns caused by mother-patterns.
For mother-patterns with a complexity greater than 2, sub-patterns are expected to be detected. However, if the mother-pattern is the only reason for the existence of sub-patterns, then the test power of the sub-patterns should decrease as the complexity of the sub-patterns decreases. Supra-patterns are also induced by a mother-pattern, but these are generated by the occurrence of spikes from additional neurons, which by chance coincide with the mother-pattern. Thus, the occurrence frequency of supra-patterns is at most that of the mother-pattern. Moreover, the test power of supra-patterns is expected to decrease as the complexity of the supra-patterns increases (Figure 5).
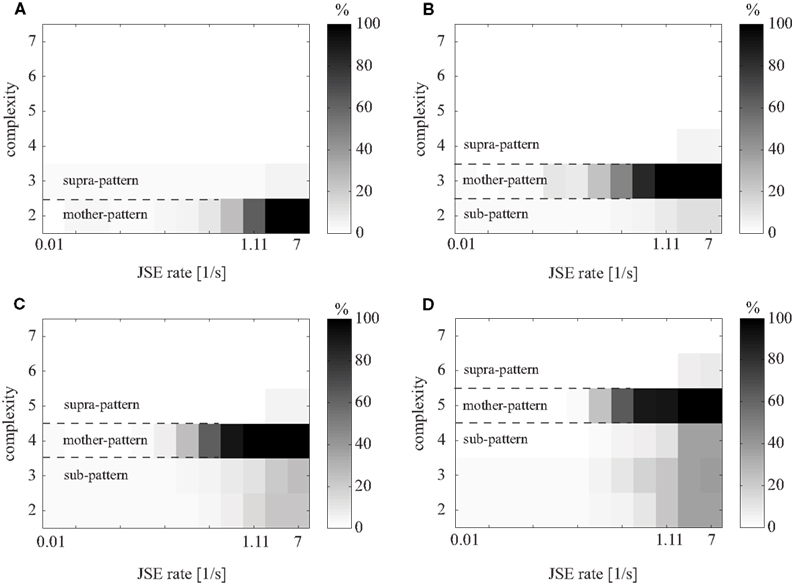
Figure 5. Test power of bivariate NeuroXidence for an induced mother-pattern and its sub- and supra-patterns. Two simulated data sets were generated as two different conditions. Each sub-figure shows the gray-coded test power of a certain mother-pattern, all sub-patterns of lower complexities, and all supra-patterns of higher complexities. The excess rate of JSEs in one condition, which corresponds to the mother-pattern, is given on the x-axis. The standard parameters were chosen as T = 50 trials, background spike rate r = 15 spikes/s, S = 20 surrogates, and η = 5. (A–D) Shows the variations of mother-patterns with complexity 2–7.
3.1.4 False positives for a non-stationary process
In order to study how non-stationarity might affect the ability of bivariate NeuroXidence to detect differences in JSE frequencies between two conditions, two simulated data sets are generated by the same non-stationary processes. Different processes are used to generate the data in 11 separate periods, each 2 s in length, in order to model some common features that are observed in real data sets, such as random spiking modeled by an inhomogeneous and independent Poisson process (period 1), regular spiking modeled by a γ-process (period 2), low rates (period 3, 4), rate modulation (periods 5–10), latency co-variation of rate responses across neurons (periods 8, 10), and trial-by-trial variability of firing rates (period 11; Figure 6). Each of the simulated data sets contains 50 trials of 18 simultaneous spike trains and are used to calculate percentages of false positives of JSEs.
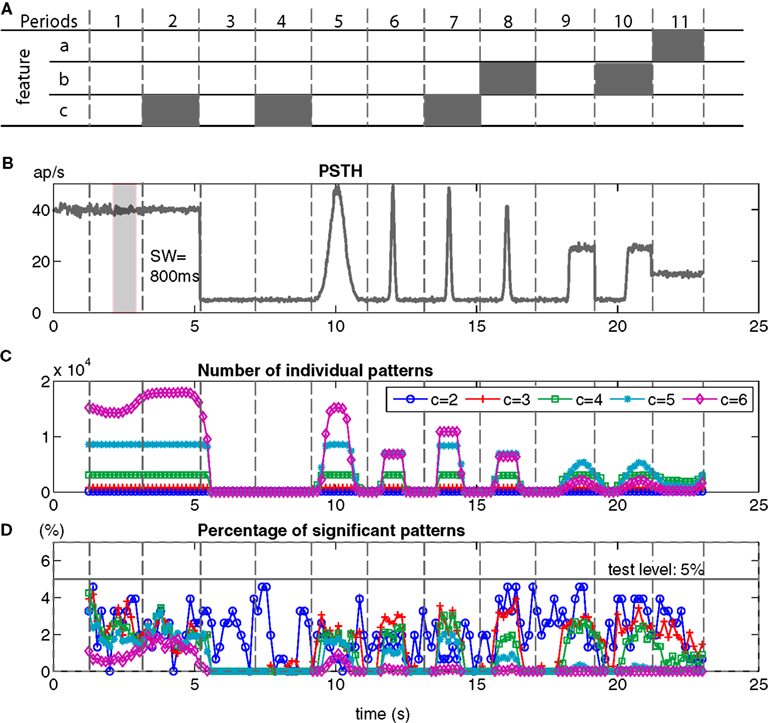
Figure 6. False-positives for two non-stationary processes evaluated by bivariate NeuroXidence. Two simulated data sets are generated and each consists of 50 trials of 18 simultaneous spike trains. (A) Two simulated data sets consist of 11 periods, each 2 s in length. Each period is modeled by different features, which are used to generate the spike trains. An inhomogeneous and independent Poisson process was used as a standard model, and three additional features were added as modifications. Feature a (period 11) describes the changing rates across trials and neurons, such that neurons 1–9 were modeled by a homogenous Poisson process with a background rate of 15 spikes/s, while the rates of neurons 10–18 changed from trial-to-trial from 15 to 30 spikes/s. Feature b (periods 8, 10) indicates latency covariations, where the latency for each trial, for all of the neurons, varies by a random amount between 0 and 100 ms. Feature c (periods 2, 4, 7) represents inhomogeneous gamma processes, with shape factor γ = 7, instead of Poisson processes. (B) The peristimulus time histogram (PSTH) displays the rate profile of the non-stationary processes. During period 5, the spike rate is modulated from 5 to 50 spikes/s with a Gaussian shape with σ = 250 ms, and during periods 6, 7, and 8, σt = 50 ms. The spike rates in periods 9 and 10 were modulated from 5 to 30 spikes/s by a step function. (C) The number of individual JS-patterns of complexities 2–6 that were detected in each sliding window (τc = 5 ms, “SW” = sliding window = 800 ms). (D) The percentage of JS-patterns that show significantly different occurrence frequencies between the two conditions (test level 5%).
Bivariate NeuroXidence is applied to the simulated data sets with a sliding window of length 800 ms. The null hypothesis (H0) is defined as there being no difference in the occurrence frequencies of JSEs between two conditions for complexities 2 to 6. Based on the results of hypothesis tests for each occurring JS-pattern, we derive the percentage of JS-patterns that show significantly different occurrence frequencies between the two conditions. In order to make comparisons across complexities, the number of significant JS-patterns for each complexity value is normalized by the total number of JS-patterns for the corresponding complexity.
The simulated spike trains for the two conditions are generated by the same non-stationary processes for all of the time periods, which means that H0 should not be rejected, or, put another way, any excess or lack of JSEs between the two conditions should stay under the chance level. The actual-false-positive rate, which is the percentage of false rejections of H0 (Bialek and Rieke, 1992), is clearly below test level (5%) for all complexities and throughout all sliding windows, during all of the periods (Figure 6D). Therefore, bivariate NeuroXidence is a conservative way to detect the excess or lack of JSEs between two conditions for non-stationary processes. The false-positive rates are not affected by low rates, rate modulation, latency variability, or trial-to-trial rate changes. Moreover, different processes (g-process, Poisson process), which are used to generate the spike trains, do not cause extra false positives to be detected by bivariate NeuroXidence.
3.2 Part II: Multivariate Neuroxidence
Next we present results demonstrating the robustness and sensitivity of the multivariate version of the new method for testing modulations of spike–spike synchronization across more than two experimental conditions. We start with results demonstrating the robustness of this new multivariate NeuroXidence, by showing false-positive rates estimated for different spike-train models. Lastly, we demonstrate the sensitivity and test power of the presented method.
3.2.1 False positives for stationary processes
Six simulated data sets are generated to represent six different conditions, where each data set contains eight neurons, and each spike train is generated by an independent and homogenous Poisson processes. Multivariate NeuroXidence is then applied to evaluate the false positives due to an excess or lack of JSEs among these six conditions. Two scenarios are applied to generate the rate profiles of the Poisson spike trains for all of the conditions.
Scenario I: Six simulated Poisson models exhibit rate covariation, such that the rate profiles of the six simulated data sets are identical.
Scenario II: Six simulated Poisson models exhibit partial rate covariation, such that the rate profile of one simulated data set is chosen differently from the other five, which covary.
For both scenarios, multivariate NeuroXidence is applied to six simulated data sets to detect an excess or lack of JSEs among the six sets of model data (Figures 7 and 8). As with the bivariate analysis, the standard parameters for both scenarios include a sliding window with a duration of l = 200 ms, T = 50 trials, a mean spike rate r = 15 spikes/s, and η = 5. Scenario I utilizes S = 20 surrogates samples, and eight different combinations of parameters are derived for the model data by varying, in turn, the number of trials (T = 20, 50, 100) and the mean spiking rates (r1 = r2 = r3 = r4 = r5 = r6 = 7, 10, 30, 60, 90 spikes/s). Scenario II uses S = 1 surrogate sample, and eight different combinations of parameters are derived by varying, in turn, the number of trials (T = 20, 50, 100) and the second through sixth mean spiking rates (r1 = 15, r2 = r3 = r4 = r5 = r6 = 7, 10, 30, 60, 90 spikes/s). In both scenarios, the simulated data sets are generated in order to determine the false-positive rate for JS-patterns of complexities 2–6.
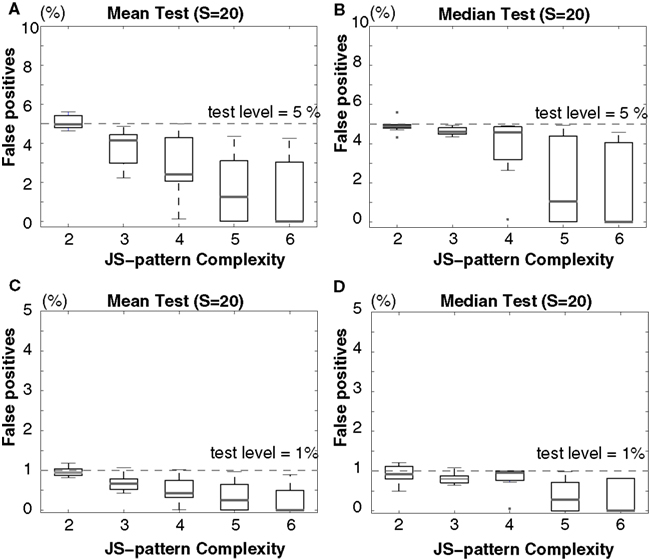
Figure 7. Scenario I: Percentage of false-positives estimated by multivariate NeuroXidence in the detection of JS-patterns of complexity 2 to 6 among six models with covarying firing rates. A comparison of (A) the means and (B) the medians for a test level of 5%, and a comparison of (C) the means and (D) the medians for a test level of 1%. ANOVAs are used to compare the means, and Kruskal–Wallis U tests are used to test the medians. The standard set of parameters is defined by 50 trials (T), a mean spike rate of 15 spikes/s (r), 20 surrogates samples (S), and η equals 5. From the standard parameter set, eight different combinations of parameters were derived by varying, in turn, the number of trials (T = 20, 50, 100) and the mean spiking rates (r1 = r2 = r3 = r4 = r5 = r6 = 7, 10, 30, 60, 90 spikes/s).
In both scenarios, none of the results from the model data sets for any of the parameter combinations exceed the chance level, for either a test level of 5% (Figures 7A,B and 8A,B) or 1% (Figures 7C,D and 8C,D) according to both ANOVAs (Figures 7A,C and 8A,C) and Kruskal–Wallis tests (Figures 7B,D and 8B,D). The false-positive rate decreases with the increase of the number of surrogates. As is the case for bivariate NeuroXidence, when the surrogate number is set to 1, multivariate NeuroXidence provides a conservative method for detecting the excess or lack of JSEs among six groups of neurons, no matter whether rate-covariations exist among the groups or not.
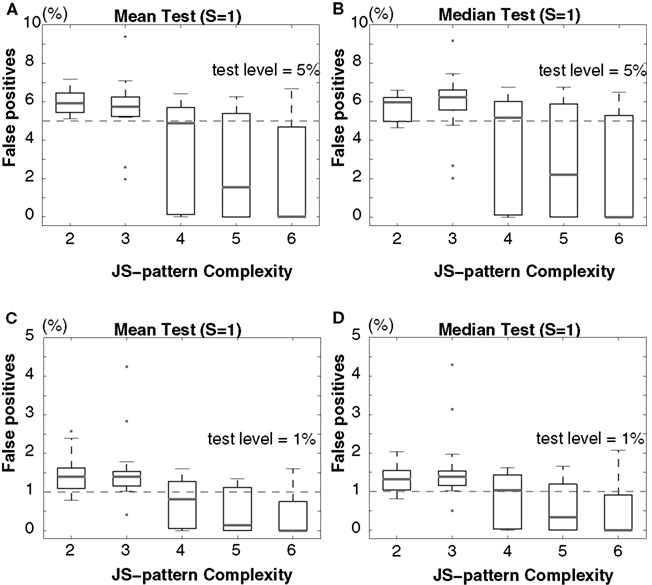
Figure 8. Scenario II: Percentage of false-positives estimated by multivariate NeuroXidence in the detection of JS-patterns of complexity 2 to 6 among six models with partially covarying firing rates. A comparison of (A) the means and (B) the medians for a test level of 5%, and a comparison of (C) the means and (D) the medians for a test level of 1%. ANOVAs are used to compare the means, and Kruskal–Wallis U tests are used to test the medians. The standard set of parameters is defined by 50 trials (T), a mean spike rate of 15 spikes/s (r), one surrogate sample (S), and η equals 5. From the standard parameter set, eight different combinations of parameters were derived by varying, in turn, the number of trials (T = 20, 50, 100) and the second through sixth mean spiking rates (r1 = 15, r2 = r3 = r4 = r5 = r6 = 7, 10, 30, 60, 90 spikes/s).
3.2.2 Test power for the multivariate case
To assess the test power of multivariate NeuroXidence, one simulated data set is generated by a single-interaction process based on a Poisson process (Fries et al., 2001), while five other data sets are generated by independent and homogenous Poisson processes. Each data set contains eight simultaneous spike trains. For the single-interaction process, correlated spike trains were characterized by a background rate, which corresponds to the independent spiking of neurons, and by a JSE rate, which defines the expected frequency of the JS-pattern of interest.
The standard parameter set is chosen as 50 trials (T), a background spike rate of 15 spikes/s (r), and η equals 5. Six parameter sets are used to study how the test power of multivariate NeuroXidence is affected by the number of trials (T = 20, 50, 100) and the number of surrogates (S = 1, 20). The test power is derived for JS-patterns of complexity 2–6, with a test level set to 5%. It is clear in Figure 9 that an increase in the number of trials leads to an increase of the test power, as exhibited by the leftward shift and increase in steepness of the curves. When the number of surrogates changes from 20 to 1, the detection of extra JSEs for either higher or lower complexity values shows only subtle changes, which means multivariate NeuroXidence is sensitive enough to detect small differences in the JSE frequencies for each JS-pattern, among several conditions. Therefore, the number of surrogates can be set to 1 without harming the test power of multivariate NeuroXidence.
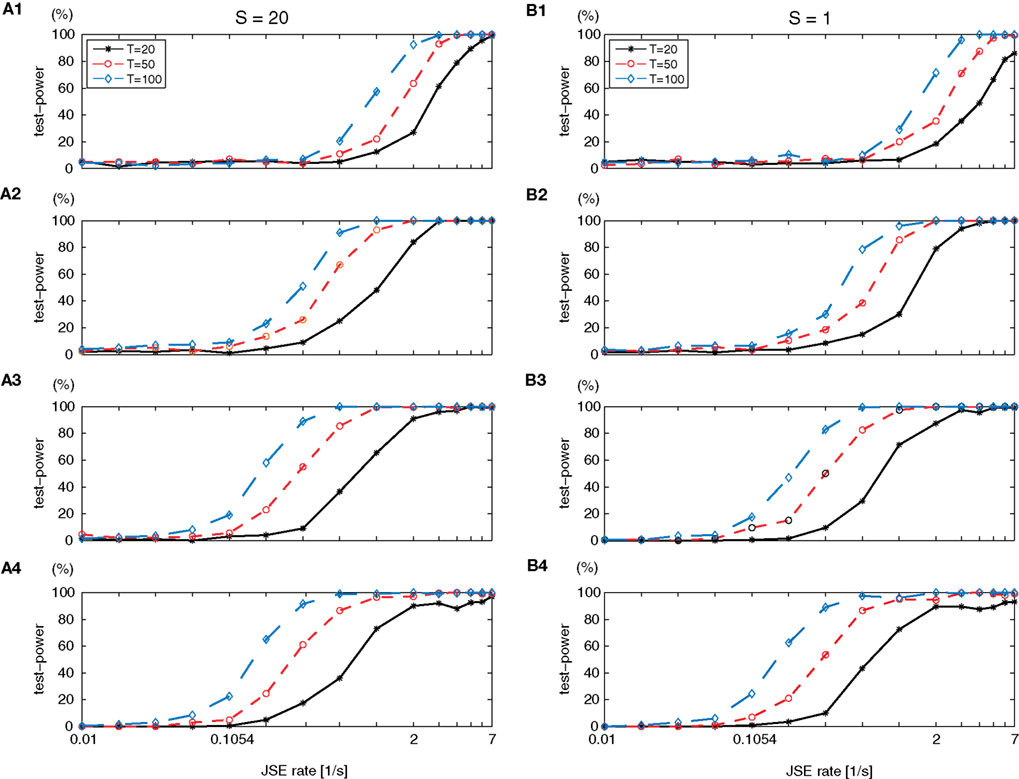
Figure 9. Test power of multivariate NeuroXidence in relation to the number of trials (T) and the number of surrogates (S). One simulated data set was modeled as a single-interaction process based on a Poisson process, while the other five simulated data sets were generated by independent and homogenous Poisson processes. Rows 1–4 show the test-power dependencies on the complexities of the analyzed JS-patterns with complexities from 2 to 5. (A1–A4) variations in the number of trials T with the number of surrogates S = 20, and (B1–B4) variations in the number of trials T with the number of surrogates S = 1, from a standard parameter set (T = 50 trials, background spike rate of r = 15 spikes/s, and η = 5.
4 Discussion
NeuroXidence reliably and robustly detects synchronous firing patterns, beyond those expected by chance, for the univariate case (Pipa et al., 2008). However, the originally proposed procedure is not suitable for comparing the modulation of synchronous firing strength across experimental or behavioral factors, nor is it robust against features that might induce false positives to such an estimate. Here we have extended NeuroXidence to analyze bi- and multi-variate cases, which enables a comparison of an excess or lack of JSEs across different experimental or behavioral factors. This new variation of NeuroXidence considers the full auto-structure of each spike train and the trial-to-trial variability; moreover, these extensions correct for the effects of rate-covariation among groups of neurons, low firing rates, fast rate modulation, regular spiking defined by a γ-process, and latency co-variation of rate responses across neurons. After calibrating bi- and multi-variate NeuroXidence on simulated data sets, the new extension reliably detects an excess or lack of JSEs due to different experimental or behavioral factors, for both stationary and non-stationary processes. Moreover, this extension to NeuroXidence maintains a high sensitivity for detecting different modulations of the JSEs.
The procedure for applying bi- and multi-variate NeuroXidence consists of two main parts: detection of the JSEs, whose occurrence frequencies are above the chance level; and comparison of the frequency of JSEs across different experimental/behavioral factors. The latter finds the relationship between the strength of synchronous firing and the neuronal system state. In order to achieve this goal, different statistical tests are applied to the simulated data sets at each step of the procedure. The statistical test applied during the detection step is described in the original NeuroXidence article (Pipa et al., 2008), which focuses on the distinction between the chance level of coordinate firing and the underlying synchronous firing events. Because different features of spike trains, such as the auto-structure of each spike train, the rate-covariation among groups of neurons, the low firing rate, etc., might effect an estimate of the rate of coordinated firing events, the chance level for coordinated firing is estimated directly from the surrogate data sets. The statistical test in the comparison step focuses on the different frequencies of the JSEs, which result from different experimental/behavioral factors. In order to evaluate the differences, we compare the occurrence frequency of the same JS-pattern k, for each trial t, across the different factors ξ. Different statistical tests (t-tests, Mann–Whitney U tests, ANOVAs, and Kruskal–Wallis one-way tests) are applied to evaluate whether coordinated firing events are the same across conditions or not.
There are three important parameters for bi- and multi-variate NeuroXidence: the time scale τc, the time scale τr, and the surrogate number S. The first time scale, τc, defines the precision of synchronous events to be within the 1- to 10-ms range. The second time scale, τr, establishes the lower bound of rate covariations, and it is defined to be η times slower than τc. The parameter S defines how many surrogates need to be generated to estimate the frequencies of JSEs that are expected by chance. This parameter is the most important one, when the mean firing rate is not the same for different conditions.
Based on equation (1), surrogate data sets are generated by jittering the original spike trains to estimate the chance level of frequencies of JSEs [expressed as  ]. The amount of jitter applied to the original spike train is defined by τr. However, the distribution of the frequencies of JSEs in the S surrogate data sets is not symmetrical. The skewness of the distribution, which will decrease as the mean firing rate increase, leads to a biased estimate of the underlying synchronous firing events. Therefore, by setting the number of surrogates to 1, both bi- and multi-variate NeuroXidence are able to maintain a high test power and low false-positive rate, thereby ensuring a non-biased estimate of the JSEs for each factor.
Based on the test power of simulated data sets, an average of 2 JSEs/s difference in the occurrence frequencies of JSEs, among several conditions, can be detected with bi- and multi-variate NeuroXidence. Given more trials and more conditions, the test power surpasses 90% when the JSE rate is as low as 0.6 JSEs/s. In general, the conservative and sensitive properties of bi- and multi-variate NeuroXidence ensure that any differences in the modulation of synchronous firing strength, among several experimental or behavioral factors, can be reliably detected.
5 Conclusion
Expanding upon the previously published univariate NeuroXidence method (Pipa et al., 2008), here we present bi- and multi-variate NeuroXidence, which is designed to detect the lack or excess of JSEs across different experimental or behavioral factors. After being calibrated on simulated data sets, the extension exhibits its reliable and robust detection of synchronous firing patterns across different conditions, for both stationary and non-stationary processes. Thus, bi- and multi-variate NeuroXidence provides a new approach for evaluating different strengths of synchronous firing across experimental data sets.
Conflict of Interest Statement
The authors declare that the research was conducted in the absence of any commercial or financial relationships that could be construed as a potential conflict of interest.
Acknowledgments
Hertie Foundation and European Commission Project GABA (FP6-NEST Contract 043309) and EU-project PHOCUS (FP7-FET-Open 240763).
References
Aertsen, A., Diesmann, M., Gewaltig, M. O., Grün, S., and Rotter, S. (2001). “Neural dynamics in cortical networks – precision of joint-spiking events,” in Comlexity in Biological Information Processing: Novartis Foundation Symposium, eds G. R. Bock, and J. A. Goode (Chichester: John Wiley & Sons, Ltd.), 239, 193–204.
Baker, S. N., and Gerstein, G. L. (2001). Determination of response latency and its application to normalization of cross-correlation measures. Neural Comput. 13, 1351–1377.
Baker, S. N., and Lemon, R. N. (2000). Precise spatiotemporal repeating patterns in monkey primary and supplementary motor areas occur at chance levels. J. Neurophysiol. 84, 1770–1780.
Barlow, H. B. (1972). Single units and sensation: a neuron doctrine for perceptual psychology? Perception 1, 371–394.
Bialek, W., and Rieke, F. (1992). Reliability and information transmission in spiking neurons. Trends Neurosci. 15, 428–434.
Bialek, W., Rieke, F., De Ruyter van Steveninck, R. R., and Warland, D. (1991). Reading a neural code. Science 252, 1854–1857.
Brown, E. N., Frank, L. M., Tang, D., Quirk, M. C., and Wilson, M. A. (1998). A statistical paradigm for neural spike train decoding applied to position prediction from ensemble firing patterns of rat hippocampal place cells. J. Neurosci. 18, 7411–7425.
Brown, E. N., Kass, R. E., and Mitra, P. P. (2004). Multiple neural spike train data analysis: state-of-the-art and future challenges. Nat. Neurosci. 7, 456–461.
Compte, A., Brunel, N., Goldman-Rakic, P. S., and Wang, X.-J. (2000). Synaptic mechanisms and network dynamics underlying visuospatial working memory in a cortical network model. Cereb. Cortex 10, 910–923.
Fries, P., Reynolds, J. H., Rorie, A. E., and Desimone, R. (2001). Modulation of oscillatory neuronal synchronization by selective visual attention. Science 291, 1560–1563.
Fries, P., Schröder, J. H., Roelfsema, P. R., Singer, W., and Engel, A. K. (2002). Oscillatory neuronal synchronization in primary visual cortex as a correlate of stimulus selection. J. Neurosci. 22, 3739–3754.
Grün, S., Diesmann, M., and Aertsen, A. (2002a). Unitary events in multiple single-neuron spiking activity: I. Detection and significance. Neural Comput. 14, 43–80.
Grün, S., Diesmann, M., and Aertsen, A. (2002b). Unitary events in multiple single-neuron spiking activity: II. Nonstationary data. Neural Comput. 14, 81–119.
Grün, S., Diesmann, M., Grammont, F., Riehle, A., and Aertsen, A. (1999). Detecting unitary events without discretization of time. J. Neurosci. Methods 94, 67–79.
Grün, S., Riehle, A., and Diesmann, M. (2003). Effect of cross-trial nonstationarity on joint-spike events. Biol. Cybern. 88, 335–351.
Kass, R. E., Ventura, V., and Brown, E. N. (2005). Statistical issues in the analysis of neuronal data. J. Neurophysiol. 94, 8–25.
Kuhn, A., Aertsen, A., and Rotter, S. (2003). Higher-order statistics of input ensembles and the response of simple model neurons. Neural Comput. 15, 67–101.
Martignon, L., Deco, G., Laskey, K., Diamond, M., Freiwald, W., and Vaadia, E. (2000). Neural coding: higher-order temporal patterns in the neurostatistics of cell assemblies. Neural Comput. 12, 2621–2653.
Miller, P., Brody, C. D., Romo, R., and Wang, X.-J. (2003). A recurrent network model of somatosensory parametric working memory in the prefrontal cortex. Cereb. Cortex 13, 1208–1218.
Nakahara, H., and Amari, S. (2002). Information-geometric measure for neural spikes. Neural Comput. 14, 2269–2316.
Oram, M. W., Wiener, M. C., Lestienne, R., and Richmond, B. J. (1999). Stochastic nature of precisely timed spike patterns in visual system neuronal responses. J. Neurophysiol. 81, 3021–3033.
Pillow, J. W., Shelns, J., Paninski, L., Sher, A., Litke, A. M., Chichilnisky, E. J., and Simoncelli, E. P. (2008). Spatio-temporal correlations and visual signalling in a complete neuronal population. Nature 454, 995–999.
Pipa, G., and Munk, M. H. J. (2011). Higher order spike synchrony in prefrontal cortex during visual memory. Front. Comput. Neurosci. 5:23. doi: 10.3389/fncom.2011.00023
Pipa, G., Riehle, A., and Grün, S. (2007). Validation of task-related excess of spike coincidences based on NeuroXidence. Neurocomputing 70, 2064–2068.
Pipa, G., Wheeler, D. W., Singer, W., and Nikolic, D. (2008). NeuroXidence: a non-parametric test on excess or deficiency of joint-spike events. J. Comput. Neurosci. 25, 64–88.
Riehle, A., Grün, S., Diesmann, M., and Aertsen, A. (1997). Spike synchronization and rate modulation differentially involved in motor cortical function. Science 278, 1950–1953.
Schneider, G., Havenith, M. N., and Nikolic′, D. (2006). Spatiotemporal structure in large neuronal networks detected from cross-correlation. Neural Comput. 18, 2387–2413.
Shadlen, M. N., and Newsome, W. T. (1994). Noise, neural codes and cortical organization. Curr. Opin. Neurobiol. 4, 569–579.
Shadlen, M. N., and Newsome, W. T. (1998). The variable discharge of cortical neurons: implications for connectivity, computation, and information coding. J. Neurosci. 18, 3870–3896.
Singer, W. (1999). Neuronal synchrony: a versatile code for the definition of relations? Neuron 24, 49–65.
Singer, W., Engel, A. K., Kreiter, A. K., Munk, M. H., Neuenschwander, S., and Roelfsema, P. R. (1997). Neuronal assemblies: necessity, signature and detectability. Trends Cogn. Sci. (Regul. Ed.) 1, 252–261.
Truccolo, W., Eden, U. T., Fellows, M. R., Donoghue, J. P., and Brown, E. N. (2005). A point process framework for relating neural spiking activity to spiking history, neural ensemble, and extrinsic covariate effects. J. Neurophysiol. 93, 1074–1089.
Uhlhaas, P. J., Pipa, G., Lima, B., Melloni, L., Neuenschwander, S., Nikolic, D., and Singer, W. (2009). Neural synchrony in cortical networks: history, concept and current status. Front. Integr. Neurosci. 3:17. doi: 10.3389/neuro.07.017.2009.
Victor, J. D., and Purpura, K. P. (1996). Nature and precision of temporal coding in visual cortex: a metric-space analysis. J. Neurophysiol. 76, 1310–1326.
Keywords: synchronous firing, factor, modulation of synchrony, joint-spike-event, bivariate, multivariate, NeuroXidence
Citation: Wu W, Wheeler DW and Pipa G (2011) Bivariate and multivariate NeuroXidence: a robust and reliable method to detect modulations of spike–spike synchronization across experimental conditions. Front. Neuroinform. 5:14. doi: 10.3389/fninf.2011.00014
Received: 21 January 2011;
Accepted: 01 August 2011;
Published online: 19 August 2011.
Edited by:
Daniel Gardner, Weill Cornell Medical College, USACopyright: © 2011 Wu, Wheeler and Pipa. This is an open-access article subject to a non-exclusive license between the authors and Frontiers Media SA, which permits use, distribution and reproduction in other forums, provided the original authors and source are credited and other Frontiers conditions are complied with.
*Correspondence: Gordon Pipa, Institute of Cognitive Science, University of Osnabrueck, Albrechtstr. 28, 49069 Osnabrueck, Germany. e-mail:Z3BpcGFAdW9zLmRl