 Adam Scott1
 Will Courtney1
 Dylan Wood1 Raul de la Garza1
 Susan Lane1 Margaret King1 Runtang Wang1 Jody Roberts1
 Jessica A. Turner1,2,3
 Vince D. Calhoun1,2,4*
- 1 The Mind Research Network, Albuquerque, NM, USA
- 2 Department of Psychiatry, University of New Mexico, Albuquerque, NM, USA
- 3 Department of Psychology, University of New Mexico, Albuquerque, NM, USA
- 4 Department of Electrical and Computer Engineering, University of New Mexico, Albuquerque, NM, USA
The availability of well-characterized neuroimaging data with large numbers of subjects, especially for clinical populations, is critical to advancing our understanding of the healthy and diseased brain. Such data enables questions to be answered in a much more generalizable manner and also has the potential to yield solutions derived from novel methods that were conceived after the original studies’ implementation. Though there is currently growing interest in data sharing, the neuroimaging community has been struggling for years with how to best encourage sharing data across brain imaging studies. With the advent of studies that are much more consistent across sites (e.g., resting functional magnetic resonance imaging, diffusion tensor imaging, and structural imaging) the potential of pooling data across studies continues to gain momentum. At the mind research network, we have developed the collaborative informatics and neuroimaging suite (COINS; http://coins.mrn.org) to provide researchers with an information system based on an open-source model that includes web-based tools to manage studies, subjects, imaging, clinical data, and other assessments. The system currently hosts data from nine institutions, over 300 studies, over 14,000 subjects, and over 19,000 MRI, MEG, and EEG scan sessions in addition to more than 180,000 clinical assessments. In this paper we provide a description of COINS with comparison to a valuable and popular system known as XNAT. Although there are many similarities between COINS and other electronic data management systems, the differences that may concern researchers in the context of multi-site, multi-organizational data sharing environments with intuitive ease of use and PHI security are emphasized as important attributes.
Introduction
Public repositories of functional and structural imaging data are becoming more prevalent in the neuroimaging research community, with, e.g., the human connectome project (Marcus et al., 2011), the biomedical informatics research network (BIRN; Keator et al., 2008, 2009), XNAT Central (Marcus et al., 2007), the Alzheimer’s disease neuroimaging initiative (ADNI; Jack et al., 2008), the mind clinical imaging consortium (MCIC; Bockholt et al., 2010), and the neuroimaging informatics tools and resources clearinghouse (NITRC; Buccigrossi et al., 2008) all making imaging data available in a variety of formats with varying levels of detail. These data are highly valuable for discovery, including identifying regions and structural circuits associated with mild cognitive impairment, Alzheimer’s disease, and genetic risk for various cognitive dysfunctions (Kim et al., 2009, 2010; Potkin et al., 2009; Petersen et al., 2010; Petrella et al., 2011). The ability of an institution to facilitate data sharing across departments and methodologies is key to understanding complex diseases, as reflected by the clinical translational science center (CTSC) initiatives supported by NIH within a number of universities1.
One challenge lies in measuring the value of data sharing efforts. Several grant agencies such as the NIH (2003) and the NSF (2011) already recognize the value, and many institutions have implemented data sharing. The centralization and standardization of data has been shown to be both economically more efficient as well as facilitating sharing (Walden et al., 2011). Sharing study data may also increase researchers’ citation rate (Piwowar et al., 2007). Consider HeLa cells, a cell line available centrally for use by the scientific community in general. They can be propagated indefinitely and have been used in more than 60,000 scientific articles (Skloot, 2011). The acceleration of discovery through reuse via data sharing may not match the extreme success of HeLa cells in biology, but the copying fidelity is higher and the HeLa cells serve as exemplar to the concept of research recycling. Tracking simple metrics such as data reuse count and the number of publications may be a first step to provide metrics for how much data sharing actually occurs.
The ability to combine neuroimaging data (NID), associated measurements, and metadata across studies within a single institution for further data exploration and meta-analysis is facilitated by using a common data repository (Marcus et al., 2007; Dinov et al., 2010). Storing data in a manner that allows efficient access to researchers from varying geographic and institutional areas is critical to large-scale combination of image analysis data. Other obstacles which slow data sharing include a lack of standardization for data collection and imaging protocols. For instance, the wide variety of needs that researchers across an institution have, using different data collection methodologies, experimental designs, clinical assessments, and with differing and often strong opinions on the best methods for data analysis in any given situation can be a considerable obstacle. Use of a single data management system like the picture archiving and communication systems (PACS) at most medical imaging facilities standardizes the imaging data hierarchy, as well as the required and allowable metadata, for ease of data retrieval and sharing with all allowed medical staff. A PACS system, however, while incredibly successful in clinical scanning settings, is not designed with the needs of cognitive neuroscientists and neuropsychiatric researchers in mind. It is limited to specific imaging modalities (e.g., MRI, ultrasound, with no MEG, EEG, or other data types), and the information needed for functional magnetic resonance imaging (fMRI) analysis is missing.
In the following sections we first define data sharing and describe a taxonomy of data sharing. Next we discuss some of the many challenges to data sharing. Finally, we present the system developed at the mind research network (MRN) and discuss how we have attempted to address the challenges.
A Taxonomy of Data Sharing
For our purposes, it may be helpful to provide a preliminary definition of “data sharing.” At a fundamental, physical level we might define data from experimental or observational research as a sequence of symbols stored on some medium used for generating the results of a study. The NIH data sharing policy defines data as final research data; our definition is broader and more formal in order to capture ongoing data collection. Data sharing may be defined as all of the processes required to transfer and deliver data from one entity to another entity, where an entity is a principal investigator (PI), co-investigator (Co-I), an organization, a data enclave (i.e., a subset of the data), or in some instances study participants themselves. This definition stands in the context of a formal research study under the purview of NIH or under the oversight of an institutional review board (IRB), for example, but it is inclusive enough to include other instances where sharing data may prove beneficial.
Figure 1A shows a taxonomy of the types of data involved with data sharing, identifying some key characteristics of different kinds of data which need to be considered when successfully capturing and sharing data, comparing data from different sources and reproducing results across different data. Plurality indicates the cardinality of the medium being used to represent the data. For instance, when a user queries against the database, the result is usually a single computer file (i.e., singleton) or a collection of files. Many researchers will share data using a computer file as the medium; however, instances appear where the requester urgently needs the actual paper assessment or a non-electronic document. Data sharing systems supporting a request tracking workflow, as well as lifetime provenance and different security protocols might need to make the distinction between a document or a computer file. Confidentiality tracks any sensitivity of the data to public access, such as data containing protected health information (PHI) or quasi-identifying attributes such as age or zip code (Ghinita et al., 2011). Confidential data may be encrypted or anonymized, for example, to reduce its level of sensitivity. In a DICOM file, sense (Figure 1) would be data and metadata as both are usually stored in a DICOM file. A codebook used for statistical analysis may be characterized as metadata as would an XML data type definition (DTD) or schema. This distinction guides the system on how to process, store, catalog, and retrieve the data. A recording of observation presents a different set of possible descriptors regarding the observation method, such as scanner vendor, sequence name, etc. Finally, we have mode (e.g., imaging data from a scanner versus assessment data from a human). Assessments or observations made by a human provide quite different challenges in reproducibility, where the skill level of the human rater is a large factor.
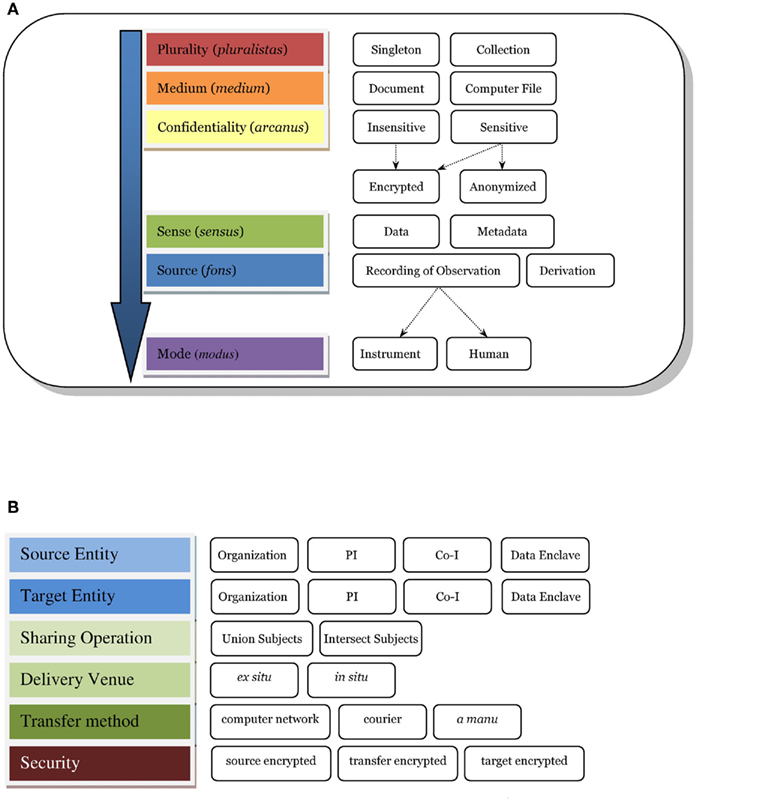
Figure 1. Data sharing taxonomy. (A) e.g., A DICOM file may fit within the taxonomy as follows: plurality = singleton; medium = computer file; confidentiality = sensitive, anonymized; sense = data and metadata; source = recording of observation; mode = instrument. if the dicom file were encrypted then confidentiality = sensitive, encrypted, anonymized. (B) Sharing action. If a PI were to share subject data with another PI inside of COINS, the action would fit in the taxonomy as follows: source entity = PI, target entity = PI, sharing operation = intersect subjects, delivery venue = in situ, transfer method = computer network, and security = source encrypted, transfer encrypted, target encrypted.
An expanded taxonomy of “data sharing” (as opposed to the data itself) is developed and shown in Figure 1B. The entities identified herein emphasize the responsibility for the data, which may be implied by an IRB consent, a business associate’s agreement, or another agency relationship. Next, we identify the sharing directions; this has proven very useful in discussing data sharing with researchers where there was once much confusion. Often, we encounter cases where PI A shares their data with another researcher B (i.e., source to target). In our collaborative informatics and neuroimaging suite (COINS2), we support inter-study sharing of subject data which can drill-down to further precision: union or intersection of subjects – that is, all the subjects in several studies in a set, or only subjects who participated in all the studies in the set. A discussion of delivery venue is provided in the next section under In situ versus Ex situ data sharing. Transfer method usually is via computer network but there are instances when data is mailed (i.e., courier) or delivered by hand, and tracking these require different programmatic workflows. Finally, security and federal regulations emphasize tracking of encryption for data whose confidentiality is sensitive.
The ability to capture, store, retrieve, manage, and share data electronically across neuroimaging research studies requires not a single database or software tool, but a suite of tools to cover the multiple modalities of the data and the study-specific needs. We present COINS, the institutional data repository solution developed at the MRN, including updates over the original implementation (Bockholt et al., 2010) and demonstrate its value in large-scale functional NID sharing and analysis (e.g., a recent resting fMRI study involving over 20 PIs and over 30 studies; Allen et al., 2011). MRN’s curation of the research data presents the opportunity to share collected datasets with other researchers for purposes of identifying new observations, replicating results, and creating new datasets for new studies. We begin with an outline of several data sharing challenges involved in neuroimaging research, then a description of the features of COINS and solutions to these challenges.
Data Sharing Challenges
We now discuss several challenges to data sharing in the context of the previously described data taxonomy.
The problem of PHI
Protected health information (PHI) is stored in the datasets discussed here. Not all institutions are under PHI and privacy rule regulations, however the system needs to have the ability to accommodate and track for those who are. Referring to Figure 1B, this is arcanus sensitive data. Maintaining subject confidentiality and data security is a dynamic challenge, particularly across different investigators with changing roles within their studies (being added as an investigator, being dropped from a study), participants requesting that their data be no longer archived or shared, and the evolving understanding of what constitutes PHI. In a system that tracks multiple studies, levels of confidentiality must be maintained so that a PI can determine that a given individual participated in several of that PI’s studies, for example, but not which other studies the subject may have participated in. Yet in data aggregation across multiple studies, it is critical to know which subjects are unique and which are repeated; so the system must allow for both situations. COINS is able to track this information, but also provides a feature for users to unlink the PHI in the case where this information is no longer needed or the IRB mandates it upon study closure.
In situ versus ex situ sharing
Data sharing processes can be classified as in situ, wherein the data stay where they are and permissions are granted to someone new to access it; and ex situ, in which data must be copied or somehow transferred to another location. In situ is preferred; most ex situ data sharing processes require the lengthy exercise of exporting, transferring, and delivering datasets of imaging and assessments to other systems. This burden disappears with systems supporting in situ sharing where at a minimum the researcher need only approve of the data sharing request, and then the requester accesses the dataset at its origin. In situ sharing as often occurs within an institution means that the researcher is nearly limited only by technology speeds in the number of sharing requests fulfilled, but it brings more challenges for security and confidentiality. In Figure 1B, we refer to delivery venue for sharing ex situ versus in situ.
Standardized metadata versus extensibility for new data types
Querying relies on standardized metadata, and here we encounter troubles conferred by non-standardized metadata. For some parameters in an image, such as repetition time (TR) and echo time (TE), the DICOM standard defines the MRI module attributes, and we should be able to query for these parameters. Specifications for neuroimaging techniques such as fMRI, diffusion tensor imaging (DTI), chemical shift spectroscopy imaging (CSI), and perfusion-weighted imaging (PWI) require more fields than are available in the DICOM standard and may require additional intermediate files. If a user wanted to query for DTI scans based on their gradient values, the repository must know how to extract vendor-dependent fields from the DICOM images and store them for each DTI scan cataloged. Furthermore, as new techniques appear, the repository translators require continual maintenance for updates to each vendor’s “standard.”
The situation is similar for clinical assessments, where standard forms are available and storage and querying are easier. Even storing metadata about study populations can prove non-trivial when inter-study data sharing is involved. For example, the definition, attributes, properties, screening tools, and processes for a control group versus an experimental group vary across each study, rendering the label “control” or “healthy subject” insufficient for meaningful data sharing in many cases. Explicitly storing the inclusion and exclusion criteria the researcher used for determining a control subject places more effort on a researcher for data sharing, so the challenge not only lies in the management of metadata but in the intuitive ease of use (IEU) of the system, described below. In Figure 1B of our taxonomy, the content of this data is referred to as sensus metadata.
Researchers often modify the standard assessments or protocols to adapt to the specific needs of their study, or collect fundamentally new data, and this lack of uniformity imposes yet another challenge when storing metadata for future retrieval. A prominent challenge in designing neuroinformatics repositories is in standardizing a common set of fields that meet the needs of researchers as their methods evolve (Toga, 2002). Given a repository designed for fMRI data and EEG data, for example, when a new modality such as MEG appears, the repository’s database schema may require modification. Modifying the database schema is the most direct technique to extend a repository, but it traditionally requires a database administrator (DBA) to perform the modification. Since not all labs have these resources, another technique is implementing some form of the entity–attribute–value model (EAV), a way of storing “tables within a table” (Nadkarni et al., 1999).
Intuitive ease of use
The IEU of a neuroinformatics data management system presents another challenge, related to the usability of the interface. Van Horn and Toga (2009) point out trust in utility among many of the barriers to sharing data. We suggest that trust in utility first begins with IEU, allowing new users to make a very small, upfront investment rather than a large one to be productive and experience the utility. The higher the IEU, the lower the training time and costs. IEU sits beneath the umbrella of “usability” which is concerned with software ergonomics. Poor usability in itself imparts “…unnecessarily high training and customer support costs, unnecessarily low productivity…” (Mayhew, 1999).
When datasets include multiple types of observational data, such as multi-modal imaging and neuropsychological assessments (NAs) of varied types of subjects across multiple studies, providing a query interface with high IEU and producing combined data output that is easy to consume approaches the edges of implementation challenges. Querying requires ease of searching, ease of use, high performance, security, and trust. One of the challenges in querying is the lack of uniformity in metadata (or sensus metadata) as mentioned above. A good user interface provides aids to handle the non-uniformity, and it does so with quick response.
User friendly, powerful query interface
When repository data includes several types of observational data, such as multi-modal imaging and NAs of varied types of subjects across multiple studies, providing a query interface with high IEU and producing combined data output that is easy to consume broaches the edges of implementation challenges. Given a well-designed database schema, actual system performance against similar hardware should not vary significantly between different neuroinformatics systems, all things being equal (hardware, database technology, and tuning). Variances highlight where the database designs may benefit from improvement. Some systems may opt for denormalizing some tables to improve performance, but they do so at the cost of flexibility in the future. A good user interface would provide a uniform front-end, maintaining consistency between the different schema designs such that a user does not have to re-learn how to query and export their data.
Speed of search and retrieval/scalability of any system to handle an institution’s data collection needs
The speed of search and retrieval, the performance of the data collection system, and the scalability of both challenges the research community whose demand grows with the number of observations and amount of related data. From a systems point of view, the following model provides a context for discussion. Et = Ce Σ(ASt + ΣRt) where Ce is some undetermined constant, ASt is the ad hoc search-to-response time or the time to enter a search request and return results, whether they be null or otherwise, Rt is the retrieval time of datasets or the time to download the datasets once they have been chosen by the user, and Et is the explore time, which is the time to discover what data is available, search data, combine results, and retrieve datasets. A small Et is preferable; at some point, the length of Et renders the system unusable, unproductive, and unfriendly to the user.
Components of Rt and ASt may be broken into the host stack and the client stack where, host stack = host software (database engine + middleware engine + front − end engine) + host hardware (networks and host servers) and client stack = client networks + client hardware + client software.
Since host hardware usually has a fixed cost (except for on-demand computing provided by cloud computing firms for example) and the client stack is not controllable (except maybe the client software), host software provides the most flexibility and opportunity to change or innovate to increase performance. Controlling client software lowers end-user ease of use through requiring special installation, for instance. Often a footnote, every layer of this model is subject to planned and unplanned system outages and performance degradations.
From a systems standpoint, the three components of scalability are network bandwidth, storage space, and CPU processing. Depending on the implementations of each component, different methods of scalability may be available. It can be difficult to control the administrative costs while adding additional capability to any one of the components. One example is adding additional databases that are replicated for load-balancing requests. In an outage, additional administrative overhead is required to re-synchronize the databases. Finally, the host software must be designed to accommodate scaling up. This may include middle-layer transaction and caching servers, requiring additional administrative overhead and complexity.
Data history and provenance
Even with electronic data capture techniques for imaging data, metadata, and clinical assessments, errors persist, and data or metadata will need to be modified. A data management system needs to maintain the provenance of the data, both in how it was collected (partially captured by the levels sense, source, and mode in Figure 1 and in the modifications that might have been made subsequently), ideally including the data transformations applied to it.
With these challenges in mind, we present the solution implemented at the MRN. COINS is the backbone for both the internal studies at the institution and active multi-site collaborations with remote institutions.
Materials and Methods
We discuss the parts of the COINS system first, then consider how they address the challenges noted above as Results. MRN’s repository comprises an open-source, enterprise, object-relational database management system (DBMS; PostgreSQL) and a data storage system. With about 75 terabytes (TBs) of both raw and processed data across over 300 studies, the MRN system manages large quantities of raw and processed research data on human brains, behavior, and minds. Types of data include neuropsychological and clinical assessments, MRI, MEG, EEG, and genetic data (Bockholt et al., 2010). The observational data, in logical form, exists as a set of NAs data and a set of NID of the different modalities as well as genetic data. All of the NAs live in the DBMS along with metadata about the NID, whereas the physical NID exist in de-identified form on RAID storage systems, as is common for imaging research data systems (Keator et al., 2006, 2008; Marcus et al., 2007). Often, one system manages NAs and a separate system manages NID, such as using a combination of OpenClinica3 for clinical measures and XNAT to store imaging data locations. The MRN repository unifies these disparate data sources so that no extra system integration is required. This eliminates database inhomogeneity and concomitant problems such as lowered data sharing, control, utilization, and higher administrative costs (Hsiao and Kamel, 1989). The unification enables in situ delivery venue sharing mentioned in challenge #2.
The average dataset size at MRN is roughly one-quarter TB (300 studies/75 TB). The size of these datasets may qualify them as big data, yet the problem of storage of large datasets is relatively trivial now. The current challenge is retrieving the data (Jacobs, 2009) and providing access to other investigators, which is ironic considering the word “data” comes from the original Latin datum, meaning “given” as pointed out by Jacobs.
Table 1 shows the amount and types of data ready to be shared among other researchers at MRN. A complete dataset from a study is not required to be of use. For instance, a researcher may only be interested in resting fMRI images (REST) of one set of control subjects and thus the patient subject population’s data need not be included in the data sharing.
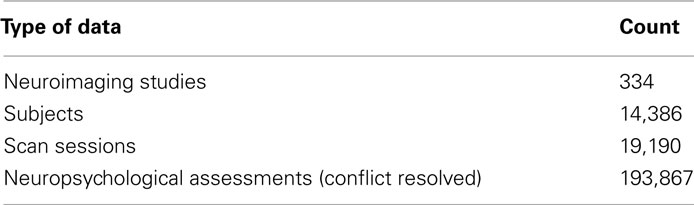
Table 1. Types of data available to share with other researchers (as of June 12, 2011).
Collaborative informatics and neuroimaging suite (COINS) consists of a central subject and study management tool, the medical imaging computer information system (MICIS), query builder (QB), Assessment Manger (ASMT), a DICOM receiver, and a Tablet-based entry application that uses a web service for uploading tablet data to the MRN database (see Figure 2). They all work together using the database as the central data store. We describe each below before a more detailed presentation of COINS.
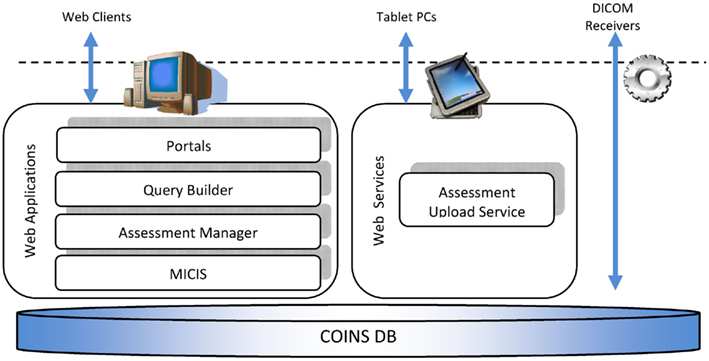
Figure 2. Overview of COINS.
Portals
Once data is stored in the repository, investigators may collaborate via web-based portals. Each study can have its own private portal with security administered by the PI or a designee. Portals do not contain PHI or other identifiers, are accessible via the web and provide the ability to share documents through the use of a document library available on the portal. In addition, raters and subjects can be managed, providing convenience for remote studies. Complex studies benefit from the schedule of events and progress reports. Figure 3 shows a progress report for one study: every subject, visit, and assessment collection event is visible. Scan events may also be included depending on the needs of a given study.
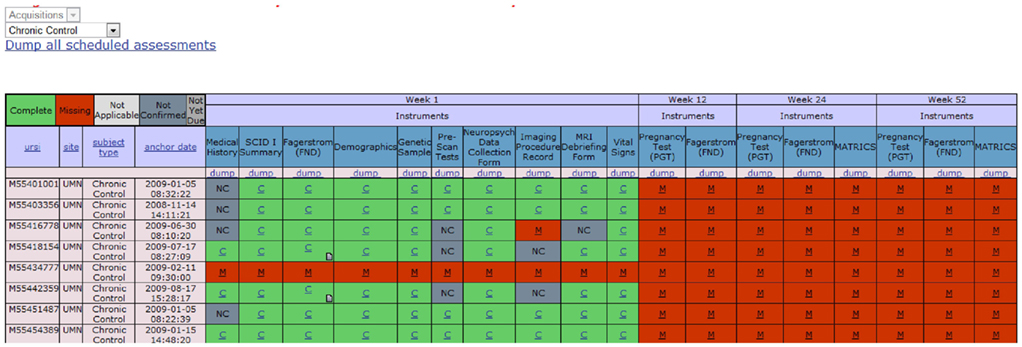
Figure 3. Based on a schedule of events, each subject’s progress is tracked, and a researcher can see the progress at-a-glance. URSI is the unique research study identifier that is unique across all studies; C, the green squares = complete; M, the red squares = missing; NC, the gray squares = not complete.
Assessment Manager (ASMT)
Neuropsychological assessments administered via paper benefit from a web-based tool that provides the dual-entry conflict resolution features of ASMT. The user interface design is simple, minimizing the amount of training for data-entry personnel. After an assessment is dual-entered, coordinators resolve discrepancies using a simple, web-based workflow (see Figure 4). Further, assessments support calculated fields using formula syntax (see Figure 5) very similar to those in spreadsheets and can readily support functions available in the PHP 5.5 language.
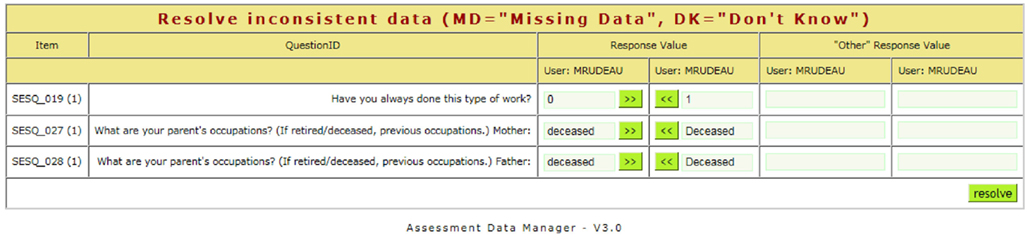
Figure 4. When the first and second entries of an assessment do not match, a coordinator can resolve differences using a simple web interface.
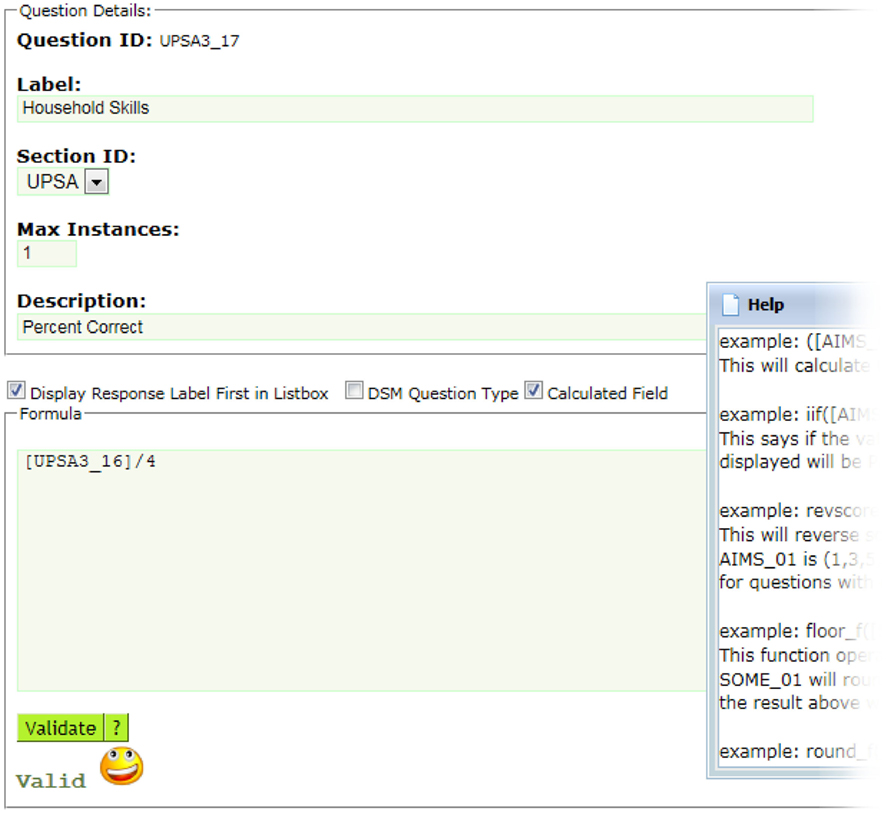
Figure 5. ASMT supports user-defined calculated fields, including conditional if statements and a built-in reverse scoring function, among others. In this example, the formula divides the question id, UPSA3_16 by 4. If you wanted to make this question id UPSA3_17 equal to UPSA3_16 reverse scored, the formula would be as simple as revscore ([UPSA3_16]).
Along with other NAs, ASMT (and the tablet application) support the structured clinical interview for DSM disorders (SCID) by providing a special, three-level, drop-down list to identify diagnostic codes following the DSM IV-TR model (First et al., 1995). For the Sobell, a special web-based calendar implemented with javascript and AJAJ provides ease of data-entry. Rather than designing everything to the most complex case, we have generalized the most common cases and provided special adaptations to support the edge cases. This simplifies more than 80% of the known cases without sacrificing a broad set of features and without making the UI unnecessarily complex.
Built-in reports of data-entry statistics provide valuable insights into the number of historical and current conflicts for dual-entered assessments in an investigator’s study as compared with all studies, which may point out opportunities for training or improved form design.
Many systems try to render the actual forms verbatim, but in our experience this is over-engineering, and by keeping things simple we reduce the cognitive load for data-entry thereby reducing costs in training and web page or screen load times. This helps to meet challenge #4, IEU. ASMT supports the two most often used types of fields: free-form text and drop-down list. There are no radio buttons, sliders, checkboxes, graphics, or other interaction controls, keeping things simple for the data-entry operators. In the future we anticipate designing self-assessments requiring a much different style of user interface to support more complex survey instruments.
Tablet
The tablet product (see Turner et al., this issue) provides another method for collecting NAs. Rather than entering data on paper, the rater or subject enters data directly into the PC-based tablet, saving the time required to perform dual-entry conflict resolution. Later, the assessments may be uploaded via a webservice into the COINS database. The stylus directly touching the screen best simulates “paper and pencil” forms – even surpassing their ease with automatic flagging of entry errors. From this, perhaps it has a higher IEU than actual paper forms.
DICOM Receiver
In order to load scan metadata into the database, we use a customized DICOM receiver based on the dcm4che JAVA library. The receiver may be installed on any machine in the network where the DICOM scanner has the ability to send imaging data. When the scanner sends the scan session to the DICOM receiver, the receiver validates the scan session against the subjects and studies in the database. Invalid scan sessions are moved to a “lost and found” directory on the file system where any corrections can be made in the database through medical imaging computer information system (see section below) before being re-transferred into the repository.
Query Builder
Scans automatically load via the DICOM receiver, and assessments are entered via the tablet or ASMT, but to export or retrieve data we use QB. Through QB the user has different options for selecting data to export. It provides an interface similar to query-by-example but simpler (see Figure 6). The user does not need to link tables, understand primary key relationships, or know the database schema.
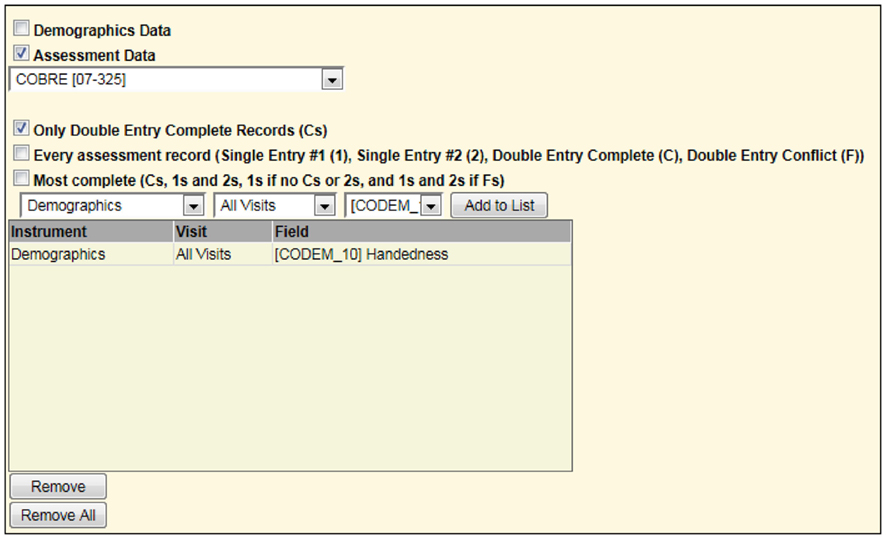
Figure 6. Upper portion of query builder specifying the handedness field for a specific study.
For example, to list only those subjects with rest scans from another study, one may select the options as shown in Figure 7.
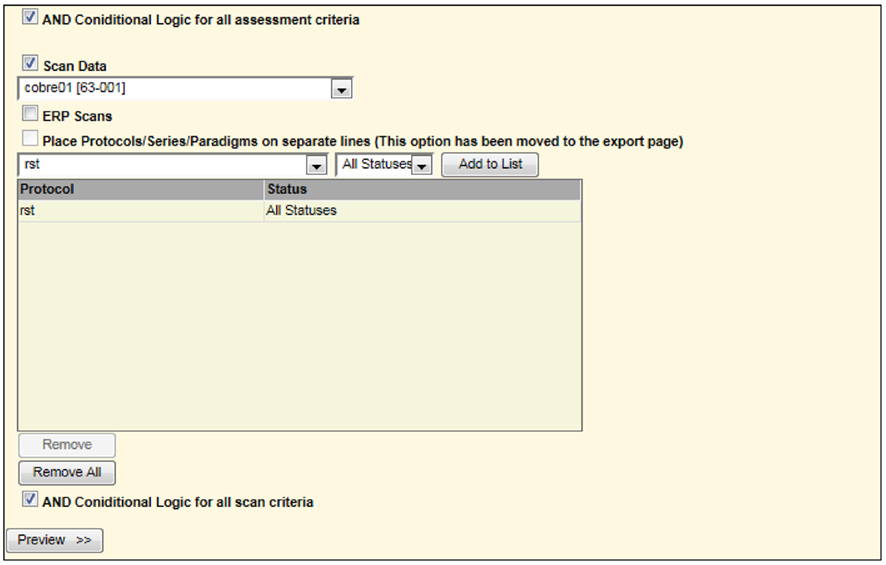
Figure 7. Second portion of screen in query builder requesting all rst (rest) scans for one study to be combined with all handedness in a different study (Figure 6). This is similar to a union of all subjects between the two studies matching the specified criteria.
Based on the user’s security access to other studies, a user may query for assessments and scans across all available studies by selecting “All Studies” in the drop-down list. Only studies the user has been granted access to are available based on PI and IRB approval. For a PI with many studies, this provides valuable views of data across all of them. A combined query can be used to provide all resting state fMRI or MEG data from one study for subjects who are also in another study, for example, and includes the handedness value from the Demographics assessment that has been double-entered and conflict resolved.
The present UI design is a third iteration from Bockholt et al. (2010), trying to balance IEU with the most often demanded sophistication levels from our researchers to meet challenges #4 and #5. With this, QB provides a new save feature, allowing the user to save and reuse queries for the future. The QB supports both comma-separated and tab-separated formats, collapsing multiple assessments per subject by unique research subject identifier (URSI), visit, entry code, and other options, saving the data analyst time from having to develop custom pivots.
Medical Imaging Computer Information System
Medical imaging computer information system (MICIS) is the web application used for managing studies, subjects, scans, and PIs. One of the critical features of MICIS is the interfacing of technology with human processes. For instance, when a study is about to expire, the system auto-emails warnings (with ample lead time) to the PI as a reminder to file their renewal paperwork with the IRB, ensuring there are no gaps in approval – especially useful to prevent having a subject on-site, ready to scan, and discovering there is a lapse in renewal paperwork. To prevent an IRB violation, if a study is listed as expired in MICIS, the system will not allow for a subject to be enrolled in a study. If a subject is not enrolled in a study, the DICOM receiver will send the subject’s scan to a lost and found area where corrections to the scan may be made or the subject is enrolled in MICIS and the scan is resent. Another nice feature is the ability to specify the number of approved participants. When a subject is enrolled in a study, a warning presents to the user if the target enrollment is near the maximum (90%) or exceeded.
MICIS has the standard features expected in managing studies, subjects, and scans. For instance, every study may define its own, custom subject types such as control or patient and may be used to track subjects who are withdrawn or excluded. Also, custom subject types can support pre-screening processes as well. As mentioned in challenge #3, there is still a need to document the pre-screening process for metadata sharing purposes without adding extra burden to researchers. Following are some unexpected features not typically found in a neuroinformatics system.
The repository design includes information for management of IRB records of approval and expiration dates for studies and subject consent dates. This includes other management information about studies related to IRB policies on data access and study closure. For instance, when a study is closed with the IRB, the repository records this, and the front-end tools enable such policies by not allowing subject enrollment or further data-entry.
Related to data sharing challenge #1, at the end of a study, a researcher may want to discard PHI information as part of their IRB mandate. MICIS supports the unlinking of PHI from a subject, making the subject’s name, address, birth date, and other PHI unavailable. Of course, once PHI is unlinked, the subject’s research data remains available through MICIS, just not PHI. In cases where the same subject is enrolled in multiple studies, PHI is still available to the studies where it is still linked. The main innovation to support this is the ability to unlink PHI for a subject at the study level. Once the PHI is unlinked in a study, all users with permissions for that study are blinded to the subject’s PHI.
Figure 8 helps visualize the PHI unlinking mechanism. URSI C has PHI unlinked. At this point, no user may see PHI for URSI C, including the study’s PI, PI Cormack. It is important to note, however, CoPI Bovet may have documentation (or a good memory) associating URSI C to URSI B. In this case, as long as URSI B is linked in MICIS, there is an exposure of deducing PHI for URSI C. Any user with PHI privilege in both study y and study z may be able to make this deduction. As a result, we have educated our users, and as part of the process of study closure, they work with MRN’s research operations group to ensure PHI safety. This kind of exposure is not due to the neuroinformatics implementation – it is inherent in doing research with repeat subjects. One benefit of implementing research in technology is that a good design helps automate warnings of exposures. The users are rather insulated from this complexity, improving IEU.
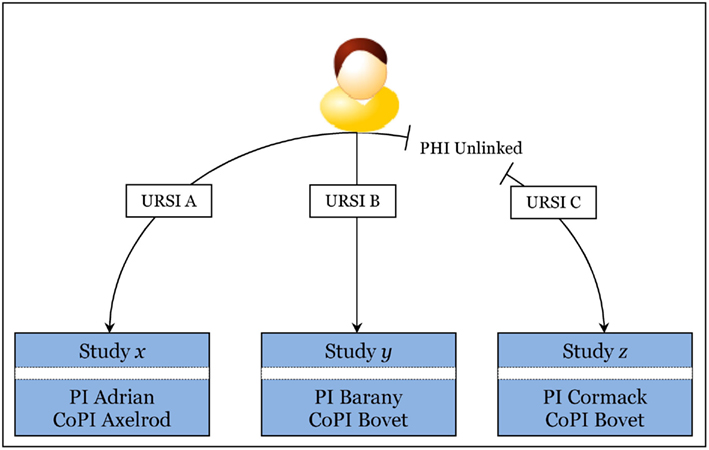
Figure 8. Visualization of how PHI is unlinked for one subject in Study z (lower right box). Recall that URSI is a unique code randomly generated for identifying a subject in a study. Note that CoPI Bovet, right two bottom boxes, is CoPI for study y and study z. PI Barany, middle box, cannot deduce PHI for unlinked URSI C using URSI B, but CoPI Bovet may be able to if he has a good memory or some document linking URSI C to URSI B since he has privilege in both studies and URSI B is still linked. Compare to PI Adrian and CoPI Axelrod in the lower left box: they are blinded to the other studies y and z, regardless of linking. Summarily, if the user is in at least two of the studies the subject is in, there is a potential exposure, and this is outside of the technology implementation.
Another innovation in MICIS is the ability to identify repeat subjects without violating PHI. Repeat subject identification provides a way for the system to later know all of the assessments and scans for a single subject across all studies. This provides for richer metadata about a subject across studies. The IRB protocols for the study must be designed to allow a subject to share their data, and MICIS provides a field for tracking this individual permission by study. Repeat subject identification starts with entering a new subject’s PHI: name, gender, birth date, and address. After a study is selected, submitted, and the user verifies what they just entered, the system performs a fuzzy match on name and address. This enables a user to determine if a subject is a new subject or an existing subject (no information about whether a subject has participated in previous studies is provided and a study-specific URSI option is available to prevent violations of privacy).
When enrolling a subject, there are optional ethnicity and race fields as specified by NIH for subject enrollment reporting. By entering this information, the required NIH enrollment progress report form is automatically generated through MICIS.
Researchers sometimes change metadata on NID and NAs to make corrections. The repository maintains a history of modifications, including the user name and modification date, providing a clear audit trail of changes. This provides the ability to answer questions such as, “Who changed this assessment and when?” When a researcher can get clear answers to these questions, trust in the integrity, and by implication, the security of the system increases (meeting some of the requirements for challenge #7).
Analysis Dashboard
Via MRN portals, investigators may now visually explore the results and status of their image analyses via the web. Figure 9 shows screen captures of the web-based analysis dashboard from a portal web page.
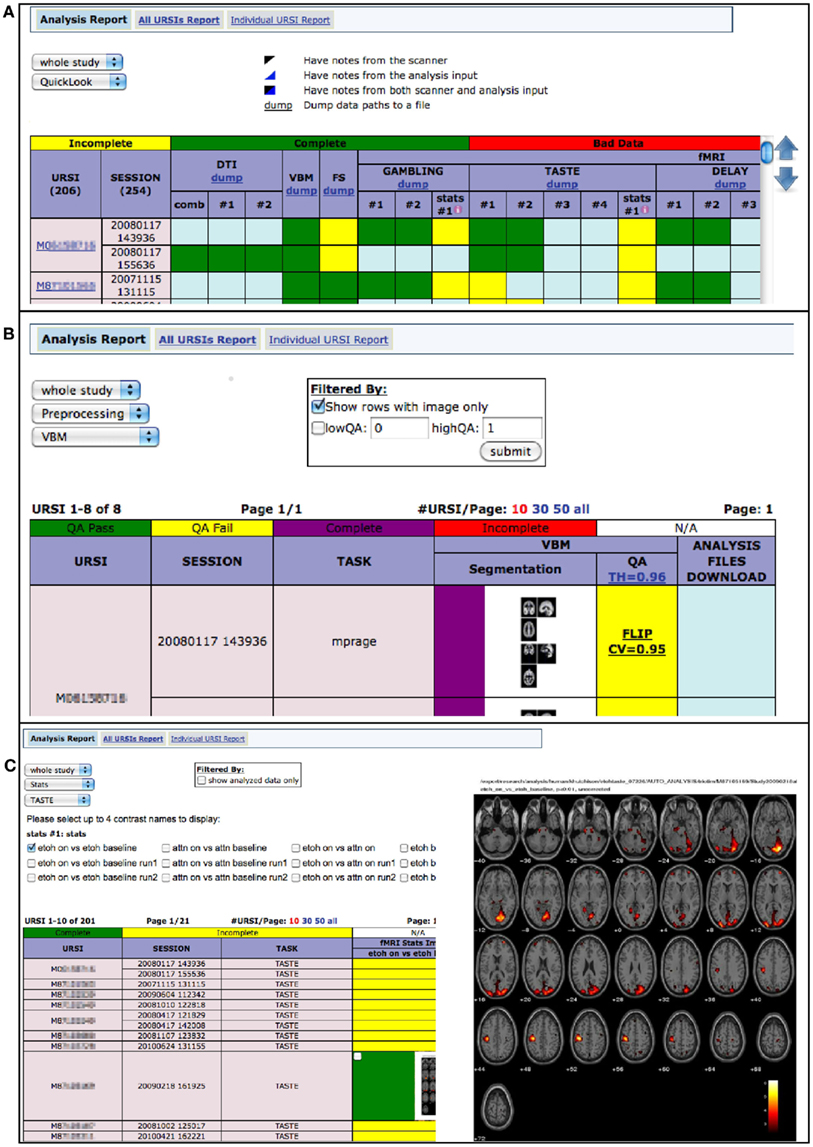
Figure 9. (A) Quick look provides a full overview of each analysis stage, showing incomplete, complete, bad data, and notes from scanner and analysis input (B) based on user-specified QA thresholds, preprocessing status is viewable and associated files may be downloaded (option available behind zoomed image) (C) investigators may view fMRI statistics, on each task, for various contrasts.
Data Catalog
With over 14,000 subjects in the MRN repository, this rich collection of de-identified imaging and assessment data provides valuable opportunities for sharing and reuse. The system provides options for sharing data as de-identified, anonymized, or fully identifiable, depending on the request and IRB approval. For example, if a researcher is looking for “rest” imaging data for control subjects, how do they find it? The data catalog is an answer. Still in its early stages of development, the first iteration provides a web page of the available series by scanner and site with the ability to drill-down to PI, study, subject type, and count. This provides a simple way to enable researchers to communicate their ideas.
Summarily querying the entire repository of available data places large demands on the performance of the servers. Through the use of cached queries, the data catalog provides high-speed browsing to the user, providing a welcoming experience to explore. This innovation on the host software layer mentioned in challenge #6 trades real-time reporting for a 1-day late view of all of the data for an approximately 3 s page load time. For real-time reporting, page load times can take over 5 min. Thus, caching greatly reduces the explore time mentioned in challenge #6.
To find a PI with the data you are interested in requires up to three clicks of the mouse. In the future, the development target is to provide workflows with the minimum of effort and cognitive load and exceed the requirements in challenges #2, #4, #5, and #6.
Results and Discussion
Data sharing in the field of neuroimaging is still at the beginning stages, but is growing rapidly. In this paper we have described some of the challenges that we see as well as describing our system, called COINS, which we believe addresses many of the mentioned challenges quite favorably. Table 2 provides a summary of how the components of COINS address the seven data sharing challenges noted in the introduction. Some features such as a simple UI may be obvious such as the case with the IEU challenge (see Intuitive Ease of Use). Still, other features may be one among many which may address the challenge. This may be true of the problem of PHI for instance: another feature might be a threat report showing where breaches of PHI are possible ranked by likelihood. We have chosen to balance the features to address each challenge while also minimizing the burdens on the investigator.
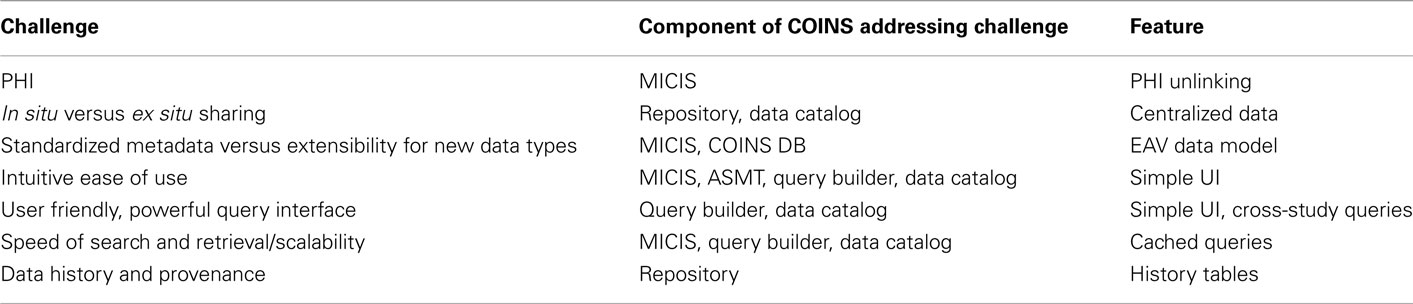
Table 2. Summary of how COINS addresses data sharing challenges.
Since 2005, COINS was developed at MRN and evolved to help researchers in over 300 studies manage neuroinformatics research data. Fortunately, as it met researchers’ initial needs, those needs expanded, indicating a successful solution. Partnerships benefiting from economies of scale with other geographically disparate organizations further indicate the success of COINS.
If one has a lab, why choose this institutional-level approach rather than create your own? The largest strength is that the work of process design and improvement is already done thereby mitigating the problems of haphazardly discovering the subtleties of PHI exposure and other best practices. Another powerful reason is that by standardizing at the institutional-level, you get in situ data sharing for free through the standardization and centralization of metadata. Yet another reason is the economic benefit for larger studies (Walden et al., 2011) especially if a user wants to benefit from data sharing among studies. A weakness would arise if one has a deep need for a customization, which would rely on the institution to add support. COINS has benefited from extensive user input over the years and as a result has many features and tools to improve the user experience. Another weakness is that one may not trust the privacy and security of data in the institutional repository. One might then run a test study to build confidence.
However, if implemented properly, a benefit of the repository is the enhanced protection of health information (PHI) security. Being centralized, if through accident or malicious intent the DBMS security is breached, PHI remains safely encrypted with SHA-128 encryption, leaving available only anonymized subject information.
Finally, MRN’s repository DBMS is open-source licensed similar to BSD and MIT, providing a cost-advantage over some implementations. This flexible licensing aids also in reducing scalability costs, smoothing the path to extending the reach of any data sharing opportunities to other researchers.
Comparison with XNAT
We next discuss and compare our system with XNAT, another valuable and widely used system. With the challenges of standardization, changing science techniques, data security, and privacy, it proves helpful to compare solutions, their strengths, weaknesses, and opportunities to the benefit of the community. We first make the distinction between the repository and the front-end (or user interface), a natural division in client–server designs.
Extensibility
One of the key differentiators of XNAT is the extensibility as its name suggests. “The Extensible Neuroimaging Archive Toolkit (XNAT) is a software platform designed to facilitate common management and productivity tasks for neuroimaging and associated data.” (Marcus et al., 2007). The XNAT repository implements EAV to support adding new fields for an observation type such as a structural MRI. XNAT provides extensibility through a data-driven design of fields specified via an XML document for a large set of fields or through a more end-user friendly web interface more suitable for a small number of fields. For the small number of fields, programming skill is not required, whereas building an XML document may intimidate a broad class of users. The time to create a new field from concept to implementation is inherently very quick when compared with MRN’s repository as an end-user. In the present version of XNAT (1.4) though, new observation types (such as eye-tracking) are created through a series of steps from modifying an XML document to running scripts on the server-side, which is not end-user friendly. MRN’s repository does allow user-extensibility via its assessment product (ASMT), though, which implements EAV-style design. MRN’s repository does not yet allow user-extensible fields for all NID, just MR and MEG sessions, but this is a planned feature in a future release.
Software technologies
When comparing only the repositories and not their user interfaces, both XNAT’s and MRN’s repository rely on the open-source, relational database PostgreSQL. MRN’s repository has been migrated from Oracle to PostgreSQL while maintaining Oracle backward compatibility where convenient, so it is readily able to support running on Oracle. For storing the actual imaging files, both rely on the operating system’s native file system, making them relatively file system agnostic.
Database schema design
Both systems provide analysis pipelines, subject management, project and study management, and security tracking among other features. The front-end workflows of both systems are quite different from each other. Still, where the database schemas define database objects to support those workflows, comparisons are not germane or useful. For instance, XNAT’s schema contains 593 tables to MRN’s 207 tables. The reasons for such variance range from features in one to the amount of EAV-style designs implemented in another.
Both systems have a history table for every main table, providing a record of changes such as who made the change and when. XNAT has an additional “meta_data” table for every main table. The history tables work very much the same in both systems, adding a new row for every change in the main table. This technique allows the systems to keep a full audit trail of changes to records. The “metadata” tables in XNAT provide additional columns to the main tables that may be better placed in the main tables, eliminating the need for an additional join. Between the two systems, there is consensus how the structure of the main or foundation tables are to be designed. Table 3 shows a one-to-one correspondence of these tables between systems. These tables naturally arise from the artifacts common to many if not all labs: studies, subjects, and scan sessions.
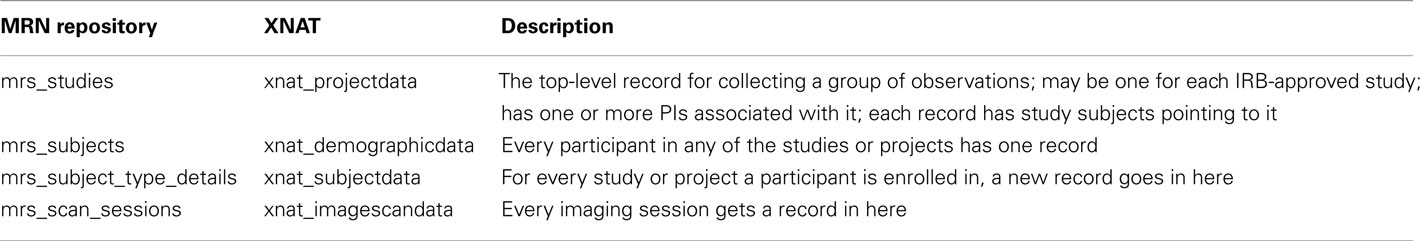
Table 3. Tables in the MRN Repository and XNAT that store equivalent information.
Grouping subjects into classes such as “control” or “patient” provides researchers a natural way of organizing their collections of data; some database designers may opt to create a separate table for subject class. Figure 10 shows a how MRN’s repository defines tables to track a participant’s subject type.
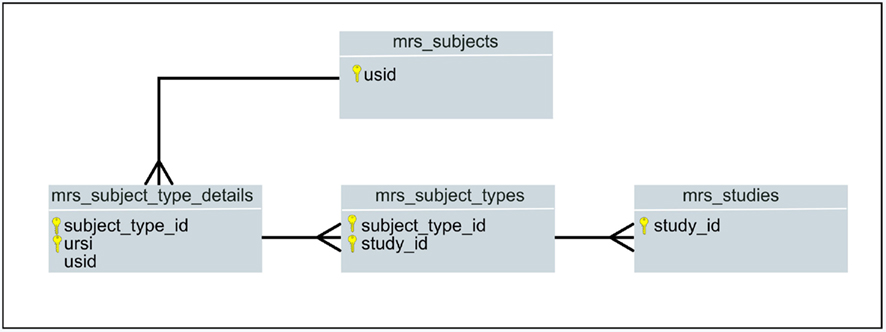
Figure 10. Key-only, ER Diagram of a portion of MRN’s database: mrs_subject_types is used for tracking controls, withdrawn, excluded, patient, and other user-definable classes of a participant in a study.
XNAT provides a free-form field called “_group” in the xnat_subjectdata table and “Group” in the UI where the subject class can be specified, but it is has no controls in place to prevent typos or assignment to non-existent classes – its an attribute on a table and not a different entity or table altogether. In contrast MRN provides a table, mrs_subject_types, that takes advantage of referential integrity, formalizing a class of subjects.
Longitudinal studies require several visits for each subject, and tracking this is handled by MRN using a mrs_study_intervals table, allowing each study to have a defined number of visits, labeled as a researcher requires. XNAT does not have a counterpart table or mechanism. Not all studies require or use this ability, but larger studies greatly benefit from this table. Another benefit to larger studies is the mrs_protocols table, another simple table, which specifies what protocols (or observations) are required at each visit. These two simple tables provide a powerful ability of the system to keep track of study progress for each subject (see progress report later on). Since XNAT can add custom variables to support these features, it could provide a way to support visits and protocols, but these would not have referential integrity and would need to be added for each additional scan session type by a trained user.
Database schema design requires as much art as science, and ideally each schema changes with the needs of investigators and new techniques. MRN’s repository may benefit from EAV-style design in studies and subjects, however with over 300 studies no additional changes have been required to meet investigators’ needs.
One of the advantages of having a SQL backend, when the front-end is deficient, power users can work with the database directly to answer questions not anticipated by the front-end. For example: “List all of the subjects across all studies who have a rest task.” This is a data sharing type question where an investigator is looking to collaborate with other investigators who have “rest” task data. Though an investigator will probably query views and not tables, the following SQL against tables provides an indication of the differences between schemas. In this example we search for “rest” data regardless of modality (see Figure 11).
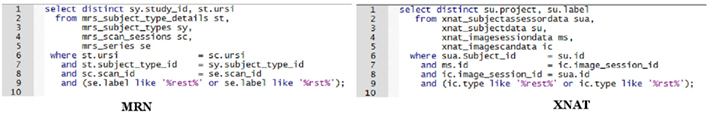
Figure 11. SQL statements listing the study and subject with a “rest” task.
These are homomorphic. Other than the names of tables and columns they look the same, and there are no significant differences between designs. In contrast, examine Figure 12 where we “List all scans, all types, including all modalities.”
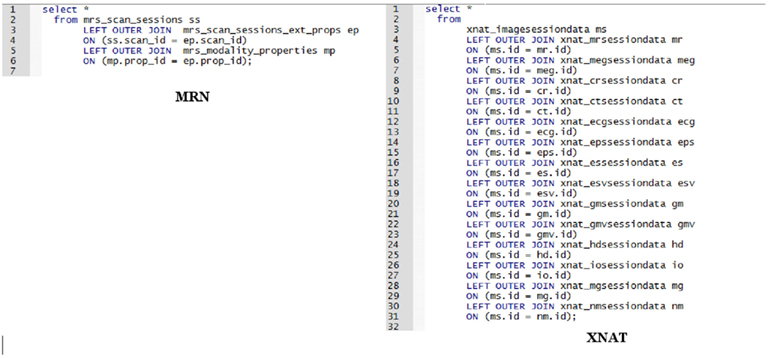
Figure 12. Comparison of SQL statements to retrieve all scans, all modalities.
The EAV-style of storing imaging data at MRN makes retrieving all scan data, regardless of modality a much shorter SQL statement that will not require modification as modalities or scan types are added. In the XNAT example, we need a left outer join for each additional scan type; however, if parameters specific to the scan types are not needed, the query in XNAT would look the same as MRN’s.
Centralize or Distribute?
One of the problems with a centralized repository is errors can propagate just like the data can (Van Horn and Toga, 2009). The “one database to rule them all” approach needs to be balanced with the flexibility needed for research, as noted above; this requires forethought in the tools and interfaces to make as much of that flexibility accessible to the researcher, rather than requiring a lot of programming staff making per-study changes. One of the features of COINS is the flexibility to store NID locally, at a given site, under full local control, while storing metadata remotely in COINS to take advantage of its benefits, like having a centralized card catalog for your locally stored library of books.
In summary, we have detailed the COINS system developed at MRN as well as our experiences in customizing the system and working with large studies and multiple users. Neuroinformatics as a field is still relatively young, but we believe systems like ours go a long way toward advancing the field and enabling neuroscience studies to leverage the vast amount of available data through connecting the studies and PIs in a user friendly, customizable environment.
Conflict of Interest Statement
The authors declare that the research was conducted in the absence of any commercial or financial relationships that could be construed as a potential conflict of interest.
Acknowledgments
This research was supported in part by the National Institutes of Health (NIH), under grants 1 R01 EB 000840, 1 R01 EB 005846, and 1 R01 EB 006841.
Footnotes
References
Allen, E., Erhardt, E., Damaraju, E., Gruner, W., Segall, J., Silva, R., Havlicek, M., Rachakonda, S., Fries, J., Kalyanam, R., Michael, A., Turner, J., Eichele, T., Adelsheim, S., Bryan, A., Bustillo, J. R., Clark, V. P., Feldstein, S., Filbey, F. M., Ford, C., Hutchison, K., Jung, R., Kiehl, K. A., Kodituwakku, P., Komesu, Y., Mayer, A. R., Pearlson, G. D., Phillips, J., Sadek, J., Stevens, M., Teuscher, U., Thoma, R. J., and Calhoun, V. D. (2011). A baseline for the multivariate comparison of resting state networks. Front. Syst. Neurosci. 5:2. doi:10.3389/fnsys.2011.00002
Bockholt, H. J., Scully, M., Courtney, W., Rachakonda, S., Scott, A., Caprihan, A., Fries, J., Kalyanam, R., Segall, J., De la Garza, R., Lane, S., and Calhoun, V. D. (2010). Mining the mind research network: a novel framework for exploring large scale, heterogeneous translational neuroscience research data sources. Front. Neuroinform. 3:36. doi: 10.3389/neuro.11.036.2009
Buccigrossi, R., Ellisman, M., Grethe, J., Haselgrove, C., Kennedy, D. N., Martone, M., Preuss, N., Reynolds, K., Sullivan, M., Turner, J., and Wagner, K. (2008). The neuroimaging informatics tools and resources clearinghouse (NITRC). AMIA Annu. Symp. Proc. 2008, 1000.
Dinov, I., Lozev, K., Petrosyan, P., Liu, Z., Eggert, P., Pierce, J., Zamanyan, A., Chakrapani, S., Van Horn, J., Parker, D. S., Magsipoc, R., Leung, K., Gutman, B., Woods, R., and Toga, A. (2010). Neuroimaging study designs, computational analyses and data provenance using the LONI pipeline. PLoS ONE 5, e13070. doi:10.1371/journal.pone.0013070
First, M. B., Spitzer, R. L., Gibbon, M., and Williams, J. B. W. (1995). Structured Clinical Interview for DSM-IV axis I Disorders-Patient Edition (SCID-I/P, Version 2.0). New York: Biometrics Research Department, New York State Psychiatric Institute.
Ghinita, G., Kalnis, P., and Yufei, T. (2011). Anonymous publication of sensitive transactional data. IEEE Trans Knowl. Data Eng. 23, 161–174.
Hsiao, D. K., and Kamel, M. N. (1989). Heterogeneous databases: proliferations, issues, and solutions. IEEE Trans. Knowl. Data Eng. 1, 45–62.
Jack, C. R. Jr., Bernstein, M. A., Fox, N. C., Thompson, P., Alexander, G., Harvey, D., Borowski, B., Britson, P. J., J, L. W., Ward, C., Dale, A. M., Felmlee, J. P., Gunter, J. L., Hill, D. L., Killiany, R., Schuff, N., Fox-Bosetti, S., Lin, C., Studholme, C., DeCarli, C. S., Krueger, G., Ward, H. A., Metzger, G. J., Scott, K. T., Mallozzi, R., Blezek, D., Levy, J., Debbins, J. P., Fleisher, A. S., Albert, M., Green, R., Bartzokis, G., Glover, G., Mugler, J., and Weiner, M. W. (2008). The Alzheimer’s disease neuroimaging initiative (ADNI): MRI methods. J. Magn. Reson. Imaging 27, 685–691.
Keator, D. B., Gadde, S., Grethe, J. S., Taylor, D. V., and Potkin, S. G. (2006). A general XML schema and SPM toolbox for storage of neuro-imaging results and anatomical labels. Neuroinformatics 4, 199–212.
Keator, D. B., Grethe, J. S., Marcus, D., Ozyurt, B., Gadde, S., Murphy, S., Pieper, S., Greve, D., Notestine, R., Bockholt, H. J., and Papadopoulos, P. (2008). A national human neuroimaging collaboratory enabled by the biomedical informatics research network (BIRN). IEEE Trans. Inf. Technol. Biomed. 12, 162–172.
Keator, D. B., Wei, D., Gadde, S., Bockholt, J., Grethe, J. S., Marcus, D., Aucoin, N., and Ozyurt, I. B. (2009). Derived data storage and exchange workflow for large-scale neuroimaging analyses on the BIRN grid. Front. Neuroinform. 3:30. doi:10.3389/neuro.11.030.2009
Kim, D., Manoach, D. S., Mathalon, D., Turner, J., Brown, G., Ford, J. M., Gollub, R. L., White, T., Wible, C. G., Belger, A., Bockholt, H. J., Clark, V. P., Lauriello, J., O’Leary, D., McCarthy, G., Mueller, B., Lim, K., Andreasen, N. C., Potkin, S., and Calhoun, V. D. (2009). Dysregulation of working memory and default-mode networks in schizophrenia during a Sternberg item recognition paradigm: an independent component analysis of the multisite Mind and fBIRN studies. Hum. Brain Mapp. 30, 3795.
Kim, D., Sui, J., Rachakonda, S., White, T., Manoach, D. S., Clark, V. P., Ho, B. C., Schulz, S. C., and Calhoun, V. D. (2010). Identification of imaging biomarkers in schizophrenia: a coefficient-constrained independent component analysis of the mind multi-site schizophrenia study. Neuroinformatics 8, 213–229.
Marcus, D. S., Harwell, J., Olsen, T., Hodge, M., Glasser, M. F., Prior, F., Jenkinson, M., Laumann, T., Curtiss, S. W., and Van Essen, D. C. (2011). Informatics and data mining tools and strategies for the human connectome project. Front. Neuroinform. 5:4. doi:10.3389/fninf.2011.00004
Marcus, D. S., Olsen, T. R., Ramaratnam, M., and Buckner, R. L. (2007). The extensible neuroimaging archive toolkit: an informatics platform for managing, exploring, and sharing neuroimaging data. Neuroinformatics 5, 11–34.
Mayhew, D. J. (1999). The Usability Engineering Lifecycle: A Practitioner’s Handbook for User Interface Design. San Francisco: Morgan Kaufmann.
Nadkarni, P. M., Marenco, L., Chen, R., Skoufos, E., Shepherd, G., and Miller, P. (1999). Organization of heterogeneous scientific data using the EAV/CR representation. J. Am. Med. Inform. Assoc. 6, 478–493.
NIH. (2003). Data Sharing Policy and Implementation Guidance. Available at: http://grants.nih.gov/grants/policy/data_sharing/data_ sharing_guidance.htm
NSF. (2011). Award and Administration Guide. Available at: http://www.nsf.gov/pubs/policydocs/pappguide/nsf11001/aag_6.jsp#VID4
Petersen, R. C., Aisen, P. S., Beckett, L. A., Donohue, M. C., Gamst, A. C., Harvey, D. J., Jack, C. R. Jr., Jagust, W. J., Shaw, L. M., Toga, A. W., Trojanowski, J. Q., and Weiner, M. W. (2010). Alzheimer’s disease neuroimaging initiative (ADNI): clinical characterization. Neurology 74, 201–209.
Petrella, J. R., Sheldon, F. C., Prince, S. E., Calhoun, V. D., and Doraiswamy, P. M. (2011). Default mode network connectivity in stable versus progressive mild cognitive impairment. Neurology 76, 511–517.
Piwowar, H. A., Day, R. S., and Fridsma, D. B. (2007). Sharing detailed research data is associated with increased citation rate. PLoS ONE 2, e308. doi:10.1371/journal.pone.0000308
Potkin, S. G., Turner, J. A., Guffanti, G., Lakatos, A., Fallon, J. H., Nguyen, D. D., Mathalon, D., Ford, J., Lauriello, J., and Macciardi, F. (2009). A genome-wide association study of schizophrenia using brain activation as a quantitative phenotype. Schizophr. Bull. 35, 96–108.
Van Horn, J. D., and Toga, A. W. (2009). Is it time to re-prioritize neuroimaging databases and digital repositories? Neuroimage 47, 1720–1734.
Keywords: neuroinformatics, brain imaging, database
Citation: Scott A, Courtney W, Wood D, de la Garza R, Lane S, King M, Wang R, Roberts J, Turner JA and Calhoun VD (2011) COINS: an innovative informatics and neuroimaging tool suite built for large heterogeneous datasets. Front. Neuroinform. 5:33. doi: 10.3389/fninf.2011.00033
Received: 15 September 2011;
Paper pending published: 15 October 2011;
Accepted: 02 December 2011;
Published online: 23 December 2011.
Edited by:
John Van Horn, University of California at Los Angeles, USAReviewed by:
Kei H. Cheung, Yale University, USAXin Wang, The Salk Institute for Biological Studies, USA
Copyright: © 2011 Scott, Courtney, Wood, de la Garza, Lane, King, Wang, Roberts, Turner and Calhoun. This is an open-access article distributed under the terms of the Creative Commons Attribution Non Commercial License, which permits non-commercial use, distribution, and reproduction in other forums, provided the original authors and source are credited.
*Correspondence: Vince D. Calhoun, The Mind Research Network, 1101 Yale Blvd NE, Albuquerque, NM 87131, USA. e-mail:dmNhbGhvdW5AdW5tLmVkdQ==