 Gabriel Ziegler1*
 Robert Dahnke1
 Christian Gaser1,2 for The Alzheimer’s Disease Neuroimaging Initiative†
- 1 Structural Brain Mapping Group, Department of Psychiatry, Jena University Hospital, Jena, Germany
- 2 Department of Neurology, Jena University Hospital, Jena, Germany
The aging brain’s structural development constitutes a spatiotemporal process that is accessible by MR-based computational morphometry. Here we introduce basic concepts and analytical approaches to quantify age-related differences and changes in neuroanatomical images of the human brain. The presented models first address the estimation of age trajectories, then we consider inter-individual variations of structural decline, using a repeated measures design. We concentrate our overview on preprocessed neuroanatomical images of the human brain to facilitate practical applications to diverse voxel- and surface-based structural markers. Together these methods afford analysis of aging brain structure in relation to behavioral, health, or cognitive parameters.
Introduction
There is a growing interest in the neuroscience of aging. Magnetic resonance imaging (MRI) has become a promising and versatile technique for non-invasive in vivo measurement of the morphological changes the brain undergoes in aging and dementia. The fast emerging field of computational morphometry offers imaging methods that quantify a variety of anatomical features of aging brains (Toga and Thompson, 2003; Mietchen and Gaser, 2009). In addition, semi-automated voxel- and surface-based processing techniques afford developmental studies of large representative samples of healthy or clinical populations with high economy of time, no rater bias, and high sensitivity. The field of lifespan psychology (LP) provides a conceptual framework to describe the changes of brain and behavior during human ontogenesis (Baltes et al., 1999). The core assumption is that the brain and behavior keep on developing during the entire lifespan. Moreover, it emphasizes that development and aging can be studied with respect to the following aspects: (1) multidimensionality, (2) multidirectionality, and (3) inter-individual differences.
For our purposes, multidimensionality (1) states that examining brain structural development and aging using MR morphometry is a high-dimensional problem in modalities and space (i.e., brain regions). Application of different MR pulse sequences, segmentation techniques, voxel- or surface-based processing, and fiber tracking afford the acquisition of a large variety of structural brain markers (Toga and Thompson, 2003; Assaf and Pasternak, 2008; Mietchen and Gaser, 2009). Thus, age effects can be studied in local gray matter volume using voxel-based morphometry (VBM), cortical thickness by surface-based morphometry (SBM), white matter properties by magnetization transfer (MT) imaging and multi-echo T2-weighted sequences, and the integrity of fiber connections by diffusion tensor imaging (DTI; for review, see Raz and Rodrigue, 2006; Gunning-Dixon et al., 2009; Fjell and Walhovd, 2010). In addition, there is an increasing number of studies that aim at combining information from different modalities in order to explore the underlying processes of age-related brain structural changes (Westlye et al., 2010; Draganski et al., 2011). At the same time, most computational and semi-automated methods provide anatomical markers in 3D volume- or 2D surface space that obtain resolutions in the range of millimeters. The advantage of this “quasi-continuous” measurement is the sensitive detection of age-related effects without the restriction of any a-priori assumptions regarding location and spatial extent. The existing studies reveal a heterogeneous regional pattern of age effects over the lifespan (Raz and Rodrigue, 2006; Raz and Kennedy, 2009; Walhovd et al., 2009; Fjell and Walhovd, 2010) indicating region-specific processes in structural brain aging.
Modeling the trajectories of neuroanatomical markers’ growth and/or decline as a function of age, studies have observed substantial variation in directions of change (Raz and Kennedy, 2009; Fjell and Walhovd, 2010). This multidirectionality (2) of brain aging is expressed by annual rates of decline in structural aspects of a region such as local gray matter volume, cortical thickness, etc. In addition, the local rates of decline allow to estimate the extrapolated loss of brain structural integrity across the adult lifespan. A related question is whether structural aging accelerates with advancing ages. There is evidence that annual rates of decline may exhibit substantial changes over decades (Ziegler et al., 2011). Consequently, an age trajectory’s functional form could potentially contain information about qualitatively different phases (e.g., increase, plateau, decline) and the timing of structural development and degradation (Raz et al., 2005; Fjell and Walhovd, 2010).
The third aspect of development across the lifespan is related to the ongoing reciprocal interaction between the individual ontogeny and its surrounding biocultural context (for a conceptual framework, see Baltes et al., 2006). It is assumed that structure and function of a subject’s brain (at a certain age) depends on the individual genetic code, its unique learning experience, and the past and currently prevailing inner- and extraorganismic environment. As a consequence of cumulative effects over the lifespan, one would expect substantial inter-individual differences (3) in the micro- and macrostructural architecture in the brains of elderly people even at the same age. Exploring these individual differences in healthy, prodromal, and pathological forms of age-related change is a major challenge for neuroimaging studies.
An important research issue still is the identification of protective and risk-inducing factors. That is, which contributors and modifiers do protect or harm integrity of brain structure, function, and cognitive abilities into an advanced age. This perspective has motivated a large number of studies addressing the specific role of structural brain markers for normative age-related cognitive decline observed in healthy elderly people (Raz and Kennedy, 2009; Salthouse, 2011). However, there is still a lack of longitudinal studies that relate intra-individual changes of whole brain morphology at a local level to covariates and predictors, such as cognitive abilities (Raz and Lindenberger, 2011; Salthouse, 2011). There is also a potential for improvement by applying multivariate models to analyze age differences and intra-individual change (Bray et al., 2009; Salthouse, 2011).
In this paper we overview basic analytical approaches to study core aspects of age-related differences and individual changes in MR-based morphometry. This suggests practical application to a multitude of voxel- and surface-based markers that reveal structural dynamics in the temporal range of months to several decades of the lifespan. We close with a discussion of limitations and opportunities for further improvement.
Age-Related Effects, Trajectories, and Regression
Much of the research on aging cognition and brain structure uses a cross-sectional study design. Usually this refers to single MRI acquisitions of individuals, covering a certain age range over the lifespan. Organization, collection, preprocessing, and analysis costs are comparably moderate, which makes it generally attractive for many research settings and also substantially increases available sample sizes. In this section we further discuss analysis of a single cross-sectionally sampled and preprocessed MR-based neuroanatomical marker (e.g., gray matter volume or cortical thickness) that has been normalized (or warped) to either a voxel- or surface-based reference template respectively and smoothed afterward (see Mietchen and Gaser, 2009). For making inferences about age effects it is important to assume that all applied preprocessing techniques are completely age-unbiased. We take m subjects’ morphometry datasets, each having n structural features that correspond to voxels or vertices of a reference template. We arrange this dataset to the m × n brain structure matrix Y with entries yij (using observations in rows and voxels- or vertices in columns) and the corresponding subject ages in the m × 1 column vector age = [age1, age2, …, agem]T. Unless otherwise specified bold face letters denote either matrices (e.g., M) or column vectors (e.g., m) of observed or estimated deterministic data. The corresponding non-boldface letters denote stochastic random vectors (e.g., Y) or random variables (e.g., y).
Generative and Recognition Models of Age
Regarding the modeling of an aging brain structure, we would first like to emphasize a valuable distinction of applied techniques into generative and recognition models (see Figure 1; Friston and Ashburner, 2004; Friston et al., 2008). Both quantify how causes or experimental factors (e.g., pathology, mental states, developmental stage etc.) can be related to differences in brain measures (e.g., MRI/fMRI). Importantly, they strongly differ in the directions of prediction and inference, and modeling of errors. Thus generative and recognition models yield to specific applications in structural brain aging research.
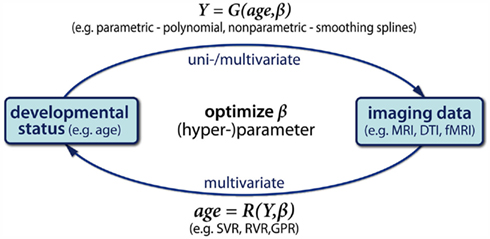
Figure 1. Schematic illustration of generative and recognition models of age. A generative model G predicts the brain structural differences Y as a univariate or multivariate parametric function of age (top). Conversely, recognition models R predict individual’s age or age-group based on brain differences Y (bottom). According to the multidirectionality, age trajectories are not assumed to be strictly increasing or decreasing functions of age, e.g., inverted-U shaped. Consequently, in case of continuous age, these univariate recognition models are not reasonable (see also Friston and Ashburner, 2004).
Generative Models: A generative (or forward) model predicts the brain structural differences Y as some parametric function G of age, i.e., Y = G(age, β). We apply parameters β that perform best in prediction of sample brain data based on subjects’ ages. Building a generative model of Y requires a-priori information and assumptions regarding how the brain structure is explicitly related to age. For instance one assumes whether G contains linear, polynomial, or more complex functions of age. Then, by testing significance of these parameters β and differences of model performance one is able to infer about age effects and different shapes of age trajectories, non-linear terms, etc.
Recognition Models: Conversely to generative models, by applying recognition models in neuroimaging we make inferences regarding experimental factors (e.g., stimulus category, disease groups, or subjects’ developmental status) from the brain differences. In the special case of aging research, a recognition model uses some parametric function R of brain structural differences Y to optimally predict subjects age-group (via classification) or the exact biological age (via regression), i.e., age = R(Y, β). Such an inference regarding brain age might be useful for diagnosis of dementia and pathological aging. Alternatively, recognition models can be applied directly to separate healthy aging, prodromal stages, and pathological changes in the aging brain.
Mass-univariate generative models of age
The application of generative models is valuable to obtain insights into the multidirectionality of brain development and age-related differences. At the same time, these models can provide information about the regional variability of age effects. Both aims can be achieved by arranging G in a “mass-univariate” manner, i.e., modeling the structural marker Y with independent functions for each voxel- or vertex in the brain separately: G = (g(1)(age, β1), …,g(n)(age, βn))T (see also Friston et al., 1995). Although G provides more flexibility, the local age trajectories g(k)(age, βk) (of different voxels- or vertices k) are often chosen from the same class of parametric functions, e.g., linear, quadratic, etc. Then the general linear model (GLM) provides a powerful and flexible framework to implement various types of cross-sectional age trajectories, which are linear in the parameters. Under the assumptions of the Gauss–Markov theorem, ordinary least squares (OLS) minimization provides “optimal” unbiased estimators of voxel- or vertex-wise statistical parametric maps (SPMs) for each parameter (for review, see Monti, 2011). After estimation, the SPMs can be easily tested against null hypothesis, which affords classical inference about region-specific effects of age. It is important to note that generative models of age are not necessarily univariate and thus G can also be implemented using a multivariate spatial model, e.g., using spatial prior modeling, canonical variates analysis (CVA), etc.(Kherif et al., 2002).
Polynomial model of age. In order to explore multidirectionality of brain development across the lifespan, many studies assume a linear age trajectory due to its conceptual simplicity, straightforward interpretation, and robustness. However, this linearity assumption may be questioned due to the complex interactions taking place in the aging cellular systems that underlie neuroanatomy. It is therefore reasonable to suppose that the true structural age trajectories g(age) are arbitrarily continuous and differentiable functions of age. Hence, the annual rate of decline is given by its derivative, i.e., g′(age). Apparently, a linear approximation (as applied in many studies) is not necessarily valid if the sampled age range increases and g(age) is highly non-linear, e.g., inverted-U shaped. This might have led to contradictory results in structural aging literature (see Walhovd et al., 2009; Fjell and Walhovd, 2010) and thus motivates the application of more flexible models. A more general model for local age trajectories uses the p-th degree polynomial expansion of age in all voxels- or vertices k:
This can be easily rewritten in the GLM matrix form Y = XB + E , using the design matrix X = [age0, age1, …, agep] containing column-wise ascending powers of subject ages, the parameter matrix B with entries βr+1,k, and matrix E with errors εik. We further suppose that Gaussian errors are independent of the deterministic and pairwise linear independent predictors (Monti, 2011). For p = 1, this results in a linear approximation of the age trajectory. It is important to note that for higher degrees the GLM model estimation would be seriously affected due to the problem of multicollinearity, i.e., substantial correlations of predictors (Andrade et al., 1999). The multicollinearity of the design matrix increases the variance of parameter estimates of all correlated predictors and thus reduces the sensitivity to identify and separate specific age effects of degree p. It therefore is recommended to orthogonalize the age predictors X using either Gram–Schmidt algorithm or QR-decomposition.
A crucial point of the polynomial model is the a-priori selection of an appropriate degree for the age range and structural marker of interest. Many studies report the existence of linear and quadratic age effects while cubic effects are often not investigated (Raz and Rodrigue, 2006; Raz and Kennedy, 2009; Walhovd et al., 2009; Fjell and Walhovd, 2010). Using the GLM and a sufficiently high degree, e.g., p = 4, different models can be tested via F-statistics comparing explained variances or t-statistics of a particular parameter of interest (e.g., β2k for quadratic effects). Therefore, the polynomial model allows addressing two aspects of multidirectionality of structural brain aging. Firstly, it affords inference about region-specific age effects and provides estimates of local annual rates of decline using a linear approximation. Secondly, it enables the detection of changes in the annual rates of decline by rejection of the linearity assumption via significant terms of higher degrees. Figure 2 depicts the application of a second degree polynomial age model to a large database of VBM data1. Notably, there are severe limitations of using polynomial models to represent brain structural trajectories as a function of age (Fjell et al., 2010). Firstly, the shape, the extreme values, and the inflection points of lower degree models are highly restrictive, imposing strong constraints on the unknown developmental process. This might reveal biased estimates of characteristic points (e.g., the maximum values) and the corresponding ages. Secondly, the polynomial model is a global regression method, i.e., each part of the trajectory strongly depends on all datapoints irrespective of their age difference. For instance the estimated trajectory at the age of 20 is also influenced by subjects with ages of 90 which is not a desired behavior of the model. Finally, the parameter estimates obtained by OLS minimization would be seriously affected by uneven sample distributions, often observed in research practice.
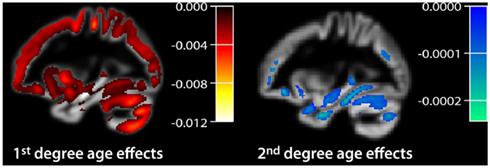
Figure 2. Application of a polynomial age model in a large cross-sectional healthy subjects sample of voxel-based morphometry data (n = 1094, 18–94 years, normalized gray matter volume segment). Here we depict the estimates of first and second degree beta coefficients. We applied a voxel threshold of t = 5.097, p < 0.05, FWE corrected.
Non-parametric regression methods. Alternatively, rather than finding the parameters with respect to some fixed set of basis functions, non-parametric regression techniques might provide a more unbiased estimation of the true developmental trajectory. Thus applied to a cross-sectional dataset they directly aim at finding an “optimal” generative model that predicts the local structure in voxel- or vertex k as a function of age:

After performing the non-parametric regression, the estimated function g(k) itself contains the information about age-related differences and thus we here leave out the parameters. Nevertheless, non-parametric regression methods often use parameters or hyperparameters concerning priors. Notably, the optimization takes place without forcing the age trajectories g(k) into a rigidly defined parametric class of functions (Fox, 2008). The trajectories are only supposed to be smooth continuous functions of age. Here, we briefly outline three methods to obtain age trajectories non-parametrically, which are called linear smoothers.
Local regression. This non-parametric method provides a local approximation of the age trajectory g(k) using linear or quadratic functions (Cleveland, 1979; Cleveland et al., 1988). It is local in the sense that the estimated structural value at a specific age is more strongly influenced by subjects with similar ages. In contrast to the above polynomial model, it uses weighted least squares (WLS) optimization to estimate the trajectory at a certain age. The smoothness of the resulting loess-fit strongly depends on the bandwidth of the local weighting function which has to be chosen in advance.
Smoothing spline regression. The idea of spline regression is to determine an “optimal” age trajectory that maximizes its goodness of fit and the smoothness at the same time (Craven and Wahba, 1978; Silverman, 1985; Wahba, 1990). In particular, it optimizes a modified version of the sum of squares that additionally includes a roughness penalty term and a smoothing parameter λ that balances both desired properties of g(k):
Then, the minimization of S specifies the age trajectory in the form of a piecewise cubic spline. According to the choice of λ, the “optimal” trajectory can exhibit strong overfitting (i.e., λ = 0) or even a linear approximation (i.e., λ → ∞) of the data. Favorably, generalized cross-validation (GCV) has been suggested for automatic determination of the smoothness parameter (Craven and Wahba, 1978) using a tradeoff of goodness of fit and model complexity (in terms of estimated degrees of freedom). For a further discussion of model selection criteria see also Fjell et al. (2010). Figure 3 depicts the application of a non-parametric smoothing spline regression (SSR) to estimate local age trajectories in a large sample of VBM data2.
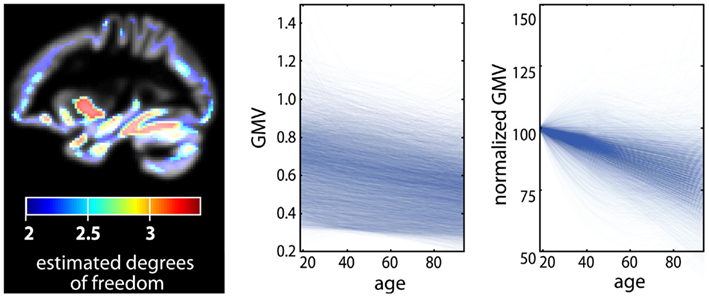
Figure 3. Application of a non-parametric age model in a large cross-sectional healthy subjects sample of voxel-based morphometry data (n = 1094, 18–94 years, normalized gray matter volume segment). The voxel-wise age trajectories were achieved using a smoothing spline regression technique with generalized cross-validation to identify the optimal smoothing parameter from the interval [1, 1.5]. The effective degrees of freedom of the estimated local spline trajectories are depicted (left). The plot shows obtained age trajectories in 10000 randomly selected gray matter voxels (middle). We also show a normalized version of age trajectories using gray matter volume at age 18 as a reference for further lifespan development (right).
Gaussian process regression. Non-parametric regression is also discussed from the perspective of Bayesian inference (Silverman, 1985). Thus it is reasonable to consider the whole structural age trajectory as a probabilistic entity. Instead of focusing on fixed estimates of age trajectories g(k)(age), a probabilistic perspective accounts for the substantial shape uncertainty of resulting fits using cross-sectional MR data with between-subject variability and errors. Gaussian process (GP) regression (GPR) is a framework which directly allows modeling of trajectories as distributions with a mean and spread (Rasmussen and Williams, 2006). To put it simply, one can think of GPR as an equivalent to regression analysis using an infinite number of basis functions. In general, a GP is a distribution of functions that is fully specified in terms of a mean function and a covariance function (or kernel). For our purpose, we define the mean and covariance function using the expectation and the covariance of the unknown true local age trajectory g(k)(age):
Using this mean and covariance function allows us to consider the local structural differences (of voxel- or vertex k) in terms of Gaussian Processes (for details, see Rasmussen and Williams, 2006):
In order to build non-parametric generative models of age, GPs may be useful in the following ways: firstly, specific constructions of mean and covariance functions allow the definition of priors over neuroanatomically plausible age trajectories including trends or smoothness constraints. Secondly, the priors can be conditioned on Gaussian MR-based structural data. This results in posterior distributions which characterize the local structural age trajectories given observations. Similar to loess and spline regression, GPR also requires the estimation of free (hyper-) parameters of the covariance and mean function.
In order to obtain estimates of the local age trajectories, the non-parametric regression methods have some drawbacks. Firstly, it is important to note that different non-parametric methods and implementations may vary with respect to the applied criteria for their optimization, i.e., what does “optimal” mean quantitatively? This favors the application of free, publicly available tools with a high level of transparency such as the statistical package R3 and the Gaussian Processes for machine learning package4. Secondly, the optimization of the hyperparameters (e.g., smoothness parameter of smoothing splines and covariance parameters of GPs) is computationally intensive and can be time consuming in a “mass-univariate” application to local brain data. Alternatively, spatial generative models of age using smoothness priors might provide a promising alternative (Penny et al., 2005; Groves et al., 2009). Thirdly, inferences about trajectory shape are not accessible by simple test statistics. Thus, application studies often draw the non-parametric estimates of age-related trajectories without measures of confidence, irrespective of the substantial variability around the mean. However, local regression (LOESS) and GPR also provide confidence intervals and variances, which might be useful for trajectory plots and formal inference about regional variability of age-related decline and comparisons of clinical groups in future studies (Cleveland, 1991; Rasmussen and Williams, 2006). A related issue is the inference about characteristic points of the timing of decline, e.g., ages of maximal acceleration of decline. Permutation testing or bootstrap resampling might be used to yield significance of regional differences and confidence intervals on estimates.
Multivariate recognition model: pattern-based estimation of individuals’ brain age
The recognition model class was predominantly motivated and developed in the field of machine learning and pattern analysis. Many approaches to classification and regression in high-dimensional datasets have evolved, often using kernel methods or Bayesian learning. Recognition models have also been successfully applied in developmental neuroimaging research (Bray et al., 2009; Franke et al., 2010). Only a few studies have aimed at finding a function that performs best in predicting the individual ages given a MR-based morphological marker:
Here we use yi to denote the whole preprocessed image of subject i (i.e., the i-th row of Y) and β is a vector of hyperparameters. In order to predict the age of individuals, we do not simply invert the local generative age trajectories g(k)(age, βk) because of two reasons. Firstly, according to the multidirectionality age trajectories are not assumed to be strictly increasing or decreasing functions of age. Conversely, lifespan trajectories are often expected to be three-phasic with increase, plateau, and decrease, e.g., inverted-U shape (Fjell and Walhovd, 2010). Secondly, according to Davatzikos (2004) and Friston and Ashburner (2004) a “mass-univariate” approach is advantageous for the analysis of region-specific age effects, but it seems insufficient for predictions and clinical classification tasks. In particular, to optimally predict ages of individual subjects, the inter-regional dependencies of the local age effects should be taken into account. Using a “mass-univariate” approach, these dependencies are expressed by correlated model errors over voxels- or vertices (Friston and Ashburner, 2004). In contrast, a multivariate model is able to account for correlations and redundancies in the high-dimensional structural images. This suggests using the whole preprocessed image as a multivariate input to a single prediction function R. In addition to univariate regression, the framework of Gaussian Processes is also capable of making predictions based on high-dimensional input-spaces, e.g., morphological images (Rasmussen and Williams, 2006). There is a large variety of covariance functions that can be applied, e.g., the squared exponential or rational quadratic, etc. In order to implement the age estimation model including prediction errors, one might apply the GPR with the following choice of a covariance function (see also Franke et al., 2010):
Due to its particular structure, performing regression with kernel k is also called relevance vector regression (RVR; Tipping, 2001). The fundamental idea of GPR age estimation with relevance vector covariance is as follows: firstly, we place basis functions φi on all m input images in the dataset. Secondly, we optimize the hyperparameters  (via marginal likelihood) which increases some αi and therefore removes the contribution of the corresponding basis function φi to the covariance function. The remainders of the contributing images, yi, are called relevance vectors which constitute a sparse representation of the training images Y. The covariance function with optimized hyperparameters β then specifies a Gaussian prior distribution. Third, if we condition the prior distribution on a given dataset of images, we obtain the posterior and the predictive distribution including estimated ages. Finally, in order to estimate the generalization error of the framework, the performance of the age estimator R(y, β) can be tested in an independent dataset or applying other cross-validation techniques (Schölkopf and Smola, 2002). Figure 4 depicts the application of the above presented multivariate recognition model to perform MR-based age estimation in healthy and clinical subjects (for details, see Franke et al., 2010). A critical issue of multivariate recognition of age-related differences is the “curse of dimensionality,” i.e., the necessity of precedent feature selection or dimensionality reduction in the image space. Apart from multivariate dimensionality reduction techniques (van der Maaten et al., 2009) down sampling might also be useful (Franke et al., 2010). Secondly, multivariate recognition of the aging brain structure is restricted to comparable large training samples obtained from semi-automated processing. Thirdly, after training there is low transparency of the fitted age model, i.e., it only contains implicit knowledge about the process of structural aging. Consequently, the strength of this approach lies in its ability to make predictions in unseen cases and applied clinical research.
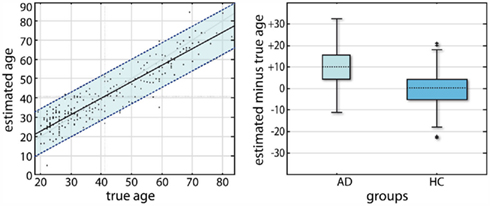
Figure 4. Application of a recognition model of age to cross-sectional voxel-based morphometry (VBM) data (taken from Franke et al., 2010). The recognition model was implemented using a relevance vector machine (RVR) which afterward was trained on 410 healthy subject’s gray matter segments after VBM preprocessing. Brain-based age estimation results in an independent test sample of n = 245 (left). The overall correlation between estimated and the true age is r = 0.92, and the overall mean absolute error is 4.98 years. Box plots of estimation residuals, i.e., estimated age minus true age is shown for two subsamples from the ADNI database (AD with CDR = 1, NO with CDR = 0; right). The gray boxes contain the values between the 25th and 75th percentiles of the samples, including the median (dashed line). The width of the boxes depends on the sample size.
Limitation of Cross-Sectional Methods
There are substantial limitations of cross-sectional designs in brain aging research. Firstly, in order to analyze multidirectionality of local neuroanatomical development, one cannot exclude the effects of different birth cohorts and secular trends. In addition, the sampling may be age-biased resulting in an unrepresentative composition over ages (Raz and Rodrigue, 2006). Secondly, the sensitivity of detection of polynomial effects of age is expected to vary substantially with the sample distribution (e.g., range and size) and the true amount of between-subjects differences. Thirdly, the major concern here is that the presented models do not explicitly account for inter-individual variability of brain structure for fixed ages. All introduced generative models aim at estimating the average population brain structure as a process of age. However, this “moving average” would simply overlook any subgroup with a more successful structural aging pattern (see Fjell et al., 2006). Consequently, by applying the above models, the obtained residuals represent an unknown mixture of the measurement and preprocessing errors and the true inter-individual variability of local brain structure. At least in part, repeated measures MRI allows these influences to be disentangled and provides valuable measures of reliability of MR-based morphometry.
Analysis of Inter-Individual Variability in Aging Brain Structure
There is an increasing interest in MR-based neuroimaging methods that allow measuring local neuroanatomical variability in healthy populations (for review, see Ashburner and Kloppel, 2010). Studies using VBM (Ashburner and Friston, 2000) have successfully addressed these inter-individual differences of adult brain structure and have given some insights into the complex relation to behavior and cognitive processing (Eckert, 2011; Kanai and Rees, 2011). Irrespective of their potential to separate age-related change and inter-individual differences, there is still a lack of studies addressing between-subjects neuroanatomical variability in repeated measurement designs. Moreover, the existing longitudinal designs are often restricted to a-priori selected regions of interest (ROI). This section addresses the estimation of voxel- or vertex-wise individual neuroanatomical age trajectories, their variability across subjects and promising models to identify correlated changes between neuroanatomy and other levels of the brain–behavior–environment system, e.g., cognitive performance, lifestyle, and health parameters, etc.
Longitudinal Design
In the field of neuroimaging, a longitudinal design refers to repeated MRI acquisitions of people’s brain, covering a maximum of a few years of the lifespan. This within-subject (or intra-individual) sampling can be more or less time-structured, often taking place at a baseline measurement with one to four annual follow-ups. However, most studies do not standardize the subjects’ ages at baseline and thus the between-subject (or inter-individual) sampling also covers a certain age range. Owing to the number of follow-ups, the effort to organize sampling and MRI acquisitions increases enormously. In addition to the high costs and efforts of longitudinal design, these studies often face selection bias and late selective dropouts (Lindenberger et al., 2002; Raz et al., 2005). As we intend to demonstrate only the analysis, we begin with preprocessed images (e.g., cortical thickness or gray matter volume) that have been normalized to either a voxel- or surface-based reference template, respectively. Notably, the selection of an appropriate data structure for spatially distributed (or “quasi-continuous”) longitudinal measurements is not trivial. Although the practical implementation of models presented below is much more flexible, for reasons of simplicity, we assume time-structured data with three annual follow-ups to be in the following form: the Y(k) matrices contain the preprocessed MR-based markers for brain locations k = 1, …, n, e.g., voxels or vertices. The entries of Y(k) are denoted  for subject i = 1, …, m at time point j = 1, …, 5. The corresponding subject ages at baseline measurement are represented by the column vector age. In addition, we use the vector time = [0, 1, 2, 3, 4]T to code the intra-individual measurement timing, i.e., baseline, first follow-up, …, fourth follow-up.
Modeling Change: The Individual Decline Model
Compared to the cross-sectional analysis of age-related differences (i.e., expressed by age covariations) longitudinal data enables analysis of age-related change of brain morphometry. Primarily, this is reflected by taking a within-subject perspective in analysis, modeling brain changes in each subject separately. More specifically, due to the expected between-subjects variations of change, we are particularly interested in individual trajectories  of subject i. There are three reasons that justify the choice of a linear parametric decline model for
  : Firstly, most studies with longitudinally MRI do not cover more than a few measurements. Thus the low number of follow-ups restricts the complexity (i.e., degrees of freedom) of the intra-individual change model. Secondly, the covered age range of a few years makes the rejection of linearity rather unlikely, even if much more samples were available. Thirdly, the individual MR-based measures on voxel- or vertex level are prone to scanner inhomogeneities, segmentation, and normalization errors. This often results in large errors and residual variance and favors the simplicity of the model to provide robust estimates of change. Consequently, for many longitudinal MR studies it is reasonable to apply the following linear approximation of the individual decline curves:

Since longitudinal MR data intrinsically varies due to space, time and persons, symbolic description requires triple indexing. To avoid confusion, we omit the space index (indicating voxels- and vertices k) in all models of intra-individual change though we reintroduce the brain locations in the final prediction models of brain change. Assuming the independence and homoscedasticity of errors, the OLS minimization provides unbiased estimates of the individual change parameters namely the initial status bi0 and the slope or annual rate of decline bi1 for each subject (Singer and Willet, 2003). The GLM facilitates the effective “whole brain” implementation of the individual decline model. The resulting images of determination coefficient R2 and residual variance can vary substantially over voxels or vertices and subjects, depending on the success of morphometric preprocessing. Figure 5 depicts an application of the linear decline model to longitudinal VBM data in a sample of healthy elderly5. Importantly, Willet (1989) revealed the following relation about the reliability of the slope estimates using the above individual decline model (for balanced designs and i.i.d. errors):
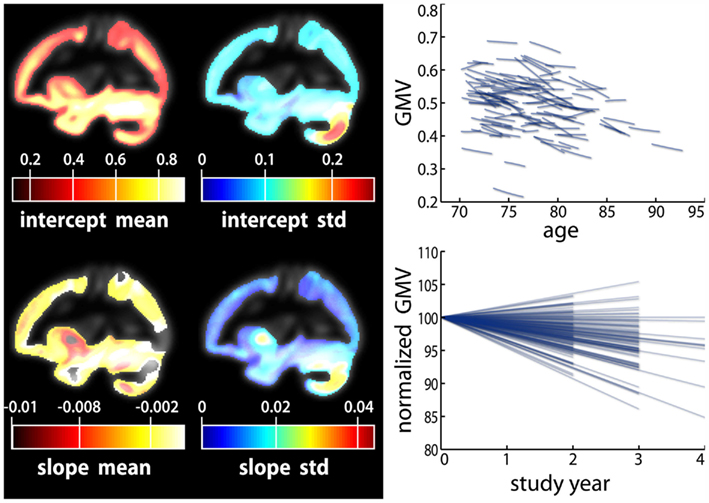
Figure 5. Application of a linear decline model to a longitudinal sample of voxel-based morphometry data. The individual gray matter intercept and slope parameters were estimated using 572 MRI scans of 123 healthy subjects with ages 70–90 at baseline. Number of follow-ups varied from two to four. Local mean and SD of intercept and slope parameters (left). Longitudinal individual linear decline models of a right hemisphere hippocampus voxel (right top). Normalized decline models showing percent gray matter change relative to baseline (right bottom).
Thus the reliability of the slope estimates depends on the true variation of the slopes  the error variance
  and the corrected sum of squares of the time variable CSST (see illustration in Figure 6). Moreover, this has substantial implications for future studies using longitudinal designs. The keypoint is that the reliability of estimated annual rates substantially increases with the temporal spread of longitudinal measurements in terms of CSST. Importantly, this can be achieved by adding follow-ups or placing them out of the center of the time variable. For instance with
  using three instead of one annual follow-ups increases the reliability from 50 to 91%. However, the fitted linear OLS trajectories are rather convenient for exploratory purposes than for making inference about inter-individual differences of age-related change (Singer and Willet, 2003). Using OLS, the between-subject variations of the error variance are not taken into account. Instead of fitting the individual decline separately, multi-level models of change have been suggested to estimate error-free latent change parameters (McArdle, 2009).
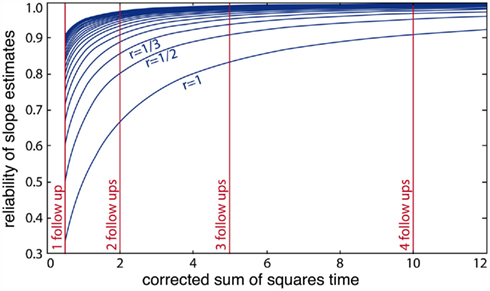
Figure 6. Illustration of the reliability of ordinary least squares slope parameter estimates and its dependency on the corrected sum of squares of time variable (CSST). Non-linear functions depict the expected increase of reliability with CSST for different ratios r = 1/h of (error variance)/(true slope variance) for h = 1, 2, …, 10. The vertical lines indicate values of CSST for one, two, three, and four annual follow-up measurements in a longitudinal MRI design.
Separating Variability in Elderly Using Multi-Level Models
The within-subject structural decline and the between-subject variations can also be combined in a single statistical model. In general the aim is achieved by hierarchical modeling that includes both levels of variation (see also Friston et al., 2002). We here apply a multi-level (or mixed-effects) model (Bryk and Raudenbush, 1987) to local neuroanatomical changes in elderly people. The first level sub-model embodies the linear approximation of intra-individual brain change  similar to the fitted OLS trajectories:

In addition, there is a second level sub-model that further specifies the inter-individual relations of the first level change parameters. For our purpose, the second level simply models the subject’s deviation from the initial status β00 and slope β10 parameters in the population:
Furthermore, the multi-level model assumes zero mean Gaussian distributions for the first level residual εij and second level residuals ζ0i and ζ1i:
The first level residuals εij account for erroneous variations around the individual linear decline model. Age effects and multidirectionality can be tested via parameters β00 and β10, that are often called fixed effects. However, the idea here is to study inter-individual differences of aging morphology by analysis of the random effects α0i and α1i, i.e., the variation of the individual decline parameters around the population means. According to the second level sub-model, this deviation is explicitly represented by the residuals ζ0i (for the initial status) and ζ1i (for the slopes). In order to estimate the fixed and random effects, many implementations apply maximum likelihood (ML), generalized least squares (GLS; Raudenbush and Bryk, 2002; Singer and Willet, 2003), or Bayesian methods with expectation maximization (Friston et al., 2002; Schmid et al., 2009). We denote the local second level residuals (or centered random effects) with  and
and  for subject i and voxel or vertex k. For reasons of simplicity, we arrange the centered random effects to the following matrices for initial status I0 and slope S:
In particular, rows of S include the subjects’ images of annual rates of decline during the study period. In conclusion, the linear approximation of local individual trajectories  and multi-level modeling condenses the whole longitudinal dataset to two matrices containing the intra-individual change parameters.
Notably, there are some limitations and caveats of repeated measures MRI data in general and multi-level modeling in particular. Firstly, longitudinal MR-based morphometry is prone to artifacts due to scanner inhomogeneities, registration inconsistency, and subtle age-related deformations of the brains. Thus it needs highly sophisticated preprocessing pipelines in order to detect the changes of interest and achieve unbiased results (Reuter et al., 2010; Reuter and Fischl, 2011). Secondly, a related issue is that the multi-level analysis of longitudinal changes in voxel- or vertex-wise neuroanatomical markers requires high retest-reliability of local structural measures. A few existing evaluation studies on this topic provide promising results for VBM and cortical thickness (Dickerson et al., 2008; Schnack et al., 2010). Thirdly, on the one hand, multi-level modeling is capable of missing scans and unbalanced designs (i.e., between-subject variations of the follow-up times). On the other hand, it is a large sample procedure, which is limited by enormous costs and efforts of this particular study design. Fourthly, the intra-individual change models are seriously affected by correlated residuals due to repeated preprocessing errors over follow-ups (Singer and Willet, 2003). One can account for this by explicit modeling of autocorrelations in the first level residual covariances (see Friston et al., 2002). Finally, the application of multi-level models in a “mass-univariate” manner, i.e., for voxel- or vertex-wise analysis of age-related decline, can be computationally expensive. This limitation can be overcome by using efficient implementations and algorithms (Pinheiro and Bates, 2000).
Explaining Inter-Individual Variability in Structural Aging
A large variety of studies address potential modifiers of structural decline in older ages. On one hand there is evidence that hypertension (Raz and Rodrigue, 2006), obesity and diabetes (Luchsinger and Gustafson, 2009), and high plasma homocysteine concentrations (Oulhaj et al., 2010) increase the individual risk for brain deterioration and dementia. In addition, the lifestyle factors such as vascular and aerobic fitness (Erickson et al., 2009), and healthy nutrition (Frisardi et al., 2010; Féart et al., 2010) are discussed as promising protective factors in order to maintain the structural integrity in old age. On the other hand, psychometric tests of cognitive abilities and intelligence are also potential covariates of structural change (Fjell and Walhovd, 2010). However, the complex interactions of aging brain structure with cognitive functioning are still not completely resolved (Raz and Kennedy, 2009; Salthouse, 2011).
Predictor models: past differences vs. present changes
Studying the aging brain structure in relation to covariates from other levels of the brain–behavior–environment system is a methodologically challenging task (Lindenberger et al., 2006). At first, we assume a set of multiple predictors (e.g., memory performance subscales) that were acquired at baseline MR measurement X0 and again at the last follow-up X1 (containing predictor subscales in columns and observation in rows). The predictors can be twofold (a) person-specific attributes that are highly stable, e.g., genes, total brain intracranial volume, etc. (i.e., X0 ≈ X1) or (b) variables that exhibit developmental changes during the study period, e.g., depression symptoms (i.e., Δ X = X1 − X0). Figure 7 illustrates the situation faced in a typically MR longitudinal setting with predictors. It depicts three hypothesized regional age trajectories  from a single subject before, during, and after the study. Moreover, it embodies this particular subject’s linear decline model including the initial status I0, the slopes S, and the interpolation to the age with the last MRI follow-up I1.
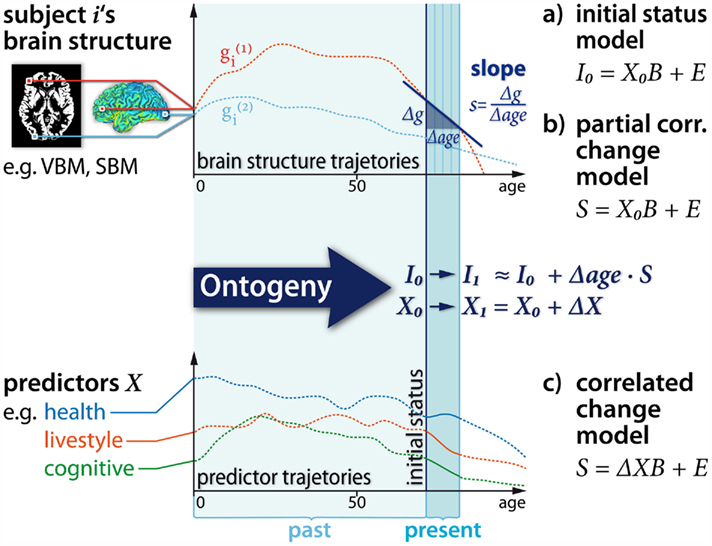
Figure 7. Illustration of analysis of inter-individual variability in longitudinal structural brain imaging studies. Brain level (top): we show the individual subject’s local lifespan trajectories and the longitudinal sampling with baseline MRI and four annual follow-ups. A linear approximation of the trajectories reveals individual change parameters, namely the initial status I0 and slope/annual rate of decline S. Predictor level (bottom): here we depict hypothetical trajectories of predictors and covariates for structural brain changes. The baseline predictors are called X0 and predictor change across the study is ΔX. (a), (b), and (c) are suggested linear prediction models for individual change parameters (right).
In order to identify potential modifiers and correlates of brain aging we briefly review three models that afford testing their local effects on aging and age-related differences in brain structure (see also Salthouse, 2011):
Predicting the initial status. In this first model we use the baseline predictors X0 to predict the inter-individual differences in the estimated baseline brain structure I0. The model is similar to a typical cross-sectional analysis of effects of the covariates. However, the initial status does not reflect the intra-individual changes during the study period. Thus predicting the initial status equals the analysis of brain development and aging before the study onset. In particular, correlations of X0 and I0 characterize the cumulative effects of all predictor–brain interactions during the subject’s past including gestation. For instance significant effects of lifestyle predictors on the initial status can reflect lifestyle–brain interactions that occurred at 1, 10, or even 60 years before the first MR measurement. Thus because these effects are not necessarily related to the process of aging, the conclusions derived from this model are strongly restricted by its lack of specificity.
Partial correlated change. In contrast, this model predicts subjects’ intra-individual change parameters S using the baseline predictors X0. Thus the between-subjects differences are used to forecast the within-subject structural brain decline during the study. For instance subjects with higher memory capacity at study onset may reveal a less negative annual rate of change. Practically, this is often applied if the predictors are not expected to change, e.g., genetic information or if predictor follow-ups are not available. Notably, because the baseline predictors may be similar to earlier ages in life, the predictor–brain interaction could have started long before the study (Salthouse, 2011). However, the partial correlated change model gives evidence about the brain changes that take place during the particular study period. Therefore it might provide specific insights about the modifiers and correlates of structural brain aging.
Correlated change. This model additionally requires (at least) one follow-up measurement of the predictors and accounts for their change ΔX during the study. Then, the predictor change is tested for correlations with brain change in terms of slope differences S. For instance Murphy et al. (2010) found that elderly subjects with stronger longitudinal decline in fusiform gyrus thickness also exhibited stronger decline in memory tests. In contrast to the partial correlated change model, this model additionally exploits temporal specificity of the ongoing age-related changes on the predictor level. However, it is often unknown which (latent) processes underlie the interactions of the brain–behavior–environment system. This is especially true for exact time lags and delays of this interaction. Therefore, the conclusions from the above predictor models are restricted to correlations and do not afford causal inferences (for details, see Gollob and Reichardt, 1987; Salthouse, 2011). Otherwise, studying these temporal aspects is a promising approach to disentangle the mechanisms of structural decline in changing contexts of lifestyle, nutrition, and “cognitive environment”.
The majority of the recent studies that have explored inter-individual differences and modifiers of age-related brain structural changes have either focused on global brain parameters (Schmidt et al., 2005; Charlton et al., 2010) or an a-priori selection of ROI (Du et al., 2006; Kramer et al., 2007; Raz et al., 2008, 2010; Murphy et al., 2010). Therefore, the (partial) correlated change models are often separately applied to global- or local ROI measures (e.g., hippocampus volume). On one hand, this univariate approach is advantageous because it affords the application of sophisticated structural equation models (SEM) for the purpose of intra-individual change analysis (for review, see McArdle, 2009). For instance recent studies by Raz et al. (2005, 2008, 2010) successfully applied latent difference models (LDM) to explore contributors to ROI-based intra-individual decline of brain volume. However, the univariate ROI-based approach (1) does not fully account for regional variability of age-related differences and (2) often neglects the inter-regional dependencies of age-related effects in terms of distributed structural patterns of change. Therefore, we address the implementation of the (partial) correlated change for voxel- or surface-based analysis taking the advantage of univariate and multivariate approaches.
Univariate generative model: local prediction of decline
Due to its computational efficiency, usability, and straightforward statistics the GLM is a predestined approach to analyze local change parameters. It enables assessment of linear effects of predictors X0 or ΔX on individual local rates of decline S. A straightforward GLM implementation of the above slope prediction models is:
i.e., S = XB + E using a design matrix X containing p predictors in columns, the parameter matrix B with entries βrk, and the matrix E with errors εik. In order to implement the “partial correlated change” model we detect the effects of baseline predictors (i.e., X = X0) and for a “correlated change” model the effects of the predictor change (i.e., X = ΔX). Notably, if the longitudinal design includes subjects from different ages (at baseline measurement), the individual change parameters I0 and S are not supposed to be free of age effects. In particular, testing for age effects on subjects’ slopes can reveal age dependent differences in the rates of decline, e.g., due to non-linear local age trajectories g(k)(age, β). Thus the subjects’ ages can be included in the design matrix as well as other covariates, e.g., X = [ΔX, age, ticv]. If the predictors are supposed to show multicollinearity, the confidence of parameter estimates is improved by precedent orthogonalization of the design matrix. Unfortunately, strong correlations of the predictors might also limit the interpretability of effects. This is especially true for collections of psychometric tests which often show substantial intercorrelations.
As recently pointed out by Salthouse (2011), multivariate analysis techniques might improve the analysis of aging structure in relation to covariates and predictors such as cognitive abilities. On one hand, studies have successfully demonstrated the inter-regional dependencies of age effects in brain structure using multivariate methods (Alexander et al., 2006; Brickman et al., 2007, 2008; Ecker et al., 2009; Bergfield et al., 2010). On the other hand, the shared variance of predictors can be used to define composite scores or latent factors that improve reliability (Penke and Deary, 2010). Moreover, in a recent study this “aggregation” on the brain- and the predictor side revealed sophisticated insights in the relation of brain structure and information processing in elderly (Penke et al., 2010).
Multivariate generative model: predictive patterns of decline
The partial least squares correlation (PLSC) technique was initially introduced into the field of functional neuroimaging to relate brain activity data to experimental design matrices and it evolved to a powerful tool for various applications (Krishnan et al., 2011). To account for the above mentioned caveats of GLM we apply a PLSC to identify more general commonalities of individual structural decline S and the set of predictors X (i.e., X0 or ΔX). We suppose matrices S and X to be centered and normalized (e.g., z-scores). Then, the idea of PLSC is to detect “important” patterns in the correlations of local slopes and predictors, i.e., R = XTS. In particular, this is performed by a singular value decomposition (SVD) of the correlation matrix:
Formally, the SVD results in pairs of left and right singular vectors u l and v l, also called saliences. The saliences u l and v l represent weighting patterns of the predictors- and the slopes respectively. For instance, if X contains elderly subjects’ health parameters we can think of ul as a specific health profile. The v l saliences for slopes S represent voxel- or vertex-wise brain images. Technically, PLSC determines the saliences that maximize the covariance of weighted predictors and slopes (for exact constraints, see Krishnan et al., 2011):
The resulting covariance of salience-weighted predictors Xu l and slopes Sv l is given by the singular values σl indicating the magnitude of explained covariation in the data. Finally, the obtained pairs of brain regional patterns and predictor profiles in a sample can be generalized to population level by the use of permutation tests (McIntosh and Lobaugh, 2004). In addition, bootstrapping techniques allow assessment of confidence intervals for patterns and profiles. In conclusion, PLSC provides a multivariate approach to simultaneously analyze multiple contributing factors (or predictors) to local intra-individual rates of structural decline. Its implicit search for weighting patterns and profiles accounts for inter-regional and inter-predictor correlations. Figure 8 illustrates the partial least squares approach to analyze inter-individual variability in change parameters. Alternatively, other multivariate models, e.g., canonical variates analysis (CVA), have been suggested to analyze distributed patterns of brain parameters in relation to experimental designs and predictors (Worsley et al., 1997).
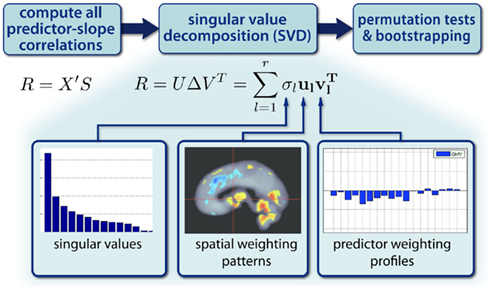
Figure 8. Partial least squares correlation (PLSC) approach for analysis of inter-individual variability of decline parameters. PLSC decomposes the correlation structure of change parameters S and predictors X using singular value decomposition (SVD). This reveals pairs of spatial weighting patterns and predictor profiles.
Limitations
Some caveats of the presented framework have to be mentioned. Firstly, a general issue for all presented modeling approaches is the assumption of an age-unbiased preprocessing, in particular for samples including higher ages, i.e., in which there will inevitably be higher levels of atrophy. Age-bias in segmentation, registration, and normalization could be misleadingly identified as region-specific age effects in subsequent analyses. In part, this limitation might be overcome by applying prior-free segmentation approaches in studies with a large age range. In addition, the normalization might be optimized by generation of average shaped tissue templates (Ashburner and Friston, 2009). Secondly, a main limitation of the above models is that they are based upon an observational design, which does not conform to a randomized experimental design. The former does not allow inference about causality of potential interactions between predictors and brain levels. Thirdly, the approaches do not explicitly address multidimensionality of aging brain structure in terms of multiple MR-based modalities obtained from the same brain region. However, a recent unsupervised learning method called Link ICA was suggested to jointly analyze their covariations (Groves et al., 2011). Fourthly, most of the generative models of age were presented from a classical “mass-univariate” statistical perspective allowing voxel-wise inference. This often requires Gaussian smoothing with a-priori chosen filter width and decorrelation of noise terms in advance. Notably, Bayesian modeling has become a promising alternative for multivariate analysis of neuroimaging data (Friston et al., 2008). It provides a flexible approach to multi-level and hierarchical models (Friston et al., 2002) including biophysical priors on age-related processes, adaptive spatial regularization (Penny et al., 2005; Groves et al., 2009), and model comparisons (Penny et al., 2007).
There is an ongoing discussion about limitations of cross-sectional and longitudinal design to study aging brain structure (Fjell and Walhovd, 2010; Raz and Lindenberger, 2011). One critical issue is that cross-sectional studies in principle merge age independent inter-individual differences and age-related effects risking a biased sample composition over ages with unknown hidden covariates. In addition, the sensitivity for the detection of age-related effects varies with the amount of inter-individual differences of brain structure and sample size. Some studies observe deviations in the estimated annual decline rates derived by either a cross-sectional or a longitudinal approach (e.g., see Raz et al., 2005). As recently reviewed, cross-sectional decline estimators sometimes underestimate the longitudinal decline (Fjell and Walhovd, 2010). However, apart from artifacts due to cohort effects, secular trends, and age-biased sampling, there are other factors that also contribute to deviating results obtained from different study designs. There are substantial differences in the preprocessing pipelines of cross-sectional and longitudinal brain structural images, which are either optimized for accurate intra-individual registration or inter-individual normalization, respectively. The statistical models that define the estimators for local change rates often vary across studies and designs. In addition, if the true lifespan trajectories of aging brain structure are expected to be non-linear, differences in the age range of the sample, the mean age, and the age distribution influence the estimated annual decline rates obtained from either longitudinal or cross-sectional studies. Thus in order to estimate age effects on brain structure, the differences due to study design should be interpreted with caution. As also reviewed by Fjell and Walhovd (2010), the cross-sectional age effects on brain structure in large sample studies using semi-automated methods were similar to those obtained in longitudinal studies.
A related issue is that longitudinal studies seldom span more than 5 years, limited by routine scanner upgrades or replacement. Being aware of the immense methodological advantages of longitudinal designs, the analysis of pure intra-individual age variations in MR-based markers does not allow exploring lifespan brain differences and accelerated aging over decades. For this particular purpose, longitudinal and cross-sectional studies require the analysis of effects due to age variations on the between-subjects level which are susceptible to sampling-bias and trends. As pointed out by Raz et al. (2005) in an important longitudinal study, by using only a restricted age range (at baseline) the observed non-linear age effects on brain structure would simply be missed. Thus under careful inspection of sample characteristics, the inter-individual age variations in cross-sectional and longitudinal designs can provide insights in long term age differences not accessible with repeated measures MRI. In addition, the availability of cross-sectional compared to longitudinal MR data in research practice is expected to stay much higher. Further studies on methods and structural aging should account for this asymmetry and emphasize valid and critical aspects of cross-sectional analysis.
Notably, our framework did not address the issue of cross-sectional mediation models (for introduction, see Baron and Kenny, 1986). In contrast to the typical cross-sectional analysis of age-structure covariation, a mediation model is more complex because it additionally introduces a covariate, e.g., cognitive abilities. Then, a mediation analysis aims at testing alternative scenarios of indirect statistical effects between age, brain structure, and the covariate, e.g., whether normative age-related brain structural decline mediates cognitive decline (for review, see Salthouse, 2011). Some studies point out that cross-sectional sampling (i.e., observing only inter-individual differences) of subjects’ ages, brain structure, and cognitive abilities is inappropriate to solve complex questions regarding their mutual interaction as a process of aging (Shrout and Bolger, 2002; Penke and Deary, 2010; Raz and Lindenberger, 2011). In particular, recent statistical modeling revealed the fact that substantial indirect effects in cross-sectional studies might be observed even if the true longitudinal mediation is completely absent (Maxwell and Cole, 2007; Maxwell et al., 2011). Thus, longitudinal designs observing both intra- and inter-individual variations of structure and cognition seem to be more promising to disentangle different hypotheses about mediation of cognitive decline (Salthouse, 2011).
Summary and Perspectives
Here we presented analytical approaches to age-related differences and aging in MR-based markers of brain morphometry. All reviewed models afford whole brain analysis of voxel- or surface-based neuroimaging data. We focused on the detection of age effects, the estimation of population mean trajectories and individual decline. In particular, we assumed that aging might vary across brain regions (i.e., space), lifespan phases (i.e., time), and subjects. Accounting for these sources of variability would have increased model complexity in terms of numbers of parameters and degrees of freedom. Each of these “extensions” might provide sophisticated insights into the process of structural development and aging in future studies.
Emergent Properties in Regional Patterns
Recent studies have emphasized that there is a consistent pattern of inter-regional covariance of brain structure (Mechelli et al., 2005; Lerch et al., 2006; Colibazzi et al., 2008; Nosarti et al., 2010; Eyler et al., 2011). Other studies have explicitly related these covariance patterns to age differences (Alexander et al., 2006; Brickman et al., 2007; Bergfield et al., 2010). The joint variation of local neuroanatomy across subjects raises the question, which latent factors “orchestrate” regional structural development and aging? Moreover, these covariations define structural developmental networks with potentially differential age-related trajectories and specific modifiers or contributors.
Age Trajectories and Structural Plasticity
The reviewed parametric and non-parametric models allow the detection and estimation of region-specific non-linearities of lifespan brain structural trajectories (Ziegler et al., 2011). Interestingly, studies on learning-induced structural plasticity have revealed localized brain changes after intense training of motor skills or acquisition of abstract knowledge (Draganski et al., 2004, 2006; Boyke et al., 2008; Scholz et al., 2009; Engvig et al., 2010). Then the concept of structural plasticity can be embedded in the above framework of development and aging. Plasticity can be thought of as event-related, short-term disturbances of the structural age trajectories g(age). As a consequence of the training, the directions of local trajectories exhibit changes (e.g., quadratic g″(age)≠0) during a comparable short period of weeks or a few months (see also Taubert et al., 2010). However, it is still unknown how the local age trajectories and change parameters (e.g., I0 and S) before and after the training period are related to the quantitative characteristics of induced short-term structural change.
Individual Prediction of Structural Change
In order to estimate the structural trajectories in cross-sectional samples, we supposed smooth functions of age. Interestingly, the supposed temporal smoothness (or autocorrelation) of trajectories  applied to the within-subject level might allows individual predictions of prospective brain changes.
Conflict of Interest Statement
This work was supported in part by BMBF grants (01EV0709 and 01GW0740).
Acknowledgments
We are grateful to Raka Maitra, Ferah Kherif, and Alissa Winkler for corrections and comments on the manuscript. Data collection and sharing for this project was funded by the Alzheimer’s Disease Neuroimaging Initiative (ADNI; National Institutes of Health Grant U01 AG024904). ADNI is funded by the National Institute on Aging, the National Institute of Biomedical Imaging and Bioengineering, and through generous contributions from the following: Abbott; Alzheimer’s Association; Alzheimer’s Drug Discovery Foundation; Amorfix Life Sciences Ltd.; AstraZeneca; Bayer HealthCare; BioClinica Inc.; Biogen Idec Inc.; Bristol-Myers Squibb Company; Eisai Inc.; Elan Pharmaceuticals Inc.; Eli Lilly and Company; F. Hoffmann-La Roche Ltd and its affiliated company Genentech Inc.; GE Healthcare; Innogenetics, N.V.; Janssen Alzheimer Immunotherapy Research & Development, LLC.; Johnson & Johnson Pharmaceutical Research & Development LLC.; Medpace Inc.; Merck & Co. Inc.; Meso Scale Diagnostics, LLC.; Novartis Pharmaceuticals Corporation; Pfizer Inc.; Servier; Synarc Inc.; and Takeda Pharmaceutical Company. The Canadian Institutes of Health Research is providing funds to support ADNI clinical sites in Canada. Private sector contributions are facilitated by the Foundation for the National Institutes of Health (www.fnih.org). The grantee organization is the Northern California Institute for Research and Education, and the study is coordinated by the Alzheimer’s Disease Cooperative Study at the University of California, San Diego. ADNI data are disseminated by the Laboratory for Neuro Imaging at the University of California, Los Angeles. This research was also supported by NIH grants P30 AG010129, K01 AG030514, and the Dana Foundation. The Open Access Series of Imaging Studies (OASIS) is supported by grants P50 AG05681, P01 AG03991, R01 AG021910, P50 MH071616, U24 RR021382, R01 MH56584.
Footnotes
- ^The cross-sectional database consisted of 1094 healthy subjects with ages 18–94. We used three free accessible MR imaging sources: 547 images were taken from the IXI database (http://fantail.doc.ic.ac.uk), 316 from the Open Access Series of Imaging Studies (OASIS, http://www.oasis-brains.org/), and 231 healthy subjects from the Alzheimer’s Disease Neuroimaging Initiative (ADNI, http://www.adni-info.org/) Data used in the preparation of this article were obtained from the Alzheimer’s Disease Neuroimaging Initiative (ADNI) database (adni.loni.ucla.edu). The ADNI was launched in 2003 by the National Institute on Aging (NIA), the National Institute of Biomedical Imaging and Bioengineering (NIBIB), the Food and Drug Administration (FDA), private pharmaceutical companies and non-profit organizations, as a $60 million, 5-year public-private partnership. The primary goal of ADNI has been to test whether serial magnetic resonance imaging (MRI), positron emission tomography (PET), other biological markers, and clinical and neuropsychological assessment can be combined to measure the progression of mild cognitive impairment (MCI) and early Alzheimer’s disease (AD). Determination of sensitive and specific markers of very early AD progression is intended to aid researchers and clinicians to develop new treatments and monitor their effectiveness, as well as lessen the time and cost of clinical trials. The Principal Investigator of this initiative is Michael W. Weiner, MD, VA Medical Center and University of California – San Francisco. ADNI is the result of efforts of many co-investigators from a broad range of academic institutions and private corporations, and subjects have been recruited from over 50 sites across the U.S. and Canada. The initial goal of ADNI was to recruit 800 adults, ages 55–90, to participate in the research, approximately 200 cognitively normal older individuals to be followed for 3 years, 400 people with MCI to be followed for 3 years and 200 people with early AD to be followed for 2 years. For up-to-date information, see www.adni-info.org.
- ^The cross-sectional database consisted of 1094 healthy subjects with ages 18–94. We used three free accessible MR imaging sources: 547 images were taken from the IXI database (http://fantail.doc.ic.ac.uk), 316 from the Open Access Series of Imaging Studies (OASIS, http://www.oasis-brains.org/), and 231 healthy subjects from the Alzheimer’s Disease Neuroimaging Initiative (ADNI, http://www.adni-info.org/) Data used in the preparation of this article were obtained from the Alzheimer’s Disease Neuroimaging Initiative (ADNI) database (adni.loni.ucla.edu). The ADNI was launched in 2003 by the National Institute on Aging (NIA), the National Institute of Biomedical Imaging and Bioengineering (NIBIB), the Food and Drug Administration (FDA), private pharmaceutical companies and non-profit organizations, as a $60 million, 5-year public-private partnership. The primary goal of ADNI has been to test whether serial magnetic resonance imaging (MRI), positron emission tomography (PET), other biological markers, and clinical and neuropsychological assessment can be combined to measure the progression of mild cognitive impairment (MCI) and early Alzheimer’s disease (AD). Determination of sensitive and specific markers of very early AD progression is intended to aid researchers and clinicians to develop new treatments and monitor their effectiveness, as well as lessen the time and cost of clinical trials. The Principal Investigator of this initiative is Michael W. Weiner, MD, VA Medical Center and University of California – San Francisco. ADNI is the result of efforts of many co-investigators from a broad range of academic institutions and private corporations, and subjects have been recruited from over 50 sites across the U.S. and Canada. The initial goal of ADNI was to recruit 800 adults, ages 55–90, to participate in the research, approximately 200 cognitively normal older individuals to be followed for 3 years, 400 people with MCI to be followed for 3 years and 200 people with early AD to be followed for 2 years. For up-to-date information, see www.adni-info.org.
- ^http://www.r-project.org/
- ^http://www.gaussianprocess.org/gpml/
- ^The longitudinal sample consisted of 572 scans of 123 healthy subjects with ages 70–90 from the Alzheimer’s Disease Neuroimaging Initiative (ADNI, http://www.adni-info.org)
References
Alexander, G. E., Chen, K., Merkley, T. L., Reiman, E. M., Caselli, R. J., Aschenbrenner, M., Santerre-Lemmon, L., Lewis, D. J., Pietrini, P., Teipel, S. J., Hampel, H., Rapoport, S. I., and Moeller, J. R. (2006). Regional network of magnetic resonance imaging gray matter volume in healthy aging. Neuroreport 17, 951–956.
Andrade, A., Paradis, A. L., Rouquette, S., and Poline, J. B. (1999). Ambiguous results in functional neuroimaging data analysis due to covariate correlation. Neuroimage 10, 483–486.
Ashburner, J., and Friston, K. J. (2000). Voxel-based morphometry – the methods. Neuroimage 11, 805–821.
Ashburner, J., and Friston, K. J. (2009). Computing average shaped tissue probability templates. Neuroimage 45, 333–341.
Ashburner, J., and Kloppel, S. (2010). Multivariate models of inter-subject anatomical variability. Neuroimage 56, 422–439.
Assaf, Y., and Pasternak, O. (2008). Diffusion tensor imaging (DTI)-based white matter mapping in brain research: a review. J. Mol. Neurosci. 34, 51–61.
Baltes, P. B., Reuter-Lorenz, P. A., and Rösler, F. (eds). (2006). Lifespan Development and the Brain: The Perspective of Biocultural Co-Constructivism. Cambridge: Cambridge University Press.
Baltes, P. B., Staudinger, U. M., and Lindenberger, U. (1999). Lifespan psychology: theory and application to intellectual functioning. Annu. Rev. Psychol. 50, 471–507.
Baron, R. M., and Kenny, D. A. (1986). The moderator-mediator variable distinction in social psychological research: conceptual, strategic, and statistical considerations. J. Pers. Soc. Psychol. 51, 1173–1182.
Bergfield, K. L., Hanson, K. D., Chen, K., Teipel, S. J., Hampel, H., Rapoport, S. I., Moeller, J. R., and Alexander, G. E. (2010). Age-related networks of regional covariance in MRI gray matter: reproducible multivariate patterns in healthy aging. Neuroimage 49, 1750–1759.
Boyke, J., Driemeyer, J., Gaser, C., Büchel, C., and May, A. (2008). Training-induced brain structure changes in the elderly. J. Neurosci. 28, 7031–7035.
Bray, S., Chang, C., and Hoeft, F. (2009). Applications of multivariate pattern classification analyses in developmental neuroimaging of healthy and clinical populations. Front. Hum. Neurosci. 3:32. doi: 10.3389/neuro.09.032.2009
Brickman, A. M., Habeck, C., Ramos, M. A., Scarmeas, N., and Stern, Y. (2008). A forward application of age associated gray and white matter networks. Hum. Brain Mapp. 29, 1139–1146.
Brickman, A. M., Habeck, C., Zarahn, E., Flynn, J., and Stern, Y. (2007). Structural MRI covariance patterns associated with normal aging and neuropsychological functioning. Neurobiol. Aging 28, 284–295.
Bryk, A. S., and Raudenbush, S. W. (1987). Application of hierarchical linear models to assessing change. Psychol. Bull. 101, 147–158.
Charlton, R. A., Schiavone, F., Barrick, T. R., Morris, R. G., and Markus, H. S. (2010). Diffusion tensor imaging detects age related white matter change over a 2 year follow-up which is associated with working memory decline. J. Neurol. Neurosurg. Psychiatr. 81, 13–19.
Cleveland, W. S. (1979). Robust locally weighted regression and smoothing scatterplots. J. Am. Stat. Assoc. 74, 829–836.
Cleveland, W. S., Devlin, S. J., and Grosse, E. (1988). Regression by local fitting. Methods, properties, and computational algorithms. J. Econom. 37, 87–114.
Colibazzi, T., Zhu, H., Bansal, R., Schultz, R. T., Wang, Z., and Peterson, B. S. (2008). Latent volumetric structure of the human brain: exploratory factor analysis and structural equation modeling of gray matter volumes in healthy children and adults. Hum. Brain Mapp. 29, 1302–1312.
Craven, P., and Wahba, G. (1978). Smoothing noisy data with spline functions. Estimating the correct degree of smoothing by the method of generalized cross-validation. Numerische Mathematik 31, 377–403.
Davatzikos, C. (2004). Why voxel-based morphometric analysis should be used with great caution when characterizing group differences. Neuroimage 23, 17–20.
Dickerson, B. C., Fenstermacher, E., Salat, D. H., Wolk, D. A., Maguire, R. P., Desikan, R., Pacheco, J., Quinn, B. T., Van Der Kouwe, A., Greve, D. N., Blacker, D., Albert, M. S., Killiany, R. J., and Fischl, B. (2008). Detection of cortical thickness correlates of cognitive performance: reliability across MRI scan sessions, scanners, and field strengths. Neuroimage 39, 10–18.
Draganski, B., Ashburner, J., Hutton, C., Kherif, F., Frackowiak, R. S., Helms, G., and Weiskopf, N. (2011). Regional specificity of MRI contrast parameter changes in normal ageing revealed by voxel-based quantification (VBQ). Neuroimage 55, 1423–1434.
Draganski, B., Gaser, C., Busch, V., Schuierer, G., Bogdahn, U., and May, A. (2004). Neuroplasticity: changes in grey matter induced by training. Nature 427, 311–312.
Draganski, B., Gaser, C., Kempermann, G., Kuhn, H. G., Winkler, J., Büchel, C., and May, A. (2006). Temporal and spatial dynamics of brain structure changes during extensive learning. J. Neurosci. 26, 6314–6317.
Du, A. T., Schuff, N., Chao, L. L., Kornak, J., Jagust, W. J., Kramer, J. H., Reed, B. R., Miller, B. L., Norman, D., Chui, H. C., and Weiner, M. W. (2006). Age effects on atrophy rates of entorhinal cortex and hippocampus. Neurobiol. Aging 27, 733–740.
Ecker, C., Stahl, D., Daly, E., Johnston, P., Thomson, A., and Murphy, D. G. M. (2009). Is there a common underlying mechanism for age-related decline in cortical thickness? Neuroreport 20, 1155–1160.
Eckert, M. A. (2011). Slowing down: age-related neurobiological predictors of processing speed. Front. Neurosci. 5:25. doi: 10.3389/fnins.2011.00025
Engvig, A., Fjell, A. M., Westlye, L. T., Moberget, T., Sundseth, O., Larsen, V. A., and Walhovd, K. B. (2010). Effects of memory training on cortical thickness in the elderly. Neuroimage 52, 1667–1676.
Erickson, K. I., Prakash, R. S., Voss, M. W., Chaddock, L., Hu, L., Morris, K. S., White, S. M., Wójcicki, T. R., Mcauley, E., and Kramer, A. F. (2009). Aerobic fitness is associated with hippocampal volume in elderly humans. Hippocampus 19, 1030–1039.
Eyler, L. T., Prom-Wormley, E., Fennema-Notestine, C., Panizzon, M. S., Neale, M. C., Jernigan, T. L., Fischl, B., Franz, C. E., Lyons, M. J., Stevens, A., Pacheco, J., Perry, M. E., Schmitt, J. E., Spitzer, N. C., Seidman, L. J., Thermenos, H. W., Tsuang, M. T., Dale, A. M., and Kremen, W. S. (2011). Genetic patterns of correlation among subcortical volumes in humans: results from a magnetic resonance imaging twin study. Hum. Brain Mapp. 32, 641–653.
Féart, C., Samieri, C., and Barberger-Gateau, P. (2010). Mediterranean diet and cognitive function in older adults. Curr. Opin. Clin. Nutr. Metab. Care 13, 14–18.
Fjell, A. M., and Walhovd, K. B. (2010). Structural brain changes in aging: courses, causes and cognitive consequences. Rev. Neurosci. 21, 187–221.
Fjell, A. M., Walhovd, K. B., Reinvang, I., Lundervold, A., Salat, D., Quinn, B. T., Fischl, B., and Dale, A. M. (2006). Selective increase of cortical thickness in high-performing elderly – structural indices of optimal cognitive aging. Neuroimage 29, 984–994.
Fjell, A. M., Walhovd, K. B., Westlye, L. T., Ostby, Y., Tamnes, C. K., Jernigan, T. L., Gamst, A., and Dale, A. M. (2010). When does brain aging accelerate? Dangers of quadratic fits in cross-sectional studies. Neuroimage 50, 1376–1383.
Fox, J. (2008). Applied Regression Analysis and Generalized Linear Models. Thousand Oaks: Sage Publications Inc.
Franke, K., Ziegler, G., Klöppel, S., Gaser, C., and Initiative, A. S. D. N. (2010). Estimating the age of healthy subjects from T1-weighted MRI scans using kernel methods: exploring the influence of various parameters. Neuroimage 50, 883–892.
Frisardi, V., Panza, F., Seripa, D., Imbimbo, B. P., Vendemiale, G., Pilotto, A., and Solfrizzi, V. (2010). Nutraceutical properties of Mediterranean diet and cognitive decline: possible underlying mechanisms. J. Alzheimers Dis. 22, 715–740.
Friston, K., Chu, C., Mourao-Miranda, J., Hulme, O., Rees, G., Penny, W., and Ashburner, J. (2008). Bayesian decoding of brain images. Neuroimage 39, 181–205.
Friston, K. J., and Ashburner, J. (2004). Generative and recognition models for neuroanatomy. Neuroimage 23, 21–24.
Friston, K. J., Holmes, A. P., and Worsley, K. J. (1995). Statistical parametric maps in functional imaging: a general linear approach. Hum. Brain Mapp. 2, 189–210.
Friston, K. J., Penny, W., Phillips, C., Kiebel, S., Hinton, G., and Ashburner, J. (2002). Classical and Bayesian inference in neuroimaging: theory. Neuroimage 16, 465–483.
Gollob, H. F., and Reichardt, C. R. (1987). Taking account of time lags in causal models. Child Dev. 58, 80–92.
Groves, A. R., Beckmann, C. F., Smith, S. M., and Woolrich, M. W. (2011). Linked independent component analysis for multimodal data fusion. Neuroimage 54, 2198–2217.
Groves, A. R., Chappell, M. A., and Woolrich, M. W. (2009). Combined spatial and non-spatial prior for inference on MRI time-series. Neuroimage 45, 795–809.
Gunning-Dixon, F. M., Brickman, A. M., Cheng, J. C., and Alexopoulos, G. S. (2009). Aging of cerebral white matter: a review of MRI findings. Int. J. Geriatr. Psychiatry 24, 109–117.
Kanai, R., and Rees, G. (2011). The structural basis of inter-individual differences in human behaviour and cognition. Nat. Rev. Neurosci. 12, 231–242.
Kherif, F., Poline, J.-B., Flandin, G., Benali, H., Simon, O., Dehaene, S., and Worsley, K. J. (2002). Multivariate model specification for fMRI data. Neuroimage 16, 1068–1083.
Kramer, J. H., Mungas, D., Reed, B. R., Wetzel, M. E., Burnett, M. M., Miller, B. L., Weiner, M. W., and Chui, H. C. (2007). Longitudinal MRI and cognitive change in healthy elderly. Neuropsychology 21, 412–418.
Krishnan, A., Williams, L. J., Mcintosh, A. R., and Abdi, H. (2011). Partial least squares (PLS) methods for neuroimaging: a tutorial and review. Neuroimage 56, 455–475.
Lerch, J. P., Worsley, K., Shaw, W. P., Greenstein, D. K., Lenroot, R. K., Giedd, J., and Evans, A. C. (2006). Mapping anatomical correlations across cerebral cortex (MACACC) using cortical thickness from MRI. Neuroimage 31, 993–1003.
Lindenberger, U., Li, S.-C., and Bäckman, L. (2006). Delineating brain-behavior mappings across the lifespan: substantive and methodological advances in developmental neuroscience. Neurosci. Biobehav. Rev. 30, 713–717.
Lindenberger, U., Singer, T., and Baltes, P. B. (2002). Longitudinal selectivity in aging populations: separating mortality-associated versus experimental components in the Berlin Aging Study (BASE). J. Gerontol. B. Psychol. Sci. Soc. Sci. 57, P474–P482.
Luchsinger, J. A., and Gustafson, D. R. (2009). Adiposity, type 2 diabetes, and Alzheimer’s disease. J. Alzheimers Dis. 16, 693–704.
Maxwell, S. E., and Cole, D. A. (2007). Bias in cross-sectional analyses of longitudinal mediation. Psychol. Methods 12, 23–44.
Maxwell, S. E., Cole, D. A., and Mitchell, M. A. (2011). Bias in cross-sectional analyses of longitudinal mediation: partial and complete mediation under an autoregressive model. Multivariate Behav. Res. 46, 816–841.
McArdle, J. J. (2009). Latent variable modeling of differences and changes with longitudinal data. Annu. Rev. Psychol. 60, 577–605.
McIntosh, A. R., and Lobaugh, N. J. (2004). Partial least squares analysis of neuroimaging data: applications and advances. Neuroimage 23(Suppl. 1), S250–S263.
Mechelli, A., Friston, K. J., Frackowiak, R. S., and Price, C. J. (2005). Structural covariance in the human cortex. J. Neurosci. 25, 8303–8310.
Mietchen, D., and Gaser, C. (2009). Computational morphometry for detecting changes in brain structure due to development, aging, learning, disease and evolution. Front. Neuroinform 3:25. doi: 10.3389/neuro.11.025.2009
Monti, M. M. (2011). Statistical analysis of fMRI time-series: a critical review of the GLM approach. Front. Hum. Neurosci. 5:28 doi: 10.3389/fnhum.2011.00028
Murphy, E. A., Holland, D., Donohue, M., Mcevoy, L. K., Hagler, D. J., Dale, A. M., Brewer, J. B., and Initiative, A. S. D. N. (2010). Six-month atrophy in MTL structures is associated with subsequent memory decline in elderly controls. Neuroimage 53, 1310–1317.
Nosarti, C., Mechelli, A., Herrera, A., Walshe, M., Shergill, S. S., Murray, R. M., Rifkin, L., and Allin, M. P. (2010). Structural covariance in the cortex of very preterm adolescents: a voxel-based morphometry study. Hum. Brain Mapp. 32, 1615–1625.
Oulhaj, A., Refsum, H., Beaumont, H., Williams, J., King, E., Jacoby, R., and Smith, A. D. (2010). Homocysteine as a predictor of cognitive decline in Alzheimer’s disease. Int. J. Geriatr. Psychiatry 25, 82–90.
Penke, L., and Deary, I. J. (2010). Some guidelines for structural equation modelling in cognitive neuroscience: the case of Charlton et al.’s study on white matter integrity and cognitive ageing. Neurobiol. Aging 31, 1656–1660.
Penke, L., Muñoz Maniega, S., Murray, C., Gow, A. J., Hernández, M. C. V., Clayden, J. D., Starr, J. M., Wardlaw, J. M., Bastin, M. E., and Deary, I. J. (2010). A general factor of brain white matter integrity predicts information processing speed in healthy older people. J. Neurosci. 30, 7569–7574.
Penny, W., Flandin, G., and Trujillo-Barreto, N. (2007). Bayesian comparison of spatially regularised general linear models. Hum. Brain Mapp. 28, 275–293.
Penny, W. D., Trujillo-Barreto, N. J., and Friston, K. J. (2005). Bayesian fMRI time series analysis with spatial priors. Neuroimage 24, 350–362.
Pinheiro, J. C., and Bates, D. M. (2000). Mixed-Effects Models in S and S-PLUS. Ney York: Springer Verlag.
Rasmussen, C. E., and Williams, C. K. I. (2006). Gaussian Processes for Machine Learning. Cambridge: MIT Press.
Raudenbush, S. W., and Bryk, A. S. (2002). Hierarchical Linear Models: Applications and Data Analysis Methods. 2nd Edn. Newbury Park: Sage.
Raz, N., Ghisletta, P., Rodrigue, K. M., Kennedy, K. M., and Lindenberger, U. (2010). Trajectories of brain aging in middle-aged and older adults: regional and individual differences. Neuroimage 51, 501–511.
Raz, N., and Kennedy, K. M. (2009). “A systems approach to age-related change: neuroanatomical changes, their modifiers, and cognitive correlates,” in Imaging the Aging Brain, eds W. J. Jagust, and M. D’Esposito (New York: Oxford University Press), 43–70.
Raz, N., and Lindenberger, U. (2011). Only time will tell: cross-sectional studies offer no solution to the age-brain-cognition triangle: comment on Salthouse (2011). Psychol. Bull. 137, 790–795.
Raz, N., Lindenberger, U., Ghisletta, P., Rodrigue, K. M., Kennedy, K. M., and Acker, J. D. (2008). Neuroanatomical correlates of fluid intelligence in healthy adults and persons with vascular risk factors. Cereb. Cortex 18, 718–726.
Raz, N., Lindenberger, U., Rodrigue, K. M., Kennedy, K. M., Head, D., Williamson, A., Dahle, C., Gerstorf, D., and Acker, J. D. (2005). Regional brain changes in aging healthy adults: general trends, individual differences and modifiers. Cereb. Cortex 15, 1676–1689.
Raz, N., and Rodrigue, K. M. (2006). Differential aging of the brain: patterns, cognitive correlates and modifiers. Neurosci. Biobehav. Rev. 30, 730–748.
Reuter, M., and Fischl, B. (2011). Avoiding asymmetry-induced bias in longitudinal image processing. Neuroimage 57, 19–21.
Reuter, M., Rosas, H. D., and Fischl, B. (2010). Highly accurate inverse consistent registration: a robust approach. Neuroimage 53, 1181–1196.
Salthouse, T. A. (2011). Neuroanatomical substrates of age-related cognitive decline. Psychol. Bull. 137, 753–784.
Schmid, V. J., Whitcher, B., Padhani, A. R., Taylor, N. J., and Yang, G. Z. (2009). A Bayesian hierarchical model for the analysis of a longitudinal dynamic contrast-enhanced MRI oncology study. Magn. Reson. Med. 61, 163–174.
Schmidt, R., Ropele, S., Enzinger, C., Petrovic, K., Smith, S., Schmidt, H., Matthews, P. M., and Fazekas, F. (2005). White matter lesion progression, brain atrophy, and cognitive decline: the Austrian stroke prevention study. Ann. Neurol. 58, 610–616.
Schnack, H. G., Van Haren, N. E. M., Brouwer, R. M., Van Baal, G. C. M., Picchioni, M., Weisbrod, M., Sauer, H., Cannon, T. D., Huttunen, M., Lepage, C., Collins, D. L., Evans, A., Murray, R. M., Kahn, R. S., and Hulshoff Pol, H. E. (2010). Mapping reliability in multicenter MRI: voxel-based morphometry and cortical thickness. Hum. Brain Mapp. 31, 1967–1982.
Schölkopf, B., and Smola, A. J. (2002). Learning with Kernels: Support Vector Machines, Regularization, Optimization and beyond. Cambridge: MIT Press.
Scholz, J., Klein, M. C., Behrens, T. E. J., and Johansen-Berg, H. (2009). Training induces changes in white-matter architecture. Nat. Neurosci. 12, 1370–1371.
Shrout, P. E., and Bolger, N. (2002). Mediation in experimental and nonexperimental studies: new procedures and recommendations. Psychol. Methods 7, 422–445.
Silverman, B. W. (1985). Some aspects of the spline smoothing approach to nonparametric regression curve fitting. J. R. Stat. Soc. Ser. B 47, 1–52.
Singer, J. D., and Willet, J. B. (2003). Applied Longitudinal Data Analysis: Modeling Change and Event Occurrence. New York: Oxford University Press.
Taubert, M., Draganski, B., Anwander, A., Müller, K., Horstmann, A., Villringer, A., and Ragert, P. (2010). Dynamic properties of human brain structure: learning-related changes in cortical areas and associated fiber connections. J. Neurosci. 30, 11670–11677.
Tipping, M. (2001). Sparse Bayesian learning and the relevance vector machine. J. Mach. Learn. Res. 1, 211–244.
Toga, A. W., and Thompson, P. M. (2003). Temporal dynamics of brain anatomy. Annu. Rev. Biomed. Eng. 5, 119–145.
van der Maaten, L. J. P., Postma, E. O., and Van Den Herik, H. J. (2009). Dimensionality Reduction: A Comparative Review. TiCC-TR 2009-005. Available at: http://homepage.tudelft.nl/19j49/Matlab_Toolbox_for_Dimensionality_Reduction_files/TR_Dimensiereductie.pdf
Wahba, G. (1990). Spline Models for Observational Data. Philadelphia, PA: Society for Industrial and Applied Mathematics.
Walhovd, K. B., Westlye, L. T., Amlien, I., Espeseth, T., Reinvang, I., Raz, N., Agartz, I., Salat, D. H., Greve, D. N., Fischl, B., Dale, A. M., and Fjell, A. M. (2009). Consistent neuroanatomical age-related volume differences across multiple samples. Neurobiol. Aging 32, 916–932.
Westlye, L. T., Walhovd, K. B., Dale, A. M., Bjornerud, A., Due-Tonnessen, P., Engvig, A., Grydeland, H., Tamnes, C. K., Ostby, Y., and Fjell, A. M. (2010). Differentiating maturational and aging-related changes of the cerebral cortex by use of thickness and signal intensity. Neuroimage 52, 172–185.
Willet, J. B. (1989). Some results on reliability for the longitudinal measurement of change: implications for the design of studies of individual growth. Educ. Psychol. Meas. 49, 587–602.
Worsley, K. J., Poline, J. B., Friston, K. J., and Evans, A. C. (1997). Characterizing the response of PET and fMRI data using multivariate linear models. Neuroimage 6, 305–319.
Keywords: aging, brain morphometry, modeling, inter-individual differences, longitudinal analysis, multivariate analysis
Citation: Ziegler G, Dahnke R, and Gaser C (2012) Models of the aging brain structure and individual decline. Front. Neuroinform. 6:3. doi: 10.3389/fninf.2012.00003
Received: 15 November 2011; Accepted: 15 February 2012;
Published online: 14 March 2012.
Edited by:
Jussi Tohka, Tampere University of Technology, FinlandCopyright: © 2012 Ziegler, Dahnke, and Gaser. This is an open-access article distributed under the terms of the Creative Commons Attribution Non Commercial License, which permits non-commercial use, distribution, and reproduction in other forums, provided the original authors and source are credited.
*Correspondence: Gabriel Ziegler, Structural Brain Mapping Group, Department of Psychiatry, Jena University Hospital, Jahnstrasse 3, 07743 Jena, Germany. e-mail:Z2FicmllbC56aWVnbGVyQHVuaS1qZW5hLmRl
†Data used in the preparation of this article were obtained from the Alzheimer’s Disease Neuroimaging Initiative (ADNI) database (www.loni.ucla.edu/ADNI). As such, the investigators within the ADNI contributed to the design and implementation of ADNI and/or provided data but did not participate in analysis or writing of this report. Complete listing of ADNI investigators available at http://adni.loni.ucla.edu/wp-content/uploads/how_to_apply/ADNI_Authorship_List.pdf