 Kai S. Gansel1*
 Wolf Singer1,2,3
- 1 Department of Neurophysiology, Max-Planck-Institute for Brain Research, Frankfurt am Main, Germany
- 2 Frankfurt Institute for Advanced Studies, Johann Wolfgang Goethe University, Frankfurt am Main, Germany
- 3 Ernst Strüngmann Institute (ESI) for Neuroscience in Cooperation with Max Planck Society, Frankfurt am Main, Germany
We present a non-parametric and computationally efficient method that detects spatiotemporal firing patterns and pattern sequences in parallel spike trains and tests whether the observed numbers of repeating patterns and sequences on a given timescale are significantly different from those expected by chance. The method is generally applicable and uncovers coordinated activity with arbitrary precision by comparing it to appropriate surrogate data. The analysis of coherent patterns of spatially and temporally distributed spiking activity on various timescales enables the immediate tracking of diverse qualities of coordinated firing related to neuronal state changes and information processing. We apply the method to simulated data and multineuronal recordings from rat visual cortex and show that it reliably discriminates between data sets with random pattern occurrences and with additional exactly repeating spatiotemporal patterns and pattern sequences. Multineuronal cortical spiking activity appears to be precisely coordinated and exhibits a sequential organization beyond the cell assembly concept.
Introduction
One of the most fundamental issues in neuroscience is the nature of the neural representation of information. While it is widely appreciated that informational contents are carried by the activities of a large number of neurons, there is dissent about the independence of cells and the relevant timescales of their firing (deCharms and Zador, 2000). Do neurons jointly encode information by forming functional cell assemblies (Hebb, 1949; von der Malsburg, 1986; Gerstein et al., 1989; Fujii et al., 1996)? Does precise spike timing significantly contribute to neuronal communication (Theunissen and Miller, 1995; Fetz, 1997; Gerstner et al., 1997; Singer, 1999)? As a consequence, are neuronal assemblies distinguished by a covariation of firing rates (Harris, 2005) or by a time-locked sequence of polychronous (Izhikevich, 2006) or synchronous (Singer et al., 1997) spiking events? Finally, are the activities of neuronal assemblies, whatever their particular structure may be, arranged sequentially and coherently in time to form superordinate patterns (Hebb, 1949; Abeles, 1991; Bienenstock, 1995)?
Although studying these questions is a statistical and computational challenge (Brown et al., 2004; Kass et al., 2005), a variety of methods have successfully been applied to reveal clusters of functionally related cells without characterizing their temporal structure (Gerstein and Aertsen, 1985; Gerstein et al., 1985; Berger et al., 2010; Kim et al., 2011; Lopes-dos-Santos et al., 2011), to define groups of cells firing in synchrony (Gerstein et al., 1978; Grün et al., 1999, 2002a,b; Schnitzer and Meister, 2003; Samonds and Bonds, 2004; Pipa et al., 2008; Kass et al., 2011), to detect spatiotemporal firing patterns (Abeles and Gerstein, 1988; Frostig et al., 1990; Yamada et al., 1996; Tetko and Villa, 1997, 2001; Lee and Wilson, 2004; Schneider et al., 2006; Smith and Smith, 2006; Nikolić, 2007; Sastry and Unnikrishnan, 2010; Smith et al., 2010), and to find signatures of synfire chain activity (Schrader et al., 2008; Gerstein et al., 2012). Barring some difficulties in finding appropriate representations of the associated null hypotheses (Gütig et al., 2002; Gerstein, 2004; Grün, 2009), these different methods and their applications are able to analyze pertinent properties of multineuronal activity, but an all-embracing approach is missing.
To achieve a comprehensive and conceptually unrestricted description of multineuronal spiking, we present a new method for analyzing consistent relations between discharges of simultaneously recorded neurons on arbitrary timescales that are referred to as spatiotemporal firing patterns and pattern sequences (Gansel and Singer, 2006). Adopting a maximally naïve view on multineuronal suprathreshold activity, repeating spatiotemporal firing patterns are registered with user-defined precision by sliding a temporal window of interest along the parallel spike trains. In addition, series of patterns are scanned for repeating sequences. The significance of repeating firing patterns is estimated individually and globally by comparing the numbers of their occurrences with the numbers that would be expected if the cells’s firing were independent on the given timescales. For that purpose, a new type of surrogate data is introduced that allows for variability and sparseness of spiking events and is superior to common resampling methods in terms of statistical test performance. Another difficulty when searching for recurring spatiotemporal patterns in massively parallel recordings arises from the mutual masking of actually unrelated patterns that are arranged in the same window. To avoid the combinatorial explosion that results from testing every single possible subpattern, we propose an algorithm that separates coincident events based on the preferences with which a neuron joins its various peers in coincident firing. (In this paper, we use the terms “spike” and “event” interchangeably, emphasizing either their biological or statistical meaning, respectively).
Methods
In the following subsections we first describe the algorithms for the detection of spatiotemporal firing patterns and pattern sequences, including the proposed procedure of separating subpatterns. Then, we present a Monte Carlo-based approach to determine the statistical significance of the found patterns and sequences, together with some common and a new resampling technique and the corresponding hypothesis tests. Finally, we briefly comment on the technical implementation of the method.
Detection of Spatiotemporal Firing Patterns
What constitutes a multineuronal spike pattern? As long as we do not explicitly know the relevant timescales of the data under investigation, we should not restrict the analysis to any special scale. The method presented here is therefore designed to provide full flexibility with regard to the temporal organization of the data: In a straightforward approach, we focus on the activation sequence of cells as the essential signature of a pattern (VanRullen et al., 2005; Shahaf et al., 2008) and define patterns by registering the first spikes of all units within a certain time window W with a certain precision τ (Figure 1). Both timescales – the maximal length of the pattern and the spike timing precision – can be arbitrarily chosen and jointly determine which aspects of the data are investigated. By applying several parameter combinations successively, the data can be scanned for a range of very diverse spatiotemporal patterns.
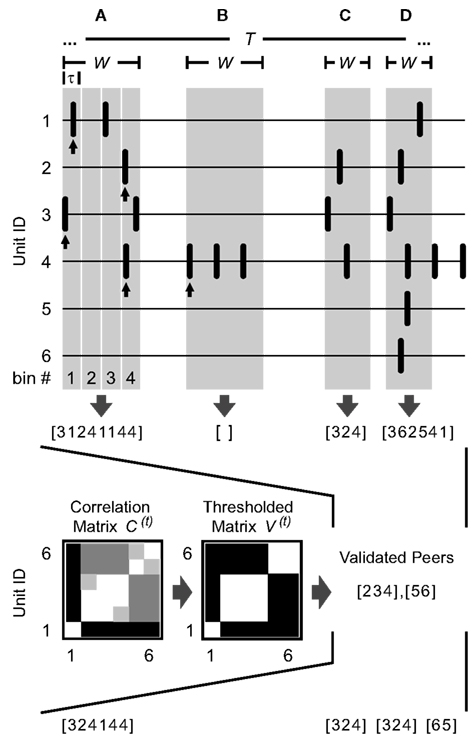
Figure 1. Detection of spatiotemporal firing patterns. Illustrated are six simultaneously recorded spike trains and four separately detected patterns (A–D) as examples. An arbitrary time window W (highlighted in gray) is used in each case to define the spatiotemporal activity pattern. The units that coincide in the given time window are further split into subgroups according to previously validated peers: Based on the number of coincident events of any two units during some period t of length T (raw correlation matrix C(t)) and a threshold, units are classified as being functionally coupled or uncoupled (thresholded correlation matrix V(t), see text for details). In this example, units 2, 3, and 4 are correlated, as are units 5 and 6, and unit 1 is not correlated with any other unit. (A) A 60 ms window containing six spikes falling into different 15 ms bins given by τ. The resulting pattern is represented by a vector indicating the constituent units ranked by appearance ([3124…]), followed by the corresponding bin numbers of their first spikes ([…1144], see arrows). After comparison with the sets of validated peers, unit 1 is excluded from the pattern. (B) Since a pattern consists of at least two spikes and only the first spike of each unit inside the window is considered (see arrow), patterns comprising only one unit are skipped (W = 60 ms). (C,D) If no binning is applied, the vector representing the pattern indicates only the temporal order of the participating units (W = 35 ms). (C) After comparison with the sets of validated peers, the pattern is left unmodified. (D) After comparison with the sets of validated peers, the pattern is split into two subpatterns and unit 1 is excluded.
Given any W and any τ (with τ being an integer fraction of W), patterns are captured by systematically sliding the onset of the time window W from spike to spike along the parallel traces. They are represented by a vector indicating the constituent units ranked by appearance (spikes co-occurring at the same sampling point are ranked by their unit number), optionally followed by the corresponding timing information. Thus, two modes for representing a pattern can be used: a time-resolved mode (Figure 1A) and a representation that is simply given by the temporal order of the participating units (Figures 1C,D). In the time-resolved version, the scale of the registered spike timing is set by dividing the window into equal bins of length τ, using their respective indices to specify each spike’s position in time (see Figure 1A for an example). (Both modes are used in the data analysis and will be discussed in subsequent sections.) Since the central purpose of the analysis is to detect coordinated firing activity among a population of cells, spike patterns comprising only one unit are skipped (Figure 1B).
It is important to note that patterns do not necessarily cover the whole space allowed by a given combination of parameters, especially if restrictions are minimized by analyzing the data using wide limits (long W and τ = W). A subsequent analysis of the found patterns may then reveal some characteristic spatiotemporal structure covering only a part of the search space, making it a particularly strong finding if some structure is found that has not been explicitly searched for. Once the data are known to contain repeating patterns on a specific temporal scale, the search space can be adapted to yield a better statistical accuracy.
Peer Validation and Pattern Separation
Because every timestamp marks the start of a new window, allowing each event to participate in multiple patterns on multiple positions, the search is exhaustive in the temporal domain. In order to thoroughly scan the data in the spatial domain, one would need to break down every pattern into all possible subpatterns and to independently assess their individual significance. With an increasing number of units and events, however, this would result in a combinatorial explosion requiring prohibitively large amounts of computer memory (as an example, 20 events can be combined in more than a million ways, forming exactly 220 subsets minus the empty set and the 20 singleton sets). On the other hand, unraveling simultaneously occurring but independent subpatterns is essential to reveal any repetitive structure in larger data sets. As a practical solution, we therefore propose to determine the probability with which a neuron joins its various peers in coincident firing and to split the events that coincide in any given time window W accordingly. To do so, the empirical count of coincidences of any two units during some period t of length T (with T ≫ W) is compared against a threshold given by the expected count of coincidences and a global support value to classify them as being functionally coupled or uncoupled, thus providing every unit with a set of “validated peers.” Because the functional coupling may vary over time (Aertsen et al., 1989), it is necessary to choose T appropriately (e.g., 1 min) and to currently adjust the correlation values by dividing the data into successive intervals of corresponding length. Formally, raw correlations are expressed as which is the number of coincidences of units i and j as revealed by the pattern search during time interval t. The chance level of spurious coincidences is roughly estimated as
with being the expected number of coincidences of units i and j in time interval t, and nit and njt being the numbers of events of units i and j in time interval t (see “DERIVATION OF THE RATE-BASED CHANCE LEVEL OF SPURIOUS COINCIDENCES” in the appendix for a derivation and necessary conditions). In case of low rates the resulting values may be too low to function as a threshold. To assure that more than one coincidence per unit pair is required to label peers as valid, an additional minimum support value may be applied. Hence, peers are validated according to
with characterizing units i and j as being functionally coupled or uncoupled during time interval t, max(…) returning the number with the higher value, and A being an arbitrary global threshold referred to as absolute peer criterion that simply denotes the number of coincidences in any time interval t required to validate the functional coupling of any pair of units, irrespective of the event rates. The resulting sets of validated peers indicate which units preferentially take part in concerted firing patterns. To separate coincident events accordingly, all peers that are invalid with respect to a chosen unit are removed from a pattern. The procedure is repeated for every unit that participates in the parent pattern, potentially producing several distinct subpatterns. Finally, non-repeating patterns are dropped. After all repeating patterns thus detected have been registered, they are subjected to a search for some superordinate patterning.
Detection of Sequences of Patterns
It has repeatedly been hypothesized that neuronal spiking activity be organized into superordinate patterns comprising coherent sequences of circumscribed spatiotemporal firing patterns that signify functional cell assemblies (Hebb, 1949; Abeles, 1991; Bienenstock, 1995). As was pointed out by Schrader and colleagues (Schrader et al., 2008), detecting those sequences means collating the previously identified patterns appropriately and variously and searching for new emerging structures – a task that has not been tried yet. Here we present such a method for the detection of repeating pattern sequences that is completely independent of the particular temporal organization of the constituent patterns and makes no a priori assumptions about the spatiotemporal structure of the resulting sequences.
In a first step, the vector representation of every repeating pattern is replaced by a hash value indicating the pattern’s identity, which helps to alleviate computer memory consumption. Because the significance of a single pattern is statistically distinct from the significance of a sequence of patterns, all repeating patterns are included. Along with the pattern ID, the timestamps of the first and last event are recorded so that sequences can be clearly identified and represented by a vector of successive IDs. However, since patterns are captured with a sliding window and potentially are subdivided as a result of the peer validation procedure, they may overlap in time. To register series of temporally non-overlapping, directly consecutive patterns it is therefore necessary to look for the very next initiation of a pattern after the last event of the preceding pattern (Figure 2A). The resulting sequences may comprise an arbitrary number of patterns and include all corresponding subsequences (Figure 2B). As the process is repeatedly started at every pattern, the detection of sequences is exhaustive up to the analyzed length. In a last step, shorter sequences that are always part of the same longer sequence as well as non-repeating sequences are discarded. Importantly, this method does not imply any constraints concerning the exact timing of consecutive patterns (provided that they are temporally separated) or the overall duration of the whole sequence – solely the succession of pattern IDs identifies a sequence.
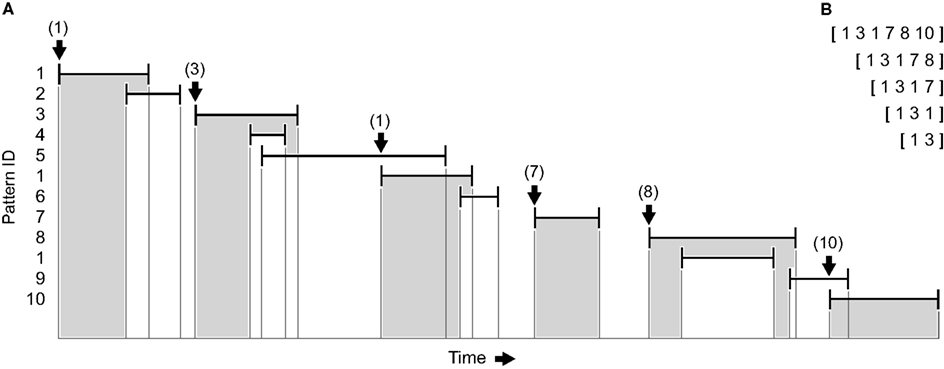
Figure 2. Detection of sequences of patterns (sketch). (A) Vertical bars indicate first and last spikes of previously identified repeating spatiotemporal firing patterns, horizontal bars indicate their duration. A unique ID is assigned to every pattern, and sequences comprising an arbitrary number of temporally non-overlapping, directly consecutive patterns (highlighted in gray) are registered by looking for the very next initiation of a pattern after the last spike of the preceding pattern (see arrows). The process is repeatedly started at every pattern with all subsequences being listed. (B) Vector representations of the pattern sequences shown in (A) when starting at the first pattern.
Statistical Hypothesis
Following the detection of recurring firing patterns and pattern sequences, one may characterize their spatiotemporal properties and relate them to the experimental conditions. However, their mere recurrence does not imply that they occur more often than expected by chance, and both patterns and sequences have to be considered irrelevant unless an appropriate statistical test demonstrates that they recur significantly often. To do so, we propose a non-parametric approach that can be expressed in the following way: The null hypothesis (H0) states that the registered patterns and sequences appear by chance, or in other words, that patterns occur independently and coordination of events is random on the timescales that were used to identify a pattern. If this is the case, then varying the timing of events on that scale or rearranging the order of patterns should not affect any statistic extracted from the parallel event trains or the pattern series. To test the probability that this null hypothesis holds, we calculate the distribution of pattern and sequence counts from surrogate data with randomized event timing and randomized pattern sequences, respectively, using a Monte Carlo method. If the value obtained from the original data exceeds the surrogate count with empirical probability x (and falls below that count less often), then the probability that the data are consistent with the null hypothesis is 1 – x. The alternative hypothesis (HA) states the opposite and assumes that patterns show some systematic interdependence and events some degree of coordination on the corresponding timescales.
Generation of Surrogate Data
The problem of developing a non-parametric method is to produce surrogate data that differ from the original data in exactly one property, namely the one that is addressed by the alternative hypothesis. In the past, several procedures have been proposed to create suitable surrogate data for testing the significance of coordinated spike events by repeatedly modifying the original spike trains (for a review see Grün, 2009). One possibility is to dither the time of every individual event randomly and independently on a certain scale, thereby destroying the temporal structure contained across as well as within event trains up to that scale (Hatsopoulos et al., 2003; Figure 3A). Although it is not necessary to change the interval structure if the intention is to disarrange coordinated events, the approach is intuitively appealing. It has, however, some complications, as was revealed by Gerstein (2004). If the event times are dithered uniformly within some symmetric window (e.g., ±20 ms), short intervals are added to the interval distribution and its peak is lowered. In terms of gamma distributions, such a surrogate is a move to lower order and hence produces an inappropriately low number of patterns (the order parameter is connected to regularity – the higher the order the more repeating patterns are expected). Gerstein proposed to use a non-uniform dithering instead that is based on the square roots of the adjacent intervals, which he found to produce interval distributions remarkably similar to the original. To circumvent these problems, Pipa and colleagues offered an even simpler method: If all spike times within one train are dithered by the same amount, the spike trains are effectively shifted against each other, and coordinated firing is eliminated up to the corresponding timescale while the full auto-structure is kept intact (Pipa et al., 2008; Figure 3B). A third possibility is to randomly shuffle the inter-spike intervals, which means destroying the temporal structure while exactly preserving the original interval distribution. However, if all intervals are included in the shuffling, the rate profile might be changed to an unacceptable degree. As a solution, we introduce here a variant of this method that only shuffles short intervals in between longer intervals that exceed the dither window. Since in this way all events adjacent to longer intervals keep their position, the spike trains are additionally shifted against each other (Figure 3C) (compare Hirata et al., 2008). Through the combination of shuffled inter-spike intervals and misaligned spike trains, the resulting surrogates become even more dissimilar from the original data, which might make it more likely for individual patterns to be recognized as being significant.
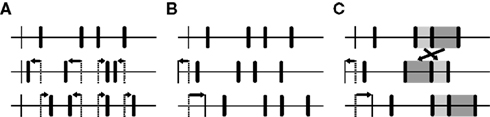
Figure 3. Three different ways of creating surrogate data for testing the significance of coordinated events in parallel time series. Top traces depict original event trains, subjacent traces depict surrogate trains that have been derived from the original data (thin vertical bars: onset). (A) The time of every individual event is dithered randomly and independently on a certain scale, thereby destroying the temporal structure contained across as well as within event trains up to that scale. (B) Whole event trains are shifted randomly against each other, in that way eliminating coordination of events up to the corresponding timescale while preserving the full auto-structure. (C) Same as in (B), but with additional random shuffling of consecutive inter-event intervals that are equal to or shorter than the maximal allowed shift (highlighted in light and dark gray).
Of great importance is the timescale that is chosen to dither single events or to shift event trains or to dissociate between short and long inter-event intervals: The resulting average displacement of an event should closely correspond to the timing precision that is used to define patterns to yield the best compromise between an extensive disarrangement of potentially coordinated events and the preservation of rate modulations on slower timescales (for a brief discussion on this topic see Pipa et al., 2008; see also Pazienti et al., 2008). We applied three different methods of dithering single events as well as the described methods of shifting event trains with and without additional shuffling of inter-event intervals to simulated data and real recordings and will evaluate them in the results section (see “SURROGATE DATA GENERATING PROCEDURES” in the appendix for a formal description). None of them is however able to assess the significance of pattern sequences. As mentioned before, these are statistically distinct from single spatiotemporal patterns and have to be tested independently. Since sequences are defined solely by a succession of pattern IDs irrespective of their temporal structure, we may generate appropriate surrogate data simply by randomizing the order of IDs in circumscribed stretches of data (for convenience, we use the same intervals as for the calculation of the functional coupling of units), in this way eliminating any potential dependencies between consecutive patterns while approximately preserving each pattern’s rate profile. Once the surrogate data are constructed, we can compare the original pattern and sequence counts to those that would be expected given independent events.
Statistical Significance Estimation
If the null hypothesis was true, the numbers of repeating patterns and sequences extracted from the original data should be approximately the same in the surrogate data. To test the probability that the hypothesis holds, we first count the occurrences no of every repeating individual pattern and pattern sequence in the original data and compare the number to the frequency of occurrence ns of the same pattern or sequence in the surrogate data. Testing every pattern and sequence individually is necessary to rule out that its appearance is merely due to the frequencies of its components, the significance of the data as a whole notwithstanding.
Under the null, no < ns and no > ns are equally likely. Given the distribution of surrogate counts, the statistical significance of any pattern or sequence could thus be estimated by testing the relative frequency of no > ns against the expected value of 0.5 with an appropriate binomial test. For example, an exact binomial test gives a probability of at most ∼ 6.3 × 10⁻²³ for 95 surrogate counts out of 100 being lower than the original count by chance. A Bonferroni correction for multiple comparisons would in that case allow for ∼ 7 × 10²⁰ (!) parallel comparisons while maintaining a significance level of ∼ 4.4% (likewise, the correction would allow for ∼ 2 × 10³ parallel comparisons at a significance level of ∼ 4% if 19 surrogate counts from a total of 20 were required to be lower than the original count). It follows that large numbers of individual tests may be performed in parallel at reasonable significance levels if a sufficient number of surrogate data sets are taken into account. As an alternative to the binomial test, we therefore employ a simple heuristic that inherently allows for multiple comparisons and considerably reduces the computational complexity: If at least 95% of the counts from the surrogate data fall below the original count, then H0 is rejected at a designated significance level of 5% or less, and one can conclude that the original count is unusually high. The minimal necessary number of surrogate data sets is accordingly given by the number of parallel tests and the desired significance level (see examples). After evaluation of their individual statistical significance, insignificant patterns and sequences are discarded.
In a second step, we assess the coordination of events on a global level. To do so, every pattern and sequence that appears more than once in any surrogate data set is individually tested for significance in the very same way as those occurring in the original data, capitalizing on the assumption that the generation of the surrogate data did not affect the statistic under investigation and that all data sets, including the original one, are essentially indistinguishable with regard to the patterning of events. As a result, every data set is characterized by a certain number X of patterns or sequences that recur unexpectedly often, given their frequencies in the rest of the data sets. Their combined occurrences
(with ni being the number of occurrences of the ith pattern or sequence that is statistically significant on the individual level and d being the index of the respective data set) are then subjected to a second level analysis to evaluate the overall significance of a coordination of firing events in the original data. The null hypothesis is rejected on the global level if at least 95% of the numbers N from the surrogate data fall below the number from the original data.
Of course, only data that pass the second level test can be considered to contain coordinated firing patterns, namely those patterns and sequences that have been found to be significant on the individual level. It has to be pointed out, though, that the original data might well be statistically distinguishable from the surrogate data despite lacking significant numbers of repeating patterns or sequences, because other statistics may be extracted as well and might prove to be different. One example is the rate of joint-spike events calculated per unit time and complexity (Figure 4). Here, however, the intention is to assess the significance of individual activity patterns based on a global evaluation of the whole data set.
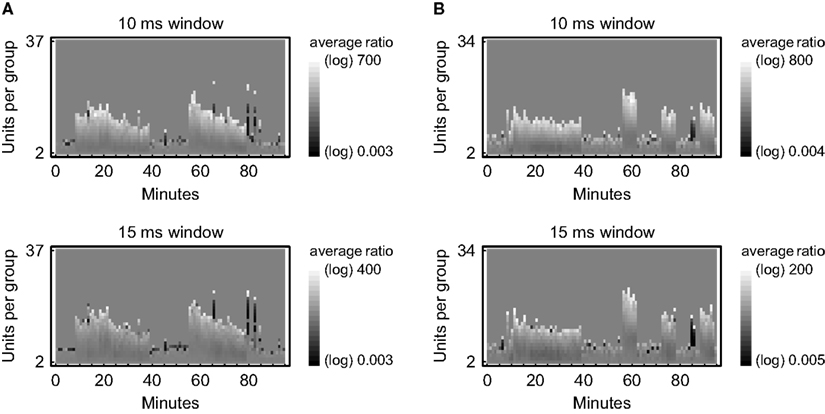
Figure 4. Relative frequencies of joint-spike events depending on time and complexity. A sliding window was moved from spike to spike to collect groups of coincident spikes (joint-spike events) in parallel recordings of neuronal activity from rat visual cortex in vitro. Their frequency of occurrence is compared against the corresponding values from 100 surrogate data sets that have been obtained by randomly shifting the original spike trains by an average amount of 5–7 ms. Relative frequencies are expressed on a logarithmic grayscale depending on the number of units per group (complexity) in data segments of 1 min duration. The respective numbers of joint-spike events have been validated by an exact binomial test (50% gray indicates no significant difference between the original data and the surrogate data at a significance level of 0.05). (A) Data 1 recorded simultaneously from 101 units in 95 min. (B) Data 2 recorded simultaneously from 102 units in 95 min.
Technical Implementation
The whole analysis including the detection and statistical evaluation of spatiotemporal firing patterns and pattern sequences was programmed in MATHEMATICA (Wolfram Research, Champaign, IL, USA) as a single computational process. Adjustable parameters are the duration T of the intervals that form the basis for calculating the correlation matrix and for generating surrogate data, the size W of the temporal window that is used for the pattern detection, the precision τ of the registered spike timing, the criterion A for the peer validation, the width w of the dither window, the number of surrogate data sets, the desired significance level, and the maximal sequence length. All repeating patterns and sequences are saved in text files along with the statistical results for further analysis. A platform-independent MATHEMATICA notebook file and related material are freely available online at http://www.brain.mpg.de/research/emeriti/prof-dr-dr-hc-mult-wolf-singer/publications/download/Gansel_Singer_2012.zip.
Results
In the following subsections we report the statistical and computational properties of the method by applying it to simulated data and multielectrode recordings from slices of rat visual cortex. The main findings are that dithering event times with the “square root dither” method is likely to change the interval distribution in a way that produces inappropriate surrogate data, that the new resampling method proposed here yields a slightly lower rate of false positives and is significantly more sensitive than the methods it has been compared to, that the detection of patterns is considerably facilitated by the flexible search algorithm and the controlled separation of concurrent events, and that the associated computational load can easily be handled by a conventional personal computer. We refer to sections “DATA SIMULATION” and “DATA ACQUISITION” in the appendix for details regarding the generation of the simulated data and the recording of spiking activity, respectively.
Effect of Dithering Event Times on the Interval Distribution
To elucidate potential complications when creating surrogate data by dithering event times independently, we investigated the impact of three different dithering procedures on the interval distribution (Figure 5). In the first instance, simulated event trains were generated by gamma processes of order 4 with a mean event rate of ∼ 40 Hz, and a number of surrogates were constructed using each method, always assuring a “refractory period” of 1 ms between events as an upper bound for their displacement (see “SURROGATE DATA GENERATING PROCEDURES” in the appendix). If event times are relocated randomly and uniformly within a symmetric window, short intervals are added to the probability distribution and its peak is lowered, in this way producing surrogates with an inappropriately low number of repeating patterns (Figure 5A). If we allow for an asymmetric window, the effect gets attenuated and the resulting average probability density function exhibits more regular intervals, but still does not conform to the original data (Figure 5B). As previously shown by Gerstein (2004), randomizing the event timing within a window given by the square roots of the adjacent intervals and squaring the resulting offset while keeping its sign accurately preserves the original interval distribution (Figure 5C). Ensuring a “refractory period” between events alone does not suffice, at any rate, to get appropriate surrogate data.
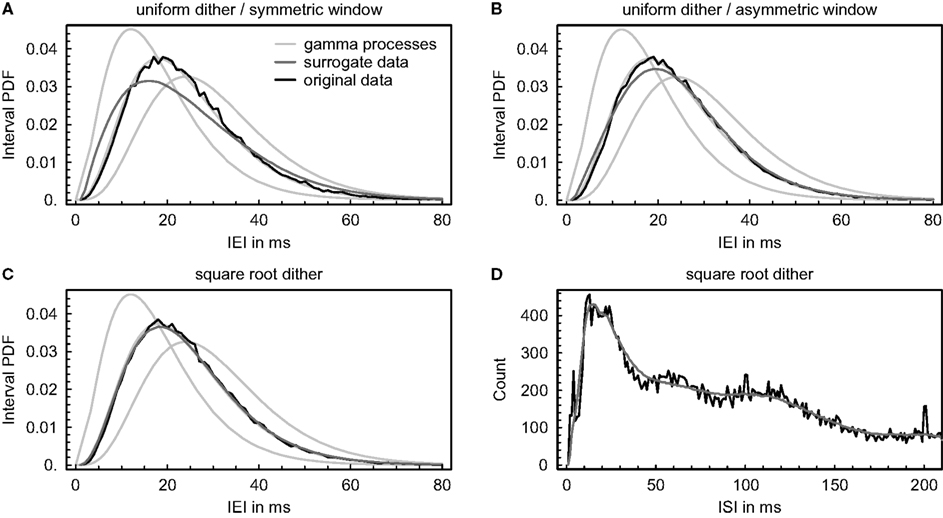
Figure 5. Effect of dithering event times on the interval distribution. (A–C) Simulated event trains were generated by gamma processes of order 4, and event times were dithered individually and independently using three different methods (number of surrogates: 100). The resulting average probability density functions (PDF) of the inter-event intervals (IEI) are shown in comparison with the original data and with theoretical interval distributions of gamma processes of orders 3, 4, and 5. (A) Event times were dithered randomly and uniformly within a symmetric window of maximally ±20 ms, but assuring a “refractory period” of 1 ms between events. The average absolute displacement of an event resulted in 4.1 ms. (B) Same as in (A), but allowing for an asymmetric window. The average absolute displacement of an event resulted in 6.1 ms. (C) Event times were dithered according to the “square root dither” method (Gerstein, 2004) again using a maximal window of ± 20 ms and assuring a “refractory period” of 1 ms between events. The average absolute displacement of an event resulted in 3.9 ms. (D) Same as in (C), but dithering was applied to real spike trains recorded simultaneously from 67 units. The resulting average distribution of inter-spike intervals (ISI) is shown in comparison with the original data (bin size = 1 ms). The average absolute displacement of an event resulted in 6.1 ms.
Since neuronal firing statistics typically defy analytical formulation, we also examined the impact of dithering event times independently on a distribution of real inter-spike intervals to check if it can be as accurately preserved as simulated interval distributions (Figure 5D). Surrogate data were again constructed using the “square root dither” method (Gerstein, 2004) while assuring a “refractory period” of 1 ms between spikes. In contrast to simulated interval distributions, the examined distribution of real inter-spike intervals exhibits local minima and maxima and is conspicuously smoothed as a result of the dithering (the small peaks around 100 and 200 ms are due to indirect electrical stimulation). It is unclear if and how this affects the number of repetitive patterns in the surrogate data, but one might suspect that locally decreasing the regularity of the intervals again produces inappropriately low pattern counts.
Error Levels in Pattern Detection and Validation
To assess the probability of false positives when patterning of events is actually at chance level, we analyzed sets of 30 parallel simulated time series generated by inhomogeneous gamma processes. Spatiotemporal patterns and sequences were detected and tested both during independent modulations and covariations of event rates using three different techniques for creating surrogate data (dithering single event times with the “square root dither” method and shifting event trains with and without additional interval shuffling, see “SURROGATE DATA GENERATING PROCEDURES” in the appendix) and 30 different pattern definitions corresponding to the combinations of ten different time windows W (5, 10, 15, 20, 25, 30, 35, 40, 45, and 50 ms) and three different relative timing precisions (10 bins, 5 bins, and rank order; cf. Figure 1). The generation of the surrogate data was balanced such that the average displacement of an event always resulted in 6–8 ms; also the remaining parameters were kept constant (significance level p ≤ 0.05, number of surrogate data sets: 20, absolute peer criterion: 2, maximal sequence length: 10). The rate of false positives is expressed as the mean percentage of 100 simulated data sets that passed the second level test. It turned out to be considerably below 5% in all cases (Figures 6A,B), demonstrating that the presented method constitutes a conservative statistical test for the evaluation of spatiotemporal patterns and pattern sequences even when the instantaneous event rates closely covary. Interestingly, creating surrogate data by combined interval shuffling and event train shifting seems to produce a little less false positive estimates than shifting event trains alone or the “square root dither” technique (Figure 6A).
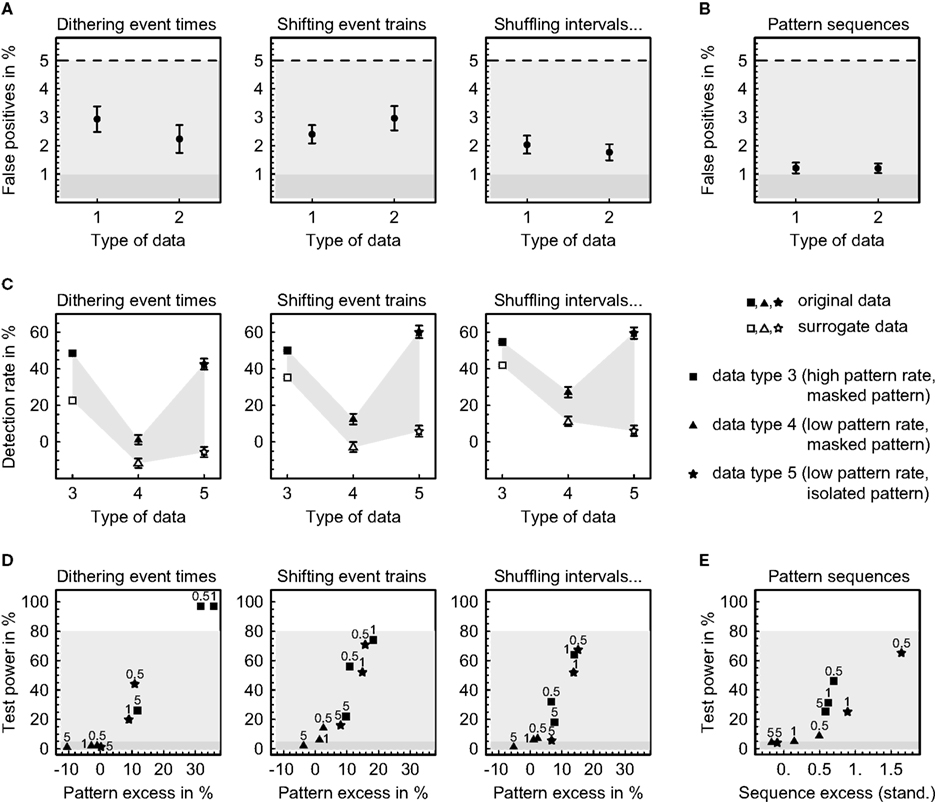
Figure 6. Error levels in pattern detection and validation. Sets of 30 parallel simulated time series were generated by gamma processes featuring independent rate modulations (data type 1), rate covariations (data type 2) and precisely repeating spatiotemporal patterns and pattern sequences (data types 3, 4, and 5; see “DATA SIMULATION” in the appendix for further description). Error levels were estimated for each parameter combination based on 100 independently simulated data sets. (A) Rate of false positives (mean ± SEM) when analyzing spatiotemporal patterns using 30 different pattern definitions given by 10 different time windows W (5, 10, 15, 20, 25, 30, 35, 40, 45, and 50 ms) and three different relative timing precisions (10 bins, 5 bins, and rank order). (B) Rate of false positives (mean ± SEM) when analyzing pattern sequences using the same pattern definitions as in (A) three times each. (C) Detection rates of spatiotemporal patterns (mean ± SEM) calculated as the difference of significant pattern counts from data with and without additional patterns, normalized with respect to the number of inserted patterns, and averaged across 100 data sets using three different pattern definitions (5 ms window, timing precisions of 10 bins, 5 bins, and rank order). (D) Test power for an excess of spatiotemporal patterns using a window W of 5 ms and timing precisions τ of 0.5, 1, and 5 ms (rank order) as indicated (excess averaged across 100 data sets). (E) Test power for an excess of pattern sequences using the same parameters as in (D) (excess displayed as the standardized mean difference and averaged across 300 data sets).
To assess the test power of the method under various conditions, we analyzed sets of 30 parallel simulated time series generated by homogeneous gamma processes including different numbers of inserted recurring spatiotemporal patterns and pattern sequences (see “DATA SIMULATION” in the appendix and Figure A1 for details). The same three procedures for creating surrogate data as before together with three different pattern definitions (5 ms window, timing precisions of 10 bins, 5 bins, and rank order) were used to uncover the hidden structure in the parallel event trains. Again, the generation of the surrogate data was balanced such that the average displacement of an event resulted in 6–8 ms. The remaining analysis parameters were retained as well (significance level p ≤ 0.05, number of surrogate data sets: 20, maximal sequence length: 10) except for the absolute peer criterion which was matched to the frequencies of the inserted patterns (A = 5 when patterns appeared every second, A = 1 when patterns appeared every 5 s).
First of all we compared the number of significant spatiotemporal patterns from data containing precisely repeating patterns to the number from data that had been simulated using the same parameters but featuring rate covariations instead of predefined patterns at corresponding positions (Figure 6C). As expected, the data containing precise patterns exhibit an excess of significant patterns on the investigated timescales. Remarkably, this holds both for original and for surrogate data, indicating that randomly varying the event timing by an average amount that only slightly exceeds the timescale on which events are coordinated still preserves some patterning of events on that same scale (compare Pazienti et al., 2008). Nevertheless, the surrogate data contain smaller numbers of significant patterns than the original data, particularly if patterns are not masked by collateral events. The relative rate of significant patterns decreases with a decreasing absolute number of inserted patterns and increases drastically if all unrelated events are removed from the patterns, emphasizing the importance of separating concurrent but independent events. Furthermore, the detection rate is always higher when shifting complete event trains to produce surrogate data as compared to dithering single events with the “square root dither” method (p < 0.02, exact binomial test), and it is yet higher when additional interval shuffling is applied in cases where patterns are masked by concurrent events (p < 0.03, exact binomial test), especially if pattern rates are low. A controlled combination of shifting whole event trains and shuffling inter-event intervals thus seems to be advantageous over previous resampling methods, particularly under statistically more demanding conditions. (Note that the displayed detection rates do not directly reflect the fraction of inserted patterns that have been found to be significant. In fact, every pattern that repeats without collateral events will be detected.)
The test power is expressed as the percentage of 100 simulated data sets that passed the second level test (Figures 6D,E). For spatiotemporal patterns, it reaches 80% at an excess of patterns in the original data of about 20% as compared to the surrogate data and strongly depends on the pattern rate, the separation of patterns from unrelated events, and the adaptation of the registered timing precision to the actual precision of the patterns (Figure 6D). The same is true for pattern sequences which require an excess of approximately 1–2 standard deviations to be reliably detected (Figure 6E). The choice of the method for creating surrogate data does not seem to substantially influence the test power, except for the “square root dither” technique of dithering event times independently which is superior if pattern rates are high and inferior if pattern rates are low. Considering the fact that on average no more than 11.8% (SD 1.2) and 2.6% (SD 0.3) of the events were coordinated in data featuring high and low pattern rates, respectively, it appears that the presented method has impressive power to detect precisely repeating patterns. Nonetheless, it relies heavily on the correct isolation of spatiotemporal patterns and the matching of the timescales on which events are coordinated and registered, most notably when sequences of patterns are concerned. From this perspective, having the possibility to accurately specify the event timing in spatiotemporal patterns with arbitrary precision, as provided by the method presented here, is essential.
Selectivity in Pattern Detection and Validation
To evaluate the performance of the method when analyzing real data and varying the way of detecting or the way of validating patterns, we investigated the dependence of the number N of significant spatiotemporal patterns and pattern sequences from parallel recordings of neuronal spiking activity on the peer criterion A, the method for creating surrogate data, and the number of surrogates (Figure 7). The data were scanned for repeating patterns and sequences using 10 different time windows W (5, 10, 15, 20, 25, 30, 35, 40, 45, and 50 ms) and three different relative timing precisions (10 bins, 5 bins, and rank order) for representing patterns, a significance level of p ≤ 0.05, a maximal sequence length of 10, and an interval T of 1 min as the basis for calculating the correlation matrix and for generating surrogate data. The generation of the surrogate data was balanced such that the average displacement of a spike always resulted in 5–9 ms.
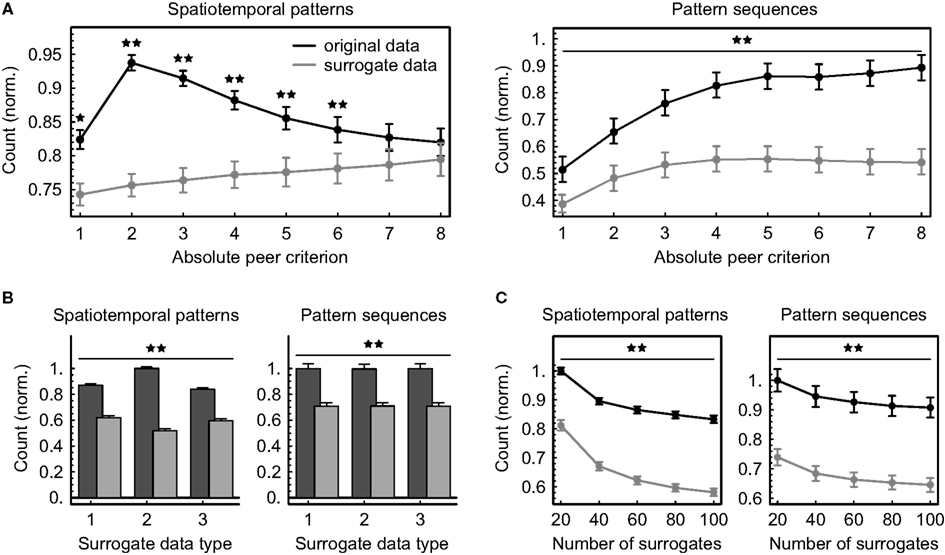
Figure 7. Dependence of the number N of significant patterns and pattern sequences on analytical parameters. Multineuronal spiking activity was scanned for spatiotemporal patterns using 30 different definitions given by ten different time windows W (5, 10, 15, 20, 25, 30, 35, 40, 45, and 50 ms) and three different relative timing precisions (10 bins, 5 bins, and rank order). The numbers of significant patterns and sequences were normalized to be comparable across data sets (mean ± SEM across 10 data sets and 30 pattern definitions). Stars denote a significant difference between original and surrogate data (★p < 0.004, ★★p < 0.00007, exact binomial test). (A) Counts depending on the absolute peer criterion A applied in addition to the threshold given by Eq. (1) (number of surrogates: 20, surrogate data generated by combined spike train shifting and interval shuffling). (B) Counts depending on the surrogate data type (1: shifting spike trains, 2: dithering individual spike times with the “square root dither” method, 3: shifting spike trains and shuffling intervals, number of surrogates: 100, absolute peer criterion: 2). Original counts are displayed in dark gray, surrogate counts in light gray. (C) Counts depending on the number of surrogates (absolute peer criterion: 2, surrogate data generated by combined spike train shifting and interval shuffling).
Applying a global peer criterion in addition to the threshold given by Eq.(1) and varying it between 1 (no further splitting) and 8 (at least eight coincident spikes within one minute required to label peers as valid) has a dramatic effect on the numbers of significant patterns and sequences (Figure 7A), clearly indicating that the proposed method of extracting subpatterns from larger spatiotemporal patterns can improve pattern detection. Given the data and the chosen time interval T, the largest number of significant spatiotemporal firing patterns could be detected using a peer criterion of 2, suggesting that the expected numbers of coincident spikes per unit pair have in some cases been calculated to be smaller. Further incrementing the criterion essentially removes more and more units from the patterns and increasingly impairs their information content, so that their numbers of occurrences approximate chance level. Sequences of patterns, however, apparently become increasingly significant if the threshold for labeling peers as valid is raised, and the distance between original and surrogate counts is concurrently growing.
Creating surrogate data by randomly shifting the spike trains against each other yields marginally less significant spatiotemporal firing patterns if additional interval shuffling is applied, but the difference is practically negligible (Figure 7B). In contrast, dithering single-spike times with the “square root dither” method while assuring a refractory period of 1 ms between spikes significantly increases the average number of significant patterns in the original data and decreases the average number in surrogate data compared to the other techniques (p < 8 × 10⁻²⁸, exact binomial test), possibly due to smoothing of the inter-spike interval distribution which likely introduces a bias toward less repeating patterns. Since sequences of patterns are evaluated independently of the significance of individual patterns, the numbers of significant sequences are unaffected by the type of surrogate data used to validate spatiotemporal patterns. Increasing the number of surrogates markedly reduces the average significant pattern counts obtained both from original data and from surrogate data by about the same amount (Figure 7C), reflecting the fact that the significance estimation becomes increasingly conservative.
Comparing the counts from original data and from surrogate data shows that randomly displacing spikes by only a few milliseconds leads to a significant drop of repeating spatiotemporal firing patterns within a wide range of parameters (Figure 7), demonstrating a remarkably precise coordination of neuronal suprathreshold activity in the local cortical circuitry. Moreover, directly consecutive firing patterns are organized to a significant degree into repetitive sequences, revealing some superordinate temporal structure beyond the cell assembly concept. Importantly, repeating firing patterns and repeating sequences of patterns occur both spontaneously and in response to electrical stimulation, suggesting that they are an inherent feature of intracortical signaling.
Computational Demands
To illustrate the computational requirements of the method, we measured the memory consumption and the processing time for a complete analysis of two example recordings of multineuronal spiking activity depending on the number of surrogate data sets and the window size W used for pattern detection (Figure 8). The data were scanned for spatiotemporal firing patterns and pattern sequences using the temporal order of spikes to define patterns and a maximal sequence length of 10. Surrogate data were constructed by combined spike train shifting and interval shuffling. The computation was carried out as a single process on a 32-bit machine with a CPU running at 2.4 GHz using MATHEMATICA version 5.2.
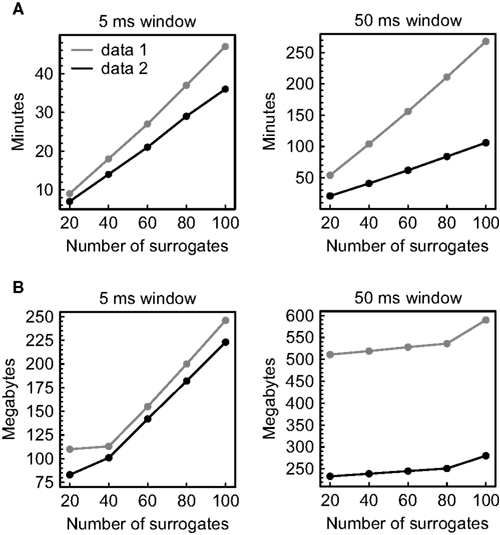
Figure 8. Computational demands of the analysis. Parallel recordings of multineuronal spiking activity were scanned for significant spatiotemporal firing patterns and pattern sequences using the temporal order of spikes to define patterns. Data 1 comprises ∼ 194000 spikes recorded simultaneously from 66 units in 96 min, data 2 comprises ∼ 93000 spikes recorded simultaneously from 73 units in 96 min. (A) Dependence of the processing time on the number of surrogates and the window size used for pattern detection. (B) Dependence of the memory consumption on the number of surrogates and the window size used for pattern detection.
As projected, the processing time grows linearly with the number of surrogates and strongly depends on the average pattern complexity that results from the applied window size and the spike rate (Figure 8A). The same approximately holds for the memory consumption (measured using the MATHEMATICA command “MaxMemoryUsed”), but here the slope accompanying an increase in the number of surrogate data sets is less pronounced (Figure 8B). The absolute values show that the computational load can be handled with ease by a single personal computer, even in the case of large data sets.
Discussion
The quest for the neuronal code has led to extensive controversies about the relevant timescales and particular organization of neuronal firing and is commonly considered an unresolved issue (Shadlen and Newsome, 1994; Ferster and Spruston, 1995; Fetz, 1997; Gerstner et al., 1997; Singer, 1999; deCharms and Zador, 2000; Averbeck and Lee, 2004). To achieve a complete understanding of neuronal information processing, we need to precisely characterize the dynamic dependencies between cells and the temporal relationships between their discharges beyond pairwise correlations (Theunissen and Miller, 1995; Brown et al., 2004; Harris, 2005).
For this purpose, we presented a straightforward and computationally efficient method for detecting temporally coordinated firing events in parallel spike trains. The method is generally applicable and implies no assumptions about the statistical properties of the data or the spatiotemporal structures contained therein. Focusing on the activation sequence of cells, activity patterns are captured on arbitrary timescales and may or may not show signatures of functional cell assemblies, synchrony, synfire chains or synfire braids. By utilizing carefully modified versions of the original spike trains to assess the significance of any detected activity pattern, the method allows for variability and sparseness of spiking events as well as the analysis of very short data segments. The temporal offset of events in the surrogate data selectively separates the timescales on which coordination of spikes is disturbed and preserved, respectively, and provides a means to directly address the temporal coding and rate coding hypotheses. In effect, the method acts as a filter revealing repetitive spatiotemporal patterns and pattern sequences amongst distributed discharges, yielding a comprehensive description of the neuronal activity on the selected timescales. Through a subsequent analysis of significant patterns, coordinated firing may be characterized in relation to neuronal state changes and information processing with single-spike resolution. Preliminary results obtained in the analysis of simultaneous recordings from rat visual cortex demonstrate a millisecond-precise coordination of neuronal spiking and reveal some superordinate patterning beyond the cell assembly concept.
Conceptually, the method is not restricted to the analysis of multiple spike trains. In principle, any parallel time series can be investigated just by adapting the temporal scales. For example, stimulus times or behavioral events may readily be included. Another possible application area is the analysis of so-called multi-voxel patterns in functional magnetic resonance imaging data (Norman et al., 2006). In the following, we contrast the method with existing approaches and discuss a number of related issues in more detail.
Comparison with Other Methods
Common approaches in the analysis of correlational structures in parallel spike trains differ with respect to the particular property in question. While this paper deals with the detection of spatiotemporal firing patterns, other methods investigate the functional coupling between neurons on longer timescales (Berger et al., 2010; Kim et al., 2011; Lopes-dos-Santos et al., 2011) or concentrate specifically on synchronous firing (Grün et al., 1999, 2002a,b; Pipa et al., 2008; Kass et al., 2011). It is important to further distinguish the method presented here from methods trying to identify genuine higher order correlations between neurons (Martignon et al., 2000; Gütig et al., 2003; Schneider and Grün, 2003; Staude et al., 2010). Whereas the latter aim at discovering multineuronal interactions, the focus of the present work is more directed toward dynamically changing activity patterns arising from these interactions.
To date, only a few publications have specifically addressed the issue of detecting and evaluating spatiotemporal firing patterns. In a pioneer work, Abeles and Gerstein developed a method to capture precisely repeating spike patterns and estimate the significance of classes of patterns including up to six spikes using a parametric approximation (Abeles and Gerstein, 1988). Although partly relying on the same statistical assumptions, Tetko and Villa subsequently resolved the limit on the complexity of the patterns (Tetko and Villa, 1997) and succeeded in assigning significance to patterns that had been grouped by matching single occurrences with a predefined template (Tetko and Villa, 2001). A different approach was pursued by Frostig and colleagues who collected significant patterns of increasing complexity in a cascaded fashion using Fisher’s exact test (Frostig et al., 1990). In the original formulation, higher order patterns are only detected if all subpatterns formed by at least three spikes are themselves statistically significant (including all possible configurations would lead to an unmanageable combinatorial explosion). Along similar lines, Sastry and Unnikrishnan (2010) proposed to identify frequent temporal patterns by incrementally assembling larger patterns from smaller ones that have been found to be significant under some stationarity assumptions. Instead of looking for temporally precise repetitions of multineuronal firing patterns, Lee and Wilson emphasized the significance of the activation order of neurons and presented an elegant way to quantify and statistically rate the degree of matching between a found firing sequence and a preselected reference pattern (Lee and Wilson, 2004; see also Smith and Smith, 2006; Smith et al., 2010). Yet another avenue to uncovering hidden structure in multineuronal spiking is to identify the predominant activity pattern. Yamada et al. (1996) took an information theoretic approach to reconstruct the directed functional connectivity among a number of neurons, including exact delays. Nikolić and co-workers exploited pairwise measurements of characteristic temporal relations to detect more complex firing sequences, expressed as precise inter-spike intervals (Schneider et al., 2006) or relative temporal order of spikes (Nikolić, 2007). Analyses of this kind are suited to detect differences in the preferred firing sequences between different experimental conditions, but they fail to reproduce the full dynamics of neuronal interactions within short time intervals. So, none of these methods is designed to systematically search for all repeating spatiotemporal patterns on any given timescale and evaluate them both individually and globally without making any statistical assumptions, quite contrary to the method presented here.
The work by Gerstein and colleagues has hitherto been the only attempt to provide a way for directly detecting superordinate activity patterns forming synfire chains (Schrader et al., 2008; Gerstein et al., 2012). The authors utilized specially devised recurrence plots to indicate pairs of temporal bins containing approximately repeating firing patterns across the whole population of recorded neurons. Synfire chains can readily be identified if the repeating patterns are not masked by too many concurrent spikes from cells that do not participate in the same link, if the applied bin width matches the temporal organization of the chain, and if the interlink propagation delays are stable (as postulated for synfire chains). In contrast, we propose to register spatiotemporal firing patterns with a sliding window in the first instance and to subsequently search for recurring sequences of temporally non-overlapping patterns irrespective of their particular spatiotemporal structure, trying to make as few assumptions about the organization of multineuronal activity as possible.
Pending Problems in Pattern Detection
Any way of defining the identity of a pattern, be it by using some template for the pattern search or by specifying the pattern as it is captured, inevitably poses the problem of where to draw the line between similar patterns. For example, it is completely unclear how to divide a continuum of patterns if the classification scheme permits missing or extra spikes. The same principle applies to registering the spike timing: The assignment of exclusive time bins, even the usage of “smooth” templates imposes perfectly arbitrary boundaries on the temporal patterns to be detected. For these reasons, it is most straightforward to require patterns to contain no extra or missing spikes to be unambiguously identified, and it appears that the only way to avoid temporal aliasing effects is to specify spike times solely by their temporal order.
Another problem, as mentioned earlier, is the mutual masking of concurrent but independent patterns. To reliably unravel simultaneously occurring but unrelated patterns, one would have to systematically list all possible subpatterns and to subsequently distill the significant ones. We actually implemented a corresponding algorithm in the analysis, and it turned out that the additional computational load does not add too much to the processing time, but memory requirements dramatically increased. Therefore, we propose to group simultaneously active cells according to their joint firing probabilities, which essentially produces a subset of all possible subpatterns. In doing so, some significant patterns might however be missed, and the overall significance of the data might be underestimated, resulting in reduced test power (Figure 6). The functional coupling between cells can easily be assessed by comparing the number of synchronous spikes to the chance level of coincident firing as estimated by Eq. (1), assuming serial independence and stationarity of firing events. As an alternative, one could employ conventional cross-correlation techniques, among which information theoretic approaches seem to be most sensitive (Yamada et al., 1993). Both methods fail to give meaningful results if events are scarce, which is why we implemented an additional global threshold with respect to the joint firing probabilities to identify each neuron’s peers. Besides, other methods to quantify the correlation between two spike trains exist which may as well be applied, like for example fitting pairwise maximum entropy models to the data (Roudi et al., 2009) or determining the degree of synchrony between spike trains (for a comparison of different innovative measures see Kreuz et al., 2007). The particular advantage of the method of estimating the time-dependent functional coupling between cells proposed here is its technical simplicity and ease of computation. Despite its heuristic character, it has clearly demonstrated its potential to improve pattern detection (Figure 7A). Nevertheless, the thorough evaluation of all possible combinations of events that coincide in the given time window is to be preferred whenever it is technically feasible.
Statistical Issues
Since the complexity of multineuronal spiking activity typically prevents analytical approaches, resampling methods have to be applied to test a certain null hypothesis (Stark and Abeles, 2005; Grün, 2009). Here, we compared three different surrogate data types for testing the significance of coordinated events in parallel time series (Figure 3). Dithering event times randomly and independently almost inevitably changes the interval distribution and introduces a bias toward inappropriately low levels of coordination if uniform dithering is used, regardless of whether the dither window is always centered on the event or not (Figures 5A,B). The only technique we know of that randomizes event times independently and at the same time does not significantly change the interval distribution of a gamma process is the “square root dither” method proposed by Gerstein (2004; Figure 5C). However, this technique conspicuously flattens the more modulated distribution of real inter-spike intervals (Figure 5D), rendering them less regular. As a consequence, the surrogate data can again be expected to contain an inappropriately low number of coordinated events, which in turn would result in an increased number of spuriously detected patterns in the original data (Figure 7B).
If the intention is to disarrange coordinated events, we therefore suggest to randomly shift whole event trains against each other, preferably in combination with random shuffling of short inter-event intervals (Figures 3B,C). While preserving the complete auto-structure is the only way to perfectly account for effects of e.g. spike bursts or oscillatory processes on the apparent coordination of events, shuffling selected intervals in addition to shifting event trains increases the distance between original data and surrogate data and markedly facilitates the detection of patterns (Figure 6C). At the same time, the surrogates also become more dissimilar from each other, which leads to an increased number of statistically significant patterns in every surrogate data set and makes the second level test slightly more conservative with respect to the original data (Figures 6A,D). Recently, Harrison and Geman presented the idea to randomly and independently shift segments of spike trains so that inter-spike intervals are changed only in between them (Harrison and Geman, 2009). How such a procedure affects the validation of patterns and the corresponding error levels remains to be investigated.
Several factors inherent in the presented method should be highlighted that tend to result in conservative estimates of the significance of patterns: First, patterns of a higher complexity may be split into multiple patterns with lower complexity as a consequence of the surrogate data generation (reflected in Figure 4) which may produce misleadingly high numbers of repeating patterns in the surrogate data. Second, the surrogate data sets are more dissimilar from each other than from the original data, because the original data constitutes their common source. This consequently implies an increased potential to contain unique, statistically significant patterns, introducing a bias toward higher pattern counts in the surrogate data. The finding that under certain circumstances the original data contain significantly less repeating patterns than the respective surrogate data (Figure 6D) is arguably attributable to these first two factors. A third potential source of conservative estimates is the statistical test itself: Directly calculating the percentage of counts from the surrogate data that fall below the original count is the most simple test one might think of. When applying this test, one might confidently do so without explicitly correcting for multiple comparisons. The same does not hold if more refined tests are used, like for example the binomial test, which is perfectly applicable and may serve as an alternative but would clearly require a correction. The t-test, like the Wilcoxon signed rank test, is unsuited because of its sensitivity to skewed, discontinuous distributions (Stonehouse and Forrester, 1998) and especially inapplicable if many zero counts generate a floor effect, as is to be expected when looking for complex patterns.
Because the statistical significance of individual patterns and sequences is assessed based on the overall number of their occurrences in the whole data set, they may be significant despite being rare; all that matters for them to be detected as being non-random is that they occur significantly more often in the original data than in the surrogate data, irrespective of other criteria like their particular time of occurrence or their complexity. This distinguishes our method from others in which the statistical evaluation is based on trials or relies on an exact calculation of the probability of occurrence under the null hypothesis. In the presented Monte Carlo approach, the chance level of pattern and sequence occurrences is derived directly from the original data, thus avoiding the “curse of dimensionality” inherent in many other approaches that relate the original data to some exact model and require larger data volumes for assessing the significance of complex patterns. Besides, effects of firing rate on the statistical performance of the method are minimized by disregarding all but the first spike of every unit inside the respective time window and can further be counteracted by adapting the parameters for the pattern search. In conclusion, there are no specific requirements regarding the minimum amount of investigated data, although the probability of a rare pattern to recur and thus to be detected clearly increases with increasing recording time.
Possible Technical Improvements
Although the analysis has been programmed as a single computational process, it can easily be adapted to parallel computing environments by insertion of only a few extra commands that distribute the separate Monte Carlo steps over the available cores. [We refer the reader interested in practically trivial solutions to related parallelization problems to Denker et al. (2010).] In the very near future, the use of multi-core systems and the integration of general-purpose GPUs will enable the evaluation of data comprising hundreds of thousands of events in at most a few minutes. At the same time, the availability of 64 GB of working memory or more in a single workstation should make it possible to systematically analyze all spatial subpatterns and hence to directly detect genuine higher order correlations between units also in large data sets. After all, the problem of detecting significant spatiotemporal patterns in massively parallel time series is not a conceptual one, but one of computational resources.
Conflict of Interest Statement
The authors declare that the research was conducted in the absence of any commercial or financial relationships that could be construed as a potential conflict of interest.
Acknowledgments
The authors wish to thank Sergio Neuenschwander for providing the software for data acquisition (“SPASS”), Nan-Hui Chen for providing the software for spike sorting (“Smart Spike Sorter”), Gordon Pipa, Michael Wibral, Eugénio Rodriguez, and Anton Sirota for helpful discussions on various statistical topics, and Raoul-Martin Memmesheimer for carrying out some of the computations. This work was partially supported by the German Research Foundation (SFB 269) and the Max Planck Society.
References
Abeles, M. (1991). Corticonics – Neural Circuits of the Cerebral Cortex. Melbourne: Cambridge University Press.
Abeles, M., and Gerstein, G. L. (1988). Detecting spatiotemporal firing patterns among simultaneously recorded single neurons. J. Neurophysiol. 60, 909–924.
Aertsen, A. M. H. J., Gerstein, G. L., Habib, M. K., and Palm, G. (1989). Dynamics of neuronal firing correlation: modulation of “effective connectivity.” J. Neurophysiol. 61, 900–917.
Averbeck, B. B., and Lee, D. (2004). Coding and transmission of information by neural ensembles. Trends Neurosci. 27, 225–230.
Berger, D., Borgelt, C., Louis, S., Morrison, A., and Grün, S. (2010). Efficient identification of assembly neurons within massively parallel spike trains. Comput. Intell. Neurosci. 439648.
Brown, E. N., Kass, R. E., and Mitra, P. P. (2004). Multiple neural spike train data analysis: state-of-the-art and future challenges. Nat. Neurosci. 7, 456–461.
deCharms, R. C., and Zador, A. M. (2000). Neural representation and the cortical code. Annu. Rev. Neurosci. 23, 613–647.
Denker, M., Wiebelt, B., Fliegner, D., Diesmann, M., and Morrison, A. (2010). “Practically trivial parallel data processing in a neuroscience laboratory” in Analysis of Parallel Spike Trains, eds S. Grün, and S. Rotter (New York: Springer), 413–436.
Frostig, R. D., Frostig, Z., and Harper, R. M. (1990). Recurring discharge patterns in multiple spike trains. I. Detection. Biol. Cybern. 62, 487–493.
Fujii, H., Ito, H., Aihara, K., Ichinose, N., and Tsukada, M. (1996). Dynamical cell assembly hypothesis – theoretical possibility of spatio-temporal coding in the cortex. Neural Netw. 9, 1303–1350.
Gansel, K. S., and Singer, W. (2006). Detection and validation of first- and second-order multineuronal spike patterns. FENS Abstr. 3, A216.7.
Gerstein, G. L. (2004). Searching for significance in spatio-temporal firing patterns. Acta Neurobiol. Exp. (Wars) 64, 203–207.
Gerstein, G. L., and Aertsen, A. M. H. J. (1985). Representation of cooperative firing activity among simultaneously recorded neurons. J. Neurophysiol. 54, 1513–1528.
Gerstein, G. L., Bedenbaugh, P., and Aertsen, A. M. H. J. (1989). Neuronal assemblies. IEEE Trans. Biomed. Eng. 36, 4–14.
Gerstein, G. L., Perkel, D. H., and Dayhoff, J. E. (1985). Cooperative firing activity in simultaneously recorded populations of neurons: detection and measurement. J. Neurosci. 5, 881–889.
Gerstein, G. L., Perkel, D. H., and Subramanian, K. N. (1978). Identification of functionally related neural assemblies. Brain Res. 140, 43–62.
Gerstein, G. L., Williams, E. R., Diesmann, M., Grün, S., and Trengove, C. (2012). Detecting synfire chains in parallel spike data. J. Neurosci. Methods 206, 54–64.
Gerstner, W., Kreiter, A. K., Markram, H., and Herz, A. V. (1997). Neural codes: firing rates and beyond. Proc. Natl. Acad. Sci. U.S.A. 94, 12740–12741.
Grün, S. (2009). Data-driven significance estimation for precise spike correlation. J. Neurophysiol. 101, 1126–1140.
Grün, S., Diesmann, M., and Aertsen, A. M. H. J. (2002a). Unitary events in multiple single-neuron spiking activity: I. Detection and significance. Neural Comput. 14, 43–80.
Grün, S., Diesmann, M., and Aertsen, A. M. H. J. (2002b). Unitary events in multiple single-neuron spiking activity: II. Nonstationary data. Neural Comput. 14, 81–119.
Grün, S., Diesmann, M., Grammont, F., Riehle, A., and Aertsen, A. M. H. J. (1999). Detecting unitary events without discretization of time. J. Neurosci. Methods 94, 67–79.
Gütig, R., Aertsen, A. M. H. J., and Rotter, S. (2002). Statistical significance of coincident spikes: count-based versus rate-based statistics. Neural Comput. 14, 121–153.
Gütig, R., Aertsen, A. M. H. J., and Rotter, S. (2003). Analysis of higher-order neuronal interactions based on conditional inference. Biol. Cybern. 88, 352–359.
Harris, K. D. (2005). Neural signatures of cell assembly organization. Nat. Rev. Neurosci. 6, 399–407.
Harrison, M. T., and Geman, S. (2009). A rate and history-preserving resampling algorithm for neural spike trains. Neural Comput. 21, 1244–1258.
Hatsopoulos, N. G., Geman, S., Amarasingham, A., and Bienenstock, E. (2003). At what time scale does the nervous system operate? Neurocomputing 52, 25–29.
Hebb, D. O. (1949). The Organization of Behavior – A Neuropsychological Theory. New York: John Wiley & Sons.
Hirata, Y., Katori, Y., Shimokawa, H., Suzuki, H., Blenkinsop, T. A., Lang, E. J., and Aihara, K. (2008). Testing a neural coding hypothesis using surrogate data. J. Neurosci. Methods 172, 312–322.
Kass, R. E., Kelly, R. C., and Loh, W.-L. (2011). Assessment of synchrony in multiple neural spike trains using log-linear point process models. Ann. Appl. Stat. 5, 1262–1292.
Kass, R. E., Ventura, V., and Brown, E. N. (2005). Statistical issues in the analysis of neuronal data. J. Neurophysiol. 94, 8–25.
Kim, S., Putrino, D., Ghosh, S., and Brown, E. N. (2011). A Granger causality measure for point process models of ensemble neural spiking activity. PLoS Comput. Biol. 7, e1001110.
Kreuz, T., Haas, J. S., Morelli, A., Abarbanel, H. D. I., and Politi, A. (2007). Measuring spike train synchrony. J. Neurosci. Methods 165, 151–161.
Lee, A. K., and Wilson, M. A. (2004). A combinatorial method for analyzing sequential firing patterns involving an arbitrary number of neurons based on relative time order. J. Neurophysiol. 92, 2555–2573.
Lopes-dos-Santos, V., Conde-Ocazionez, S., Nicolelis, M. A. L., Ribeiro, S. T., and Tort, A. B. L. (2011). Neuronal assembly detection and cell membership specification by principal component analysis. PLoS ONE 6, e20996.
Martignon, L., Deco, G., Laskey, K., Diamond, M. E., Freiwald, W. A., and Vaadia, E. (2000). Neural coding: higher-order temporal patterns in the neurostatistics of cell assemblies. Neural Comput. 12, 2621–2653.
Nikolić, D. (2007). Non-parametric detection of temporal order across pairwise measurements of time delays. J. Comput. Neurosci. 22, 5–19.
Norman, K. A., Polyn, S. M., Detre, G. J., and Haxby, J. V. (2006). Beyond mind-reading: multi-voxel pattern analysis of fMRI data. Trends Cogn. Sci. (Regul. Ed.) 10, 424–430.
Pazienti, A., Maldonado, P. E., Diesmann, M., and Grün, S. (2008). Effectiveness of systematic spike dithering depends on the precision of cortical synchronization. Brain Res. 1225, 39–46.
Pipa, G., Wheeler, D. W., Singer, W., and Nikolić, D. (2008). NeuroXidence: reliable and efficient analysis of an excess or deficiency of joint-spike events. J. Comput. Neurosci. 25, 64–88.
Roudi, Y., Nirenberg, S., and Latham, P. E. (2009). Pairwise maximum entropy models for studying large biological systems: when they can work and when they can’t. PLoS Comput. Biol. 5, e1000380.
Samonds, J. M., and Bonds, A. B. (2004). Real-time visualization of neural synchrony for identifying coordinated cell assemblies. J. Neurosci. Methods 139, 51–60.
Sastry, P. S., and Unnikrishnan, K. P. (2010). Conditional probability-based significance tests for sequential patterns in multineuronal spike trains. Neural Comput. 22, 1025–1059.
Schneider, G., and Grün, S. (2003). Analysis of higher-order correlations in multiple parallel processes. Neurocomputing 52, 771–777.
Schneider, G., Havenith, M. N., and Nikolić, D. (2006). Spatiotemporal structure in large neuronal networks detected from cross-correlation. Neural Comput. 18, 2387–2413.
Schnitzer, M. J., and Meister, M. (2003). Multineuronal firing patterns in the signal from eye to brain. Neuron 37, 499–511.
Schrader, S., Grün, S., Diesmann, M., and Gerstein, G. L. (2008). Detecting synfire chain activity using massively parallel spike train recording. J. Neurophysiol. 100, 2165–2176.
Shadlen, M. N., and Newsome, W. T. (1994). Noise, neural codes and cortical organization. Curr. Opin. Neurobiol. 4, 569–579.
Shahaf, G., Eytan, D., Gal, A., Kermany, E., Lyakhov, V., Zrenner, C., and Marom, S. (2008). Order-based representation in random networks of cortical neurons. PLoS Comput. Biol. 4, e1000228.
Singer, W., Engel, A. K., Kreiter, A. K., Munk, M. H. J., Neuenschwander, S., and Roelfsema, P. R. (1997). Neuronal assemblies: necessity, signature and detectability. Trends Cogn. Sci. (Regul. Ed.) 1, 252–260.
Smith, A. C., Nguyen, V. K., Karlsson, M. P., Frank, L. M., and Smith, P. (2010). Probability of repeating patterns in simultaneous neural data. Neural Comput. 22, 2522–2536.
Smith, A. C., and Smith, P. (2006). A set probability technique for detecting relative time order across multiple neurons. Neural Comput. 18, 1197–1214.
Stark, E., and Abeles, M. (2005). Applying resampling methods to neurophysiological data. J. Neurosci. Methods 145, 133–144.
Staude, B., Grün, S., and Rotter, S. (2010). Higher order correlations in non-stationary parallel spike trains: statistical modeling and inference. Front. Comput. Neurosci. 4:16.
Stonehouse, J. M., and Forrester, G. J. (1998). Robustness of the t and U tests under combined assumption violations. J. Appl. Stat. 25, 63–74.
Tetko, I. V., and Villa, A. E. P. (1997). Fast combinatorial methods to estimate the probability of complex temporal patterns of spikes. Biol. Cybern. 76, 397–407.
Tetko, I. V., and Villa, A. E. P. (2001). A pattern grouping algorithm for analysis of spatiotemporal patterns in neuronal spike trains. 1. Detection of repeated patterns. J. Neurosci. Methods 105, 1–14.
Theunissen, F. E., and Miller, J. P. (1995). Temporal encoding in nervous systems – a rigorous definition. J. Comput. Neurosci. 2, 149–162.
VanRullen, R., Guyonneau, R., and Thorpe, S. J. (2005). Spike times make sense. Trends Neurosci. 28, 1–4.
von der Malsburg, C. (1986). “Am I thinking assemblies?” in Brain Theory, eds G. Palm, and A. M. H. J. Aertsen (Berlin: Springer), 161–176.
Yamada, S., Matsumoto, K., Nakashima, M., and Shiono, S. (1996). Information theoretic analysis of action potential trains. II. Analysis of correlation among n neurons to deduce connection structure. J. Neurosci. Methods 66, 35–45.
Yamada, S., Nakashima, M., Matsumoto, K., and Shiono, S. (1993). Information theoretic analysis of action potential trains. I. Analysis of correlation between two neurons. Biol. Cybern. 68, 215–220.
Appendix
Derivation of the Rate-Based Chance Level of Spurious Coincidences
Let niT be the (known) number of events of unit i during time interval T, then the number kiW of events of unit i in the time window W (with W < T) can be approximated as
assuming serial independence and stationarity of events. Under the condition that T/W ≥ niT, the probability P of coinciding events of M different units labeled 1…M in time window W is
Since T/W is the number of time windows W in the time interval T, multiplying Eq. (A2) with this number gives the expected number of coincidences of M different units during time interval T:
Insertion of Eq. (A1) and conversion yields
In the case of M = 2, Eq. (A4) becomes
with being the expected number of coincidences of units i and j during time interval T, and niT and njT being the numbers of events of units i and j during time interval T.
Surrogate Data Generating Procedures
Formally, the methods for generating surrogate data are expressed as follows. Definitions include ti being the ith timestamp of an event train t1…n with n events labeled 1…n, the preceding inter-event interval δp = ti – ti-1, the subsequent inter-event interval δs = ti+1 – ti, the maximal width w of the dither window, and a random number r ∈ ℝ.
Single event times were dithered randomly and independently according to
The random number r is bounded above by υs and below by –υp such that –υp ≤ r ≤ υs. The bounds were defined depending both on the adjacent inter-event intervals and on w. When the resulting dither window was required to be centered on the event (“symmetric dither”), the bounds were specified corresponding to
with min(…) returning the number with the lowest value. In cases where the window center was allowed to deviate from the time of the event (“asymmetric dither”), the bounds were calculated independently from each other:
In both cases, the probability for an event to occur is distributed uniformly over the dither window. By contrast, the “square root dither” method (Gerstein, 2004) relocates event times randomly within a window that is composed of the square roots of υp and υs as given by Eqs (A8) and (A9):
The offset r results from drawing a random number q ∈ –υp; υs and squaring its absolute value while keeping its sign, such that r = q × | q | with |…| denoting the absolute value.
Event trains were shifted randomly and independently according to
with –w/2 ≤ r ≤ w/2. When additional interval shuffling was applied, consecutive inter-event intervals δ ≤ w/2 were randomly rearranged.
Data Simulation
Sets of 30 parallel simulated spike trains were generated on biologically plausible timescales by gamma processes featuring independent rate modulations (data type 1), rate covariations (data type 2) and precisely repeating spatiotemporal patterns and pattern sequences (data types 3, 4, and 5). By default, the rate parameter was fixed (β = 49), while the shape parameter (order) varied randomly between 0.7 (bursty) and 7 (regular) for any given spike train, resulting in mean firing rates of ∼ 3–30 Hz. In rate modulated data (data type 1), the rate parameter was changed to a random value between 24 and 74 for five consecutive inter-event intervals chosen randomly from every 25 inter-event intervals, resulting in transient firing rates of ∼ 2–60 Hz. Rate covariations (data type 2) were realized by jointly randomizing the rate parameter between 24 and 74 for 1 s every 5 s. Exactly repeating spatiotemporal spike patterns, arranged in a synfire chain-like structure (Figure A1), were inserted into the data every second (data type 3) or every five seconds (data types 4 and 5), leading to an average fraction of coordinated events of 11.8% (SD 1.2) and 2.6% (SD 0.3), respectively. Importantly, a distinction is made between data containing spikes concurrent to but not participating in the inserted patterns (data types 3 and 4, Figure A1A) and data with these events removed (data type 5, Figure A1B). The spike trains were truncated at 50 s and divided into 5 s intervals as the basis for calculating the correlation matrix and for generating surrogate data.
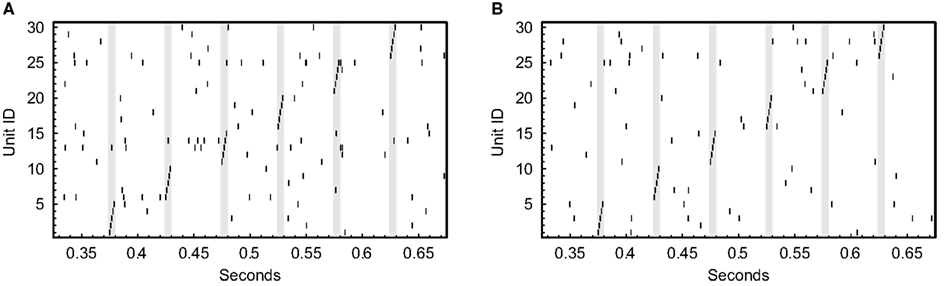
Figure A1. Spike raster plots exemplifying simulated data segments including inserted spatiotemporal patterns and pattern sequences. Thirty parallel spike trains were generated by gamma processes with rate parameter β = 49 and random shape parameter α = 0.7–7. Patterns consisted of five spikes with millisecond intervals and followed each other with an onset delay of 50 ms, giving rise to a synfire chain-like structure made up of six distinct patterns with exactly one spike per unit (periods of pattern occurrences highlighted in gray). (A) Some events co-occur by chance with the inserted patterns, complicating their detection (data types 3 and 4). (B) Events concurrent to but not participating in the inserted patterns have been removed to ensure the correct identification of the patterns (data type 5).
Data acquisition
Experiments were carried out in accordance with European and German laws for the protection of animals. Coronal slices (400 μm) were prepared from visual cortices of juvenile (P17–P22) Wistar rats. Recordings were performed at 37°C in a submersion chamber continuously perfused with oxygenated artificial cerebrospinal fluid containing (in mM) 110 NaCl, 3.75 KCl, 1.25 NaH2PO4, 25 NaHCO3, 1 CaCl2, 1 MgCl2, and 17.5 glucose. In certain periods, Carbachol (20 or 50 μM), Bicuculline (30 μM), CGP-35348 (10 μM), and KCl (10 mM) were added. In addition, intermittent electrical stimulation was applied to layer IV or layer V cells using a 59-electrode array (Multichannel Systems, Reutlingen, Germany) with flat electrodes spaced at 200 μm, integrated in the bottom of the chamber. One to three electrode pairs were selected for weak bipolar stimulation (rectangular pulse, ±100 or ±200 μA, 200 μs) of the neuronal tissue at frequencies ranging from 0.5 to 40 Hz using a programmable stimulator (STG 1008, Multichannel Systems).
Spontaneous and evoked activity was recorded with a silicon-based multielectrode array (Bionic Technologies, Salt Lake City, UT, USA) consisting of 1.5 mm long, sharpened electrodes arranged in a regularly spaced (tip distance 400 μm) matrix. The recording electrode tips (2 μm diameter, 0.1–0.8 MΩ impedance at 1 kHz) were placed in the middle of the slice and covered an area of 3.2 mm horizontally and 1.2 mm vertically, including all six cortical layers. Single-unit spiking activity was extracted from 32 sampled channels by offline sorting. The analysis encompasses data obtained from 10 animals comprising between ∼ 40000 and ∼ 270000 spikes recorded simultaneously from 56 to 125 units in 40 to 120 min.
Keywords: spike pattern, cell assembly, phase sequence, synfire chain, synfire braid, rat visual cortex
Citation: Gansel KS and Singer W (2012) Detecting multineuronal temporal patterns in parallel spike trains. Front. Neuroinform. 6:18. doi: 10.3389/fninf.2012.00018
Received: 04 January 2012; Accepted: 25 April 2012;
Published online: 22 May 2012.
Edited by:
Daniel Gardner, Weill Cornell Medical College, USAReviewed by:
Daniel Gardner, Weill Cornell Medical College, USAKeith P. Purpura, Weill Cornell Medical College, USA
Copyright: © 2012 Gansel and Singer. This is an open-access article distributed under the terms of the Creative Commons Attribution Non Commercial License, which permits non-commercial use, distribution, and reproduction in other forums, provided the original authors and source are credited.
*Correspondence: Kai S. Gansel, Department of Neurophysiology, Max-Planck-Institute for Brain Research, Deutschordenstrasse 46, 60528 Frankfurt am Main, Germany. e-mail:a2FpLmdhbnNlbEBicmFpbi5tcGcuZGU=