 Ai-Ling Hsu1,2
 Ping Hou1Jason M. Johnson3
 Changwei W. Wu4
 Kyle R. Noll5
 Sujit S. Prabhu6Sherise D. Ferguson6
 Vinodh A. Kumar3Donald F. Schomer3John D. Hazle1Jyh-Horng Chen2*
 Ho-Ling Liu1*
- 1Department of Imaging Physics, The University of Texas MD Anderson Cancer Center, Houston, TX, United States
- 2Graduate Institute of Biomedical Electronics and Bioinformatics, National Taiwan University, Taipei, Taiwan
- 3Department of Diagnostic Radiology, The University of Texas MD Anderson Cancer Center, Houston, TX, United States
- 4Graduate Institute of Humanities in Medicine, Taipei Medical University, Taipei, Taiwan
- 5Section of Neuropsychology, Department of Neuro-Oncology, The University of Texas MD Anderson Cancer Center, Houston, TX, United States
- 6Department of Neurosurgery, The University of Texas MD Anderson Cancer Center, Houston, TX, United States
Task-evoked and resting-state (rs) functional magnetic resonance imaging (fMRI) techniques have been applied to the clinical management of neurological diseases, exemplified by presurgical localization of eloquent cortex, to assist neurosurgeons in maximizing resection while preserving brain functions. In addition, recent studies have recommended incorporating cerebrovascular reactivity (CVR) imaging into clinical fMRI to evaluate the risk of lesion-induced neurovascular uncoupling (NVU). Although each of these imaging techniques possesses its own advantage for presurgical mapping, a specialized clinical software that integrates the three complementary techniques and promptly outputs the analyzed results to radiology and surgical navigation systems in a clinical format is still lacking. We developed the Integrated fMRI for Clinical Research (IClinfMRI) software to facilitate these needs. Beyond the independent processing of task-fMRI, rs-fMRI, and CVR mapping, IClinfMRI encompasses three unique functions: (1) supporting the interactive rs-fMRI mapping while visualizing task-fMRI results (or results from published meta-analysis) as a guidance map, (2) indicating/visualizing the NVU potential on analyzed fMRI maps, and (3) exporting these advanced mapping results in a Digital Imaging and Communications in Medicine (DICOM) format that are ready to export to a picture archiving and communication system (PACS) and a surgical navigation system. In summary, IClinfMRI has the merits of efficiently translating and integrating state-of-the-art imaging techniques for presurgical functional mapping and clinical fMRI studies.
Introduction
Functional magnetic resonance imaging (fMRI) based on a blood oxygenation level–dependent (BOLD) mechanism has growing significance in clinical imaging studies for the management of neurological diseases (Matthews et al., 2006). One of the promising applications of clinical fMRI is to aid presurgical planning in order to maximize the lesion resection while preventing post-operative functional deficits (Vlieger et al., 2004; Sanai et al., 2008). With use of block-design paradigms, fMRI activations have been shown to correlate well with the clinical gold-standard—intra-operative direct cortical stimulation (DCS)—making it valuable for presurgical planning (Bizzi et al., 2008; Weng et al., 2017). However, functional brain mapping that exploits the task-fMRI technique alone presents two major challenges in patients with intracranial pathology. First, the impaired cerebrovascular reactivity (CVR) can decrease sensitivity and specificity on localizing eloquent regions near or within the lesion (Ulmer et al., 2003, 2004; Pillai and Zacà, 2011, 2012) because BOLD-fMRI relies on intact coupling between neural firing and cerebrovascular response (Roy and Sherrington, 1890; Harrison et al., 2002). Thus, CVR mapping has been recommended as an essential component when the reliability of fMRI mapping is a concern (Pillai and Mikulis, 2015; Pak et al., 2017). Second, since the effectiveness of task-fMRI depends highly on patient's performance and participation, ensuring adequate task compliance can be challenging in patients with neurological deficits or altered behavior capabilities (Pujol et al., 1998; Bookheimer, 2007). As an alternative to task-fMRI, resting-state fMRI (rs-fMRI) has become a promising technique in localizing brain regions in functional networks, regardless of task engagement (Quigley et al., 2001; Zhang et al., 2009; Mitchell et al., 2013). To effectively translate the aforementioned techniques for presurgical planning and fMRI studies in clinical populations, specialized clinical software is required to integrate these complementary techniques and promptly generate useful information in a clinical format before surgery or before a clinical decision is made.
Since the BOLD signal is based on neurovascular coupling, the abnormal cerebral vasculature or regional hemodynamic disruption caused by intracranial pathology can impair the CVR and invalidate the assumption of neurovascular coupling. Such neurovascular uncoupling (NVU) can potentially result in false negative errors in fMRI mapping (lack of BOLD signal despite neural activity) which may potentially contribute to an undesirable resection of eloquent cortex (Ulmer et al., 2003; Pillai and Mikulis, 2015; Pak et al., 2017). Without further confirmation by intraoperative DCS, this fMRI false negative could lead to permanent postoperative neurological deficits. Impaired CVR has been reported in brain tumors (Hsu et al., 2004; Pillai and Zacà, 2012), cerebrovascular diseases (Mikulis et al., 2005; Chang et al., 2013), and neurodegenerative diseases (Iadecola, 2004). In these cases, mapping CVR with MRI during a vasodilatation challenge would be a useful technique to indicate the NVU potential for assisting the interpretation of clinical fMRI activation (Pillai and Mikulis, 2015; Pak et al., 2017), to detect a vascular risk in Alzheimer's disease (Glodzik et al., 2013), as well as to predict early perfusion change after vascular intervention (Chang et al., 2009). Practically, CVR experiments can be conducted by using ordinary fMRI acquisition methods during a breath-holding (BH) task (Kastrup et al., 2001; Liu et al., 2002). The post-processing resembles task-fMRI with several modifications such as the selection of impulse response functions (Birn et al., 2008; Pillai and Zacà, 2012; Jahanian et al., 2016) and the consideration of hemodynamic delays (Birn et al., 2008; Jahanian et al., 2016). Therefore, despite its importance in clinical applications, implementation of MRI data analysis for CVR mapping requires modifications to the existing fMRI software and is a time-consuming procedure that can be difficult without the assistance of an expert.
The rs-fMRI is capable of mapping intrinsic functional networks in which the within-network spontaneous BOLD oscillations emerge in synchrony during rest (Biswal et al., 1995). The rs-fMRI has been shown to be of importance in neurosurgical applications (Lang et al., 2014) and in charactering the integrity of the brain network for a wide variety of diseases (Lee et al., 2013; Matthews and Hampshire, 2016). These networks are often detected with use of seed-correlation analysis (SCA) (Biswal et al., 1995; Shimony et al., 2009) or data-driven approaches such as independent component analysis (ICA) (Smith et al., 2009; Zhang et al., 2009). The SCA approach is straightforward and imposes prior knowledge for seed selection; however, spatial distortions and functional reorganization due to brain lesions can make seed selection difficult on the basis of anatomical landmarks alone. In contrast, although the ICA approach does not have the issues associated with seed placement, determining the proper number of components and selecting components of interest in this approach is challenging (Branco et al., 2016). Software toolboxes have been developed for analyzing rs-fMRI data for presurgical fMRI mapping using either SCA or ICA approaches (Böttger et al., 2011; Huang et al., 2016). However, to the best of our knowledge, no existing software provides integrated visualization, such as an interface that allows the use of task-fMRI results to guide the SCA in rs-fMRI processing and directly generates results that are ready for exporting to a radiology picture archiving and communication system (PACS) and to a neurosurgical navigation system.
Although the aforementioned analyses for various fMRI modalities are feasible with existing research software such as AFNI (Cox, 1996), SPM (Welcome Department of Cognitive Neurology, Institute of Neurology, London, UK), and FSL (Smith et al., 2004) or in-house scripts, a clinical translation of these techniques in a holistic way is needed. In our study, we developed Integrated fMRI for Clinical Research (IClinfMRI) software to facilitate clinical fMRI research with applicability in presurgical fMRI planning. Beyond the independent processing of task-fMRI, rs-fMRI, and CVR mapping, IClinfMRI supports interactive rs-fMRI mapping while visualizing task-fMRI results as a guidance map, provides visualization of sites with potential NVU in fMRI results, and exports overlays of mapping results on structural MR images in presentations that can be readily sent to a clinical PACS as well as to a surgical navigation system.
Materials and Methods
Developing Environment
The IClinfMRI software was developed on the MATLAB 2014a platform (The MathWorks, Inc., Natick, MA, USA). The software was built upon in-house scripts and calls functions in free for noncommercial-use software such as dcm2nii (https://www.nitrc.org/projects/dcm2nii/), AFNI (version 16.2.09) (Cox, 1996), and SPM12 (v6685) (Welcome Department of Cognitive Neurology, Institute of Neurology, London, UK). The dcm2nii is used to convert images from Digital Imaging and Communications in Medicine (DICOM) to Neuroimaging Informatics Technology Initiative (NIfTI) formats. Functions in both AFNI and SPM12 are adopted for data analysis.
Workflow and Processing Pipeline
The IClinfMRI software has five modules: DICOM Import, Task fMRI, Resting-state fMRI, CVR mapping, and fMRI to PACS. Figure 1 shows the schematic workflow of IClinfMRI and the functionalities provided in each module. In DICOM Import, DICOM images in a file folder are recognized, sorted, and converted to NIfTI files, which facilitates interoperability among research image processing software, and is saved in organized subdirectories that are named according to the series descriptions stored in the DICOM header. Next, task-fMRI, rs-fMRI, and BH-MRI data are analyzed by modules of Task fMRI, Resting-state fMRI, and CVR mapping, respectively. After the analysis, the mapping results in NIfTI format are properly thresholded and overlaid on clinical structural MR images (e.g., T1-weighted [T1w] or fluid-attenuated inversion recovery [FLAIR] images). The color-coded and gray-scale overlays are exported as a series of DICOM files by using the fMRI to PACS module. Table 1 lists the available functions provided in each module. All temporal analyses and image registration call AFNI's functions, and image segmentation and inverse normalization (from template to individual space) call functions from SPM12. Key arguments specified in the functions are described below.
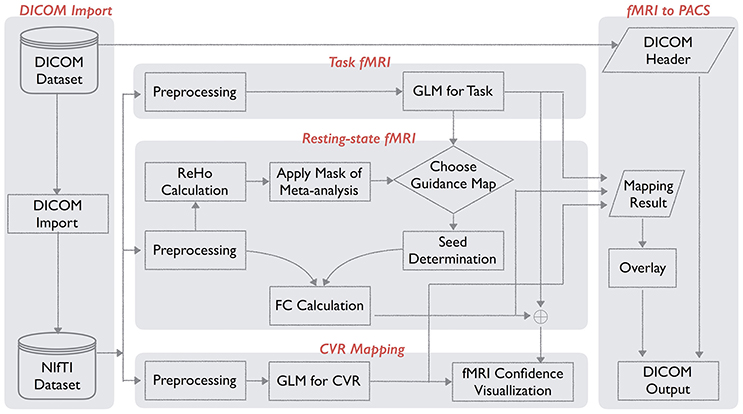
Figure 1. Workflow for integrated fMRI for Clinical Research (IClinfMRI) software.
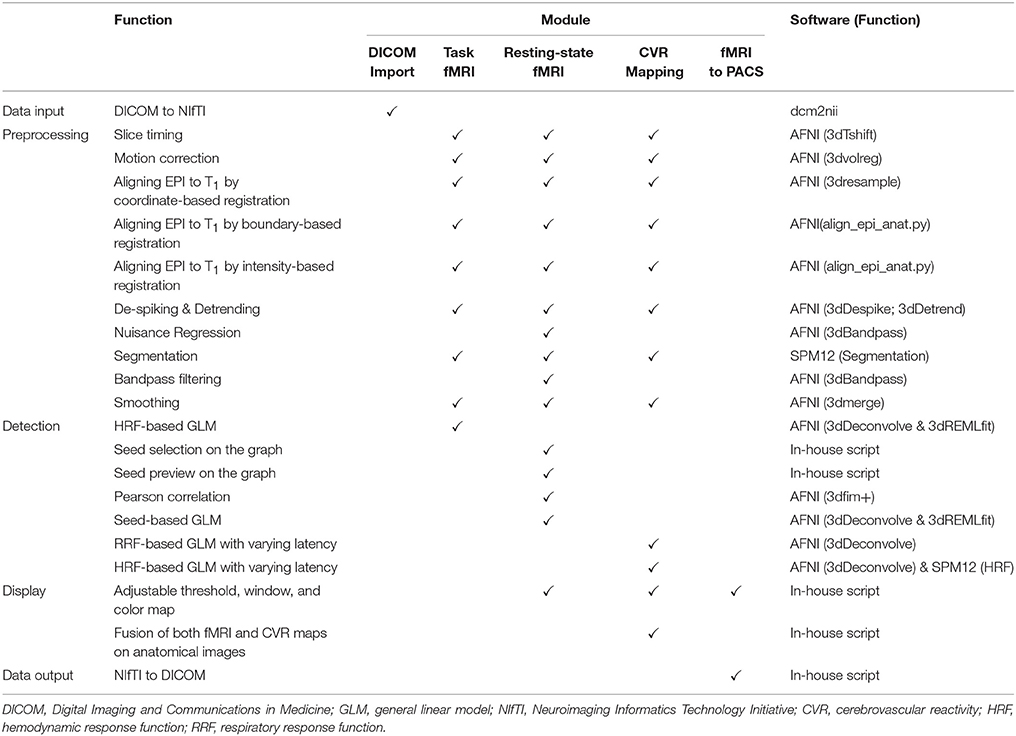
Table 1. Summary of IClinfMRI models and functions used to process the fMRI data.
Functional images are motion-corrected to a reference volume with use of rigid-body registration and then resampled to an isotropic grid matching the orientation of a resampled T1w image, which is resampled to the same isotropic grid in advance. A reference volume is the time point from fMRI data that has the fewest outliers, which are defined as the time point with its value deviant from the trend above a limit and are calculated with use of 3dToutcount. In a typical range of 50–500 time points per session, this deviation limit calculated by the default setting is approximately 5.5 × MAD away from the fitted trend, where MAD is median absolute value of time series minus trend. For aligning functional images into a structural T1w image volume, three methods are incorporated: coordinate-based registration (CBR), intensity-based registration (IBR), and boundary-based registration (BBR). For the CBR method, the spatial resolution of fMRI dataset is resampled to match that of a T1w image using 3dresample. For the IBR method, the alignment matrix is estimated by a reference volume of the functional data to a T1w image by using the cost function of normalized mutual information (align_epi_anat.py with the option of “-dset2to1” and “-cost nmi”). For the BBR method, a high-resolution echo-planar imaging (EPI) volume with prominent tissue boundaries of gray matter (GM), white matter (WM), and cerebrospinal fluid (CSF) is required and registered to a T1w image using the cost function of local Pearson correlation (align_epi_anat.py with the option “-epi2anat”) (Saad et al., 2009). In the study that proposed the BBR method (Saad et al., 2009), the spatial resolutions were 3 × 3 × 3 mm3 and 1 × 1 × 1 mm3 for echo-planar and T1w images, respectively, which led to an improved registration as compared to CBR and IBR. When the users prefer BBR but their fMRI datasets are acquired at a lower resolution and the resultant echo-planar images do not have clear tissue boundaries, our software provides the option for them to use an additionally acquired single-volume high-resolution echo-planar image to determine the spatial transformation. The reference volume of the functional image data is then co-registered to the high-resolution EPI image (align_epi_anat.py with the option of “-dset2to1” and “-cost nmi”), and a concatenated transformation matrix is obtained from the two-step process. For the IBR and BBR alignment, their transformation matrix is combined with the one for motion correction; therefore, spatial transformation and image interpolation (using wsinc5, 3dAllineate) are performed only once for each original functional image volume. The final voxel size of aligned functional images is 2-mm or 3-mm isotropic, as determined by users.
Task-fMRI activation maps are generated with use of the general linear model (GLM) by calculating the fitness of the preprocessed fMRI signal to the expected response that was constructed by convolving a canonical hemodynamic response function (HRF) with the task paradigm. During the fitting procedure, six motion parameters generated in the preprocessing step are set as the nuisance regressors, and the temporal autocorrelation structure in the residual is corrected by using the generalized least squares technique (3dREMLfit) with an autoregressive model of order 1 and moving average model of order 1, i.e., ARMA(1,1).
For rs-fMRI analysis, noise components are modeled by six motion parameters and two averaged signal fluctuations over masks of WM and CSF. These masks are generated by setting a probability threshold of 99.9% on the segments of the three-dimensional (3D) T1w image. The 3D T1w image was segmented into GM, WM, and CSF tissue segments using unified segmentation approach (Ashburner and Friston, 2005) in SPM12. On the basis of the probabilistic framework, this tool involved circular procedure of image registration, tissue classification, and bias field correction for optimizing the segmentation. Both masks are eroded by one voxel along each of the three axes (Jo et al., 2010) for preventing the partial volume effect on the masks and then resampled to match the spatial resolution of the aligned rs-fMRI data. It is optional to include a global signal fluctuation as an additional noise component by extracting the averaged signal from a whole brain mask produced by setting a sum of tissue probability maps of GM, WM, and CSF with a threshold of 30%. After removing the noise components and performing other preprocessing steps, such as the temporal filtering (Table 1), the rs-functional connectivity (FC) map is obtained by correlating the average time series from a seed region against that from every voxel in the brain.
Unique Features
Instead of analyzing each fMRI modality independently, IClinfMRI provides a unique workflow to integrate them for clinical research applications. In the Resting-state fMRI module, we designed a double-panel graphical user interface (GUI) to support interactive rs-fMRI mapping while visualizing a guidance map of the user's choice for seed placement. The guidance map can be an anatomical image, a functional map processed by IClinfMRI's Task fMRI module, or a parametric map resulting from other research software. In this module, the seed is placed by using a simple mouse click on either of the two panels, and the seed-based FC map will be calculated, converted to a Fisher's z map, and then interactively updated on the bottom right panel of the GUI. In addition, visualization of mapping results can be easily manipulated with options that include window, threshold, opacity, and color map. Two approaches are suggested and implemented to obtain a guidance map: (1) processing task-fMRI data by using the Task fMRI module, and (2) calculating a regional homogeneity (ReHo) map with the use of 3dReHo (Taylor and Saad, 2013) embedded in the Resting-state fMRI module. The ReHo analysis summarizes the local FC by measuring the temporal similarity between a given voxel and its neighborhood with the use of Kendall coefficient of concordance (Zang et al., 2004). The ReHo map has been proposed as the alternative to guide seed selection and improve the sensitivity of rs-FC network detection (Yan et al., 2013). Besides, local activity could also contain useful information in tumor studies (Duan et al., 2016), but we have not yet incorporated this feature in our software. In our Resting-state fMRI module, the preprocessed rs-fMRI data before spatial smoothing was fed into the ReHo analysis for obtaining ReHo map (Zuo et al., 2013). In addition to offering the ReHo map alone, we further implemented a novel approach that seeds the connectivity analysis based on the ReHo map confined within a mask obtained from meta-analysis (RH + MA). For the analysis of language network, the meta-analysis result was downloaded from the Neurosynth (http://neurosynth.org/) by using the term “language” that resulted from 885 studies (Yarkoni et al., 2011) and then inversely normalized the meta-analysis maps from standard space to the native space using SPM12. Since it was corrected for a false discovery rate (FDR) of 0.01, we did not apply an additional threshold but constrained the result within the brain regions covering the putative Broca's and Wernicke's areas. These brain regions included middle frontal gyrus and inferior frontal gyrus for the traditional Broca's area, and comprised angular gyrus, supramarginal gyrus, and superior temporal gyrus for the traditional Wernicke's area, implemented by using the LONI Probabilistic Brain Atlas (Shattuck et al., 2008). The final mask was then dilated for 4-mm to consider the altered functional anatomy in patients.
In the CVR mapping module, two types of impulse response functions are implemented, the canonical HRF (Birn et al., 2008; Jahanian et al., 2016) and the respiratory response function (RRF) (Birn et al., 2008; Pillai and Zacà, 2012), to generate the CVR map by using the GLM with an adjustable series of multiple time delays. In the voxel-wise optimization, the GLM analysis is repeated for each time delay, and the maximum t-value across multiple GLM results will be selected for each voxel, to account for the varying latency of the CVR responses across the brain (Birn et al., 2008; Jahanian et al., 2016). We provide the visualization for fusions of both fMRI and CVR maps on anatomical images, which integrates the results into a single presentation. This allows the display of areas with potential NVU, that is, potential activated areas with both negative fMRI and CVR, near or within the lesion.
Presenting the mapping result in a clinical format is an essential function in software designed for clinical applications. In IClinfMRI, the fMRI to PACS module is used for exporting the functional mapping result to not only color-coded but also gray-scale overlays as DICOM images that can be fed into the same patient directory in PACS and surgical navigation system, respectively. Multiple anatomical images, e.g., T1w and FLAIR images, can be selected as underlays, for the same functional overlay to be output in the same series. For color-coded output, three sets of DICOM files are produced, one in each of the three orthogonal planes.
Software Installation and Use
IClinfMRI is available as a zip file upon request, and the user can unzip it to a local directory. Under the MATLAB environment, the user can click “Set Path” and add the directory containing IClinfMRI to the path. IClinfMRI will run by simply typing “IClinfMRI” in Matlab. Note that IClinfMRI calls functions in dcm2nii, AFNI, and SPM12; thus, these software packages need to be installed and their functionalities verified before using IClinfMRI.
Illustrative Cases
Analyses of two patients are presented to illustrate the utility of IClinfMRI. Written informed consent was obtained from each patient in accordance with the guidelines and the study protocol approved by the Institutional Review Board at MD Anderson Cancer Center.
Patient #1
Patient #1 had a left temporal-occipital lesion with imaging characteristics concerning for a glioblastoma (WHO Grade IV). This dataset was used to demonstrate the rs-fMRI analysis workflow with the seed placement guided by task-fMRI results. Presurgical mapping of speech areas was requested by the neurosurgeon since the tumor was located near the cortical and subcortical language areas, in particular, the posterior part of the language network (the traditional Wernicke's area). Language task-fMRI, rs-fMRI, T2w FLAIR, and 3D T1w imaging were performed on a 3T clinical scanner (GE Healthcare, Milwaukee, WI, USA). For fMRI acquisition, a -weighted gradient-echo EPI (GE-EPI) sequence was used with the following parameters: repetition time (TR)/echo time (TE) = 2000/25 ms, flip angle = 90°, 32 slices with 4-mm thickness and no gap, in-plane resolution = 3.75 mm × 3.75 mm, parallel imaging with acceleration factor of 2. The 3D T1w image was acquired using a gradient-echo sequence (TR/TE/inversion time = 7.4/2.1/400 ms; flip angle = 20°; 124 slices with 0.94 × 0.94 × 1.2 mm3 voxels). Language task-fMRI included a letter fluency paradigm, a category fluency paradigm, and a sentence completion paradigm. A total of 130 image volumes were obtained from each of the first two paradigms, which started with a 20-s rest period, followed by six cycles of 20-s task block and 20-s rest interval. For the sentence completion paradigm, a total of 120 image volumes were obtained without the last 20-s rest interval. For rs-fMRI, patients were asked to keep their eyes closed, not move their head, not fall asleep, and not think of anything in particular. The acquisition period was 6 min, during which a total of 180 volumes were obtained. The task-fMRI data were processed with use of the Task fMRI module with the following default procedures: motion correction, aligning to a T1w image with a 2-mm isotropic grid via CBR method, de-spiking, spatial smoothing with a 4-mm FWHM 3D Gaussian kernel, and GLM analysis. The rs-fMRI data were first preprocessed in the Resting-state fMRI module with the following default procedures: slice timing, motion correction, aligning to a T1w image with a 2-mm isotropic grid via the CBR method, de-spiking, detrending, nuisance regression (mask of WM and CSF), band-pass filtering (0.01–0.08 Hz), and spatial smoothing with a 4-mm FWHM 3D Gaussian kernel. Next, seed placement of the rs-fMRI data was guided by a task-fMRI map resulting from the Task fMRI module. For this patient, in particular, the seed was positioned at a local maximum of the task-evoked activations near the anterior part of the language network (traditional Broca's area) because the lesion was in left temporal-occipital lobe near the traditional Wernicke's area.
In addition to fMRI, BH-MRI was also performed on the same patient, and the dataset was used to demonstrate the CVR analysis and visualization. For BH-MRI acquisition, a GE-EPI sequence was used with the same setting of fMRI parameters as described above, except that the TR was set to 3,000 ms. The BH paradigm was 210 s long and comprised an initial 30-s natural breathing period, followed by three cycles of alternations between 15-s BH and 45-s natural breathing. Respiration monitoring device was used to confirm the subject's compliance during the BH CVR MRI. The data were preprocessed by using the CVR Mapping module with the following setup: motion correction, aligning to a T1w image with a 2-mm isotropic grid spatial resolution via the CBR method, de-spiking, and spatial smoothing with a 4-mm FWHM 3D Gaussian kernel. The onset time and the task duration recorded during data acquisition were set as the task paradigm. The CVR map with a BH task was generated by using a GLM model with multiple respiratory delays ranging from −10 to 15 s between the task and expected RRF.
Patient #2
Patient #2 had a left temporal-parietal mass with imaging characteristics consistent with glioblastoma (WHO Grade IV). This dataset was used to demonstrate the rs-fMRI analysis workflow when no task-fMRI results were available. According to neuropsychological assessment, the patient showed significant receptive language deficits and global impairment during testing; thus, he was unable to perform a task-fMRI. Instead, the rs-fMRI acquisition was requested to provide presurgical mapping of the eloquent language areas near the lesion. The image protocol included T1w imaging, T2w FLAIR imaging, and rs-fMRI. The rs-fMRI data processing was similar to that of Patient #1, except for that the seed was guided by the RH + MA map and placed at a local maximum of ReHo in the meta-analysis mask of the anterior portion of the language network.
Validation of the rs-fMRI Workflow
To validate our software and workflow for rs-FC mapping, the rs-fMRI data for the two patients were also processed with the procedure adopted in a previous study (Hart et al., 2016) using AFNI software, independent from the IClinfMRI. The independent processing procedure and parameters were identical to ours except for the band-pass filtering (0.01–0.1 Hz), spatial smoothing (6-mm FWHM), and the diameter of the seed (10 mm).
Results
Typing “IClinfMRI” in the MATLAB command window opens the main GUI window (Figure 2). Users can click on one of the five modules to start corresponding functions of the program.
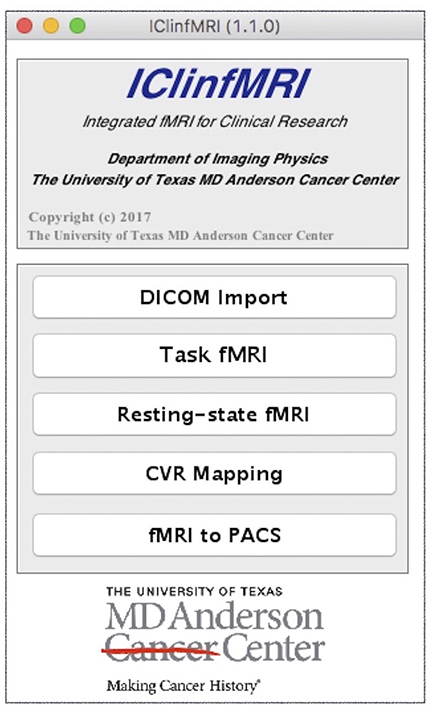
Figure 2. The main graphical user interface (GUI) of IClinfMRI. The main window comprises the five modules of the software.
DICOM Import
As the first module of IClinfMRI, DICOM Import requires users to select a main directory, and all subdirectories containing DICOM files will be automatically recognized using MATLAB function “isdicom” and then renamed according to its embedded DICOM information. Concerning the difference in series naming across the center, three options for subdirectories naming are available in “Folder Rename Option” panel of the GUI, including (1) series description, (2) patient's ID and series description, (3) patient's ID, series description, and series number. Next, the DICOM files in various directories are converted to NIfTI format. The converted NIfTI files are used for the following four modules.
Task fMRI
Since presurgical planning requires task-fMRI activations to be superimposed on an anatomical image, both task-fMRI and high-resolution T1w images are requested in the Task fMRI module, using the “Task-fMRI” and “High-Res T1w” button (Figure 3). The “High-Res EPI” is optional. It allows users to select a high-quality echo-planar image volume, when available, to which the BBR algorithm can be applied to improve the registration with the T1w image. After users provide the onset timing and duration of a task in the unit of seconds, the timing of the paradigm will be updated, as shown in Figure 3. Once the required data and task paradigm are both set, the “Processing” button will be enabled, and the “Preprocessing” section can be modified if the checkbox “Default” is unselected. After the “Processing” button is selected, the task-fMRI data will sequentially undergo the selected preprocessing steps, followed by the GLM-based activation detection. The resulting t-statistical map is saved in a folder named by the task-fMRI data, which can be output for presurgical planning with the last module as well as retrieved in the Resting-state fMRI and CVR Mapping modules when needed.
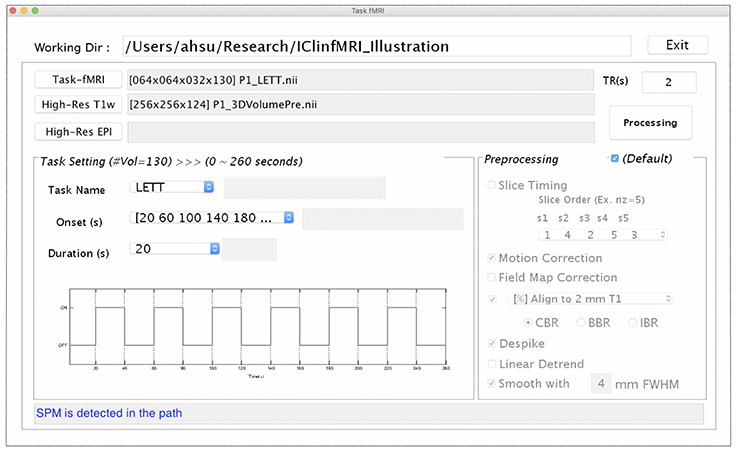
Figure 3. The GUI of task fMRI module. This window consists of the imaging data input (Upper), task paradigm setting (Bottom Left), and preprocessing setting (Bottom Right) panels.
Resting-State fMRI
Figure 4 demonstrates the user interface of the Resting-state fMRI module, with the processing for Patient #1. Both rs-fMRI data and high-resolution T1w image are required, whereas the following three are optional inputs in this module. First, the “Other Anat” button was designed to visualize the resulting rs-FC map on another structural image such as a T2w FLAIR image. When an image is selected via this button, the image will be aligned to the T1w image by using the AFNI “align_epi_anat.py” function with the “-dset2to1” option and “-lpa” cost function. Second, the user can select a binary lesion mask using the “Lesion@T1w” button to exclude the lesion from the WM and CSF masks that are used to generate nuisance regressors in the FC calculation. Third, the utility of the “High-Res EPI” button resembles to Task fMRI module. After completing the data selection, one can click “Preprocess” for preprocessing the rs-fMRI data. The ReHo map of the preprocessed rs-fMRI data will be provided if the “ReHo” checkbox is selected. The guidance for seed selection is a unique function that we designed in this module. Users can select the “Guidance Map” button to superimpose the fMRI result, the ReHo results, or the RH + MA results on the displayed structural image for guiding the seed placement. After completing the data preprocessing, users can then define a seed by left-clicking the mouse on the bottom panels of the GUI, adjust the radius of seed sphere by using the edit box following the “R = ” description, view the seed on the GUI by using “Seed Preview” button, and calculate the seed-based FC map by using “FC Mapping” button. In the demonstrated case (Figure 4), a seed (the turquoise dot with circular contour) was positioned on a local maximum (t = 8.18, uncorrected p < 5 × 10⁻¹³) of the sentence completion task-fMRI activation near the traditional Broca's area. The resulting rs-FC z-map is illustrated in the bottom right panel of the GUI, and the “FC Map Setting” is enabled for adjusting the threshold.
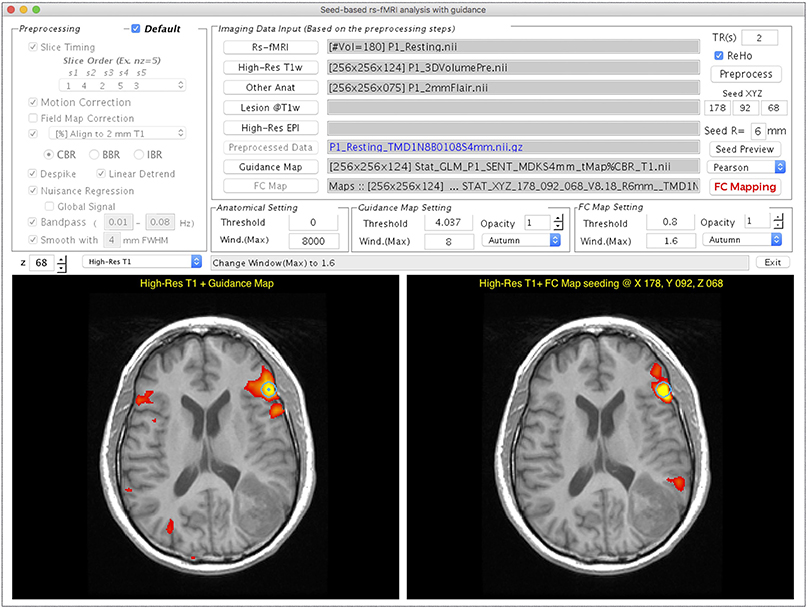
Figure 4. GUI of the Resting-state fMRI module displayed with processing and visualization for Patient #1. This window consists of the preprocessing selection (Upper Left), imaging data input panel (Upper Right), visualization widget (Middle Right), and two visualization panels (Bottom Left and Right). The Bottom left panel shows that the task-fMRI activation overlays (t > 4.04, p < 10−4, uncorrected) on a high-resolution T1w image. The Bottom right panel shows the FC mapping result obtained with the seed determined based on the task-fMRI (turquoise circle).
CVR Mapping
Figure 5 shows the CVR Mapping module, illustrated with the processing for Patient #1. Once the CVR data and T1w images are selected, adjustments on the following four parameters become available: (1) the onset time of the BH period, (2) the duration of each breath-hold, (3) multiple time delays applied to the GLM analysis, and (4) response function used in the GLM analysis. Note that the flexibilities are given in the onset and duration settings of each BH session, since in practice they usually vary among patients/studies. As the parameters are adjusted, the diagram will be updated in the “Paradigm Setting” panel. Similar to the previous modules, the “Other Anat” and “High-Res EPI” are optional inputs. The “fMRI Map” button is used for selecting the task- or rs-fMRI result to be displayed in the bottom left panel (Figure 5). The option of the preprocessing step for CVR mapping is identical to that in the Task-fMRI module (Figure 3). After the processing, the bottom right panel will automatically display the CVR map overlaying on the structural image (Figure 5). Finally, the “Fusion” button is enabled to fuse the resulting CVR map to the preselected fMRI results. Specifically, we display the thresholded CVR map as transparent blue with the solid blue line, together with fMRI activations (or networks) on the anatomical image. In this patient, markedly diminished ipsilateral CVR was seen in the areas within/near the tumor, which indicated NVU potentials and risk of false-negative results in fMRI.
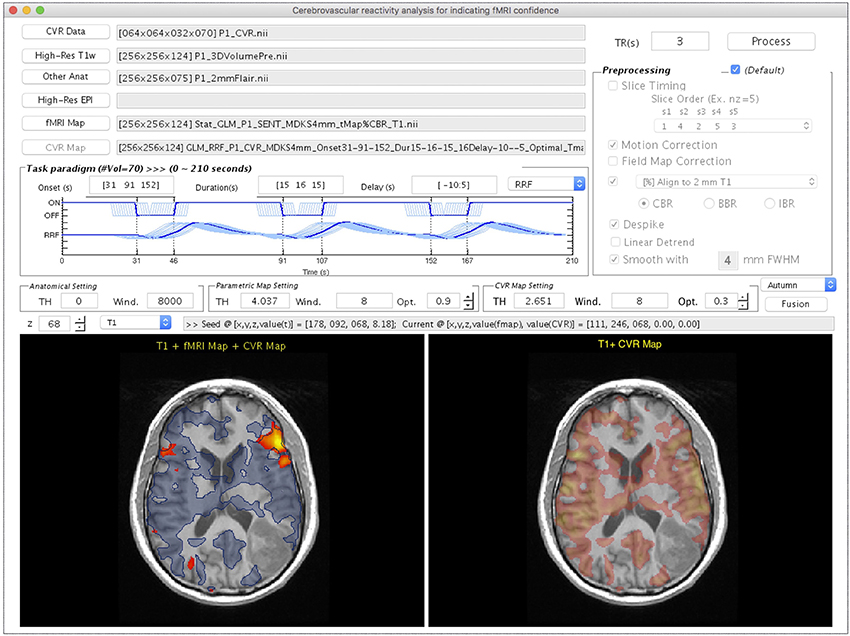
Figure 5. The GUI of the CVR Mapping module displayed with processing and visualization for Patient #1. This window consists of the imaging data input panel (Upper Left), breath-hold paradigm setting (Middle Left), preprocessing selection (Upper Right), visualization widget (Middle), and two visualization panels (Bottom Left and Right). The Bottom Left panel shows the task-fMRI activation overlays (t > 4.04, p < 10−4, uncorrected) on a high-resolution T1w image using the warm color map. The result of CVR mapping (t > 2.65, p < 0.01, uncorrected) displays as transparent blue with a solid blue contour. The area outside the CVR map, but inside potential functional anatomy near the lesion, indicates the location of possible NVU. The Bottom Right panel shows the CVR map using a warm color map.
fMRI to PACS
To convert an fMRI overlay on anatomical images to DICOM files, an anatomical image and parametric map are both required inputs. An option of saving an fMRI overlay on both T1w and another anatomical image (e.g., T2w FLAIR) in the same series was made available. DICOM headers of images in the resulting series adopted partially those in a DICOM image selected by the user, e.g., one of the original T1w DICOM images. The output of this module included a series of DICOM images of white overlay and three series of color-coded overlays in three orthogonal orientations, respectively.
rs-fMRI Case Results and Validation
Figure 6 illustrates the language mappings obtained via task-fMRI and rs-fMRI data for Patient #1. In these speech-fMRI results (Figure 6A), significant activations (t > 4.04, p < 10−4, uncorrected) were detected in bilateral frontal areas and right temporal/parietal area, but not in the left temporal/parietal area or in the traditional Wernicke's area. The rs-fMRI was helpful in that a clear language network between the left frontal and temporal/parietal areas was detected (z ≥ 0.8), as demonstrated in Figures 6B,C (the same results but three kinds of overlay/underlay outputs from this module). Note that the gray-scale fused DICOM format (Figure 6D) can be directly imported by surgical navigation software. Moreover, the rs-fMRI result (Figures 6B–D) was consistent with that obtained by using the procedures described in the previous study and software independent from IClinfMRI (Figure 6E).
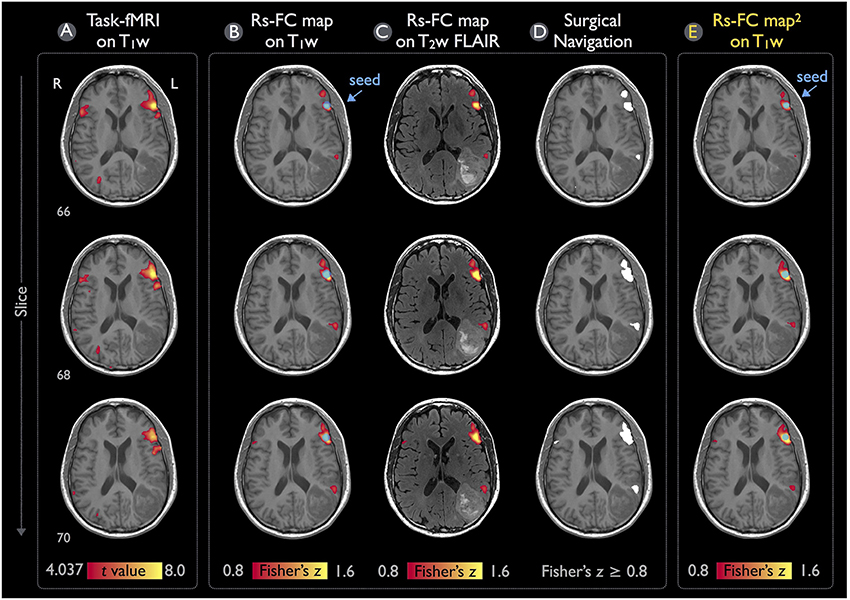
Figure 6. Language mapping resulting from task-fMRI and rs-fMRI for Patient #1. (A) The task-fMRI activation above the t-statistic threshold of 4.04 (p < 10−4, uncorrected) was overlaid on the T1w image. (B,C) Seeding at the peak t-value on the task-fMRI activation (blue circle), the rs-FC map above the Fisher's z threshold of 0.8 was overlaid on the T1w and T2w FLAIR images. (D) The thresholded rs-FC map overlaid on the T1w image in the gray-scale DICOM format. (E) The rs-fMRI result analyzed independently from the IClinfMRI by using the procedure adopted in a previous study (Hart et al., 2016).
Figure 7 demonstrates the rs-fMRI language mapping results for Patient #2, who was not able to perform the speech fMRI tasks. The RH+MA map showed scattered hot spots in the frontal regions (Figure 7A). The seed placed in the putative Broca's area with a peak ReHo value was able to detect functional connectivity in brain regions close to the tumor, which were suspected to be in the posterior portion of the language network (Figures 7B–D). Similar to the results of Patient #1, the rs-fMRI connectivity pattern found by IClinfMRI was similar to that obtained by using previously published procedures (Figure 7E).
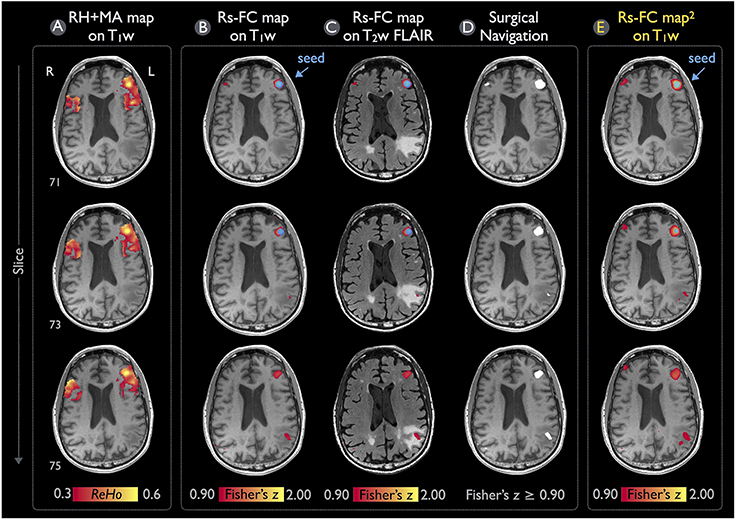
Figure 7. Language mapping of rs-fMRI with seed guided by RH+MA map for Patient #2. (A) The RH+MA map with a ReHo threshold of 0.3 is overlaid on the T1w image. (B,C) Seeding at a local maximum of ReHo value (blue circle), the rs-FC map above the Fisher's z threshold of 0.9 is overlaid on the T1w and T2w FLAIR image. (D) The thresholded rs-FC map overlaid on the T1w image in the gray-scale DICOM format. (E) The rs-fMRI result analyzed independently from the IClinfMRI by using the procedure adopted in the previous study (Hart et al., 2016).
Discussion
Specialized software, IClinfMRI, was proposed in this study to integrate complementary fMRI techniques in clinical studies with applicability for presurgical planning. Clearly distinguishable from well-established fMRI software package, IClinfMRI was designed with user-friendly modules that can be easily fitted into the clinical workflow. These modules include importing/sorting DICOM images, exporting results that can be recognized by clinical PACS and surgical navigation system, and platforms that can analyze the three major clinical fMRI techniques, namely task-fMRI, rs-fMRI, and CVR mapping, independently yet in an integrated fashion. Unique functionalities of our software include the guidance of seed placement for the interactive rs-fMRI mapping and the visualization of CVR results for indicating potential NVU in fMRI activation maps. The IClinfMRI was specifically designed for translation to clinical fMRI practice with careful validation and is the focus of ongoing research for our team.
For the seed-based FC analysis of rs-fMRI data, previous studies predominantly used anatomical landmarks as guidance in placing a seed (Liu et al., 2009; Shimony et al., 2009; Zhang et al., 2009). The prototype of an interactive toolbox was also developed to calculate and visualize the rs-FC mapping after a seed was placed on an anatomical image (Böttger et al., 2011). However, it is well recognized that the functional localization of brain networks varies in healthy subjects (Mueller et al., 2013), and the variability can be even greater in patients with intracranial pathology (Mitchell et al., 2013). Alternatively, Rosazza et al. placed the seeds on the basis of task-fMRI activation and found that this approach was more sensitive in detecting sensorimotor networks in patients with lesions adjacent to functional areas than were seeds placed on the basis of anatomical landmarks (Rosazza et al., 2014). Cochereau et al. demonstrated 80% accuracy in detecting the rs-language network when seeding at functional sites determined by positive intraoperative DCS results (Cochereau et al., 2016). These studies suggested that determining seeds with guidance from independent functional localizations may improve the results of rs-fMRI analysis. Moreover, Yan et al. proposed a method to use ReHo for assisting seed localization in the rs-fMRI analysis, where the technical logic is described below. When defining a seed with a certain radius (or a volume) for rs-FC analysis, one averages time course across all voxels within this volume to form the reference time curve. Such averaging is based on the assumption that the time curves in those neighboring voxels are well synchronized. However, without examining the resting-state fMRI time curves, one would not know the spatial extent of the well-synchronized regions unless calculating the ReHo index. In other words, the seed selection is still primarily based on anatomical location, like most of the studies using seed-based analysis (Zhang et al., 2009; Rosazza et al., 2014; Hart et al., 2016; Huang et al., 2016), and the ReHo index is only used to refine the group of clusters within/around the assumed anatomical location.
Recently, a software toolkit called PreSurgMapp was developed to process both task-fMRI and rs-fMRI, but seed guidance and visualization were not emphasized (Huang et al., 2016). In this work, we designed a double-panel GUI to perform the interactive rs-fMRI mapping while presenting another functional map as guidance for seed determination. Users can directly place a seed in either of the two windows, and it will be synchronously presented in the guidance map and rs-FC results for comparison. This interactive mapping facilitates exploration of the rs-functional network and makes it intuitive to users.
A limitation of our rs-fMRI module is that it supports only seed-based analysis rather than data-driven approaches. Seed-based analysis is more intuitive for users who have clear targets in functional networks that they intent to detect, such as motor and language, which is usually the situation in presurgical mapping. In addition, previous studies indicated the FC maps derived from the seed-based approach have higher consistency with task-fMRI results than do FC maps derived from an independent component analysis (Quigley et al., 2001; Branco et al., 2016; Cochereau et al., 2016; Sair et al., 2016). More recently, methods have been proposed to address the issue of component number optimization for the data-driven analysis (Lu et al., 2017). As the sensitivity and specificity of data-driven approaches improve, we will incorporate these approaches into the IClinfMRI workflow in the future.
A technical challenge of fMRI mapping in patients with neurological diseases is potential false-negative detection due to impaired neurovascular coupling in brain areas adjacent to or within the lesion. This challenge highlights the importance of CVR mapping to indicate brain regions with potential NVU, and subsequently to improve the confidence level of the task-fMRI. However, the existing clinical fMRI software packages, including those designed for presurgical mapping, do not support processing procedures specific to analysis of CVR mapping, such as a varied BH period, respiratory response function, and multiple delays in GLM calculation. Henceforth, we provided a CVR Mapping module with these functionalities to fill this gap in clinical needs. In terms of visualization, the double-panel GUI design, as well as the fused display, allows users to synchronously examine both fMRI and CVR mapping results precisely in their relative spatial positions. Thus, the lack of fMRI activation in targeted functional locations but without significant CVR would be a warning of false-negative detection due to the NVU near or within the lesion.
Many research image processing toolboxes and fMRI processing software packages are able to deal with DICOM images. However, exporting the analysis results into clinical PACS and into a surgical navigation system requires not only outputting the results in DICOM format but also writing the DICOM header in a harmonized manner with other images of the same study. For example, original patient and study information should be kept, and a new series number and description should be generated. These aspects are well considered in all software provided by the MRI vendors and in other FDA-cleared software. Although previously developed research toolboxes for presurgical mapping provide the function to analyze fMRI data (Böttger et al., 2011; Huang et al., 2016), the lack of converting data in the DICOM format was the major obstacle for clinical practices. By giving the proper DICOM header, the fMRI to PACS module allows users to export a mapping result to the DICOM format by reattaching patient's information. It is important to note that this module can be used to export any images in NIfTI format and is not specifically constrained to the results analyzed by IClinfMRI, which makes it a general tool for wider applications such as quantitative imaging.
Concerning the validity of rs-fMRI functional mapping workflow, we demonstrated that the rs-FC maps processed with the procedure set in IClinfMRI were in accordance with the rs-FC maps processed with the procedure adopted in a previous study (Hart et al., 2016) using AFNI software alone (Figures 6, 7). Individual algorithms adopted in this module were identical to those used in previous validation studies that compared seed-based rs-fMRI with intraoperative mapping (Zhang et al., 2009; Rosazza et al., 2014; Cochereau et al., 2016). Minor differences of these rs-FC maps were expected because their preprocessing procedure and parameters were slightly different (see the Materials and Methods section). For example, a smaller spatial extent in Figure 7B compared with that in Figure 7E was caused by the smaller smooth kernel applied in our procedure because spatial extent has been demonstrated to be directly associated with the spatial smoothing kernel on rs-FC maps (Wu et al., 2011).
In fMRI analysis, spatial smoothing is an important preprocessing step to improve the signal-to-noise ratio (SNR) of the fMRI dataset and a prerequisite for the further statistical analysis using the GLM (Lindquist, 2008). The degrees of spatial smoothing on fMRI dataset have demonstrated a significant impact on task-fMRI mapping (Lu et al., 2012) and rs-fMRI mapping (Wu et al., 2011; Hsu et al., 2016). While the spatial smoothing improves SNR, it sacrifices the spatial resolution of the functional maps. The reduction in spatial resolution may be an undesirable cost for surgical planning. Generally, smoothing kernel size for presurgical fMRI mapping vary between 0 and 8 mm FWHM (Kokkonen et al., 2009; Liu et al., 2009; Lu et al., 2012; Kristo et al., 2014; Huang et al., 2016). Considering the benefit and cost of spatial smoothing, the smoothness of 4-mm FWHM is set as the default based on our experiences. Furthermore, users are able to adjust their preferred smoothness level in IClinfMRI.
In addition to spatial smoothing, inclusion/exclusion of global signal remains a controversial issue for rs-fMRI preprocessing. Previous studies of presurgical fMRI mapping have applied global signal as a nuisance regressor to reduce the spurious variance from non-neural sources and to improve the spatial specificity of the resulting functional networks, such as motor (Rosazza et al., 2014) and language network (Mitchell et al., 2013; Lee et al., 2016). However, this nuisance regression has been criticized for introducing the artificial anti-correlations in seed-based correlation analysis (Fox et al., 2009; Murphy et al., 2009). In the Resting-state fMRI module of IClinfMRI, regressing out global signal was built in as an optional preprocessing step upon user's decision.
Determining the threshold across individual mappings has been no consensus yet in the neuroimaging field because the various tasks result in different statistical sensitivity (Blatow et al., 2011; Nadkarni et al., 2015). Considering the fMRI mapping in clinical practice, the statistical threshold is determined by experienced clinicians who adjust a continuum of the threshold to obtain adequate activation extent without spurious clusters outside the eloquent cortex (Rosazza et al., 2014; Nadkarni et al., 2015). In contrast to such rater-dependent procedure, Lu et al. recently addressed an automatic procedure of threshold determination based on the training results (Lu et al., 2017). Nevertheless, no gold standard is reached for threshold determination at the current stage. Caution should be exercised when interpreting the statistical maps. In IClinfMRI, independent panels of threshold determination for both parametric and CVR maps were built for users to decide an appropriate threshold.
A limitation of IClinfMRI is that it calls functions in other free software including dcm2nii, AFNI, and SPM. Since AFNI is designed to run on Unix or Mac OS, those using a Windows operating system must install a virtual machine to run IClinfMRI.
In conclusion, by integrating fMRI techniques and implementing data conversion modules, our toolbox is a strong research tool that has been designed for translation to clinical practice. Two approaches in producing guidance maps—task-fMRI activation and the RH+MA map—were implemented for seed-based rs-fMRI mapping. By assisting in interpreting the clinical fMRI study, CVR mapping is able to provide visualization for indicating the potential false-negative areas in fMRI results. Any mapping result in the NIfTI format generated by either IClinfMRI or other research software can be exported in a DICOM format that is ready to be incorporated into PACS. IClinfMRI has been developed to incorporate advanced fMRI methods with streamlined processing and has shortened the processing time for presurgical mapping and other clinical applications. The software is freely available and can be requested by contacting the authors of this article.
Author Contributions
A-LH, PH, JJ, JH, and H-LL: contributed to the conception and design of the software; JJ, KN, SP, SF, VK, and DS: contributed to the preparation and interpretation of clinical data; A-LH, CW, J-HC, and H-LL: contributed to the preparation and revision of the manuscript. All authors reviewed and approved the manuscript.
Funding
This study was supported by the MD Anderson Diagnostic Imaging Clinical Research Committee mechanism. A-LH was supported financially by the Taiwan Ministry of Science and Technology under grant number MOST 105-2917-I-002-012.
Conflict of Interest Statement
The authors declare that the research was conducted in the absence of any commercial or financial relationships that could be construed as a potential conflict of interest.
Acknowledgments
We would like to thank MD Anderson Cancer Center's Department of Scientific Publications for providing editing assistance.
References
Ashburner, J., and Friston, K. J. (2005). Unified segmentation. Neuroimage 26, 839–851. doi: 10.1016/j.neuroimage.2005.02.018
Birn, R. M., Smith, M. A., Jones, T. B., and Bandettini, P. A. (2008). The respiration response function: the temporal dynamics of fMRI signal fluctuations related to changes in respiration. Neuroimage 40, 644–654. doi: 10.1016/j.neuroimage.2007.11.059
Biswal, B., Yetkin, F. Z., Haughton, V. M., and Hyde, J. S. (1995). Functional connectivity in the motor cortex of resting human brain using echo-planar MRI. Magn. Reson. Med. 34, 537–541. doi: 10.1002/mrm.1910340409
Bizzi, A., Blasi, V., Falini, A., Ferroli, P., Cadioli, M., Danesi, U., et al. (2008). Presurgical functional MR imaging of language and motor functions: validation with intraoperative electrocortical mapping. Radiology 248, 579–589. doi: 10.1148/radiol.2482071214
Blatow, M., Reinhardt, J., Riffel, K., Nennig, E., Wengenroth, M., and Stippich, C. (2011). Clinical functional MRI of sensorimotor cortex using passive motor and sensory stimulation at 3 Tesla. J. Magn. Reson. Imaging 34, 429–437. doi: 10.1002/jmri.22629
Bookheimer, S. (2007). Pre-surgical language mapping with functional magnetic resonance imaging. Neuropsychol. Rev. 17, 145–155. doi: 10.1007/s11065-007-9026-x
Böttger, J., Margulies, D. S., Horn, P., Thomale, U. W., Podlipsky, I., Shapira-Lichter, I., et al. (2011). A software tool for interactive exploration of intrinsic functional connectivity opens new perspectives for brain surgery. Acta Neurochir. 153, 1561–1572. doi: 10.1007/s00701-011-0985-6
Branco, P., Seixas, D., Deprez, S., Kovacs, S., Peeters, R., Castro, S. L., et al. (2016). Resting-state functional magnetic resonance imaging for language preoperative planning. Front. Hum. Neurosci. 10:11. doi: 10.3389/fnhum.2016.00011
Chang, T. Y., Kuan, W. C., Huang, K. L., Chang, C. H., Chang, Y. J., Wong, H. F., et al. (2013). Heterogeneous cerebral vasoreactivity dynamics in patients with carotid stenosis. PLoS ONE 8:e76072. doi: 10.1371/journal.pone.0076072
Chang, T. Y., Liu, H. L., Lee, T. H., Kuan, W. C., Chang, C. H., Wu, H. C., et al. (2009). Change in cerebral perfusion after carotid angioplasty with stenting is related to cerebral vasoreactivity: a study using dynamic susceptibility-weighted contrast-enhanced MR imaging and functional MR imaging with a breath-holding paradigm. Am. J. Neuroradiol. 30, 1330–1336. doi: 10.3174/ajnr.A1589
Cochereau, J., Deverdun, J., Herbet, G., Charroud, C., Boyer, A., Moritz-Gasser, S., et al. (2016). Comparison between resting state fMRI networks and responsive cortical stimulations in glioma patients. Hum. Brain Mapp. 37, 3721–3732. doi: 10.1002/hbm.23270
Cox, R. W. (1996). AFNI: software for analysis and visualization of functional magnetic resonance neuroimages. Comput. Biomed. Res. 29, 162–173. doi: 10.1006/cbmr.1996.0014
Duan, L.-S., Wang, M.-J., Sun, F., Zhao, Z.-J., Xing, M., Zang, Y.-F., et al. (2016). Characterizing the blood oxygen level-dependent fluctuations in musculoskeletal tumours using functional magnetic resonance imaging. Sci. Rep. 6:36522. doi: 10.1038/srep36522
Fox, M. D., Zhang, D., Snyder, A. Z., and Raichle, M. E. (2009). The global signal and observed anticorrelated resting state brain networks. J. Neurophysiol. 101, 3270–3283. doi: 10.1152/jn.90777.2008
Glodzik, L., Randall, C., Rusinek, H., and de Leon, M. J. (2013). Cerebrovascular reactivity to carbon dioxide in Alzheimer's disease. J. Alzheimers Dis. 35, 427–440. doi: 10.3233/JAD-122011
Harrison, R. V., Harel, N., Panesar, J., and Mount, R. J. (2002). Blood capillary distribution correlates with hemodynamic-based functional imaging in cerebral cortex. Cereb. Cortex 12, 225–233. doi: 10.1093/cercor/12.3.225
Hart, M. G., Price, S. J., and Suckling, J. (2016). Functional connectivity networks for preoperative brain mapping in neurosurgery. J. Neurosurg. 126, 1941–1950. doi: 10.3171/2016.6.JNS1662
Hsu, A. L., Chou, K. H., Chao, Y. P., Fan, H. Y., Wu, C. W., and Chen, J. H. (2016). Physiological contribution in spontaneous oscillations: an approximate quality-assurance index for resting-state fMRI signals. PLoS ONE 11:e0148393. doi: 10.1371/journal.pone.0148393
Hsu, Y. Y., Chang, C. N., Jung, S. M., Lim, K. E., Huang, J. C., Fang, S. Y., et al. (2004). Blood oxygenation level-dependent MRI of cerebral gliomas during breath holding. J. Magn. Reson. Imaging 19, 160–167. doi: 10.1002/jmri.10447
Huang, H., Ding, Z., Mao, D., Yuan, J., Zhu, F., Chen, S., et al. (2016). PreSurgMapp: a MATLAB toolbox for presurgical mapping of eloquent functional areas based on task-related and resting-state functional MRI. Neuroinformatics. 14, 421–438. doi: 10.1007/s12021-016-9304-y
Iadecola, C. (2004). Neurovascular regulation in the normal brain and in Alzheimer's disease. Nat. Rev. Neurosci. 5, 347–360. doi: 10.1038/nrn1387
Jahanian, H., Christen, T., Moseley, M. E., Pajewski, N. M., Wright, C. B., Tamura, M. K., et al. (2016). Measuring vascular reactivity with resting-state blood oxygenation level-dependent (BOLD) signal fluctuations: a potential alternative to the breath-holding challenge? J. Cereb. Blood Flow Metab. 37, 2526–2538. doi: 10.1177/0271678X16670921
Jo, H. J., Saad, Z. S., Simmons, W. K., Milbury, L. A., and Cox, R. W. (2010). Mapping sources of correlation in resting state FMRI, with artifact detection and removal. Neuroimage 52, 571–582. doi: 10.1016/j.neuroimage.2010.04.246
Kastrup, A., Krüger, G., Neumann-Haefelin, T., and Moseley, M. E. (2001). Assessment of cerebrovascular reactivity with functional magnetic resonance imaging: comparison of CO(2) and breath holding. Magn. Reson. Imaging 19, 13–20. doi: 10.1016/S0730-725X(01)00227-2
Kokkonen, S. M., Nikkinen, J., Remes, J., Kantola, J., Starck, T., Haapea, M., et al. (2009). Preoperative localization of the sensorimotor area using independent component analysis of resting-state fMRI. Magn. Reson. Imaging 27, 733–740. doi: 10.1016/j.mri.2008.11.002
Kristo, G., Rutten, G. J., Raemaekers, M., de Gelder, B., Rombouts, S. A., and Ramsey, N. F. (2014). Task and task-free FMRI reproducibility comparison for motor network identification. Hum. Brain Mapp. 35, 340–352. doi: 10.1002/hbm.22180
Lang, S., Duncan, N., and Northoff, G. (2014). Resting-state functional magnetic resonance imaging: review of neurosurgical applications. Neurosurgery 74, 453–464. discussion: 464–465. doi: 10.1227/NEU.0000000000000307
Lee, M. H., Miller-Thomas, M. M., Benzinger, T. L., Marcus, D. S., Hacker, C. D., Leuthardt, E. C., et al. (2016). Clinical resting-state fMRI in the preoperative setting: are we ready for prime time? Top. Magn. Reson. Imaging 25, 11–18. doi: 10.1097/RMR.0000000000000075
Lee, M. H., Smyser, C. D., and Shimony, J. S. (2013). Resting-state fMRI: a review of methods and clinical applications. Am. J. Neuroradiol. 34, 1866–1872. doi: 10.3174/ajnr.A3263
Lindquist, M. A. (2008). The statistical analysis of fMRI data. Statist. Sci. 23, 439–464. doi: 10.1214/09-STS282
Liu, H., Buckner, R. L., Talukdar, T., Tanaka, N., Madsen, J. R., and Stufflebeam, S. M. (2009). Task-free presurgical mapping using functional magnetic resonance imaging intrinsic activity. J. Neurosurg. 111, 746–754. doi: 10.3171/2008.10.JNS08846
Liu, H. L., Huang, J. U., Wu, C. T., and Hsu, Y. Y. (2002). Detectability of blood oxygenation level-dependent signal changes during short breath hold duration. Magn. Reson. Imaging 20, 643–648. doi: 10.1016/S0730-725X(02)00595-7
Lu, J. F., Zhang, H., Wu, J. S., Yao, C. J., Zhuang, D. X., Qiu, T. M., et al. (2012). “Awake” intraoperative functional MRI (ai-fMRI) for mapping the eloquent cortex: Is it possible in awake craniotomy? Neuroimage Clin 2, 132–142. doi: 10.1016/j.nicl.2012.12.002
Lu, J., Zhang, H., Hameed, N. U. F., Zhang, J., Yuan, S., Qiu, T., et al. (2017). An automated method for identifying an independent component analysis-based language-related resting-state network in brain tumor subjects for surgical planning. Sci. Rep. 7:13769. doi: 10.1038/s41598-017-14248-5
Matthews, P. M., and Hampshire, A. (2016). Clinical concepts emerging from fMRI functional connectomics. Neuron 91, 511–528. doi: 10.1016/j.neuron.2016.07.031
Matthews, P. M., Honey, G. D., and Bullmore, E. T. (2006). Applications of fMRI in translational medicine and clinical practice. Nat. Rev. Neurosci. 7, 732–744. doi: 10.1038/nrn1929
Mikulis, D. J., Krolczyk, G., Desal, H., Logan, W., Deveber, G., Dirks, P., et al. (2005). Preoperative and postoperative mapping of cerebrovascular reactivity in moyamoya disease by using blood oxygen level-dependent magnetic resonance imaging. J. Neurosurg. 103, 347–355. doi: 10.3171/jns.2005.103.2.0347
Mitchell, T. J., Hacker, C. D., Breshears, J. D., Szrama, N. P., Sharma, M., Bundy, D. T., et al. (2013). A novel data-driven approach to preoperative mapping of functional cortex using resting-state functional magnetic resonance imaging. Neurosurgery 73, 969–982. discussion: 982–983. doi: 10.1227/NEU.0000000000000141
Mueller, S., Wang, D., Fox, M. D., Yeo, B. T., Sepulcre, J., Sabuncu, M. R., et al. (2013). Individual variability in functional connectivity architecture of the human brain. Neuron 77, 586–595. doi: 10.1016/j.neuron.2012.12.028
Murphy, K., Birn, R. M., Handwerker, D. A., Jones, T. B., and Bandettini, P. A. (2009). The impact of global signal regression on resting state correlations: are anti-correlated networks introduced? Neuroimage 44, 893–905. doi: 10.1016/j.neuroimage.2008.09.036
Nadkarni, T. N., Andreoli, M. J., Nair, V. A., Yin, P., Young, B. M., Kundu, B., et al. (2015). Usage of fMRI for pre-surgical planning in brain tumor and vascular lesion patients: task and statistical threshold effects on language lateralization. Neuroimage Clin. 7, 415–423. doi: 10.1016/j.nicl.2014.12.014
Pak, R. W., Hadjiabadi, D. H., Senarathna, J., Agarwal, S., Thakor, N. V., Pillai, J. J., et al. (2017). Implications of neurovascular uncoupling in functional magnetic resonance imaging (fMRI) of brain tumors. J. Cereb. Blood Flow Metab. 37, 3475–3487. doi: 10.1177/0271678X17707398
Pillai, J. J., and Mikulis, D. J. (2015). Cerebrovascular reactivity mapping: an evolving standard for clinical functional imaging. Am. J. Neuroradiol. 36, 7–13. doi: 10.3174/ajnr.A3941
Pillai, J. J., and Zacà, D. (2011). Clinical utility of cerebrovascular reactivity mapping in patients with low grade gliomas. World J. Clin. Oncol. 2, 397–403. doi: 10.5306/wjco.v2.i12.397
Pillai, J. J., and Zacà, D. (2012). Comparison of BOLD cerebrovascular reactivity mapping and DSC MR perfusion imaging for prediction of neurovascular uncoupling potential in brain tumors. Technol. Cancer Res. Treat. 11, 361–374. doi: 10.7785/tcrt.2012.500284
Pujol, J., Conesa, G., Deus, J., López-Obarrio, L., Isamat, F., and Capdevila, A. (1998). Clinical application of functional magnetic resonance imaging in presurgical identification of the central sulcus. J. Neurosurg. 88, 863–869. doi: 10.3171/jns.1998.88.5.0863
Quigley, M., Cordes, D., Wendt, G., Turski, P., Moritz, C., Haughton, V., et al. (2001). Effect of focal and nonfocal cerebral lesions on functional connectivity studied with MR imaging. AJNR Am. J. Neuroradiol. 22, 294–300.
Rosazza, C., Aquino, D., D'Incerti, L., Cordella, R., Andronache, A., Zacà, D., et al. (2014). Preoperative mapping of the sensorimotor cortex: comparative assessment of task-based and resting-state FMRI. PLoS ONE 9:e98860. doi: 10.1371/journal.pone.0098860
Roy, C. S., and Sherrington, C. S. (1890). On the regulation of the blood-supply of the Brain. J. Physiol. 11, 85.17–158.17. doi: 10.1113/jphysiol.1890.sp000321
Saad, Z. S., Glen, D. R., Chen, G., Beauchamp, M. S., Desai, R., and Cox, R. W. (2009). A new method for improving functional-to-structural MRI alignment using local Pearson correlation. Neuroimage 44, 839–848. doi: 10.1016/j.neuroimage.2008.09.037
Sair, H. I., Yahyavi-Firouz-Abadi, N., Calhoun, V. D., Airan, R. D., Agarwal, S., Intrapiromkul, J., et al. (2016). Presurgical brain mapping of the language network in patients with brain tumors using resting-state fMRI: comparison with task fMRI. Hum. Brain Mapp. 37, 913–923. doi: 10.1002/hbm.23075
Sanai, N., Mirzadeh, Z., and Berger, M. S. (2008). Functional outcome after language mapping for glioma resection. N. Engl. J. Med. 358, 18–27. doi: 10.1056/NEJMoa067819
Shattuck, D. W., Mirza, M., Adisetiyo, V., Hojatkashani, C., Salamon, G., Narr, K. L., et al. (2008). Construction of a 3D probabilistic atlas of human cortical structures. Neuroimage 39, 1064–1080. doi: 10.1016/j.neuroimage.2007.09.031
Shimony, J. S., Zhang, D., Johnston, J. M., Fox, M. D., Roy, A., and Leuthardt, E. C. (2009). Resting-state spontaneous fluctuations in brain activity: a new paradigm for presurgical planning using fMRI. Acad. Radiol. 16, 578–583. doi: 10.1016/j.acra.2009.02.001
Smith, S. M., Fox, P. T., Miller, K. L., Glahn, D. C., Fox, P. M., Mackay, C. E., et al. (2009). Correspondence of the brain's functional architecture during activation and rest. Proc. Natl. Acad. Sci. U.S.A. 106, 13040–13045. doi: 10.1073/pnas.0905267106
Smith, S. M., Jenkinson, M., Woolrich, M. W., Beckmann, C. F., Behrens, T. E., Johansen-Berg, H., et al. (2004). Advances in functional and structural MR image analysis and implementation as FSL. Neuroimage 23(Suppl. 1), S208–S219. doi: 10.1016/j.neuroimage.2004.07.051
Taylor, P. A., and Saad, Z. S. (2013). FATCAT: (an efficient) functional and tractographic connectivity analysis toolbox. Brain Connect. 3, 523–535. doi: 10.1089/brain.2013.0154
Ulmer, J. L., Hacein-Bey, L., Mathews, V. P., Mueller, W. M., DeYoe, E. A., Prost, R. W., et al. (2004). Lesion-induced pseudo-dominance at functional magnetic resonance imaging: implications for preoperative assessments. Neurosurgery 55, 569–579. discussion: 580–581. doi: 10.1227/01.NEU.0000134384.94749.B2
Ulmer, J. L., Krouwer, H. G., Mueller, W. M., Ugurel, M. S., Kocak, M., and Mark, L. P. (2003). Pseudo-reorganization of language cortical function at fMR imaging: a consequence of tumor-induced neurovascular uncoupling. Am. J. Neuroradiol. 24, 213–217.
Vlieger, E. J., Majoie, C. B., Leenstra, S., and Den Heeten, G. J. (2004). Functional magnetic resonance imaging for neurosurgical planning in neurooncology. Eur. Radiol. 14, 1143–1153. doi: 10.1007/s00330-004-2328-y
Weng, H. H., Noll, K. R., Johnson, J. M., Prabhu, S. S., Tsai, Y. H., Chang, S. W., et al. (2017). Accuracy of presurgical functional MR imaging for language mapping of brain tumors: a systematic review and meta-analysis. Radiology 286, 512–523. doi: 10.1148/radiol.2017162971
Wu, C. W., Chen, C. L., Liu, P. Y., Chao, Y. P., Biswal, B. B., and Lin, C. P. (2011). Empirical evaluations of slice-timing, smoothing, and normalization effects in seed-based, resting-state functional magnetic resonance imaging analyses. Brain Connect. 1, 401–410. doi: 10.1089/brain.2011.0018
Yan, F. X., Wu, C. W., Cheng, S. Y., Lim, K. E., Hsu, Y. Y., and Liu, H.-L. (2013). Resting-state functional magnetic resonance imaging analysis with seed definition constrained by regional homogeneity. Brain Connect. 3, 438–449. doi: 10.1089/brain.2013.0164
Yarkoni, T., Poldrack, R. A., Nichols, T. E., Van Essen, D. C., and Wager, T. D. (2011). Large-scale automated synthesis of human functional neuroimaging data. Nat. Methods 8, 665–670. doi: 10.1038/nmeth.1635
Zang, Y., Jiang, T., Lu, Y., He, Y., and Tian, L. (2004). Regional homogeneity approach to fMRI data analysis. Neuroimage 22, 394–400. doi: 10.1016/j.neuroimage.2003.12.030
Zhang, D., Johnston, J. M., Fox, M. D., Leuthardt, E. C., Grubb, R. L., Chicoine, M. R., et al. (2009). Preoperative sensorimotor mapping in brain tumor patients using spontaneous fluctuations in neuronal activity imaged with functional magnetic resonance imaging: initial experience. Neurosurgery 65, 226–236. doi: 10.1227/01.NEU.0000350868.95634.CA
Keywords: functional magnetic resonance imaging (fMRI), presurgical mapping, preoperative mapping, resting state, cerebrovascular reactivity, software, interactive, visualization
Citation: Hsu A-L, Hou P, Johnson JM, Wu CW, Noll KR, Prabhu SS, Ferguson SD, Kumar VA, Schomer DF, Hazle JD, Chen J-H and Liu H-L (2018) IClinfMRI Software for Integrating Functional MRI Techniques in Presurgical Mapping and Clinical Studies. Front. Neuroinform. 12:11. doi: 10.3389/fninf.2018.00011
Received: 16 November 2017; Accepted: 23 February 2018;
Published: 09 March 2018.
Edited by:
Xi-Nian Zuo, Institute of Psychology (CAS), ChinaReviewed by:
Han Zhang, University of North Carolina at Chapel Hill, United StatesChristine Cong Guo, QIMR Berghofer Medical Research Institute, Australia
Copyright © 2018 Hsu, Hou, Johnson, Wu, Noll, Prabhu, Ferguson, Kumar, Schomer, Hazle, Chen and Liu. This is an open-access article distributed under the terms of the Creative Commons Attribution License (CC BY). The use, distribution or reproduction in other forums is permitted, provided the original author(s) and the copyright owner are credited and that the original publication in this journal is cited, in accordance with accepted academic practice. No use, distribution or reproduction is permitted which does not comply with these terms.
*Correspondence: Jyh-Horng Chen, amhjaGVuQG50dS5lZHUudHc=
Ho-Ling Liu, aGxhbGl1QG1kYW5kZXJzb24ub3Jn