 Alexandra Badea1,2,3*†
 Wenlin Wu4†
 Jordan Shuff5
 Michele Wang6
 Robert J. Anderson1Yi Qi1
 G. Allan Johnson1Joan G. Wilson2
 Serge Koudoro7Eleftherios Garyfallidis7Carol A. Colton2‡
 David B. Dunson8‡
- 1Department of Radiology, Duke University, Durham, NC, United States
- 2Department of Neurology, Duke University School of Medicine, Durham, NC, United States
- 3Brain Imaging and Analysis Center, Duke University, Durham, NC, United States
- 4Pratt School of Engineering, Duke University, Durham, NC, United States
- 5Department of Biomedical Engineering, University of Delaware, Newark, NJ, United States
- 6Department of Psychology and Neuroscience, Trinity College of Arts & Sciences, Duke University, Durham, NC, United States
- 7School of Informatics, Computing, and Engineering, Indiana University Bloomington, Bloomington, IN, United States
- 8Department of Statistical Science, Trinity College of Arts & Sciences, Duke University, Durham, NC, United States
The major genetic risk for late onset Alzheimer’s disease has been associated with the presence of APOE4 alleles. However, the impact of different APOE alleles on the brain aging trajectory, and how they interact with the brain local environment in a sex specific manner is not entirely clear. We sought to identify vulnerable brain circuits in novel mouse models with homozygous targeted replacement of the mouse ApoE gene with either human APOE3 or APOE4 gene alleles. These genes are expressed in mice that also model the human immune response to age and disease-associated challenges by expressing the human NOS2 gene in place of the mouse mNos2 gene. These mice had impaired learning and memory when assessed with the Morris water maze (MWM) and novel object recognition (NOR) tests. Ex vivo MRI-DTI analyses revealed global and local atrophy, and areas of reduced fractional anisotropy (FA). Using tensor network principal component analyses for structural connectomes, we inferred the pairwise connections which best separate APOE4 from APOE3 carriers. These involved primarily interhemispheric connections among regions of olfactory areas, the hippocampus, and the cerebellum. Our results also suggest that pairwise connections may be subdivided and clustered spatially to reveal local changes on a finer scale. These analyses revealed not just genotype, but also sex specific differences. Identifying vulnerable networks may provide targets for interventions, and a means to stratify patients.
Introduction
The multifactorial nature of Alzheimer’s disease AD has led to multiple hypotheses for disease onset and progression (Devanand et al., 2007), yet its etiology is not known. While pathological biomarkers have been well defined, cross-disciplinary approaches are critical to integrate knowledge on the spatiotemporal evolution of AD. Additionally, sensitive tools that permit early detection and monitoring changes are critical to enable useful interventions. Analyses of Aβ plaques and tau tangles are considered to provide the “classical” biomarkers of AD. But Aβ plaques and tau tangles are accompanied by neuronal dystrophy and loss (Serrano-Pozo et al., 2011). For the small percentage of individuals with the mutated forms of these proteins, the onset and progression of these biomarkers are clearly dependent on the genetic mutations. However, most individuals afflicted with AD have a late onset form of AD (LOAD). There is a long asymptomatic period that often precedes the overt phases, and during this time other processes besides those centered directly on Aβ plaque formation may be activated to cause neurodegenerative diseases. These processes may involve microglia, astrocytes, and the vasculature (De Strooper and Karran, 2016). In particular, for LOAD, there is a pressing need to better understand the role of non-classical risk factors in AD including age, sex, and genes, and how they interact to modulate the brain response to stressors (Sala Frigerio et al., 2019).
One of the best known genetic risk factors for LOAD is conferred by the APOE4 genotype (Schellenberg, 1995; Huynh et al., 2017). The APOE4/4 genotype is associated with a 30–55% risk of developing mild cognitive impairment (MCI) or AD by age 85, compared to a 10–15% risk for the APOE 3/3 genotype. Still, the precise cause for increased risk, or resilience conferred by the different APOE alleles, and the mechanisms mediating these relationships are poorly understood. While these risk factors may influence the brain levels of Aβ and hyperphosphorylated tau, it is likely that their underlying mechanisms contributing to AD onset, progression and overall pathology will vary. Besides being recognized as a major genetic risk for AD, the presence of APOE4 has been linked to other neurodegenerative diseases. These include age related macular degeneration, age related hearing loss, dementia with Lewy bodies and Parkinson’s disease. APOE4 provides increased susceptibility to neuromuscular conditions including diabetic neuropathy and immunodeficiency viral neuropathy (Bedlack et al., 2000; Pankratz et al., 2006). Moreover, APOE4 is as a risk factor for cardiovascular disease, and stroke (Tudorache et al., 2017; Femminella et al., 2018; Belloy et al., 2019). Due to its complex, not yet completely understood role, we have examined in this work primarily phenotypes relevant to AD.
MRI can provide such phenotypes, e.g., early regional atrophy (Jack et al., 1999), and quantitative biomarkers that can be analyzed as networks (Torok et al., 2018). This is important because network connectivity integrates microstructural effects e.g., neurodegeneration of gray and white matter, or toxicity associated with Aß presence. We hypothesize that network approaches are sensitive to subtle changes arising from the interplay of several factors. While each effect may be small, the summed effect due to individual biomarkers may be significant. Here, we will generate a framework for integrating biomarkers using multimodal approaches (Wiesmann et al., 2016), thereby allowing us to better predict their pathological significance.
To help understand the mechanisms through which APOE genes and their products differentially modulate the brain milieu and circuits to switch from healthy to pathological aging, we use novel mouse models for the APOE4 associated genetic risk. We analyze behavioral and imaging markers including structural connectomics based on high resolution diffusion weighted imaging (DWI) to help understand the underpinnings of network vulnerability in aging and AD (Fischer et al., 2015).
The animal models are homozygous targeted replacement mice, expressing instead of the mouse protein the human APOE3 and APOE4 isoforms. To model the human immune response to age and disease associated challenges these double-transgenic mice only express human NOS2 gene products. This modification enables nitric oxide (NO) production and immune activity regulated by NO to better mimic the human response. Our study includes 12 months old male and female APOE3HN (APOE3/3 + human NOS2 on a mouse Nos2–/– background), and APOE4HN (APOE3/3 + human NOS2 on a mouse Nos2–/– background). Mice were characterized with a behavioral battery for memory function, and with MRI to determine selective vulnerability using regional atrophy and DTI parameters. To these tests we added connectopathy biomarkers extracted using novel statistical approaches that map brain circuits associated with selective vulnerability or resilience conferred by APOE genotypes. While limited in sample size, our study revealed sex specific differences were also present in the networks associated with genotype differences. Our efforts will help identify potential targets for interventions, and future efforts to build models that explain the influence of APOE genotypes on age, sex, and AD associated circuit vulnerability.
Materials and Methods
Animals
Using mouse models, we sought to identify vulnerable brain circuits associated with memory dysfunction typical of pathological aging, and with the highest known genetic risk for LOAD - the presence of APOE4 genotype relative to APOE3 genotype. To better model the APOE4 associated risk in humans with AD we have used mouse models named huAPO3/HN and huAPOE4/HN. In these mice, the human NOS2 gene replaced the mouse Nos2 gene (HuNOS2+/+/mNos2–/–; abbreviated HN). More similar to humans, HuNOS2+/+/mNos2–/– mice show unique redox characteristics compared to mice expressing either mNos2, or mNos2 knockouts. To “add-in” the impact of APOE genotype on generation and expression of AD-like pathology, these novel mouse strains co-express HuAPOE3 or HuAPOE4 but on the HuNOS2 background described above. The total number of mice used was 10 APOE3HN mice (4 females, 6 males), and 14 APOE4HN mice (7 males and 7 females), aged to 12 months.
Behavior Testing
The Morris Water Maze
Mice were handled for 5 days prior to the beginning of behavioral testing for the purpose of habituation to the researchers performing the tests. Morris water maze (MWM) was conducted for 5 days, followed by a novel object recognition (NOR) test (2 days).
The MWM tests a mouse’s spatial memory and learning based on their preference for standing on solid ground, as opposed to swimming. Mice are placed in a quadrant of a pool with directional cues and are expected to find a clear platform underneath the water, on which they may stand. Because of their aversion to swimming and the consistent placement of the platform, mice are expected to learn that the platform is located in the same position relative to directional cues and locate it more and more quickly over time. We assessed learning by measuring the amount of time a mouse swam, the distance it swam in the pool, and the percent of the swim time, and swim distance in the target quadrant in which the platform is located (termed target swim time and target swim distance, respectively). The MWM apparatus was a circular pool with 122 cm diameter, and behavior was tracked using with a ceiling-mounted Logitech camera, and analyzed with the video analysis software ANY-maze (Stoelting, Wood Dale, IL, United States). Black mice were allowed to swim in transparent water and were expected to find a glass platform (similar indices of refraction do not allow for easy visibility) located in the south west (SW) quadrant of the pool. Mice were trained for 5 days undergoing four trials each day. For each trial, mice were placed in one quadrant of the maze and had to swim to a 10 cm wide circular platform submerged 1.5 centimeters below the surface of the water (not visible). Each trial consisted of placing the mouse into the water at one of four different starting positions, one in each quadrant and allowing them to swim freely for 1 min. The time needed for the mice to find the hidden platform was recorded as well as the swim path length. If they were unable to locate the platform within the allotted time, they were guided to the platform and allowed to remain there for 10 s. Probe trials were conducted on days 3 and 5, 1 h after the last training trial. During the probe trial the submerged platform was removed and mice were given 1 min to swim in the pool. The amount of time spent in the previous location of the target zone was recorded.
Novel Object Recognition
The NOR test assesses a mouse’s memory through exploration. Mice traditionally spend more time exploring novel stimuli, so when they are faced with a stimulus that is novel and one that is familiar, they are expected to remember the familiar object and spend more time exploring and engaging with the more novel object. The day before testing, mice were placed in a 40 cm square open field arena for 5 min to habituate them to the apparatus and the test room. 24 h after habituation, mice were acclimated in the test room for 1 h before beginning trials. Mice first completed an acquisition trial, in which they were placed in the apparatus with two identical objects for 5 min. After a 90 min retention period, mice were then placed in the arena again for 5 min with two dissimilar objects - one that is familiar, and one that is novel. 24 h later, the mice were placed in the arena again for 5 min with a pair of dissimilar objects - one that is the original familiar object, and one that is novel. After each trial, the mouse was returned to its cage. Between trials, the apparatus was cleaned with ethanol solution to eliminate animal clues. The amount of time spent exploring the novel object and the amount of time spent exploring both objects were measured. From this we calculated a recognition index as the time exploring novel object/(time exploring novel object + time exploring familiar object) × 100%. The location preference was similarly calculated, but for two identical objects.
Statistical analyses for behavior tasks was done in JMP (SAS, Cary, NC, United States)1. Analysis for multiple measurements acquired in the same animal over time was performed by repeated measures two-way ANOVA using linear mixed models fixed effects for genotype and time and random effects for animals. Tukey HSD was used for post hoc corrections. 2-group comparisons used a two-tailed t-test, while comparisons between three or more trials were done using a one-way ANOVA. P < 0.05 was considered significant.
Imaging
Brain specimens were imaged on a 9.4 T, 8.9 cm vertical bore Oxford magnet, with shielded coils, providing gradients up to 2000 mT/m (Resonance Research, Inc., Billerica, MA, United States), and controlled by an Agilent Direct Drive Console (Agilent Technologies, Santa Clara, CA, United States). In house made solenoid coils (13 mm diameter) were used to image brain specimens within the skull, in order to avoid tissue damage and distortions. To prepare actively stained brain specimens the animals were anesthetized to a surgical plane and perfused through the left cardiac ventricle, with outflow from the right atrium. Saline (0.9%) was used to flush out the blood, at a rate of 8 ml/min, for ∼5 min. For fixation we used a 10% solution of neutral buffered formalin phosphate containing 10% (50 mM) Gadoteridol (ProHance, Bracco Diagnostics Inc., Monroe Township, NJ, United States), at a rate of 8 ml/min for ∼5 min. Gadoteridol reduced the spin lattice relaxation time (T1) of tissue to ∼100 ms. Mouse heads were stored in 10% formalin for 12 h, then transferred to a 0.01 M solution of phosphate buffered saline (PBS) containing 0.5% (2.5 mM) Gadoteridol, at 4°C for ∼30 days to rehydrate the tissue. Extraneous tissue around the cranium was removed prior to imaging, and specimens were placed in MRI-compatible tubes, immersed in perfluoropolyether (Galden Pro, Solvay, NJ, United States) for susceptibility matching.
We used a diffusion weighted MR imaging to derive microstructural and connectivity information. Our protocol used compressed sensing DWI with an acceleration factor of 4, allowing for efficient sampling and reconstruction in a high performance computing cluster environment (Anderson et al., 2018b; Wang et al., 2018). The DWI protocol used 46 diffusion weighted acquisitions, interwoven with 5 non-diffusion-weighted scans, and the following parameters: TE 12 ms, TR 90 ms, BW 125 kHz, b ≈ 4000 s/mm2, diffusion pulse width 4 ms, separation 6 ms, amplitude 130.67 G/cm. Images were acquired over a 22 × 11 × 11 mm field of view, with a matrix 368 × 184 × 184, over 14 h, and reconstructed at 55 μm isotropic resolution.
Image and Network Analysis
Images were processed using a high-performance computing pipeline (Anderson et al., 2017, 2018a,b), to perform diffeomorphic mapping of a symmetric mouse brain atlas, containing 332 regions, based originally of the one presented in Calabrese et al. (2015). To perform these processes we employed at the core of our pipeline advanced normalization tools (Avants et al., 2008, 2011). Each brain was thus segmented in 332 regions. Regional and voxel wise analyses were conducted as in Badea et al. (2019). The Statistical Parametric Mapping SPM toolbox, version 12 (Friston et al., 1994) was used with cluster false discovery rate correction.
We have implemented code for tract based analyses2. The tracts connecting pairs of atlas regions (Anderson et al., 2018a) were used to build connectomes based on a constant solid angle (Q-Ball method) method implemented in DIPY (Garyfallidis et al., 2014). We used a relative peak ratio of 0.5, separation angle 25°, and 4 parallel compute threads. We used local tracking with 1 seed per voxel in the whole brain mask, and 0.5 step size. We saved 10% of the 3,000,000 tracks, in trk files of ∼1.5 GB, and their computations required about 20 min/brain using an iMac Pro with 3 GHz Intel Xeon W, 10 cores, with 128 GB memory. Tracts were visualized using DIPY.
Tracts from individual brains were clustered based on a Euclidian distance metric minimization (Garyfallidis et al., 2012), then registered (Garyfallidis et al., 2015, 2018) to a reference brain, before being once more clustered in the space for each specific population (APOE3HN, and APOE4HN).
We hypothesized that genotype and sex modulates network properties, and that we can identify vulnerable circuits relevant to AD. Subnetwork changes were derived using a recently proposed method (Zhang et al., 2019), called tensor network PCA or TNPCA, which is a semi-symmetric tensor generalization of PCA. In short, this works with a tensor network X∈ℝPxPxN, given by the concatenation of the adjacency matrices Ai∈ℝPxPfor i = 1, …N, where P is the number of nodes (atlas regions), and N is the number of subjects. Zhang et al. (2019) estimated a CP model for the semi-symmetric tensors (X∈ℝI1xI2…I..N) by solving:
subject to
where vk are P sized vectors, constrained to have orthogonal columns, uk are N sized vectors, and dk are CP scaling parameters. In our context uk denotes the subject mode, and the network mode.
The subject modes provides a low dimensional embedding of the connectome for each subject, and can be associated with traits (genotype/phenotypes). The weighted sum of network modes dk ° vk ° ukprovides a principal brain network which captures the most variation across the population. Thus {vk ° vk} can be seen as basis networks, uk(i) are the normalized coefficients for each subject i, and dk are the scaling factors. We are interested in how the connectome varies across levels of the trait, and for discrete cases such as the genotype, the problem can be approached using linear discriminant analysis, while for continuous cases the problem can be approached using canonical correlation. We used 15 principal components identified from TNPCA, and the projection weights from a Fisher linear discriminant to estimate the top 30 pairwise connections, discriminating amongst our groups/genotypes. These were further analyzed for differences in bundles length and fractional anisotropy (FA). The overall process is detailed in Figure 1.
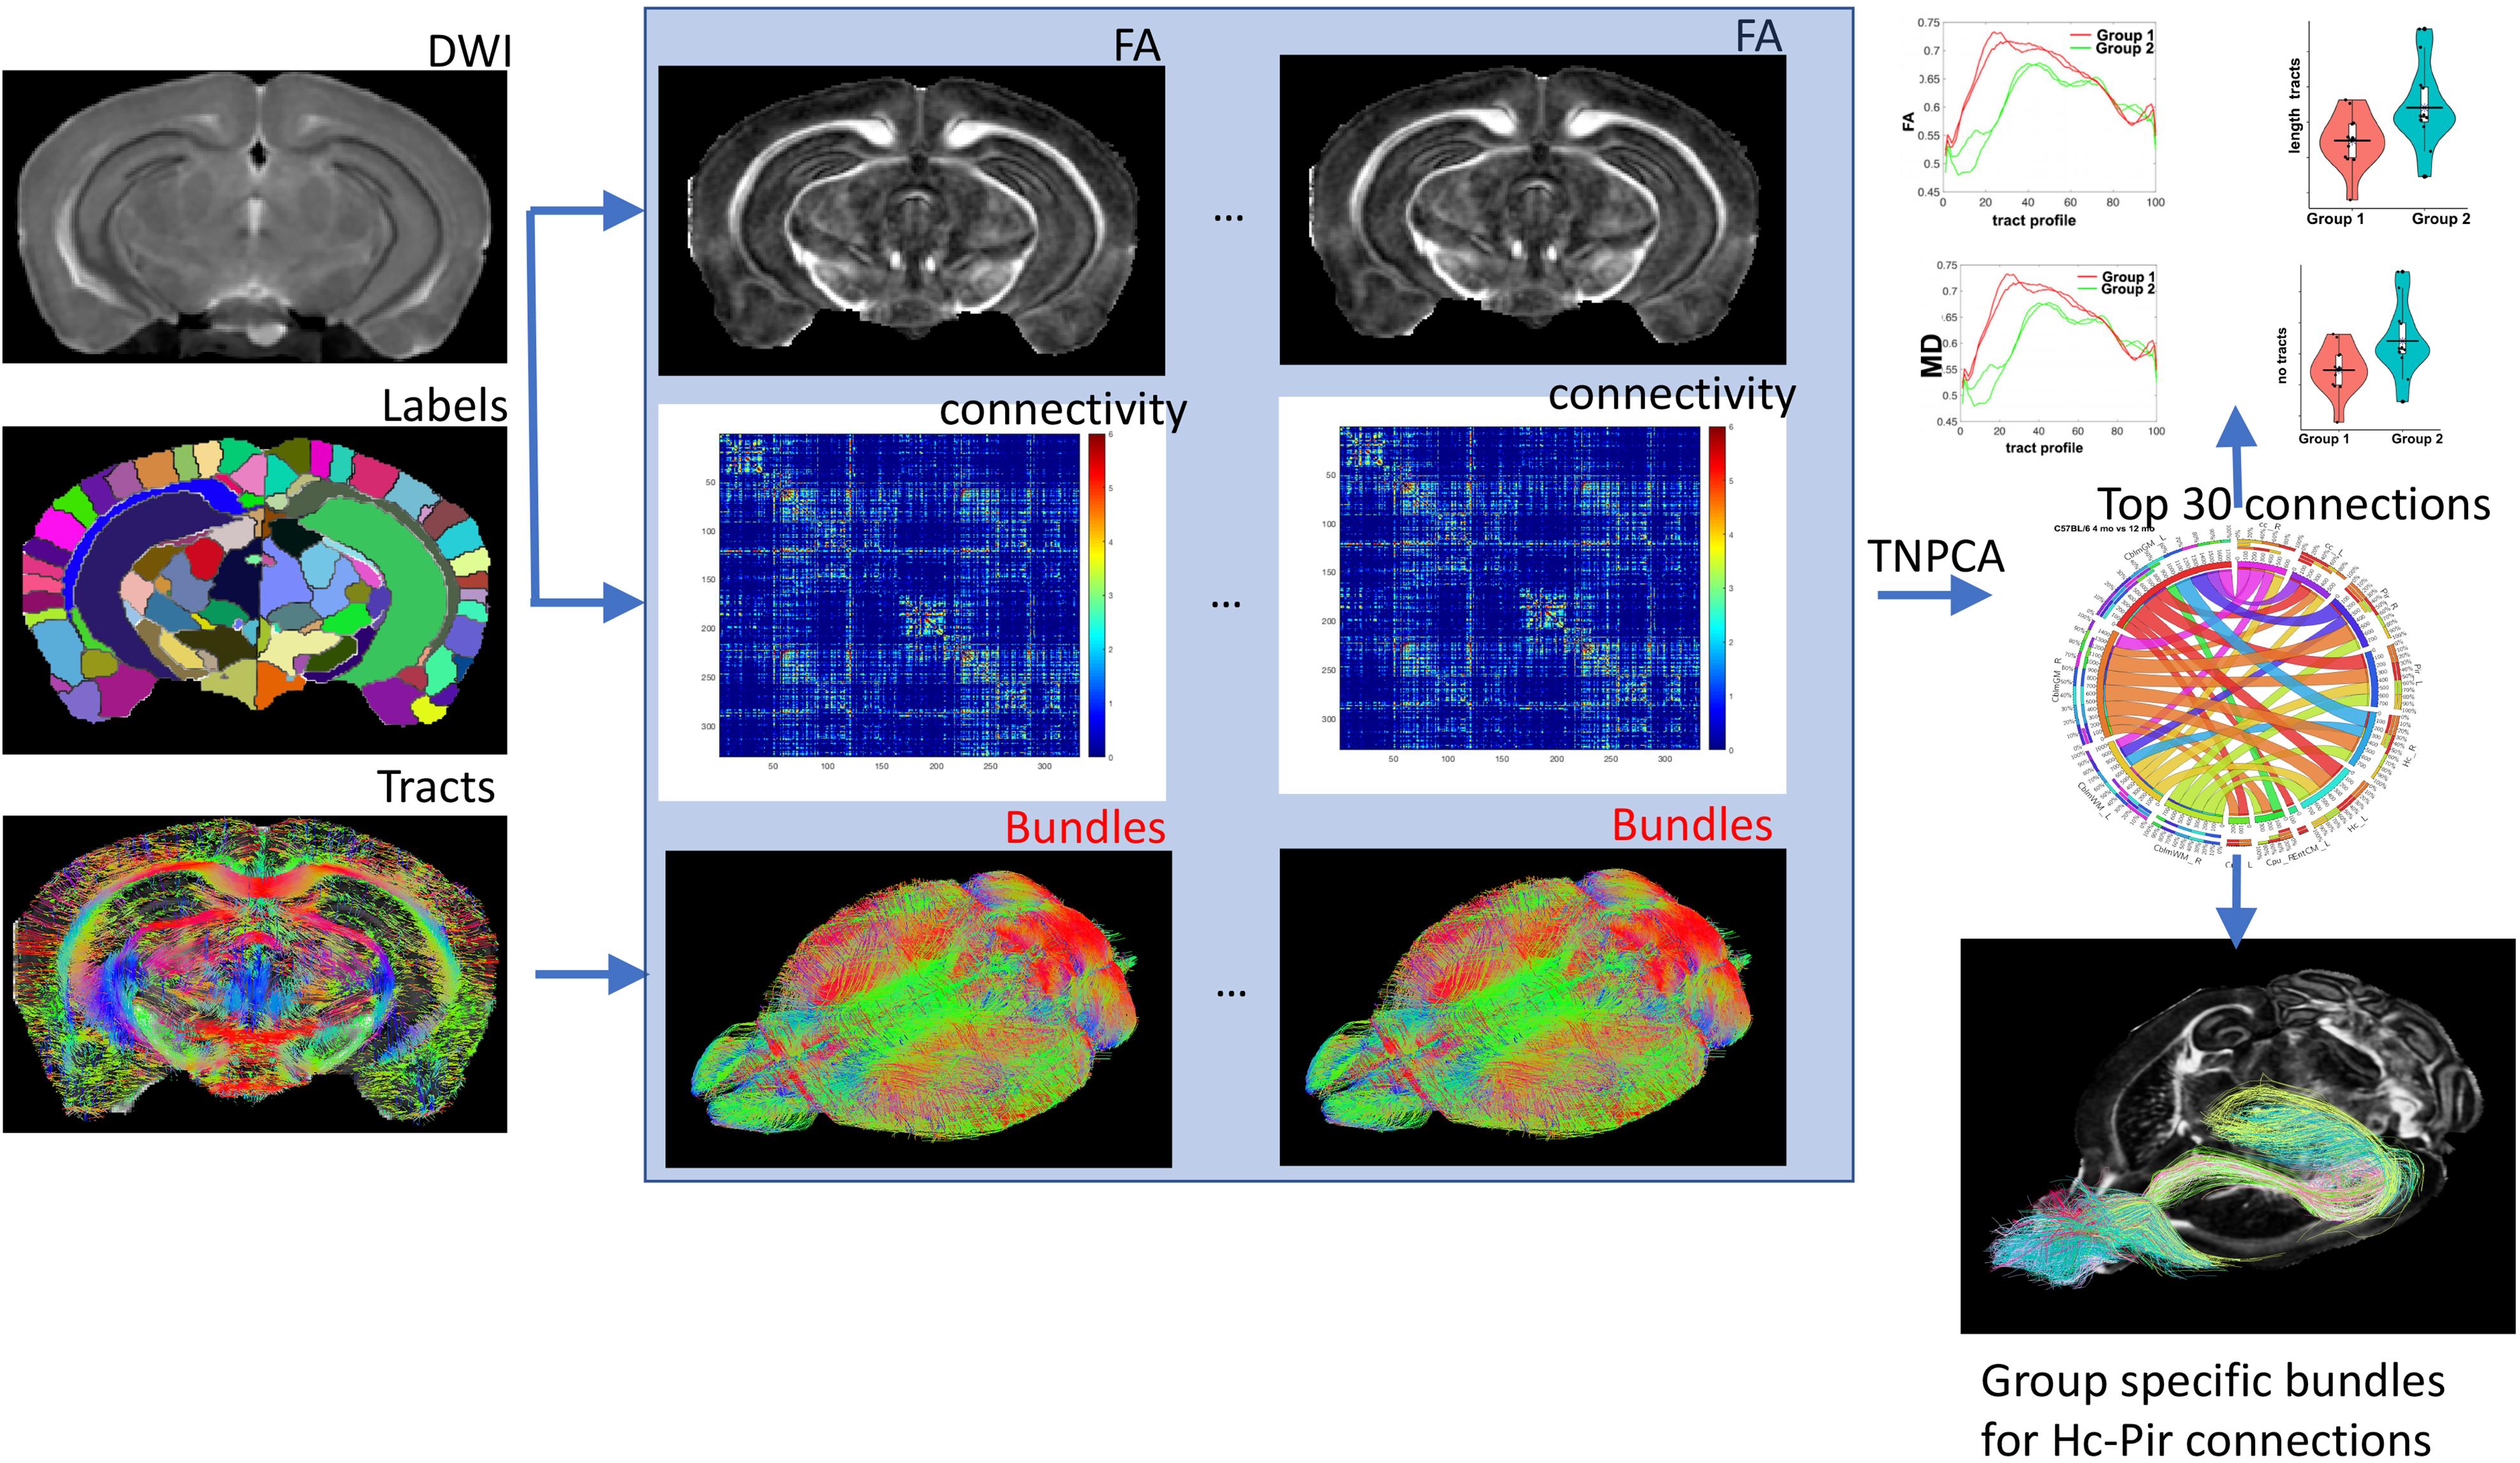
Figure 1. The main elements of our flowchart for characterizing differences between mouse models based on connectivity included image reconstructions and coregistration of individual DWI acquisitions, brain parcelation in 332 regions, and connectome reconstruction based on a constant solid angle method. TNPCA was used to derive subgraphs discriminating two genotypes and the resulting selected pairwise connections between nodes were analyzed for tract length and FA differences. The hippocampus-piriform connections are shown as an example. Hc: hippocampus; Pir: piriform cortex.
We used Quick bundles (Garyfallidis et al., 2012) for a more spatially refined analysis based spatial clustering with a distance of 2 mm, and focused on the top 6 subbundles, for comparing along the tract properties between genotypes and sexes. Bundle statistics were evaluated using R3.
Results
We have phenotyped a novel mouse model of genetic risk for LOAD using behavior, regional and voxel based MRI analyses, and network connectopathies based on a recently published dimensionality reduction method called tensor network factorization. Regional and voxel based analyses pointed to overlapping sets of regions affected by atrophy and with lower FA indicative of different microstructural properties. Our results indicated that even though qualitative differences between representative animals of the two groups were subtle, we could separate population groups by genotype based on the lower dimensional representation relying on the tensor network decomposition. Our results identified subgraphs of connected vulnerable regions, and these included areas known to be involved in memory function (e.g., hippocampus), as well as in sensory motor functions (e.g., olfactory areas, and cerebellum).
Learning and Memory Deficits
Since memory is expected to be deficient in animal models of AD, we tested both spatial and NOR memory in 14 APOE4HN and 11 APOE3HN animals (one died before being imaged). Spatial memory was examined through acquisition and probe trials in the MWM (Figures 2A,B). Swim time (and distance) to the hidden platform got shorter with time for both groups. Repeated measures ANOVA (RMANOVA) detected a significant effect of day F(4,92) = 26.1, p < 0.001 (Figure 2A), and genotype [F(1,23) = 6.3, p < 0.02], while the interaction term of day by genotype was F(4,92) = 2.0, p < 0.09. For swim distance there was a significant main effect of day F(4,83.8) = 34.4, p < 0.0001, and a significant day × genotype interaction with F(4,83.8) = 3.6, p < 0.01. Within genotypes there was a significant difference after Tukey HSD tests for swim distance for APOE3HN mice between days 1 and 2 (t = 3.5, p < 0.02); 1 and 3 (t = 6.3, p < 0.0001); 1 and 4 (t = 7.3, p < 0.0001); 1 and 5 (t = 8.5, p < 0.0001); 2 and 4 (t = 4, p < 0.006); 2 and 5 (5.2, p < 0.0001). For genotype APOE4HN these differences were significant between days 1 and 4 (t = 3.8, p < 0.01); 1 and 5 (t = 5.8, p < 0.0001); 2 and 4 (t = 3.8, p < 0.01); 2 and 5 (t = 5.7, p < 0.0001); 3 and 5 (t = 3.3, p < 0.04). No differences were noted between days 4 and 5.
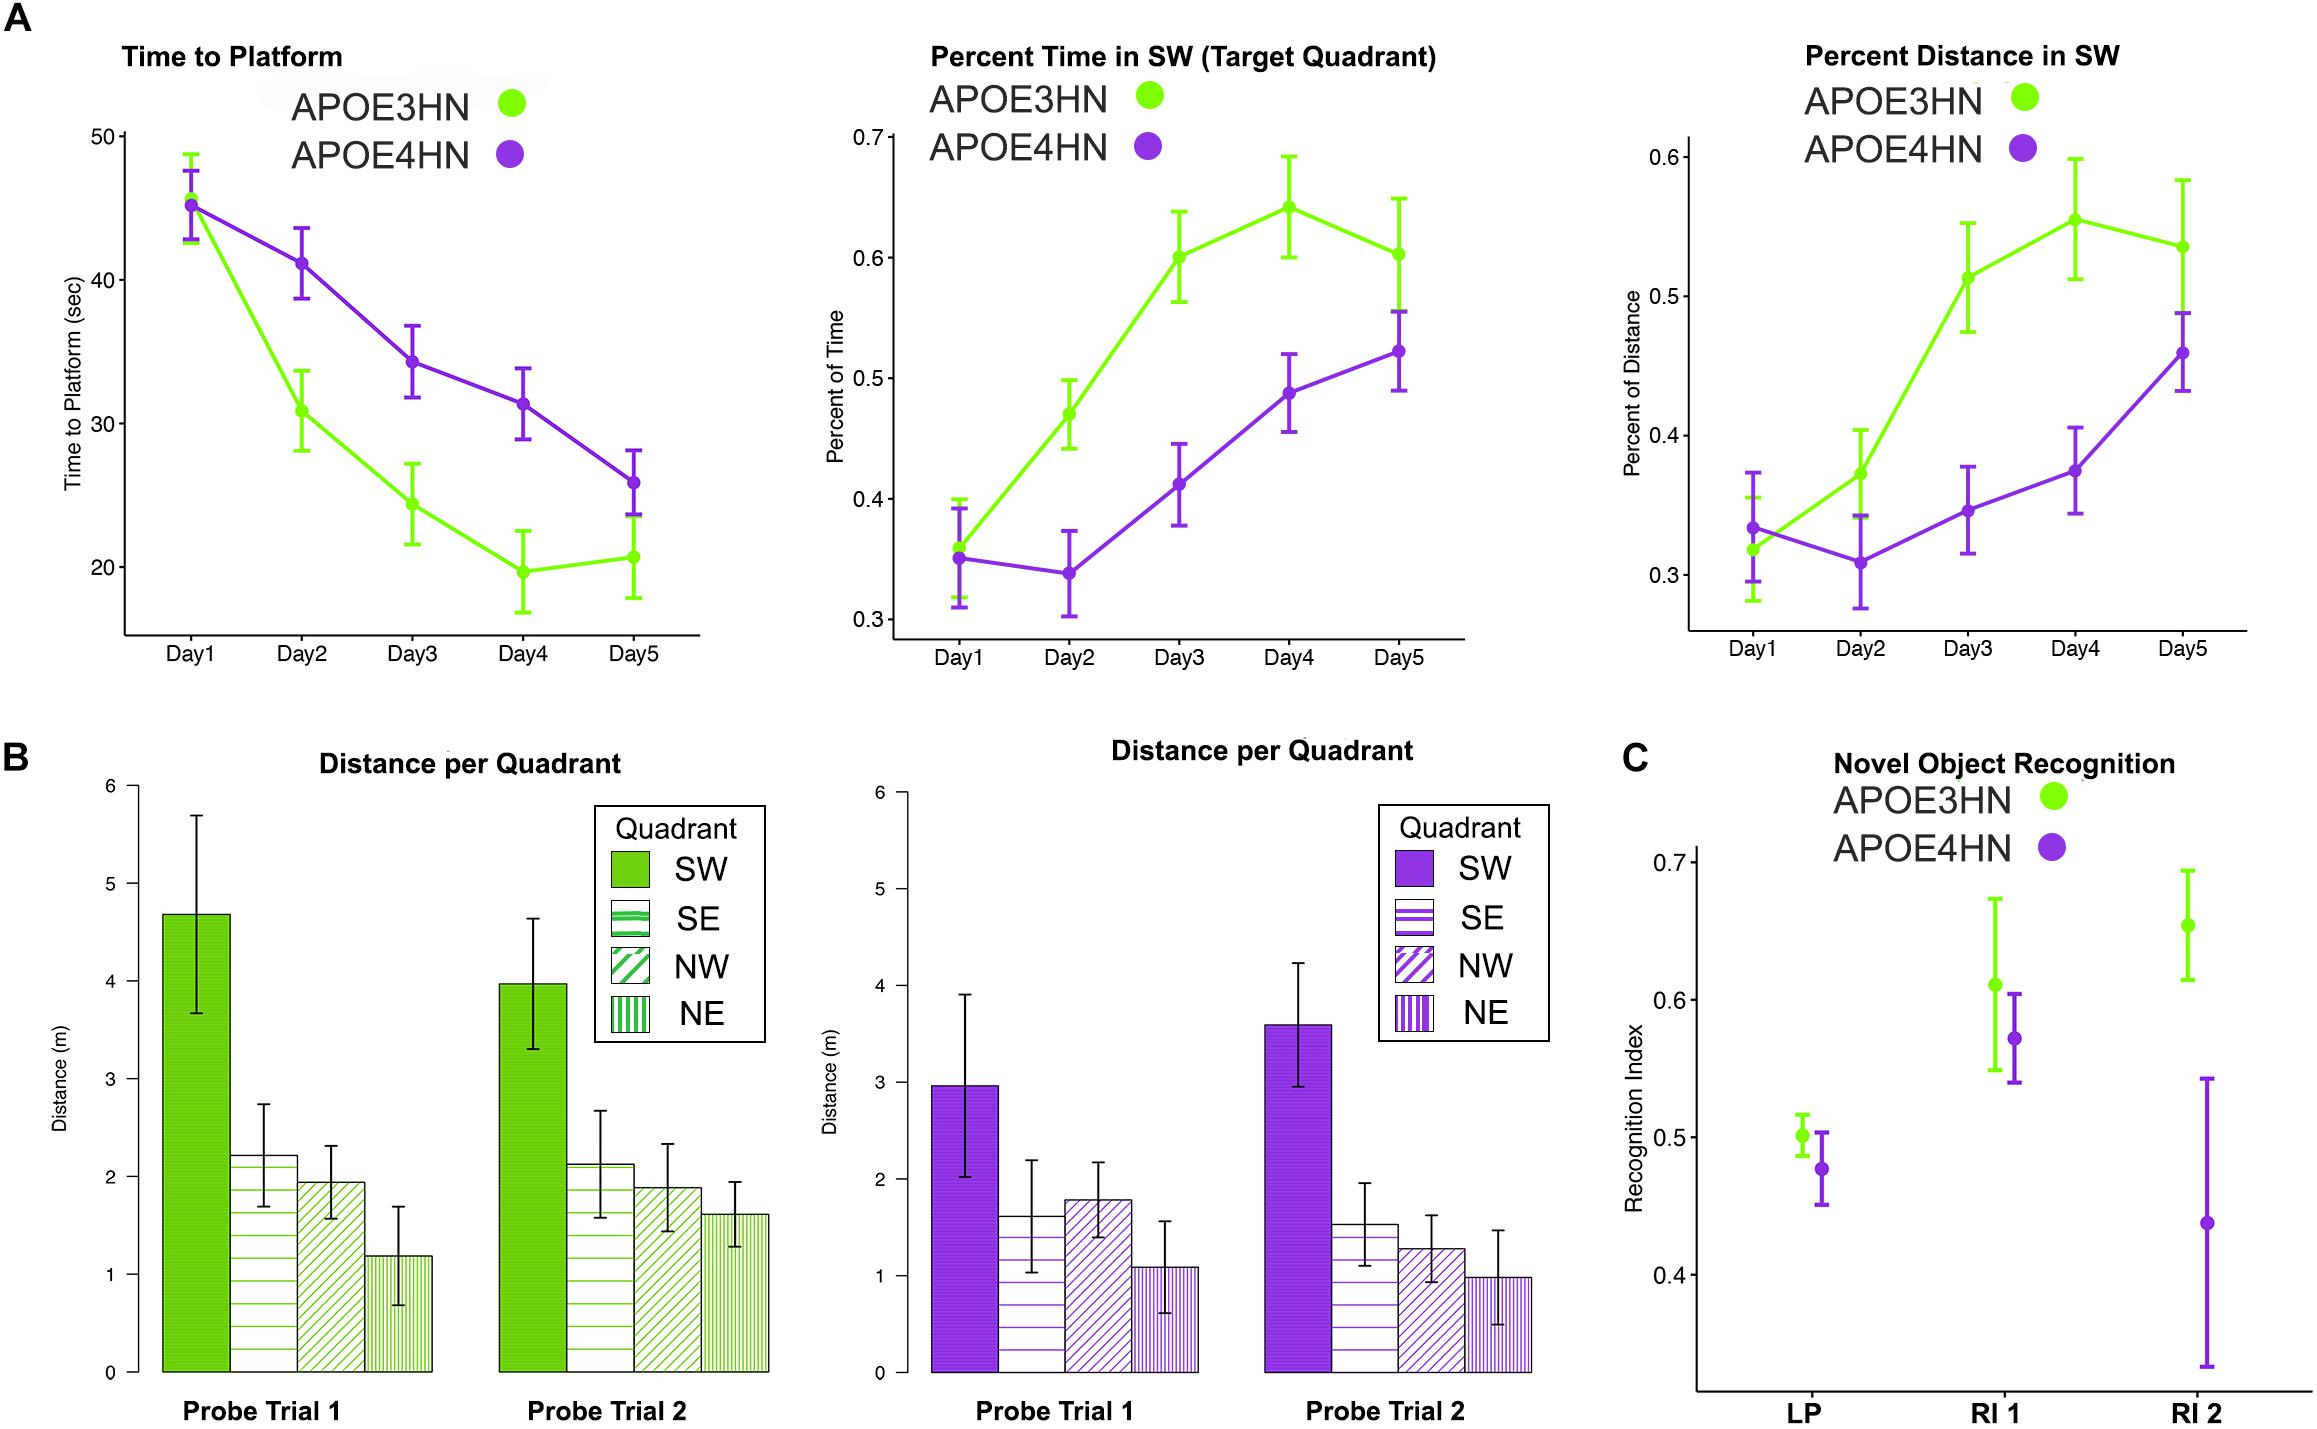
Figure 2. Main repeated measured ANOVA (RMANOVA) results for the memory testing based on acquisition performance and probe trial results (mean ± SEM) in the Morris Water Maze indicate that both APOE3HN and APOE4HN mice learn but there is a significant effect of genotype for both swim time and swim distance. As swim time and distance to hidden platform decreased, the percentage of time spent and distance swam in the target quadrant increased (A). The probe trials indicated that both genotypes had a preference for the SW target quadrant, but APOE3HN mice spent more time swimming in the SW quadrant than APOE4HN mice in the first probe trial (B). E = northeast, NW = northwest, SE = southeast, SW = southwest (target quadrant). N = 11 APOE3HN, N = 14 APOE4HN mice. (C) A novel object recognition test revealed that animals had equal location preferences (LP), and object recognition indices (RI) 90 min later, however, after 24 h APOE4HN mice had lower recognition indices relative to APOE3HN mice (t = –2.28, p = 0.04). N = 10 APOE3HN, N = 6 APOE4HN mice (some APOE4HN were not be tested to preserve the matched ages for MRI). Data show mean values, and standard error bars.
We have measured the percent time spent in the target quadrant during learning trials and found a significant effect of day [F(4,92) = 14.3, p < 0.0001] and genotype [F(1,23) = 15.8, p < 0.0006], with a possible interaction term (p < 0.1). At day 3 the difference between genotypes was largest (t = 3.5, p = 0.02). For the percent distance swam in the target quadrant during the learning trials we found a significant main effect for day [F(4,83.7) = 13.8, p < 0.0001], for genotype [F(1,21.7) = 15.7, p < 0.0007] and a significant interaction [F(4,83.7) = 3.6, p < 0.01]. The differences with genotype were significant for days 3 (t = 3.6, p < 0.02); and persisted for day 4 (t = 3.9, p < 0.008). Differences subsided by day 5.
The first probe trial was performed on the third day and indicated a significant effect of quadrant only (p < 0.0001). APOE3HN mice had a significant preference for the SW quadrant relative to the SE (t = 3.9, p = 0.006), NE (t = 5.3, p < 0.0001), NW (t = 4.1, p = 0.003), but not for SE. APOE4HN mice preferred the target SW quadrant over SE (t = 4, p = 0.004) and NE quadrants (t = 4.3, p = 0.001), but only reached a trend for NW (2.8, p = 0.1).
The first probe distance swam in the target quadrant provided a more sensitive marker for the memory deficits, showing significant genotype (p < 0.003), and quadrant effects (p < 0.0001). Genotypes had significant differences, with APOE3HN mice swimming longer in the SW than APOE4HN mice (t = 3.74, p = 0.008). APOE3HN preferred the SW relative to NE (t = 6.9, p < 0.0001), NW (t = 5.4, p < 0.0001), SE (t = 4.9, p = 0.0002). APOE4HN also preferred the SW over NE (t = 4.2, p = 0.002), and differences reached a trend relative to SE (t = 3, p = 0.07), but they made no distinction relative to NW.
The second probe swim times performed on the fifth day also showed an effect of the quadrant (p < 0.0001), but not for genotype. APOE3HN mice preferred the SW to NE (t = 3.8, p < 0.006), NW (t = 4.3, p = 0.03), SE (4.3, p = 0.06). APOE4HN mice also preferred the SW to the NE (t = 3.8, p < 0.0001), NW (t = 4.8, p < 0.002), SE (p = 3.1, p = 0.05).
The second probe swim distance showed a significant effect of quadrant (p < 0.004), and genotype (p < 0.0001). Between genotypes the swim distance in SW was not significantly different. APOE3HN mice swan longer distance in the SW relative to NE (t = 5.9, p < 0.0001), NW (t = 5.2, p = 0.0001), SE (4.6, p = 0.0004). APOE4HN mice also preferred the SW to the NE (t = 6.3, p < 0.0001), NW (t = 5.6, p < 0.0001), SE (p = 5, p = 0.0001) (Figure 2C).
During the NOR APOE4HN and APOE3HN mice showed no location preference for the sites of the two objects presented. The immediate recognition index was not different between genotypes. After 90 min, however, APOE4HN mice showed more similar preferences for the familiar and novel objects (RI = 0.44 ± 0.07 (SE), CI = [0.28. 0.60]) relative to APOE3HN mice (0.65 ± 0.06 (SE), CI = [0,53 0.78]). This indicated that APOE4HN mice did not remember the familiar object used during the acquisition trial. APOE3HN mice had a higher recognition index compared to APOE4HN mice at 24 h after the initial trial (t = 2.3, p = 0.04)].
Volume Loss
The total brain volume for APOE4HN mice was 6% smaller relative to APOE3HN controls. An ROI (region of interest) analysis for the 332 brain parcelation revealed significant atrophy occurred for regions shown in Table 1 and Figure 3.
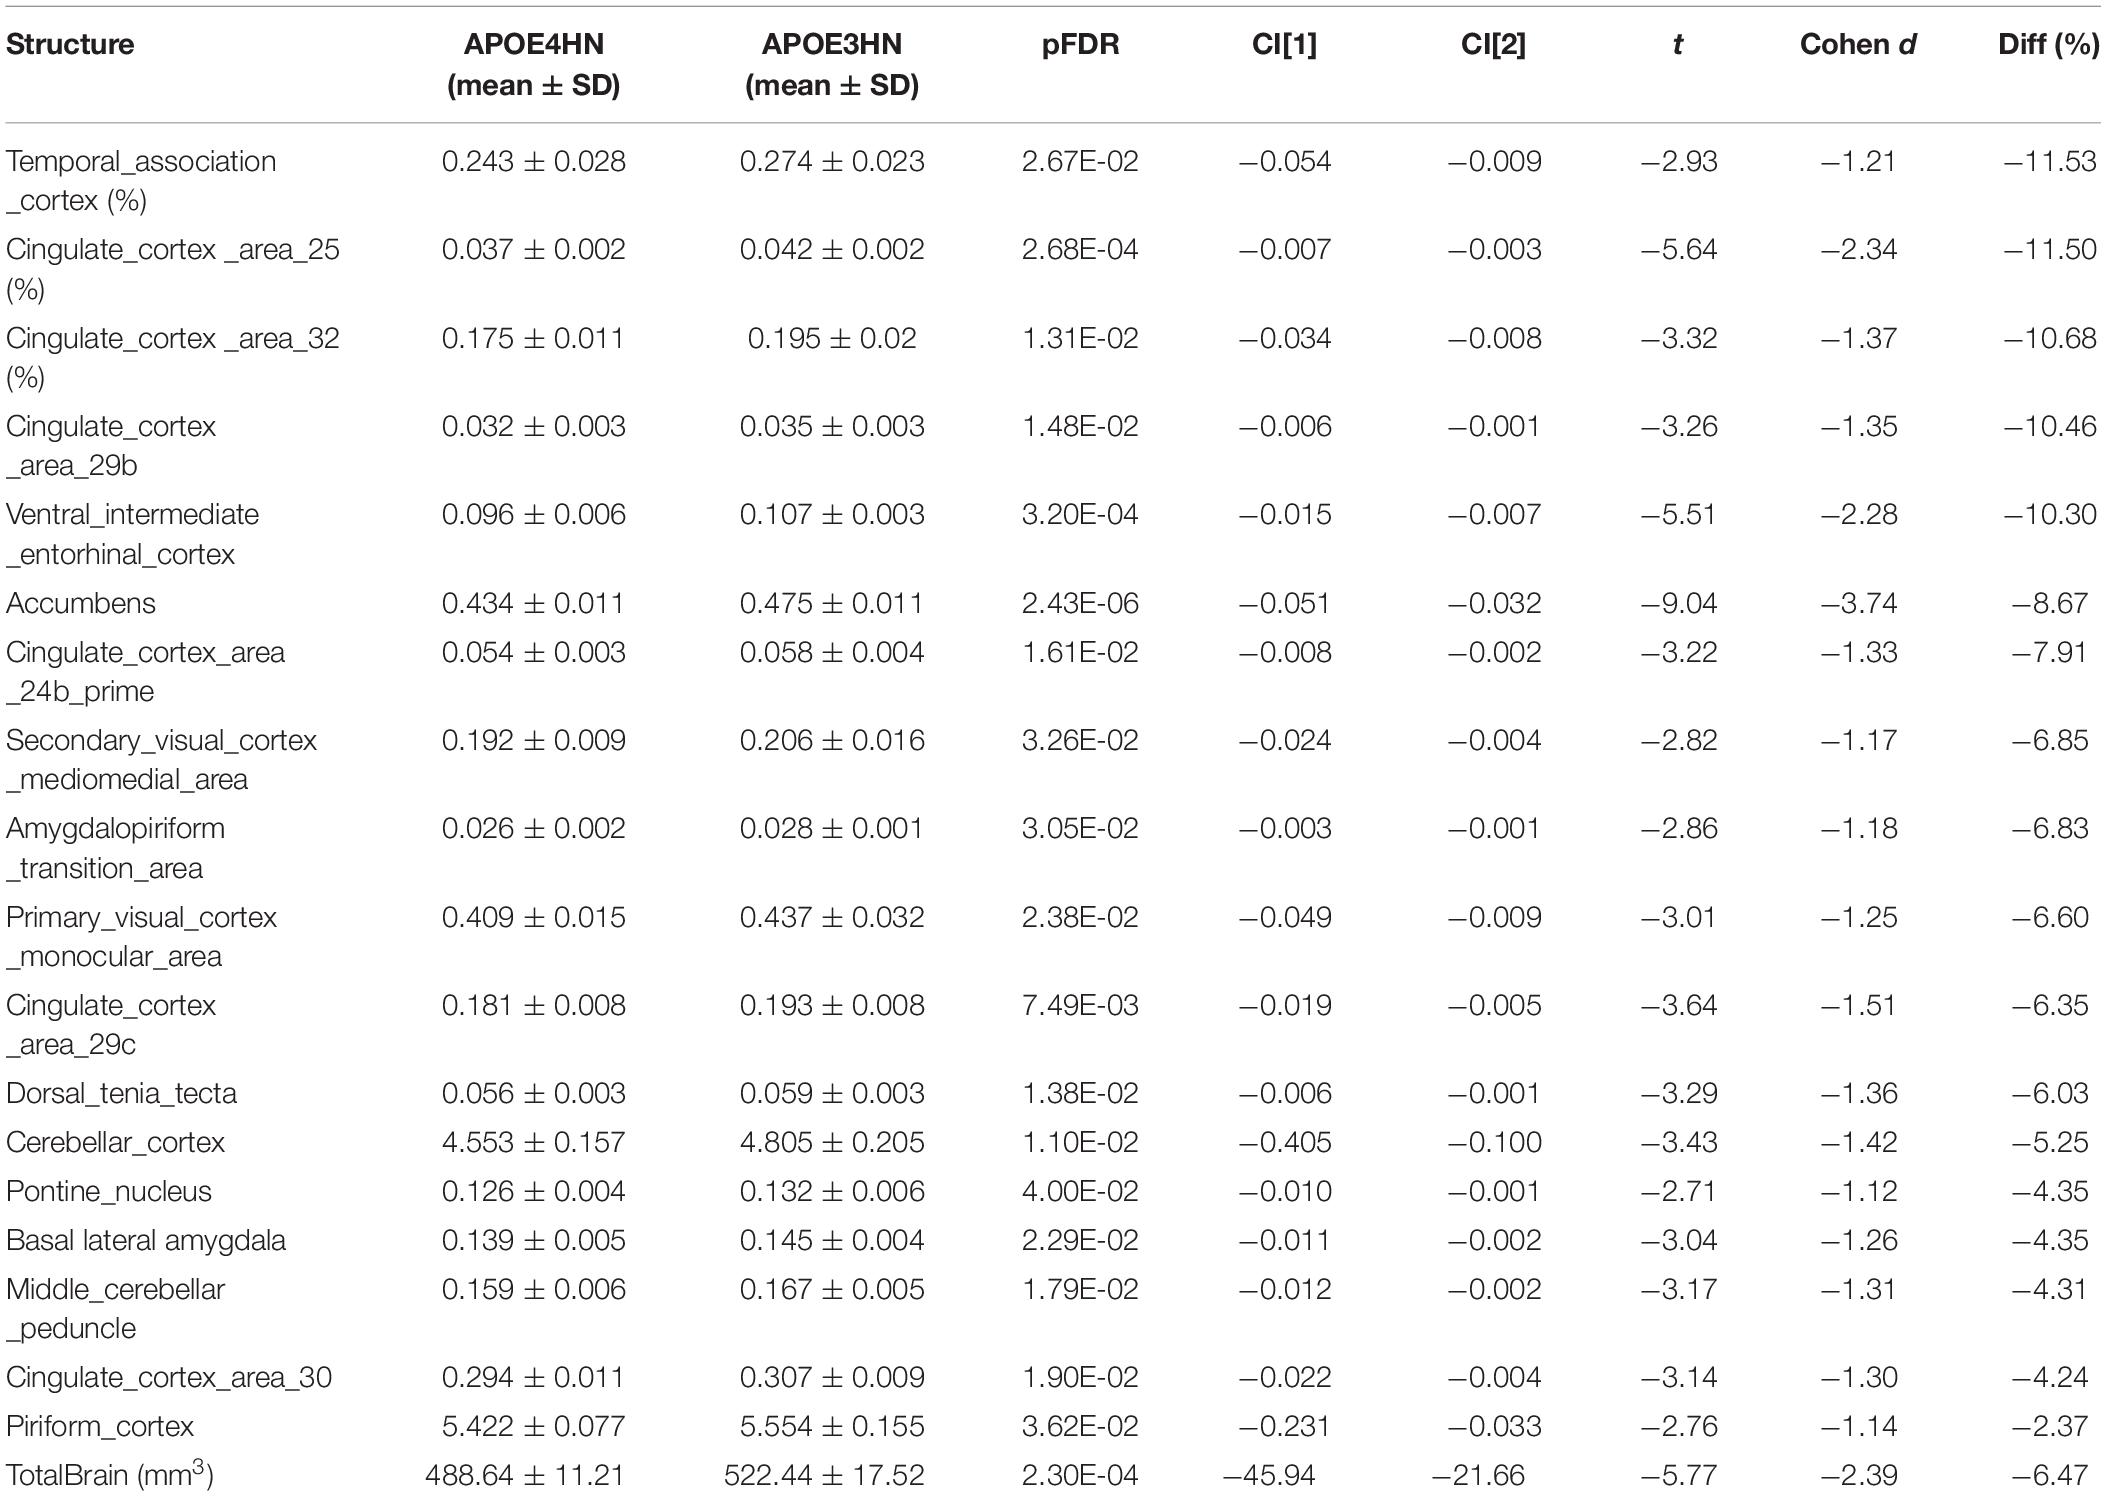
Table 1. Volume atrophy was observed at the level of the whole brain (mm3) in APOE4HN mice relative to APOE3HN mice, and in select regions (volumes are reported for one hemisphere, as % of total brain volume).
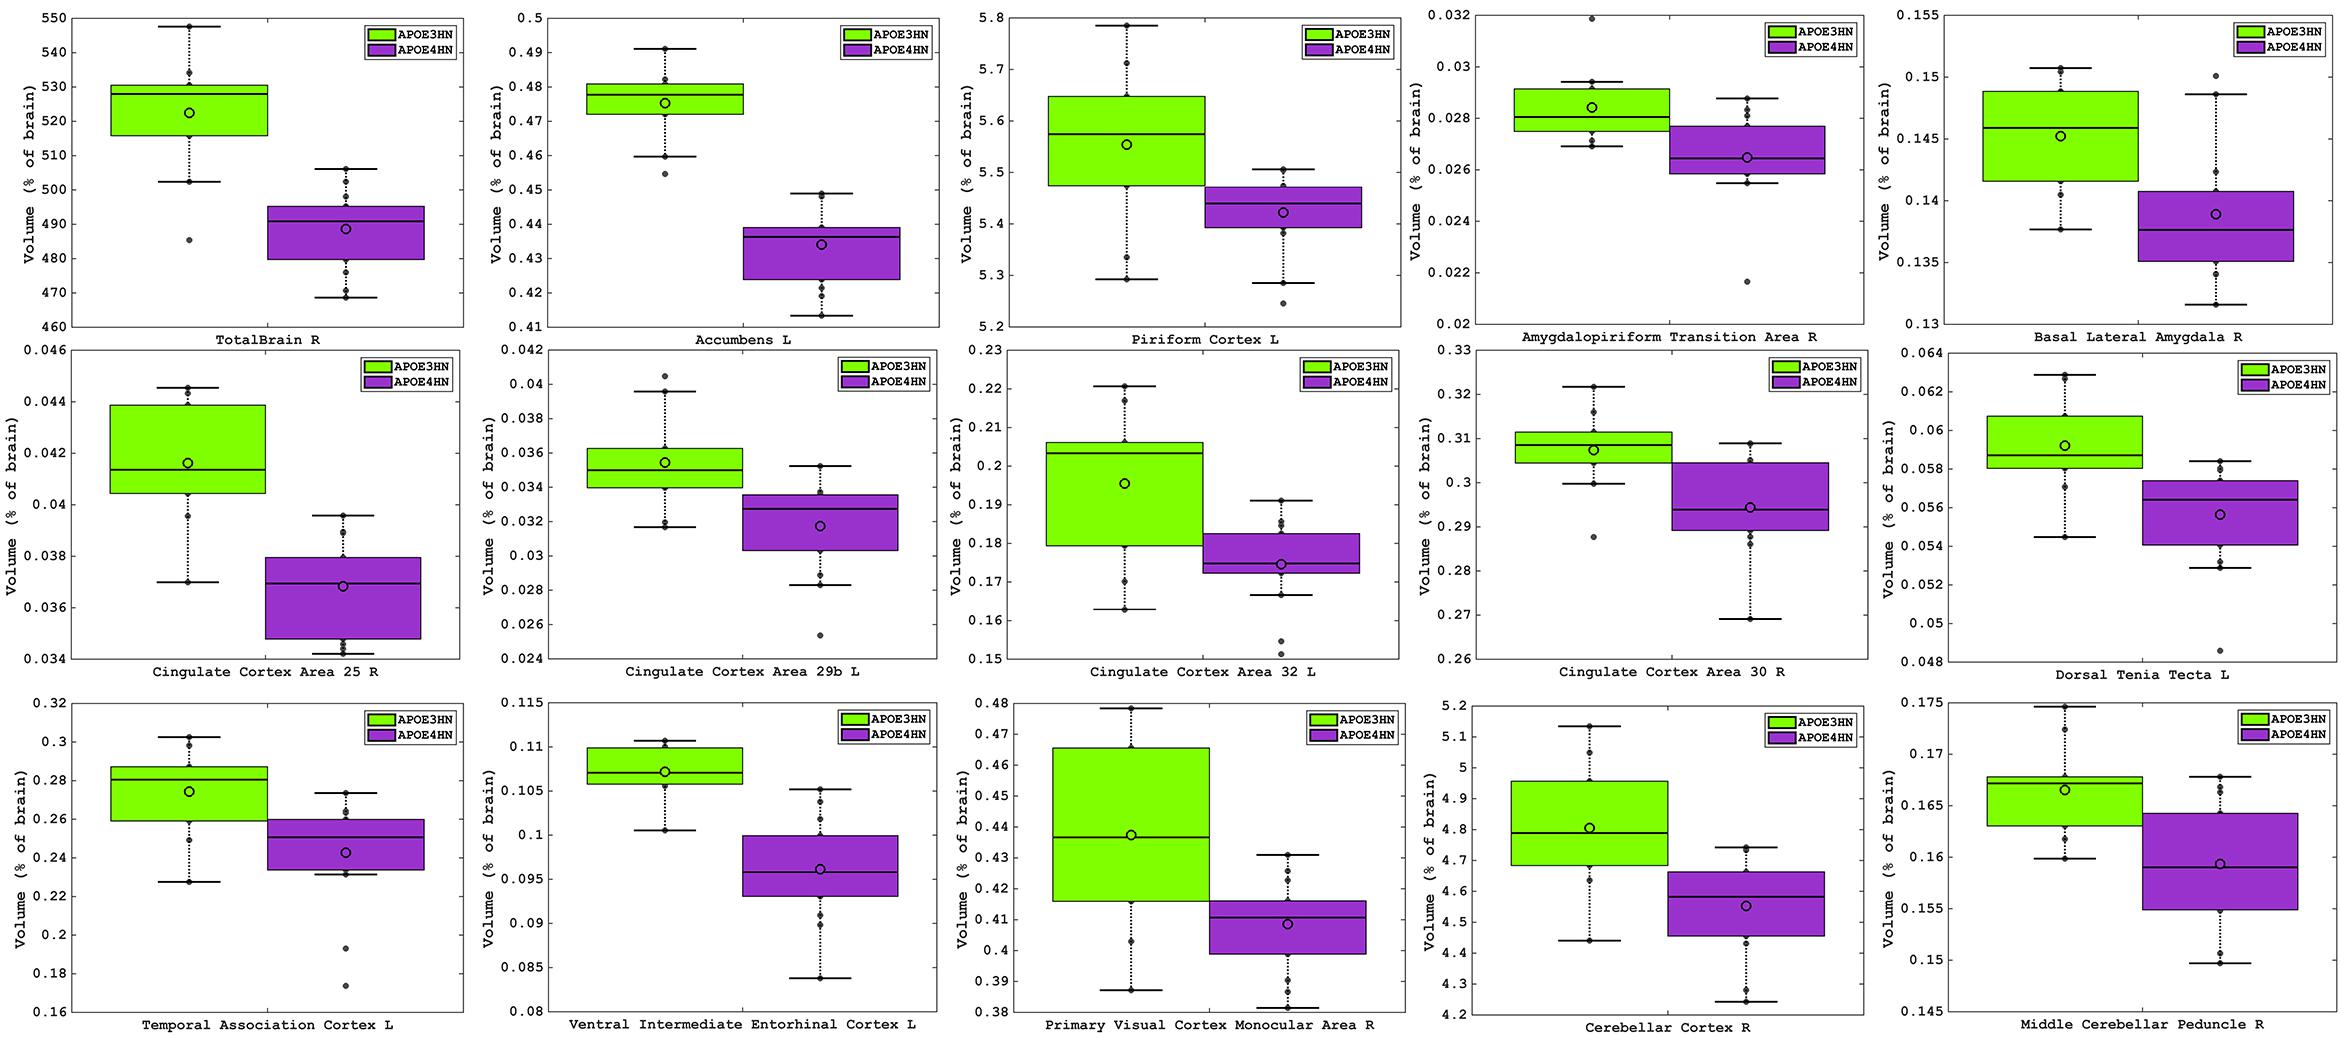
Figure 3. Volume atrophy was detected in regions spanning from the rostral to the caudal aspects of the brain, and ranged from 10% for the temporal association cortex, entorhinal and cingulate cortex, down to 2% for the piriform cortex. The visual cortex, accumbens and amygdalo-piriform transition areas were ∼7% smaller and the cerebellum was ∼5% smaller in APOE4HN mice, FDR = 5%.
The largest volume loss in APOE4HN mice relative to the APOE3HN controls was in the range of ∼10% and occurred for the cingulate cortex (areas 25, 29b, and 32), the ventral intermediate entorhinal cortex and the temporal association cortex. The accumbens, amygdalo-piriform transition area, and secondary visual cortex were 7% or smaller in APOE4HN mice relative to APOE3HN mice. Finally, the cerebellar cortex, middle cerebellar peduncle and pontine nuclei were ∼4% smaller, while the piriform cortex was 2% smaller.
Microstructural Integrity
Regional analyses for FA did not survive multiple comparison correction, but there was a trend for the medial lemniscus to have higher FA in APOE4HN carriers (p corrected = 0.1). The cerebral peduncle had a 6% lower FA in APOE4HN mice (p corrected = 0.1). Similarly, the axial diffusivity differences did not survive the multiple correction, and the longitudinal fasciculus of pons in APOE4HN mice had a 4% lower axial diffusivity (p uncorrected = 0.02), and the cerebellar white matter had 6% larger radial diffusivity (p uncorrected = 0.02).
Voxel Based Analyses
Voxel based analyses indicated significant volume (Figure 4A) and FA (Figure 4B) reductions occurred in APOE4 carriers relative to APOE3 carriers. Areas of atrophy included the olfactory cortices, hippocampus, subiculum, cingulate cortex, amygdala and entorhinal cortex, as well as the cerebellum. Sensory motor cortex areas also suffered atrophy. Areas with FA reductions were less extensive than those with volume atrophy and were noted in the olfactory/piriform and cingulate cortices, hippocampus and cerebellum.
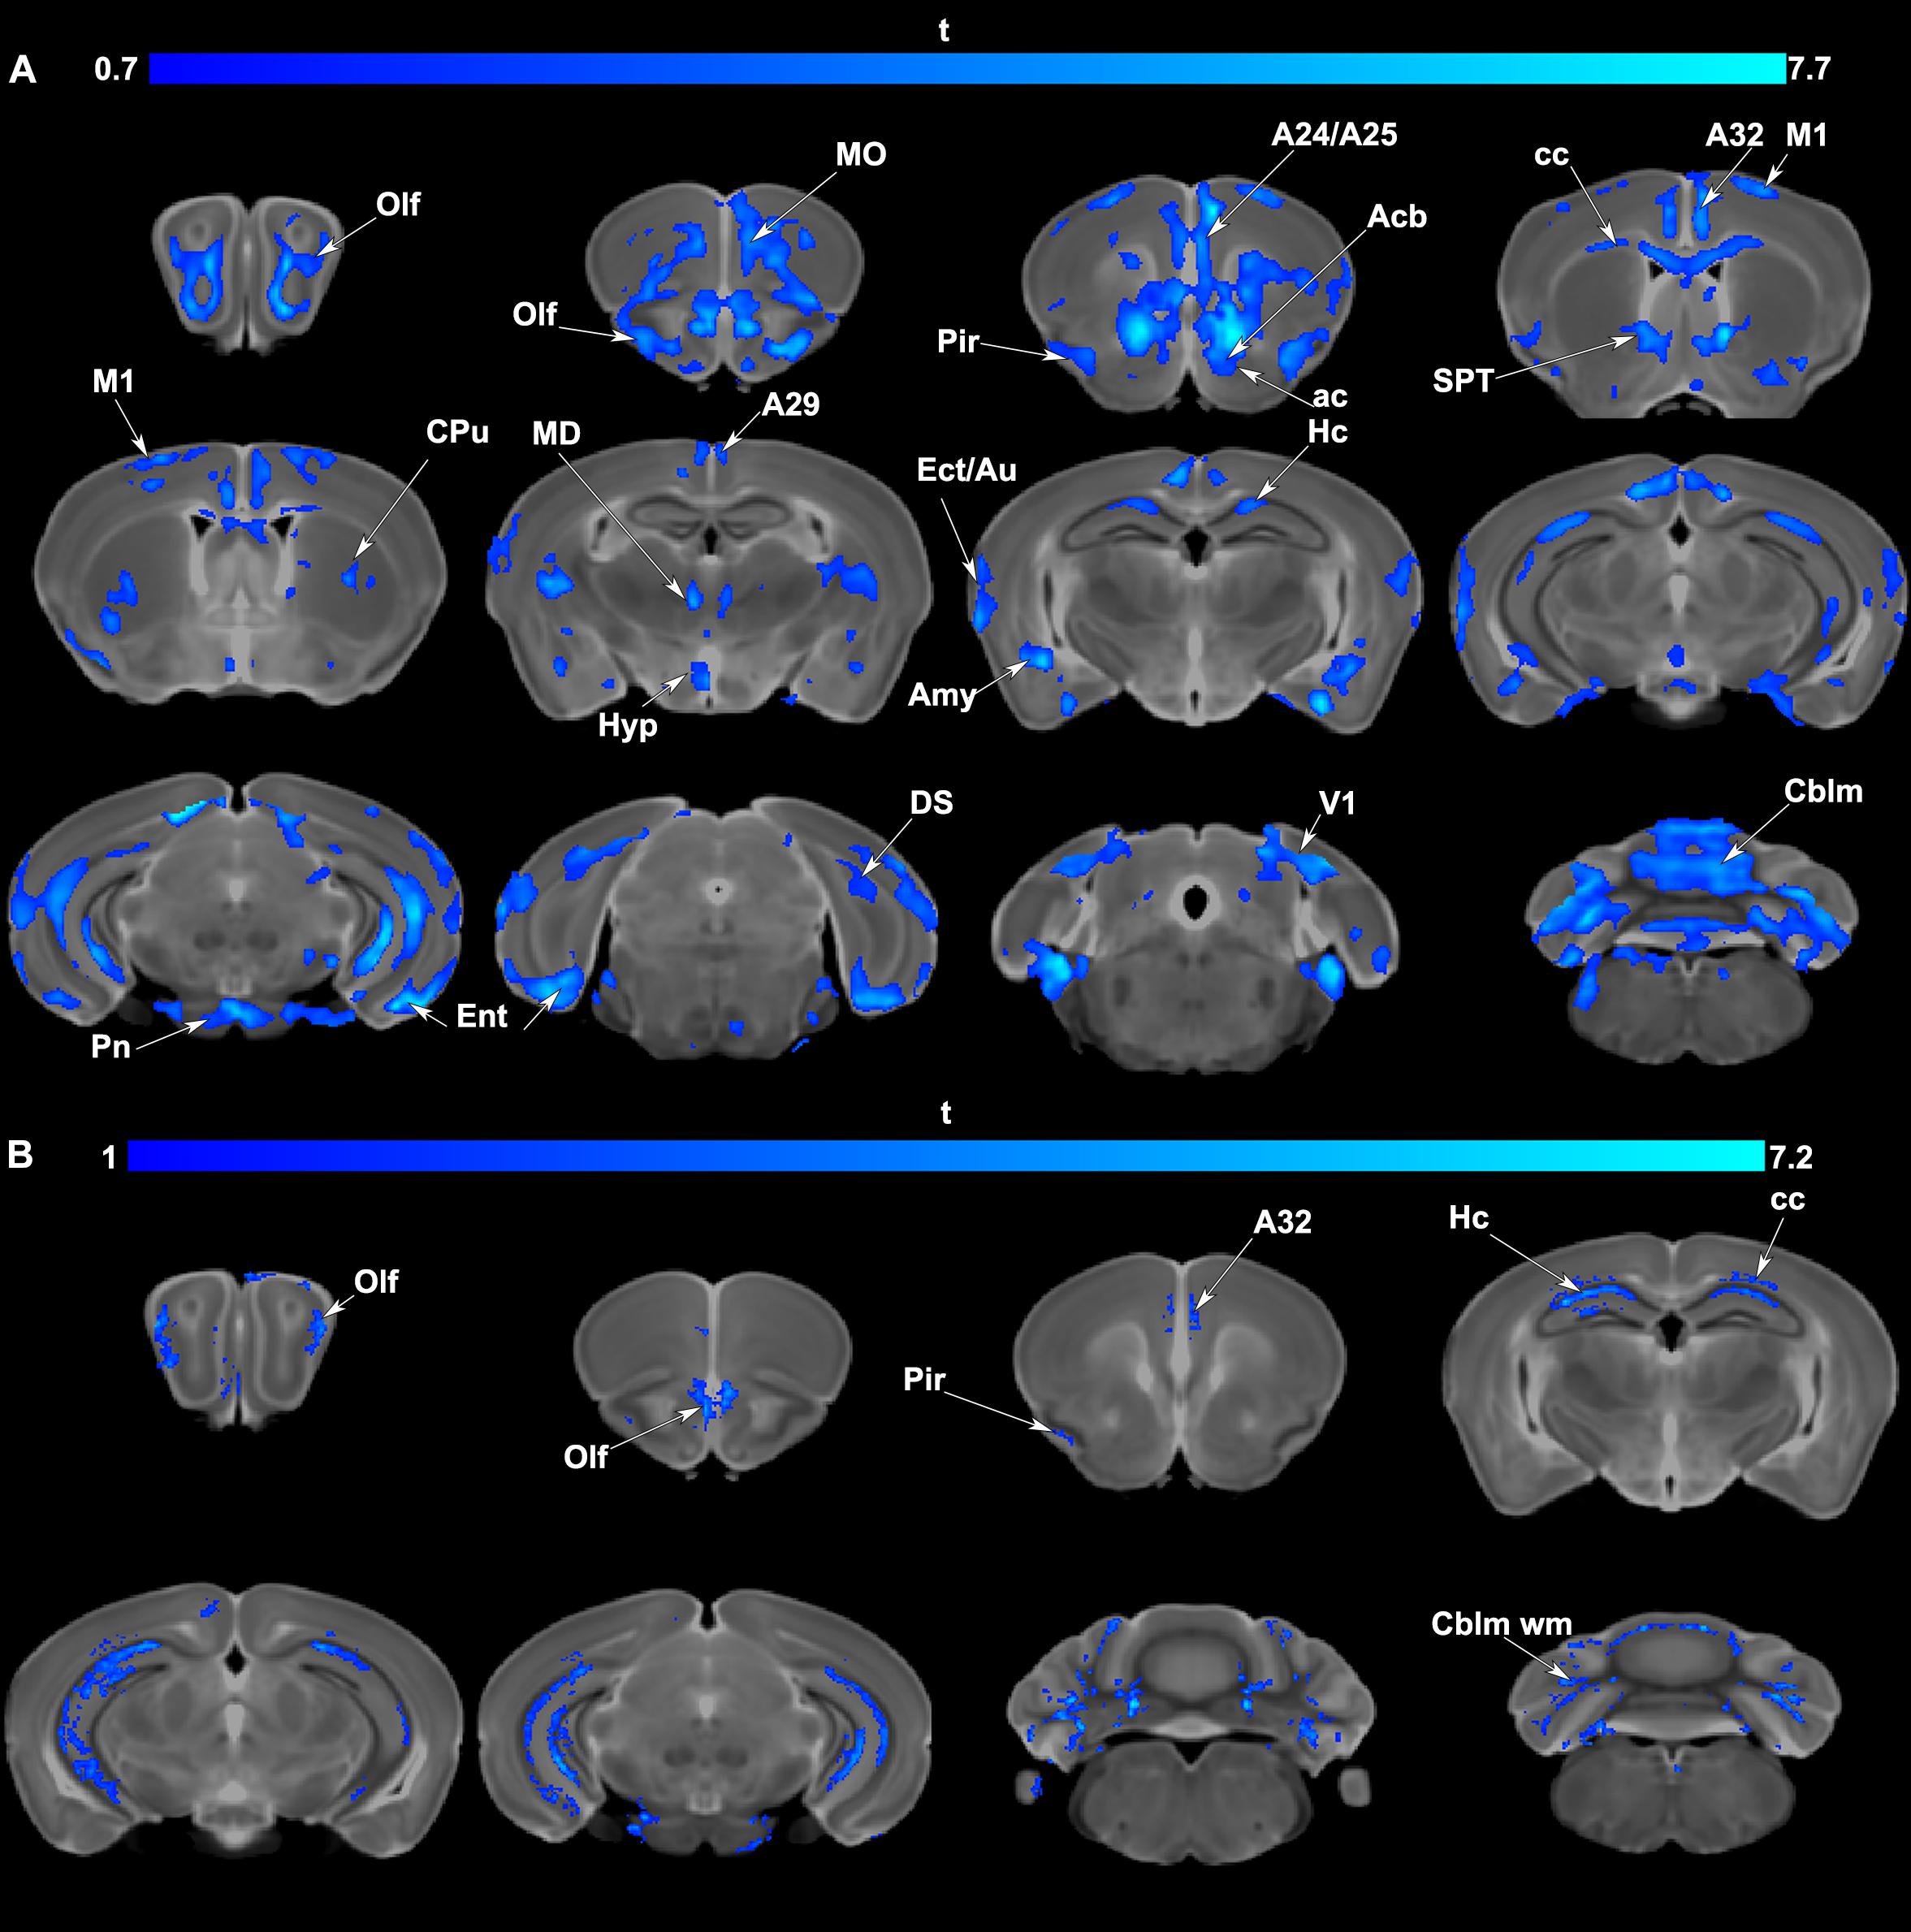
Figure 4. (A) Voxel based analyses indicated that volume atrophy occurred in vulnerable regions comprising olfactory/piriform (Olf, Pir) cingulate (A24,25,29, 32), sensory (Ect: ectorhinal, Au: auditory, V1: primary visual cortex) and motor cortex (M1), and the entorhinal cortex (Ent). Deeper gray matter regions with atrophy in APOE4 carriers included the accumbens (Acb), caudate putamen (CPu), hippocampal formation (Hc, subiculum: DS), amygdala (Amy), as well thalamic nuclei (mediodorsal: MD) and the cerebellum (Cblm) and pontine nuclei (Pn). Among white matter tracts the anterior commissure (ac), and corpus callosum (cc) also had areas of atrophy. Results are presented as t maps, FDR cluster-corrected for multiple comparisons, using an initial cluster forming threshold of 0.05 significance, and the whole brain as a mask (blue color). (B) Voxel based analyses indicative of fractional anisotropy (FA) reductions suggested vulnerable brain networks. These included the olfactory (Olf) and in particular the piriform cortex (Pir), cingulate cortex (A32), hippocampus (Hc), and the white matter of the corpus callosum (cc) and cerebellum (Cblm wm). Results are presented as t maps, FDR cluster-corrected for multiple comparisons, using initial cluster forming threshold of 0.05 significance, and the whole brain as a mask (blue color). The DWI minimum deformation average template serves as the background.
Connectopathies
The tensor network analysis revealed the top connected subnetwork (Table 2) differentiating the two genotypes. The top 30 resulting connected subnetworks included predominantly interhemispheric connections, and 7 distinct anatomical regions: the hippocampus, piriform cortex, cerebellum (white matter and gray matter), the caudate putamen/striatum, gigantoreticular nucleus and the corpus callosum. Intrahemispheric connections pointed to a role for the cerebellum. The three most frequent major structures included the piriform cortex, the hippocampus, and the cerebellum.
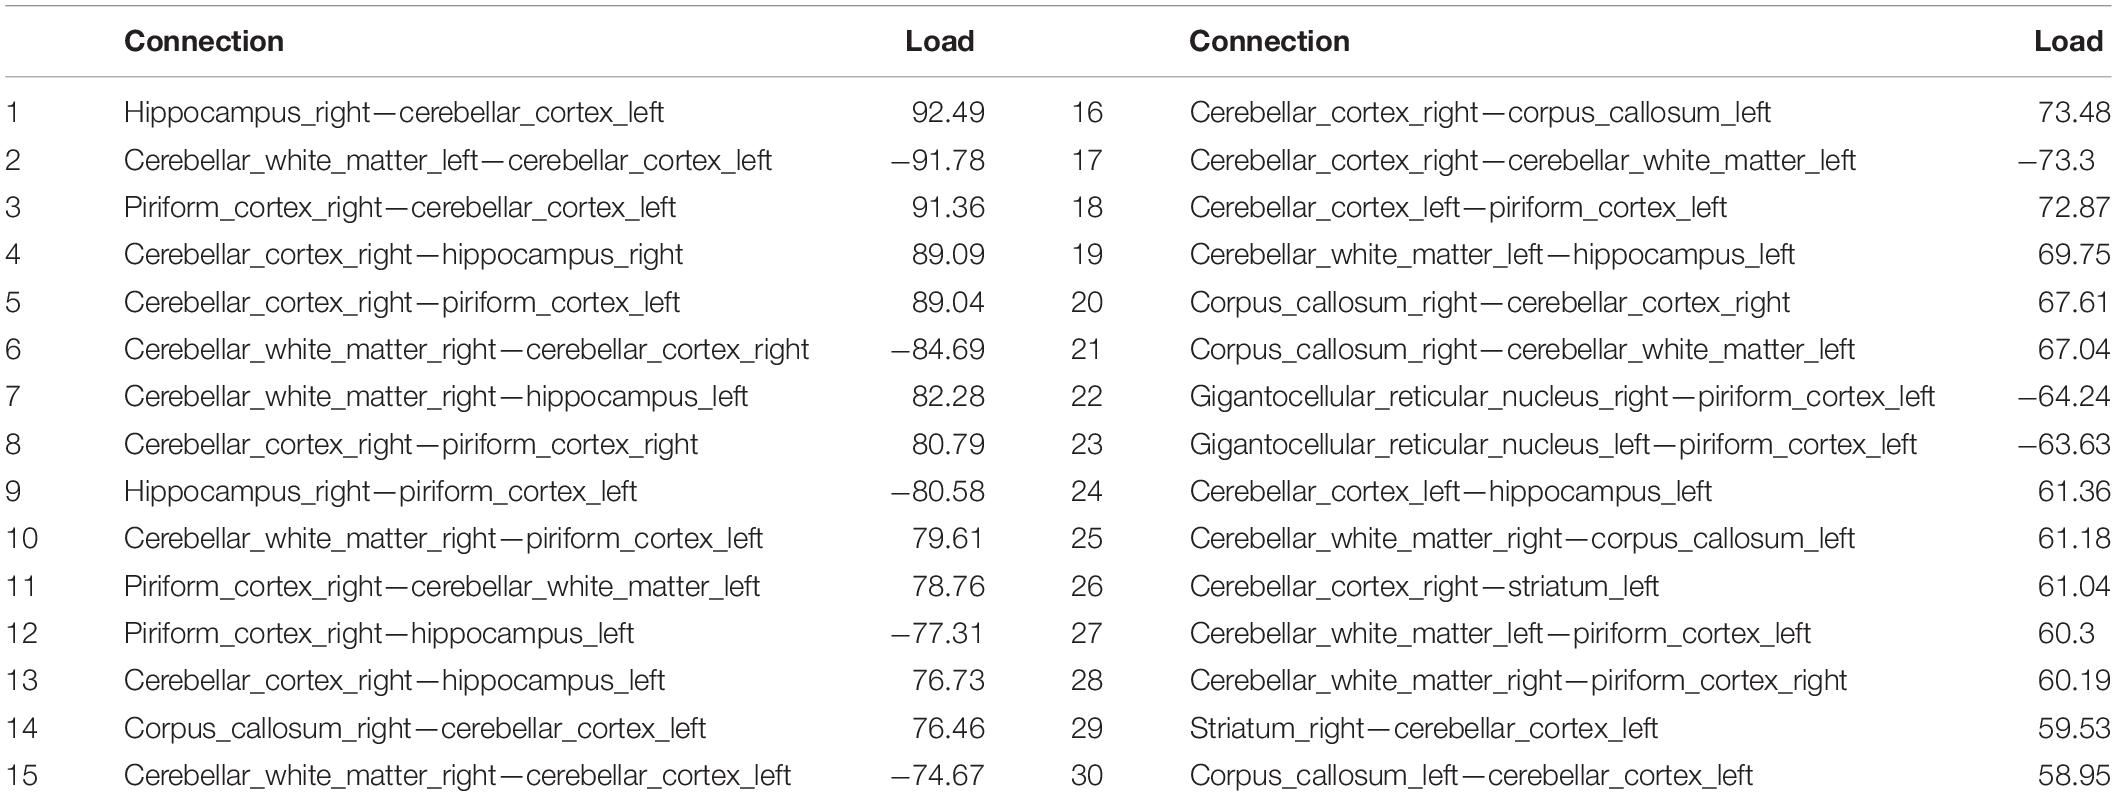
Table 2. The top connections for the subnetworks differentiating between APOE3HN and APOE4HN connectomes.
Figure 5 shows the scatter plot for the top three principal components, which explained 61% percent of the variation, while the top 15 explained 91% of the variation between genotypes. We selected examined the same graphs to identify whether sex differences were also apparent within genotypes, but these differences were less clear in our small sample.
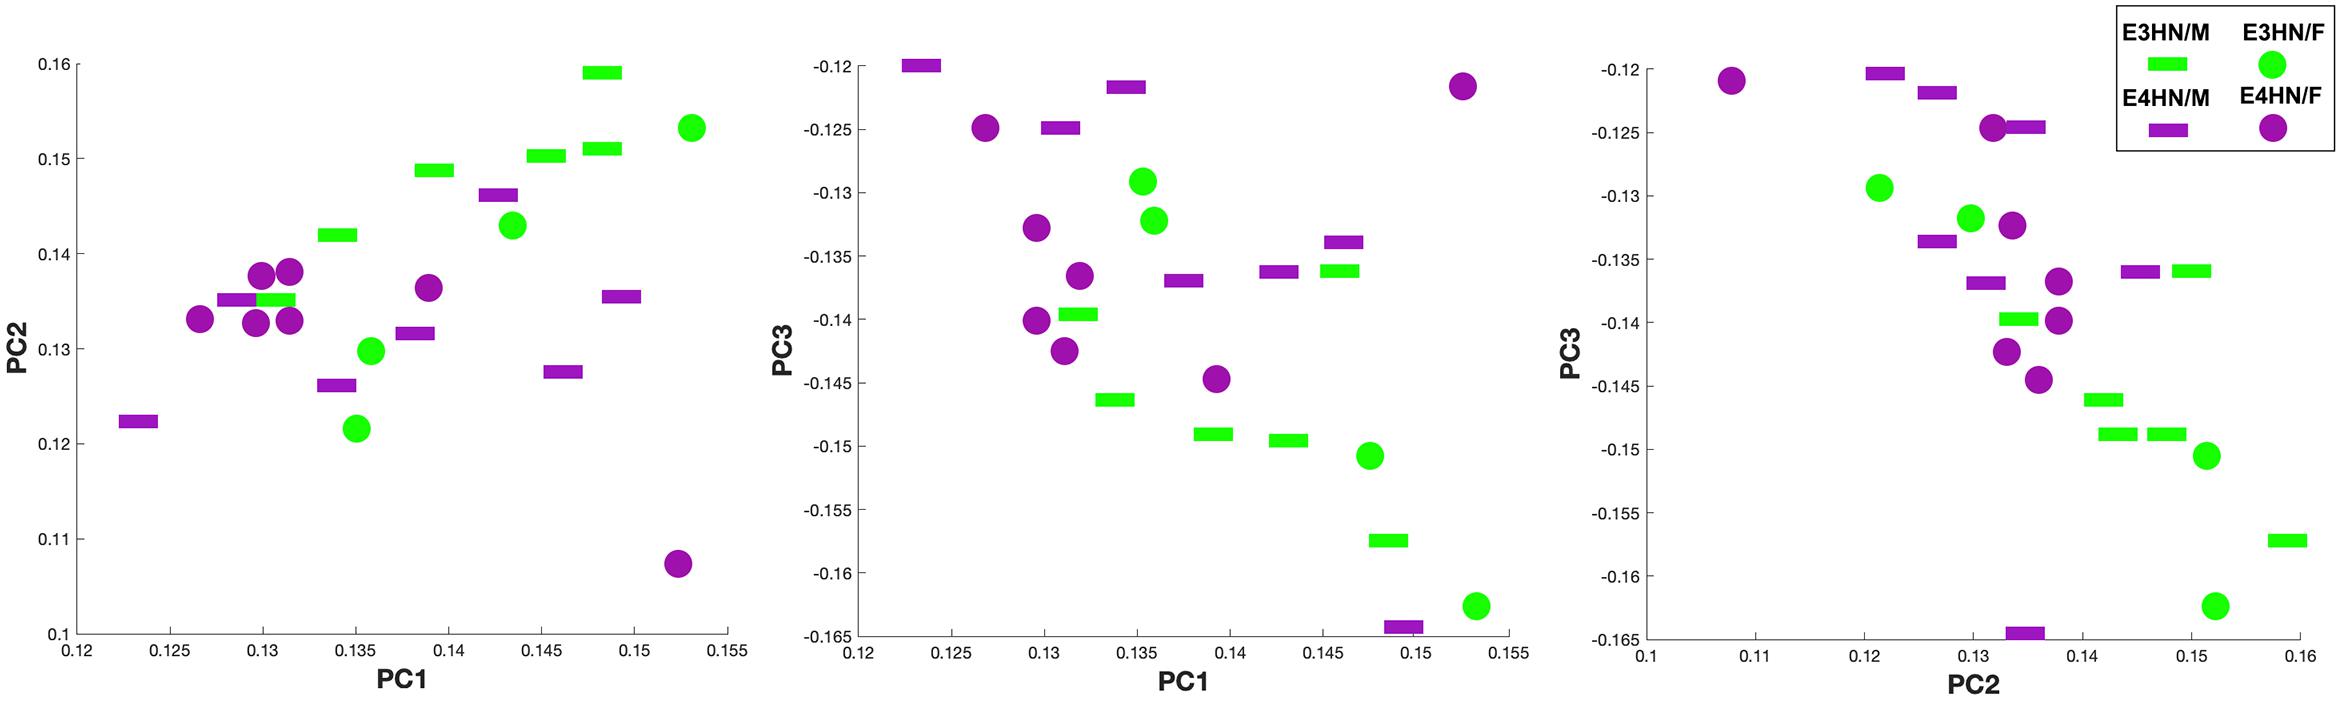
Figure 5. Scatter plot of the top three principal components for the connectome TNPCA analysis. The two genotypes are shown in green: APOE3HN, and purple: APOE4HN. Sex information is also indicated, although sex was not used as a predictor (female: disk, male: bar).
We selected examples among the top ranked connections, featuring the most frequent regions. We observed that the interhemispheric connectivity between the hippocampus and piriform cortex (ranked 9) was stronger in APOE3HN mice relative to APOE4HN mice, as illustrated qualitatively in Figures 6A,B showing the top 6 largest bundles, ranked according to their size. Figures 6C–E compare the distributions of fiber length, FA, and FA along the whole bundle set for the two genotypes. Figures 6F–H compare the FA distribution along spatially matched subbundles between genotypes, indicating that FA is non-uniform along the bundles.
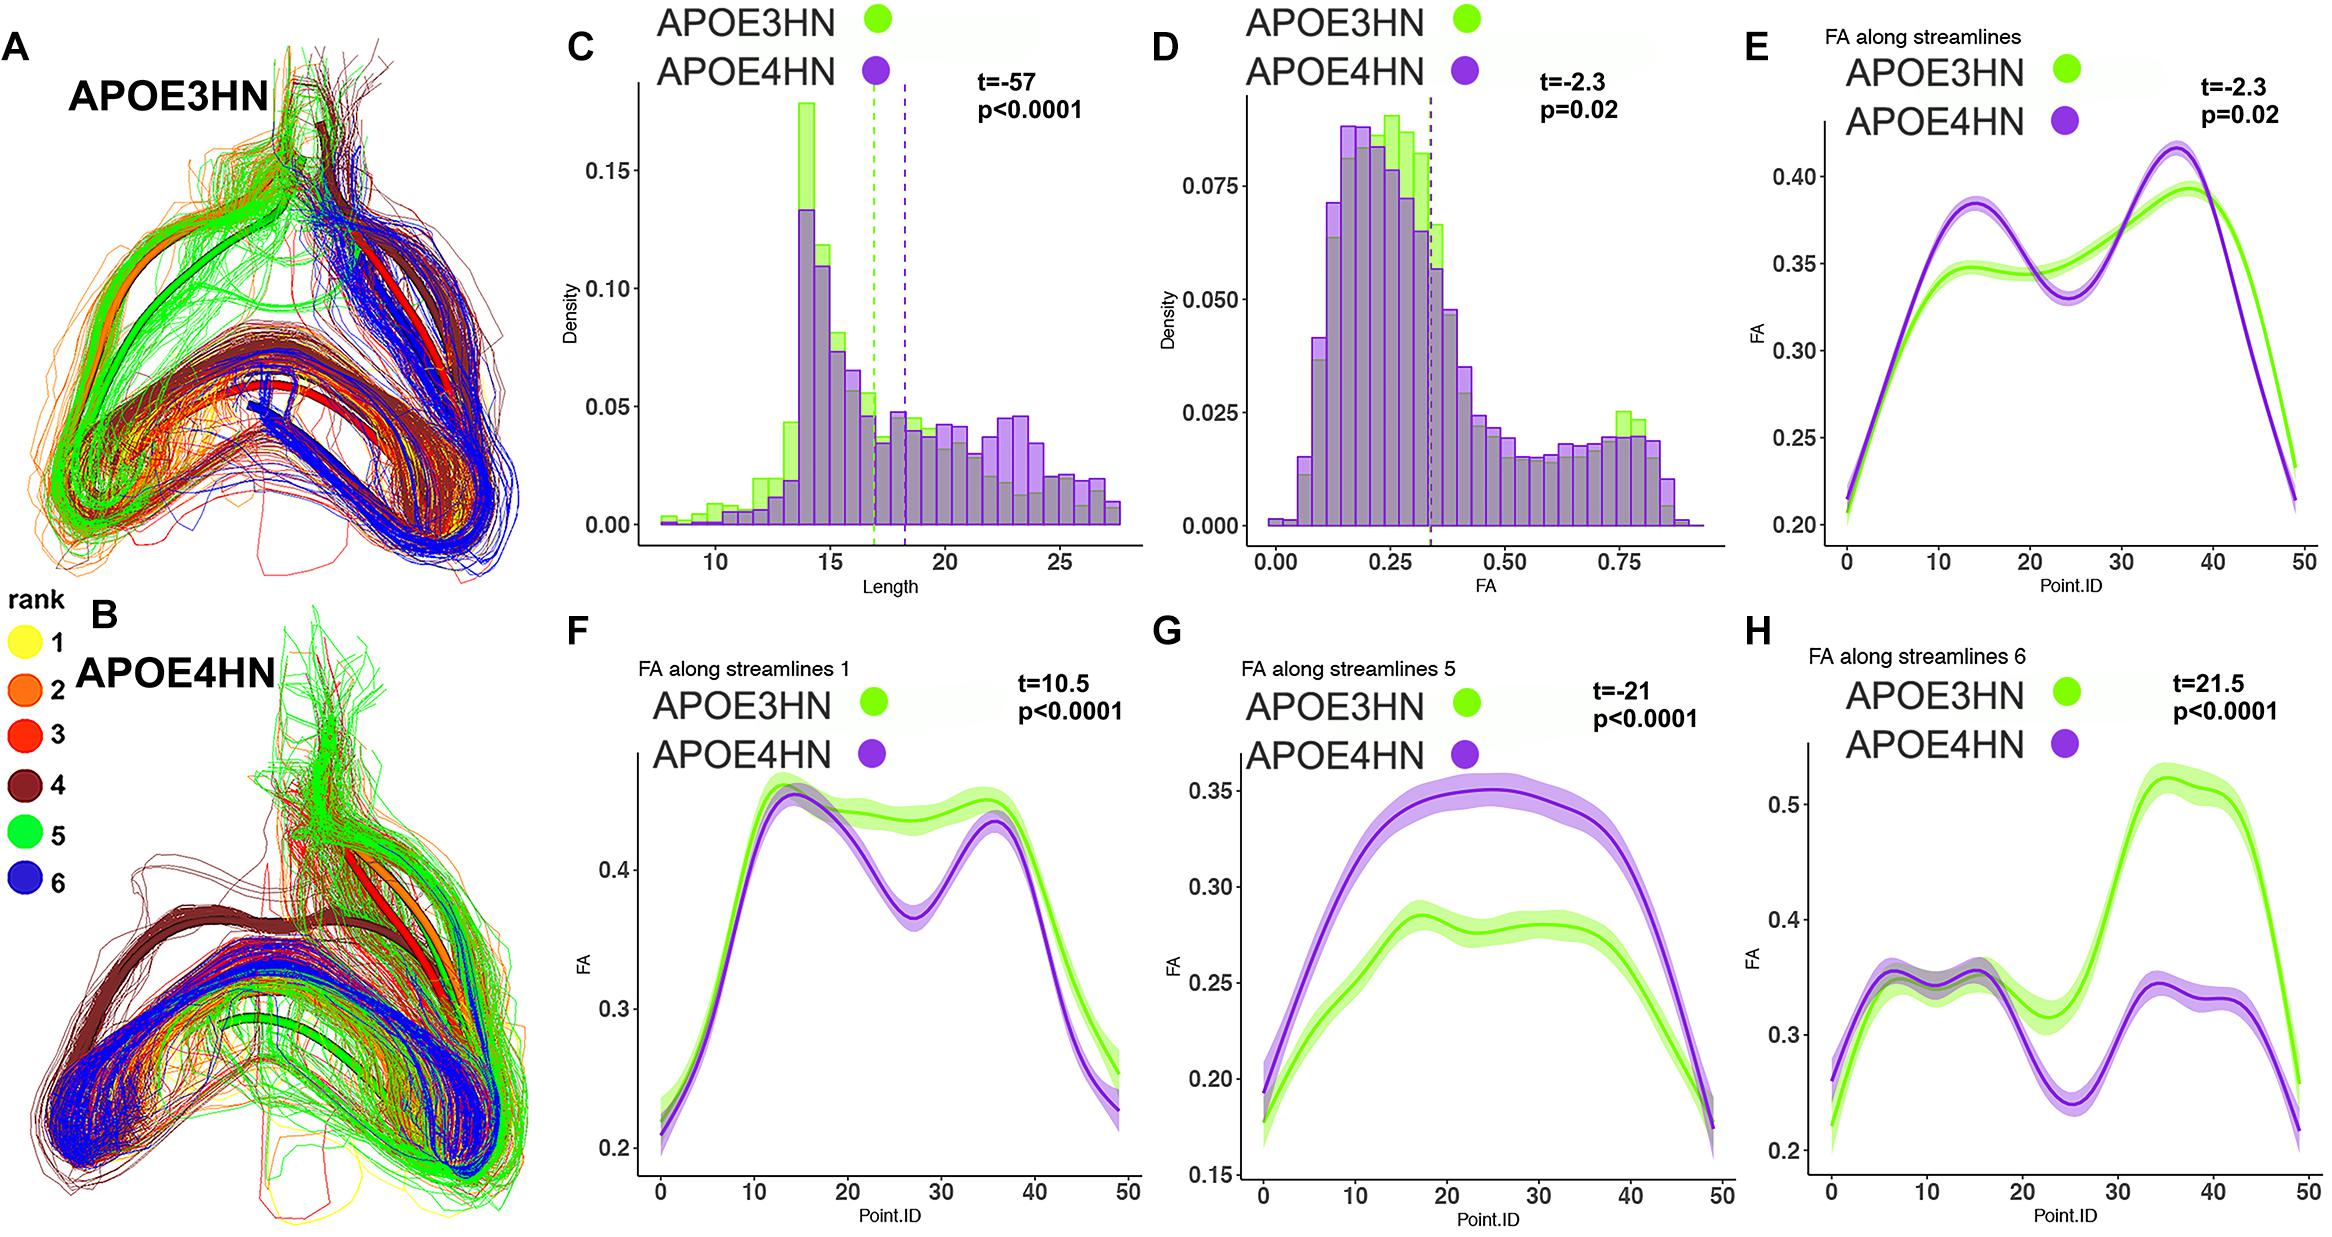
Figure 6. The piriform cortex-hippocampal interhemispheric connections through the top 6 bundles were ranked according to size (yellow for the first and largest bundle, orange for the second, red for the third, brown for the fourth, green for the fifth, blue for the sixth. The interhemispheric connections appeared stronger in the APOE3HN mice relative to APOE4HN mice (A) and (B), according to the size based ranking for the major sub-bundles. This indicated different connectivity patterns for the two genotypes. Differences in fiber length distributions between the two genotypes are shown in (C), and in FA distributions in (D) using histogram densities. These indicate a slight shift toward longer length (C), but lower FA values in APOE4HN mice, which may suggest dismyelination (D). After establishing spatial correspondence through an affine bundle centroid registration, we detected that differences along the bundle containing all connections between the piriform cortex and hippocampus were not uniform (E). We identified the top 3 sub-bundles accounting for the largest difference between the genotypes (F–H). FA appeared in general lower for APE4HN mice in sections of two of these subbundles (F,H), but higher in one subbundle (G).
The second ranked connection pertained to the intracerebellar connectivity, and APOE4HN mice had consistently shorter connections, and lower FA along the bundles; both when analyzing the connectivity of the two nodes, as well as along the significant sub bundles (Figure 7).
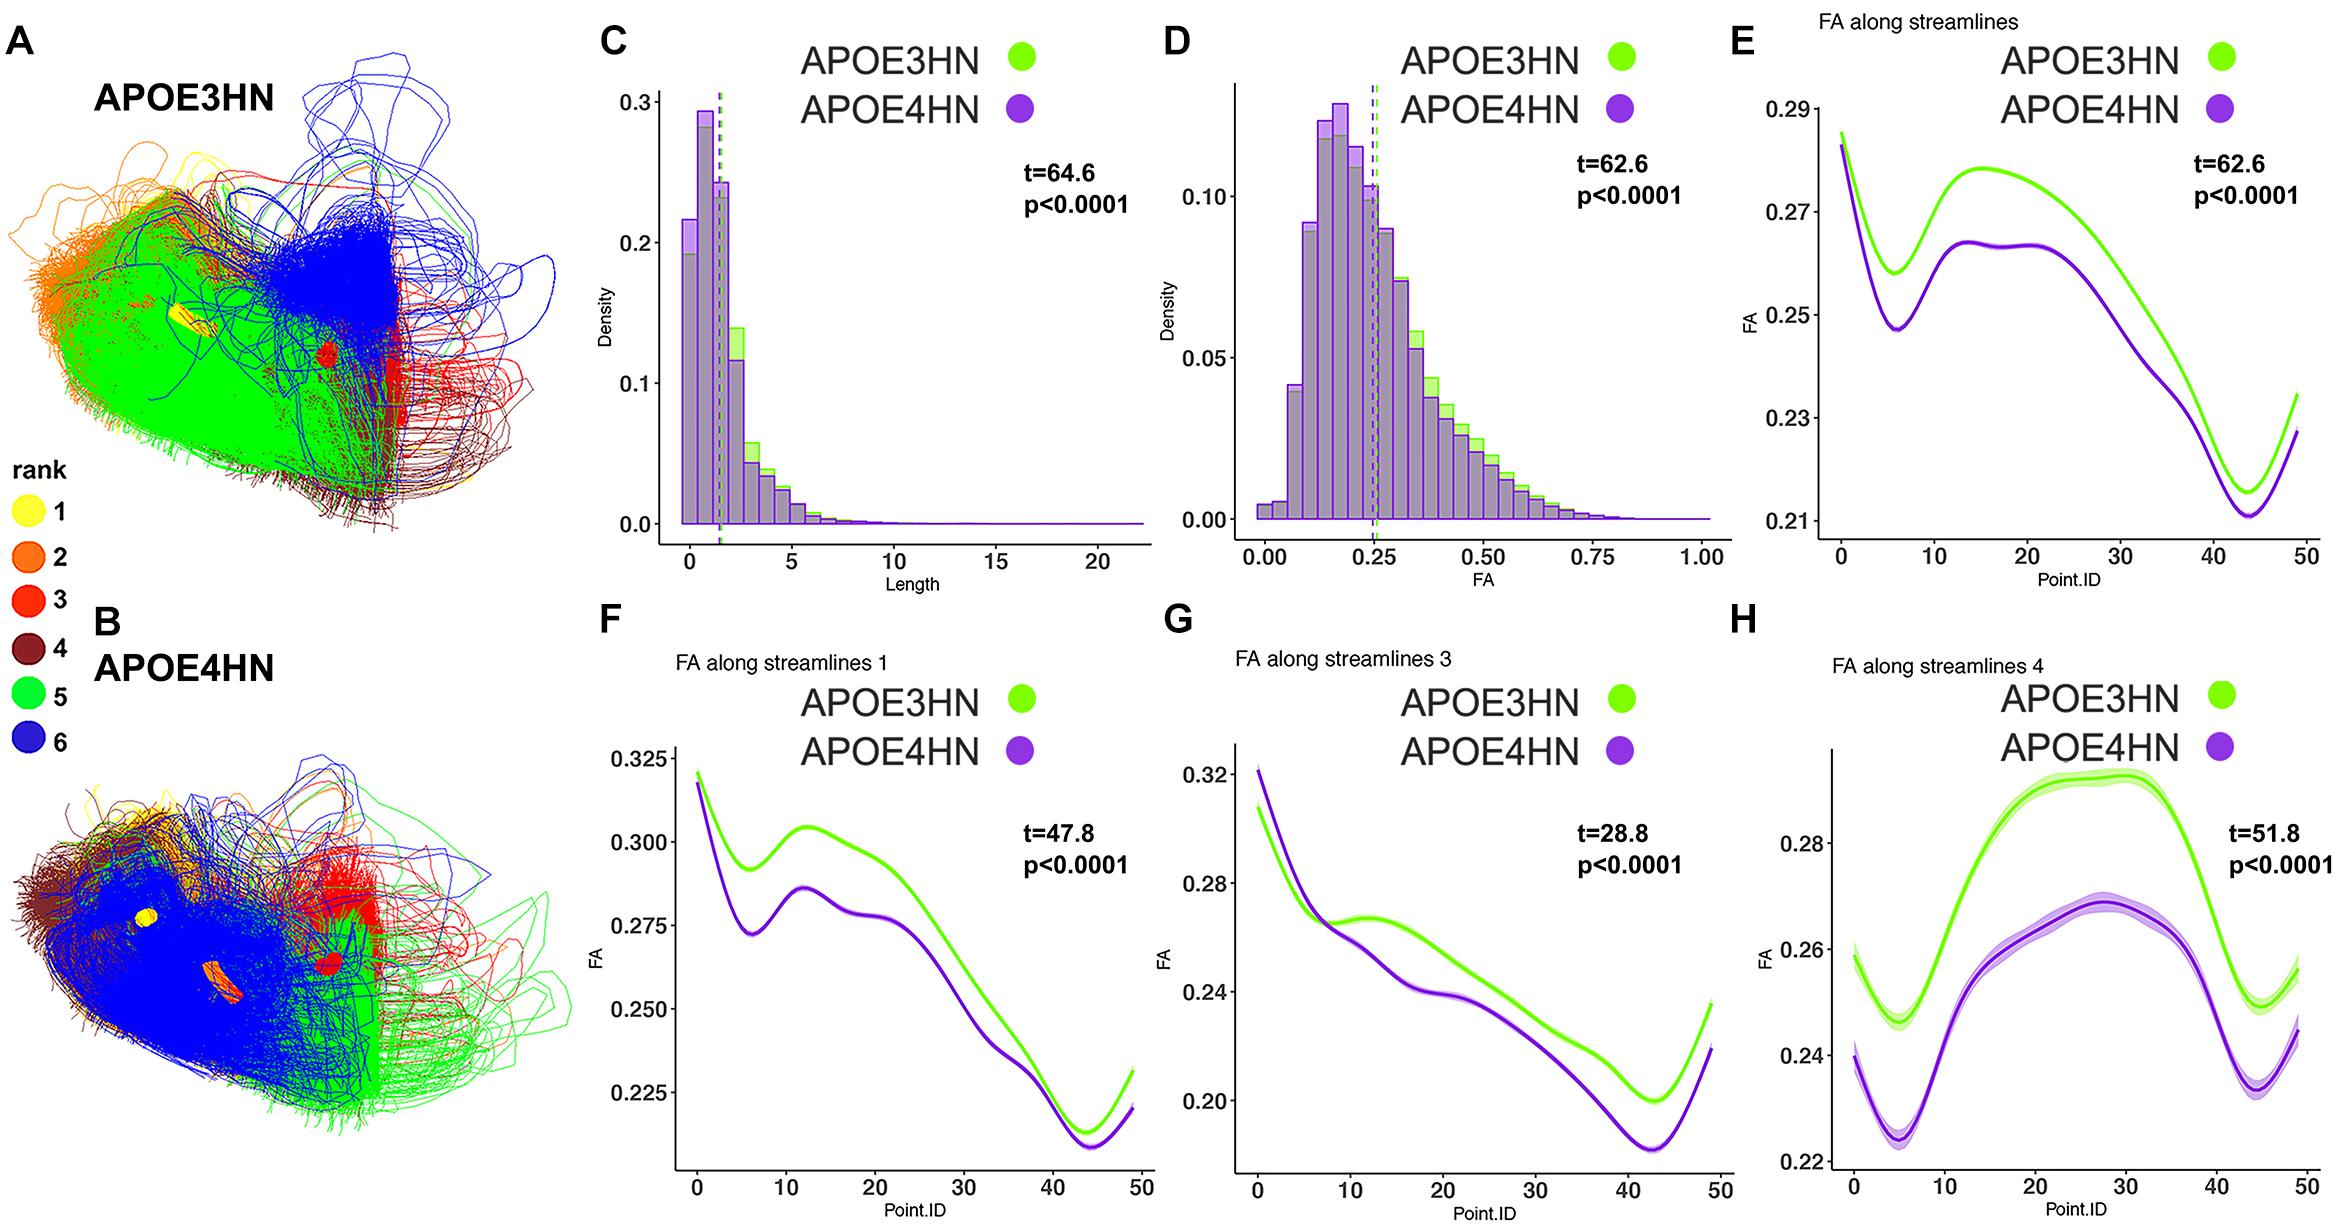
Figure 7. The 2nd ranked connection discriminating between the genotypes involved intrahemispheric cerebellar connections between white and gray matter. APOE4HN (B) showed consistent deficiencies relative to APOE3HN (A) carriers in fiber length and FA distributions (C,D). These differences were evident in whole bundle (E) and subbundle analyses (F–H).
The third example shows the interhemispheric connection between the hippocampus and cerebellum (Figure 8), which was the top ranked connection discriminating between genotypes. Distinct bundles showed larger FA in APOE4HN (overall, and in subbundles 2 and 6), while the largest subbundle (1) showed higher FA for the first portion of the bundle but lower FA for the second half.
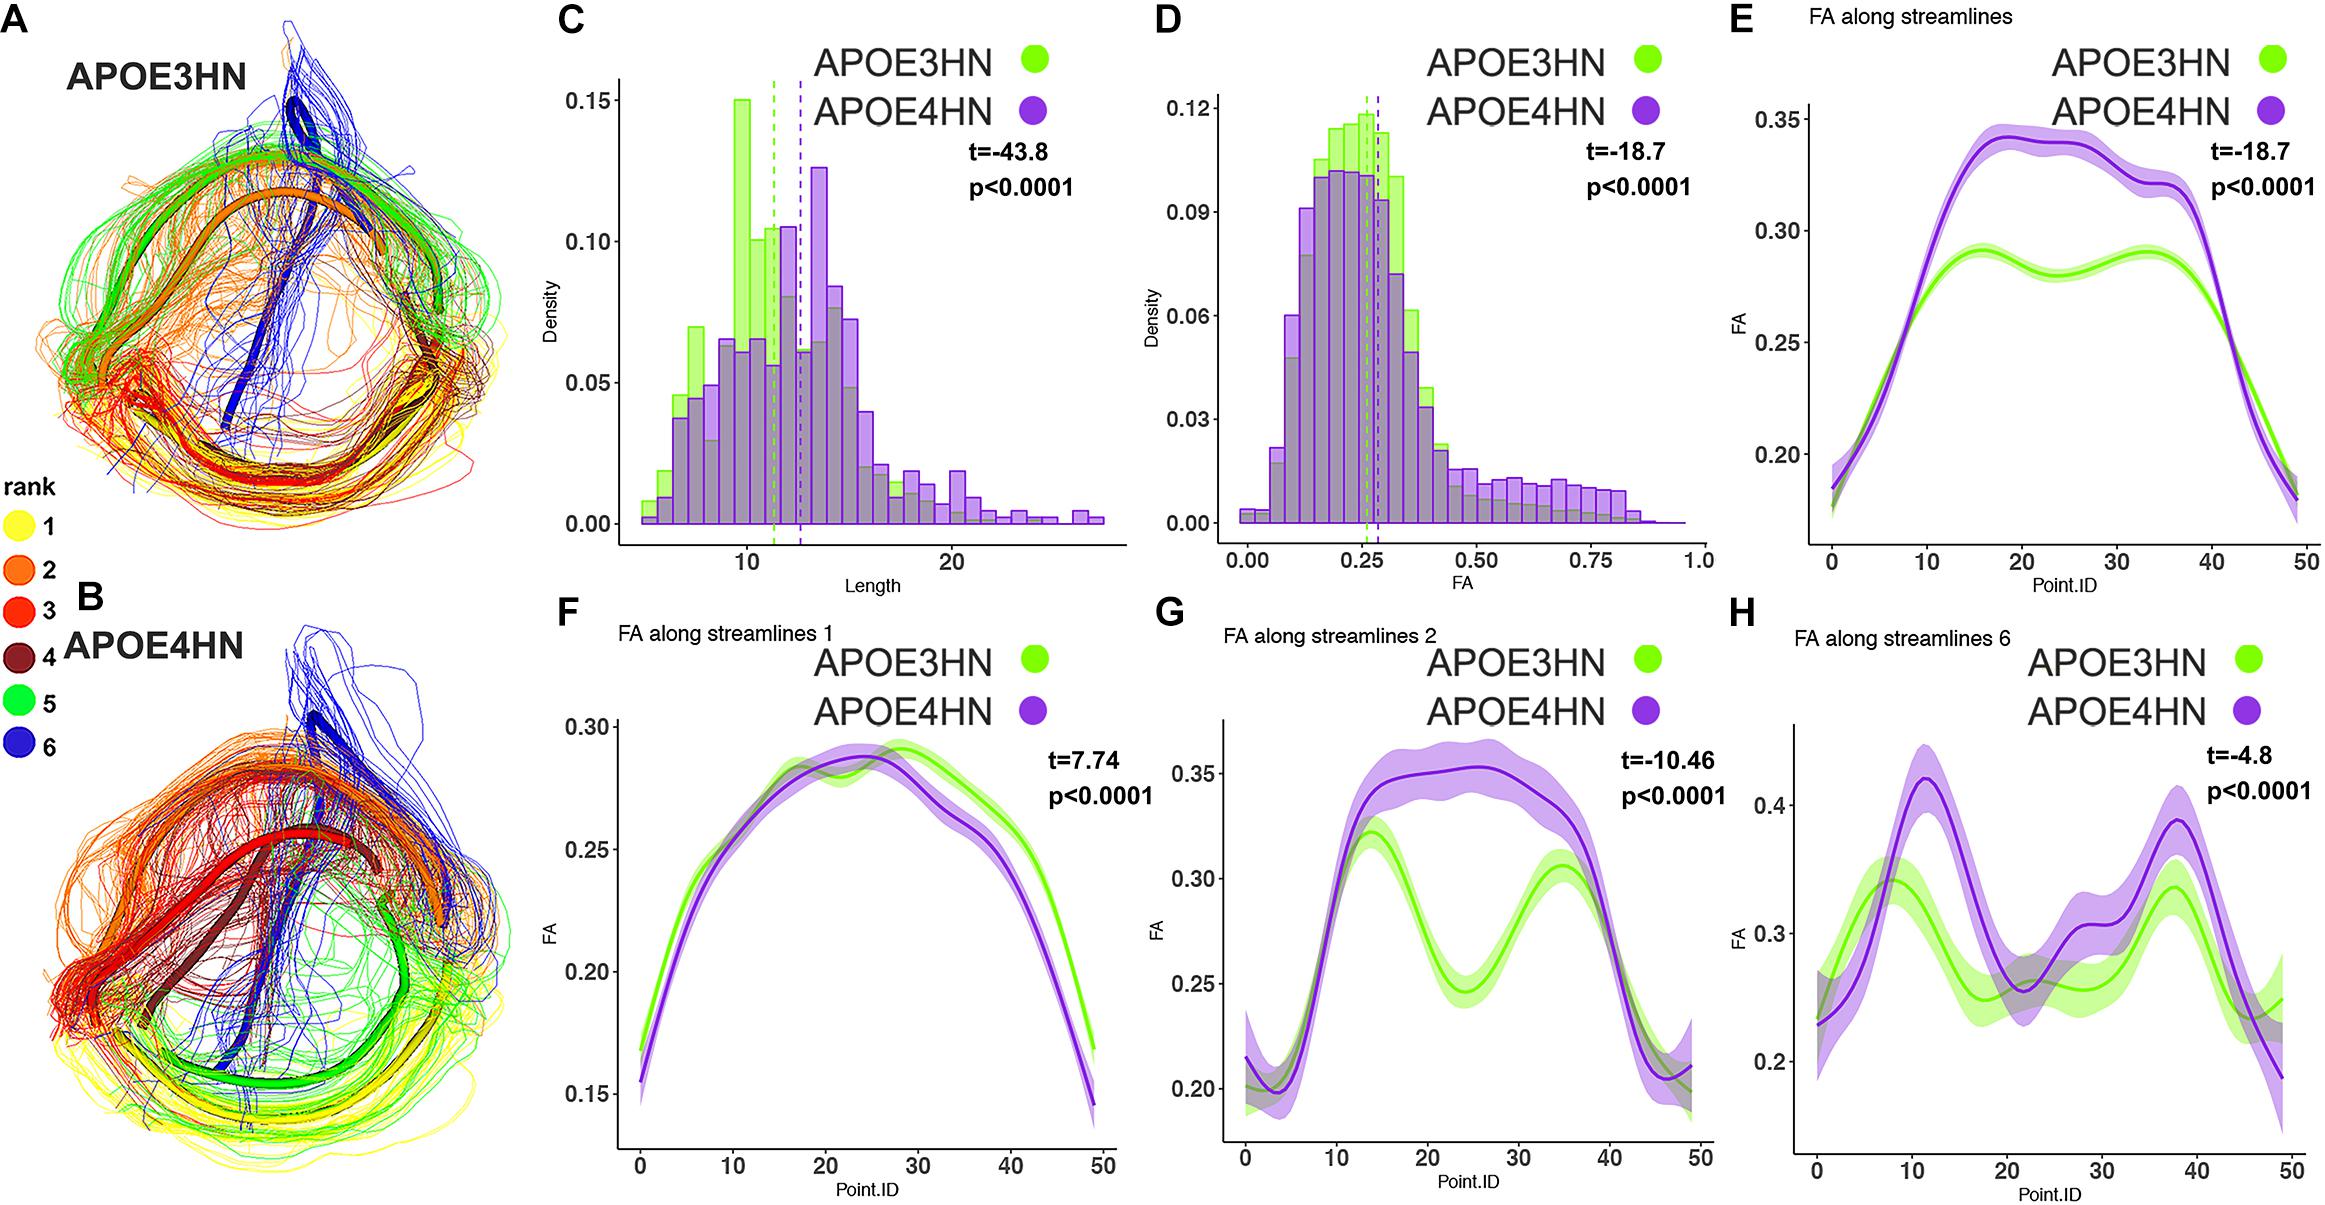
Figure 8. The interhemispheric hippocampal cerebellar connections showed significant differences between APOE3HN (A) and APOE4HN (B) mice in length (C) and FA (D,E). The top three subbundles with significant differences between genotypes showed lower FA for APOE4HN mice relative to APOE3HN in the largest subbundle (F), but higher FA for the 2nd and 6th spatially matched subbundles (G,H), and also higher variability for the APOE4HN genotype.
A further analysis of the hippocampal-cerebellar interhemispheric connections revealed within genotype, between sex differences in the length and FA distributions in both APOE3HN, and APOE4HN mice, as well as in the spatially characteristic patterns along the bundles (Figure 9). Sex based differences based on fiber length were smaller in APOE3HN mice, compared to those observed in APOE4HN models. The males appeared to have higher FA along the whole bundle relative to the females in APOE3HN mice, but the opposite was seen in APOE4HN mice. The spatial distribution of these effects was not uniform throughout the brain or along subbundles. This illustrates that sex specific differences may be harder to detect in the absence of detailed bundle analytics performed in spatially aligned bundles.
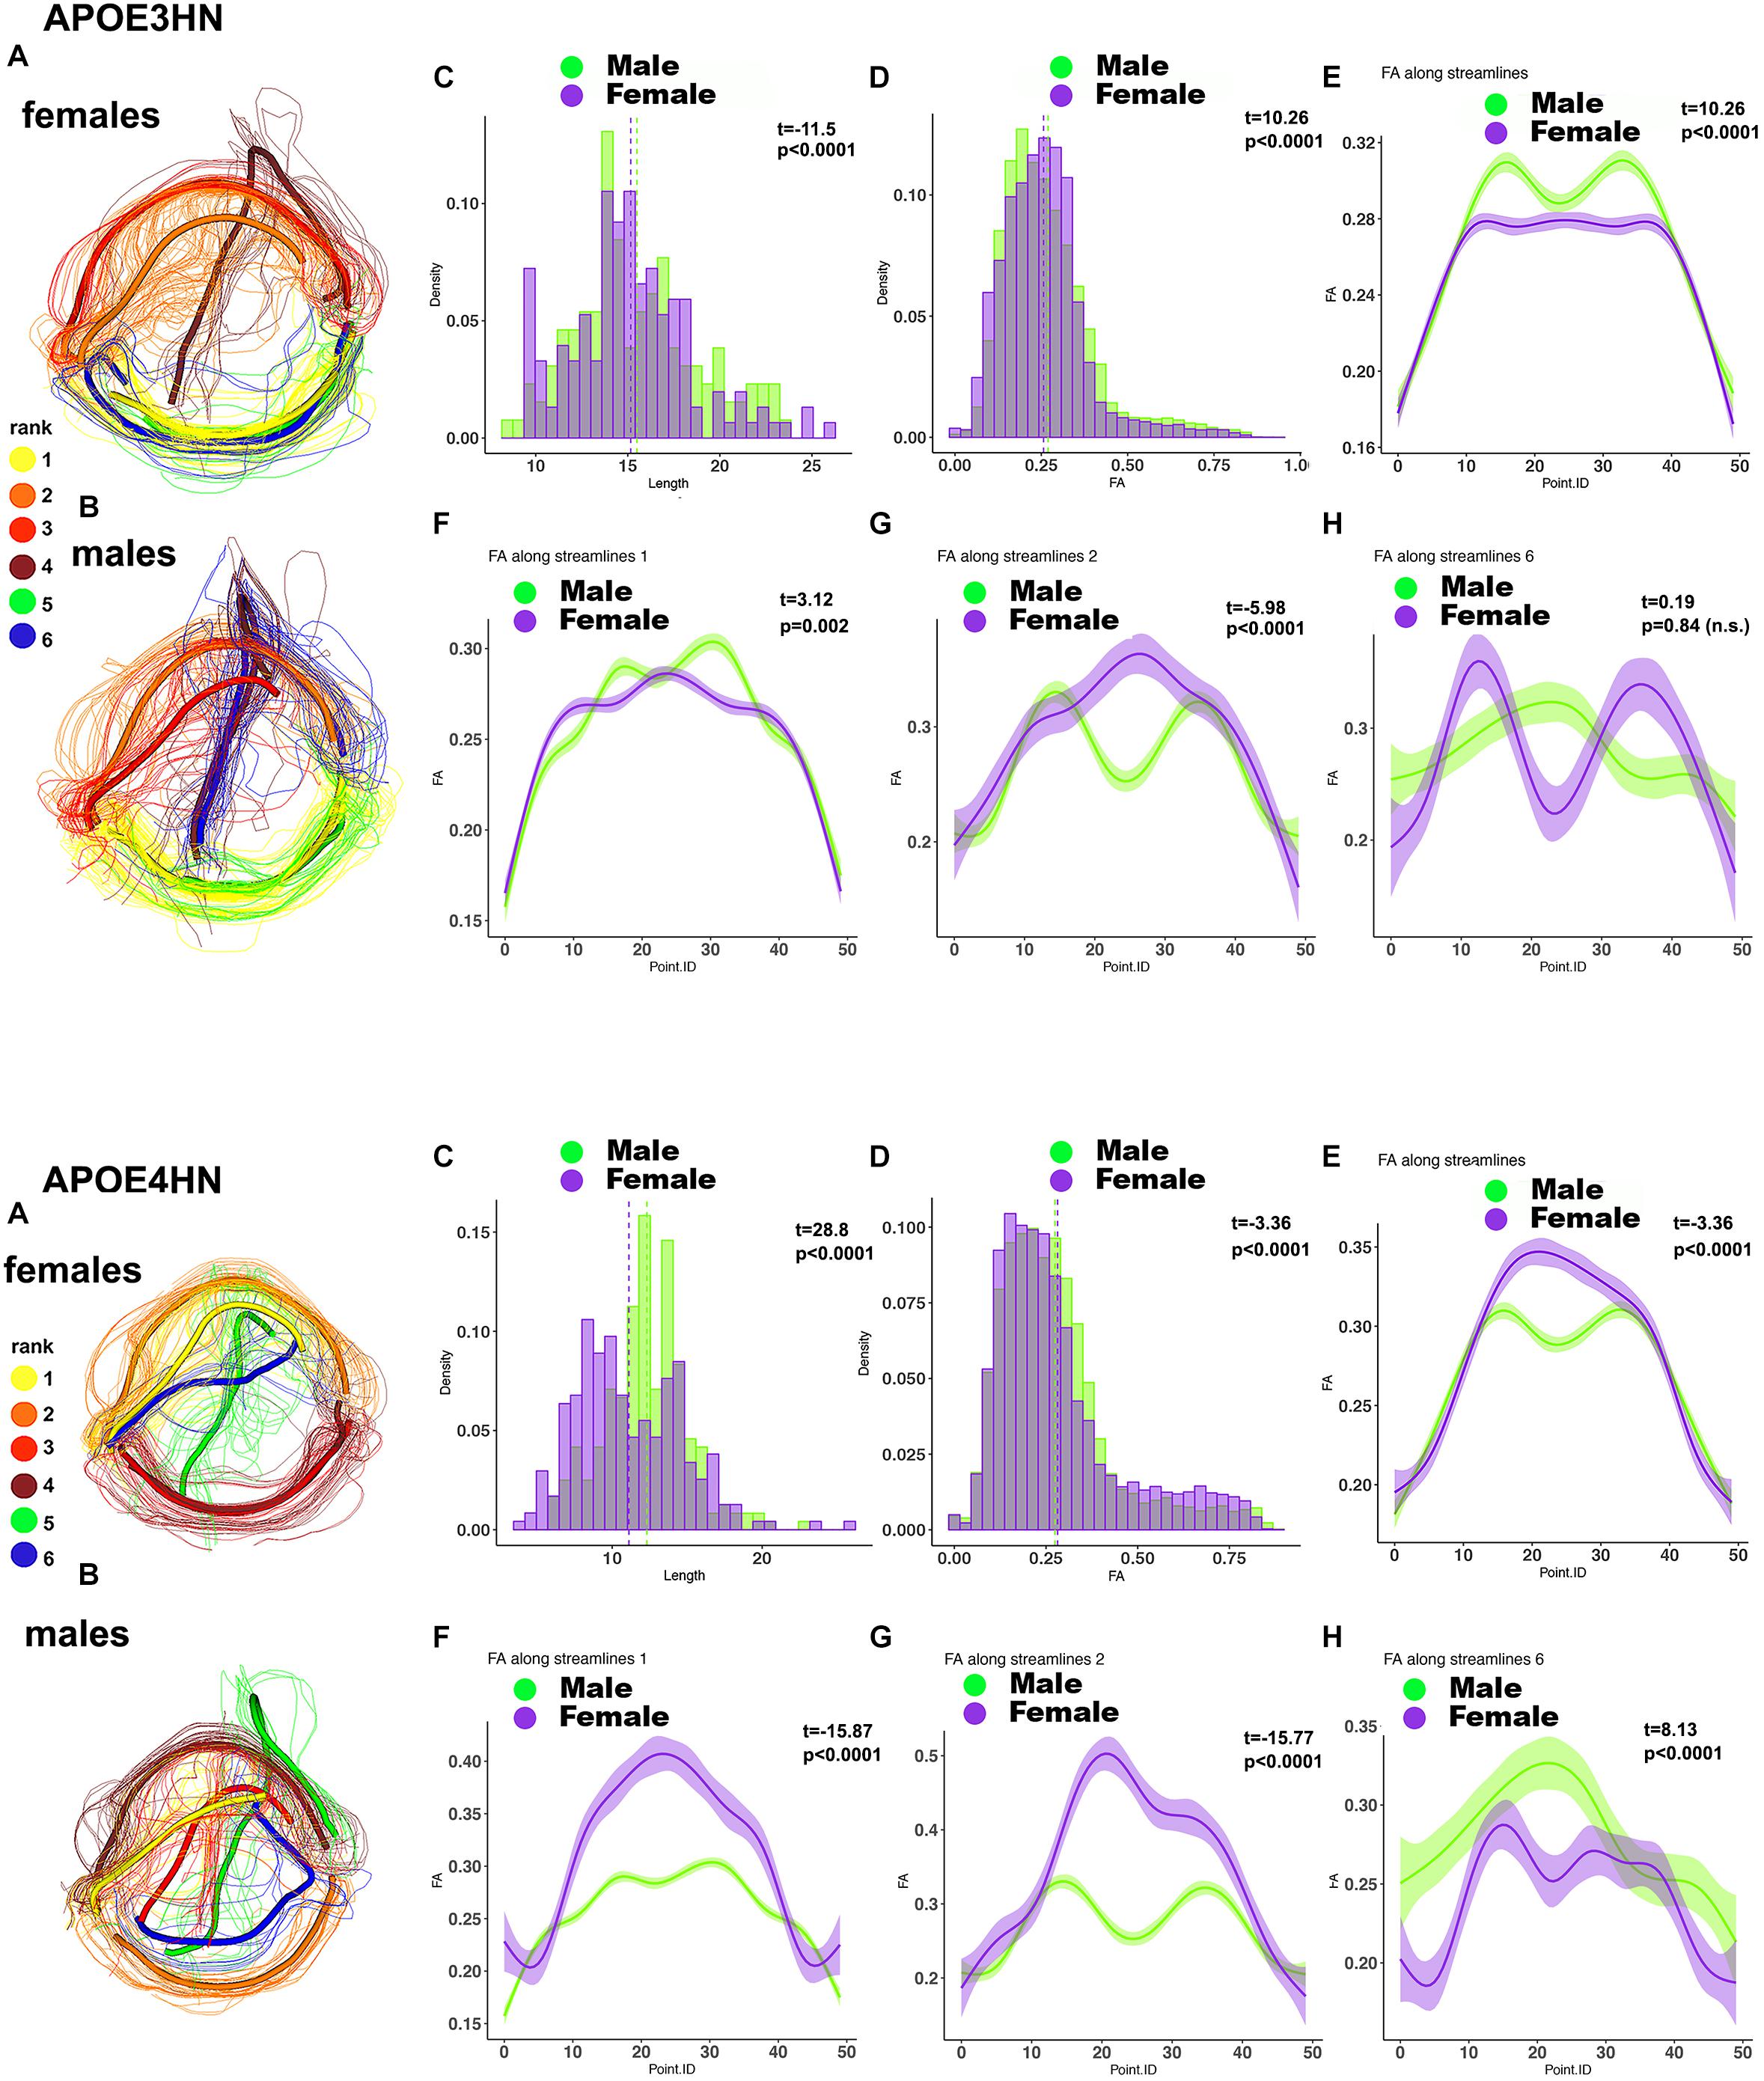
Figure 9. Within genotype, between sex (A: female; B: male) analyses for the hippocampal-cerebellar interhemispheric connections. APOE3HN females had longer connections compared to males and the opposite was true for APOE4HN mice (C). Differences in FA over the whole set of streamlines (D) were subtler in terms of effect sizes, but clearly evident in our along the bundle analysis. APOE3HN males had overall higher FA values than females, and the opposite was true for APOE4HN mice (E). The top subbundles with significant genotype differences (F) had also higher FA for APOE3HN males compared to females (bundle 1), while APOE4HN females had higher FA compared to males. The 2nd ranked bundle showed higher FA in females compared to males of both genotypes, with a more accentuated difference for APOE4HN mice (H). The 3rd ranked subbundle did not show sex differences for APOE3HN mice, while APOE4HN males showed higher FA compared to females of the same genotype.
We have examined the intrahemispheric connections between the hippocampus and piriform cortex (Figure 10), and observed larger variability within the APOE4HN genotype relative to APOE3HN, as indicated by the width of the confidence intervals (particularly in panel 1G). Qualitatively males of the two genotypes presented more similar/or consistent bundle FA shapes, and females showed more variability in the FA curve shape between the genotypes (panel 2E, and 3E, arrows). Overall, females had lower FA along the entire bundle set in both APOE3HN (panel 2E) and APOE4HN mice (panel 3E). However, we observed lower FA values along the largest subbundle in APOE4HN females relative to males of the same genotype (panel 3F), and larger differences relative to those between males and females of APOE3HN genotype (where females had larger FA overall). We noted a spatially varying pattern of FA changes along bundles, possibly denoting different myelination, or microenvironment properties.
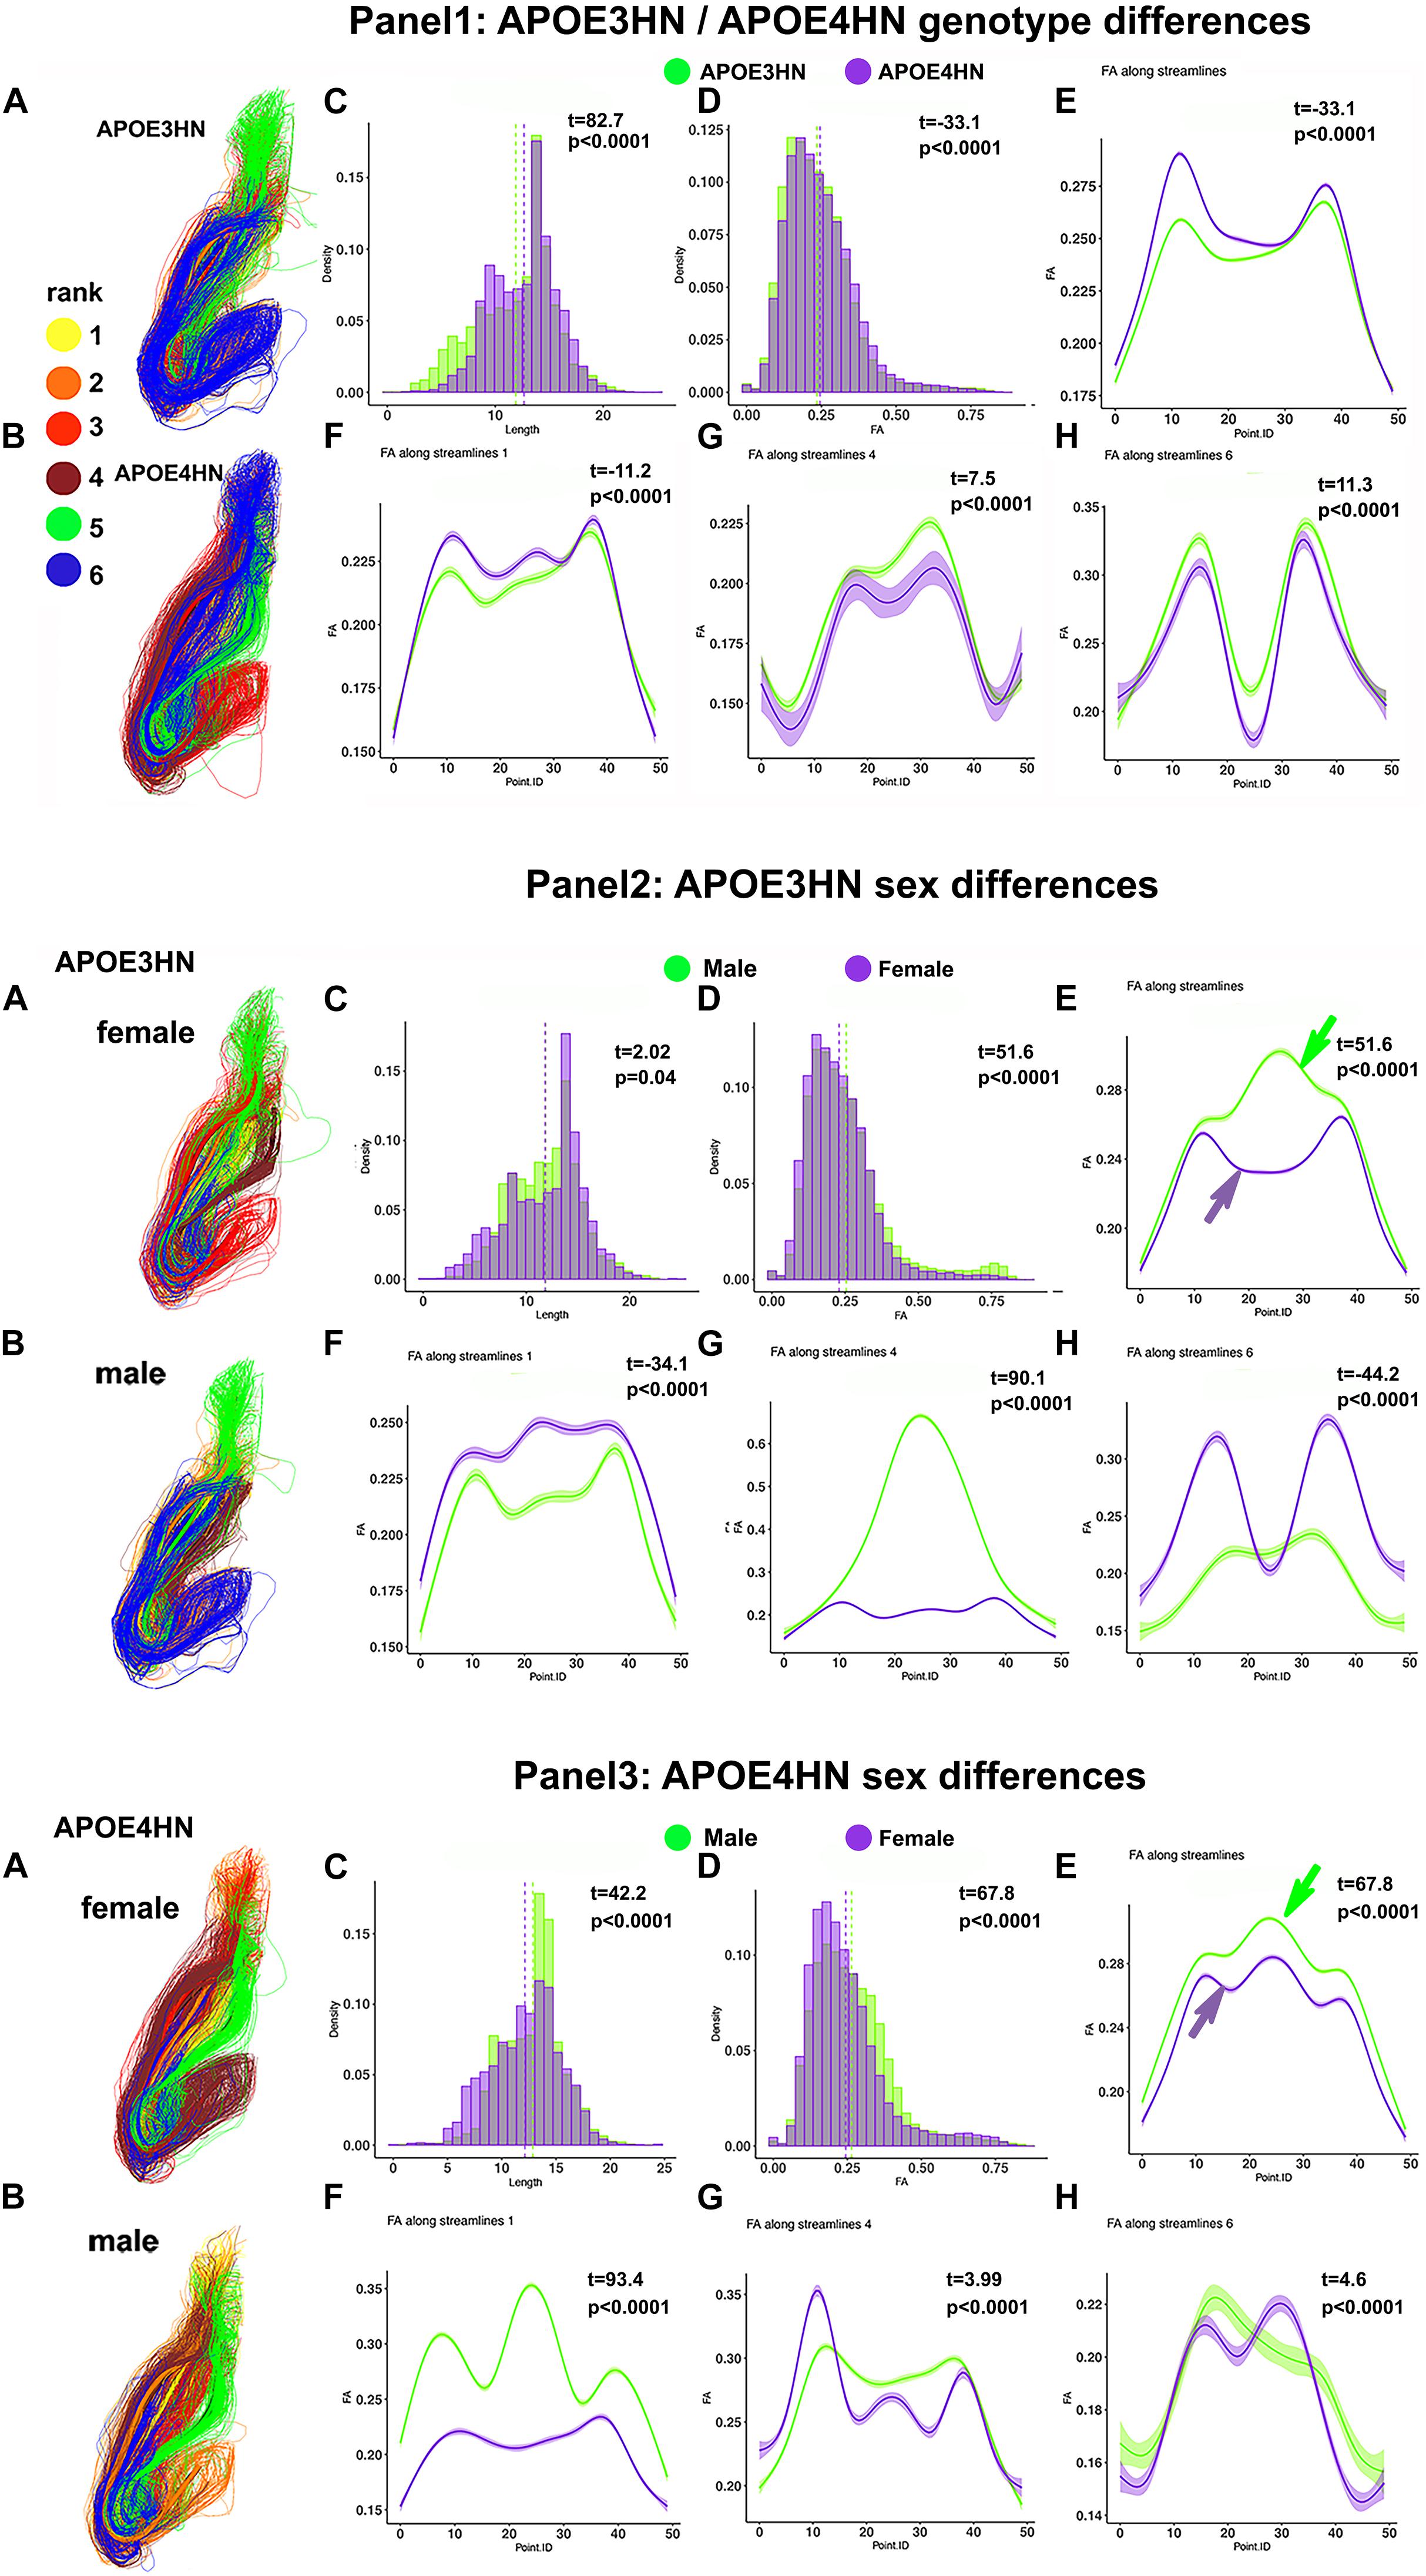
Figure 10. Intrahemispheric connections between the hippocampus and piriform cortex. The first panel compares the two genotypes; the second panel compares the two sexes, within the APOE3HN genotype; the third panel compare the two sexes, within the APOE4HN genotype. Fiber length and FA distributions are shown in Panels 1–3, C, D. Qualitatively males of the two genotypes presented more similar, consistent bundle FA shapes, while females showed more variability between the genotypes (panels 2E,3E). Overall, females had lower FA along the entire bundle set in both APOE3HN (panel 2E) and APOE4HN mice (panel 3E). Interestingly, APOE3HN females had larger FA than males for the largest subbundle (panel 2F). However, FA was lower along the same subbundle in APOE4HN females relative to males of the same genotype (panel 3F), and differences were larger relative to those between males and females of APOE3HN genotype. These patterns varied by subbundle, and spatially, along the bundles.
Together, differences in behavioral responses, morphometry, FA and connectivity denote that APOE4HN and APOE3HN mice may use different strategies for learning and memory; and that an association of multiple factors probably contributed to the observed behavioral impairment. We have found that the bundle analysis may confer increased sensitivity to genotype and sex differences, by investigating changes beyond the level of associating the connectivity between two regions with a single entry in the connectome matrix. Our along the bundle analyses revealed rather than a uniform effect, a spatially varying pattern of FA changes along bundles, possibly denoting increased sensitivity to local connectivity, myelination, or microenvironment properties.
Discussion
There is a rapid growth in the number of people affected by Alzheimer’s disease, yet we do not know its etiology or have effective treatments. To examine factors which contribute to the switch from normal to pathological aging we focused on the APOE polymorphic alleles. The causes for increased risk, or conversely resilience, conferred by the major APOE alleles are not known. The APOE4/4 genotype is the main genetic risk for late onset Alzheimer’s disease (AD), and is associated with a 30–55% risk of developing mild cognitive impairment or AD by age 85, compared to 10–15% for the APOE3/3 genotype.
To help understand the mechanisms through which APOE genes and their products differentially modulate the brain and its circuits, we implemented a multi-disciplinary approach using homozygous targeted replacement APOE3 and APOE4 mice expressing the major human APOE isoforms, under the control of the mouse endogenous ApoE promoter. To model the human immune response to aging we used double-transgenic mice that express human NOS2 gene products. This modification enables NO production and immune activity regulated by NO to better mimic the human response. Mice were characterized with a cognitive behavioral battery for memory alterations typical of AD, and with MRI to determine selective vulnerability of associated brain networks. Our imaging measures were based on volume and DWI; and our analyses of brain connections provided insight into networks properties. We aimed to reveal how APOE genotypes differentially confer vulnerability or resilience to select brain circuits during aging, and for different sexes. Identification of vulnerable networks may help understand the etiology of neurodegenerative disease, and facilitate targeted interventions. Monitoring such changes with sensitive biomarkers may help stratify patients, and assess response to therapies.
Our behavioral tests determined that APOE4HN mice have deficits in the learning and memory function as tested in the MWM during learning trials and during the first probe tests at 3 days, but not at 5 days. The NOR also indicated deficits as the recognition index was lower when tested at 24 h, but not 90 min after the initial objects presentations. These deficits in long term memory for APOE4HN mice suggest perturbations in brain networks involved in memory function.
APOE4HN had 6% smaller brains when compared to age matched APOE3HN controls, and the regions accounting for these differences included the entorhinal and temporal association cortex, the cingulate cortex and amygdala (McGaugh et al., 1996), suggesting alterations in emotional memory in addition to the demonstrated spatial and object recognition memory effects we have measured. Interestingly, the amygdalopiriform transition area, and the accumbens were also smaller in APOE4HN mice. Sensory and motor areas such as the olfactory areas/the piriform cortex, the visual and motor cortex areas, and the cerebellum and its connections also suffered atrophy. These regional changes point to spatially extensive network alterations in APOE4HN mice. Voxel based analyses confirmed these findings and added information due to increased sensitivity to smaller clusters of atrophy in the primary motor cortex, striatum, septum, subiculum, and the mediodorsal thalamic nuclei. We found changes in the volume of the pons and cerebellum, which have been traditionally thought to be involved only in late stages of AD, but have also been shown in age related tauopathy, independently of Aβ presence (Josephs et al., 2017). Fractional anisotropy and connectivity also helped distinguish APOE4 from APOE3 carriers. Interestingly, hyper functional connectivity (Wang et al., 2017) in MCI APOE4 carriers may suggest a compensatory role for the cerebellum at early stages. When present, cerebellar pathology has been associated with increased rates of cognitive dysfunction (Liang and Carlson, 2019), and to be predictive of conversion from MCI to AD. Moreover, in cases of accelerated neurodegeneration, such as chronic traumatic encephalopathy (CTE) following repeated traumatic brain injury (TBI), the cerebellum appears to be one of the most vulnerable brain regions and exhibiting pathology early on (Liang and Carlson, 2019).
This is in contrast with the traditional view associating the cerebellum exclusively with motor coordination and learning, but supported by more recent studies, which have revealed a role for the cerebellum in cognitive functions such as attention, language, working memory, emotion, and in visuospatial navigation (Timmann and Daum, 2007; Baillieux et al., 2008; Timmann et al., 2010). Viral tracer studies have recently demonstrated previously unknown connections between the cerebellum and hippocampus – in particular a polysynaptic circuit from the cerebellar fastigial nucleus with a thalamic relay in the LDDM/LDVL and VL, which in turn synapses on the subiculum, retrosplenial cortex, and rhinal cortex, which all project to the hippocampus (Bohne et al., 2019). These connections are indicative of a role in spatial navigation. Our studies support that APOE4 carriers have differences in such pathways connecting the cerebellum with the hippocampus and also with the piriform cortex, and these differences co-exist with alterations in spatial learning and memory, as well as remote memory for object recognition. Our study suggests that more attention needs to be given to understanding the role of the cerebellum in neurodegenerative diseases, and associated cognitive deficits.
White matter tracts with reduced volume included the corpus callosum, anterior commissure and the middle cerebellar peduncles. FA reductions, commonly seen as indicators of altered microstructural integrity in white matter tracts, were found mostly in the corpus callosum and the cerebellar white matter. In addition hippocampal projection pathways had lower FA, and we noted FA reductions in CA1 areas, where from projections connect to the subiculum and the entorhinal cortex, but also to the basolateral amygdala (BLA), which sends projections to the medial frontal cortex, and the accumbens (also the bed nucleus of stria terminalis, and central amygdaloid nucleus) (Mandyam, 2013).
The complexity of these relationships and the extent of the networks involved demands the development of integrative methods followed by dimensionality reduction strategies. Here we have used a recently developed method (Zhang et al., 2019) for assembling structural connectomes into tensor networks, and mapping those into a reduced dimensional space to identify significant subnetworks associated with traits. This relies on a generalization of principal component analysis. In our case the top 15 principal components explained 91% of the variance. The tensor network principal component analysis helped reveal the top 30 connections, including seven unique structures that best distinguished amongst our two genotypes. A significant portion of these connections were interhemispheric. We found that the pairwise connectivity between two nodes, most often used in standard connectometry studies contain rich information that can be further exploited to reveal genotype and sex differences. The histogram based analyses for tract length and FA were supplemented by bundle specific analyses on spatially clustered sub-bundles, and illustrated different wiring patterns and properties in APOE4HN and APOE3HN, as well as between sexes within each genotype. We paid particular attention to the interhemispheric connections between the hippocampus and piriform cortex, the cerebellum and hippocampus, and the intrahemispheric cerebellar connections. Prompted by the frequency of appearance for the piriform cortex and hippocampus in the top list of connections we also examined the properties of their intrahemispheric connections (Figure 10), and these confirmed the male associated differences between genotypes, while showing a stronger tendency for lower FA along these projections for APOE4HN mice.
The main limitations of this study come from the small sample size, and the fact that we pooled our bundles for statistical analysis rather than stratifying them by animal. We argue this provides a first step approach to study differences with genotypes in animal cohorts which provide virtually genetically identical replicates. Also, formalin fixation may affect tissue properties and cause shrinkage, and we have tried to control these factors by preserving the same interval between animal sacrifice and imaging. Further studies should include more replicates of each sex to infer sex specific interactions between vulnerable networks and APOE alleles.
We note that APOE-HN mice do not express mutated APP leading to prevalent amyloid pathology, therefore our study could not address the mechanism of interaction between the various APOE alleles and Aß. However, the literature suggests that APOE4 exerts an effect on the pathogenesis on AD through Aß and also Aß independent pathways (Huang, 2010). While the deposition of Aβ is apoE isoform-specific, it is not clear whether and how they influence the accumulation and progression of tau pathology (Balu et al., 2019). APOE isoforms also affect neuroinflammation, vascular function, metabolism, synaptic plasticity, and transcription regulation (Liao et al., 2017). In addition to the human APOE alleles, our mouse models have a murine NO synthase 2 knockout background (mNos2–/–) (Colton et al., 2006, 2014). In place of the mouse Nos2 gene these express a functional human NOS2 gene (Vitek et al., 2006). These modifications lead to reduced immune-activated NOS2 expression and iNOS production compared to wild type rodents. This allows to model the human innate immune response, in particular with respect to the redox microenvironment, and NO production (Hoos et al., 2014). Mouse models on this genetic background expressing APP mutations present multiple AD like phenotypes (Wilcock et al., 2008; Colton et al., 2014; Kan et al., 2015; Badea et al., 2016). Here we assessed the differential effects of the interaction of the humanized NOS background with APOE3 and APOE4 alleles.
Our current study cannot rule out developmental effects in our mice, however, human studies point to APOE4 associated differences in asymptomatic and young carriers (Reiter et al., 2012; Piers, 2018), which may change in time (Koelewijn et al., 2019). Further studies should explore in more detail the relation between behavioral, imaging, and connectome markers.
Our findings parallel other investigations in the study of connectivity alterations associated with APOE status in human carriers and mouse models (Heise et al., 2014; Wiesmann et al., 2016; Luo et al., 2017; Korthauer et al., 2018). These studies support the presence of alterations in both functional and structural connectomes, and report separately such biomarkers. They generally point to a role for the hippocampus and its connection, and vascular function through perfusion changes, which changes may affect cognition. The importance of multimodal approaches (Wiesmann et al., 2016) and developing a framework for integrating such biomarkers has long been recognized (Madden et al., 2009), and connectomes present such an opportunity.
We argue that unique entries in a connectome contain rich information which can be further exploited at finer scales, and perhaps using different modalities. In our analyses we found significant differences in the size based ranking of the subbundles, indicating different wiring patterns in mice with different APOE alleles, and perhaps compensatory mechanisms – which are not evident at the level of whole bundle/pairwise connectivity analysis. The high resolution imaging allowed us to infer subdivisions of the bundles, based on spatial geometric relationships, and these remain to be validated using complementary methods. APOE4HN mice had consistently lower FA along the cerebellar connections, while the patterns for the interhemispheric hippocampal-cerebellar and hippocampal-piriform connections varied by subbundles, and position along the bundle, with lower FA for the largest subbundle in APOE4 carriers, but higher FAs were also observed. We observed frequently higher variability in APOE4HN mice, and in APOE4HN females compared to males. An examination of sex based differences in the hippocampal cerebellar connections indicated more consistency between the males of APOE4HN and APOE3HN genotypes, with females showing more differences with genotype in the FA curve shape (Figure 9E), and females of the same genotype showing more variability (Figures 9E–G). We note that the connections we analyzed run also through gray matter, rather than just white matter. Thus the associated FA values may be affected by aging and pathology, which led to increased FA values in gray matter.
We identified changes in volume and FA in areas which have been associated with amyloid deposition in AD patients, such as the entorhinal cortex, hippocampus, cingulate cortex and amygdala. However, our animal models do not have APP mutations predisposing them to abundant amyloid deposition, which suggests that the regions we have identified may be part of a vulnerable brain network prone to the development, propagation and deposition of misfolded proteins, proteinopathies, or involved in other pathological processes as well. While some of the significant differences in the connectome identified decreased FA along the tracts connecting these regions, the reverse was also noted. Such findings have also been reported in human APOE4 carriers, particularly at younger ages, and the effects are not uniform throughout the brain. We believe that FA may show different patterns, not only between genotypes or sexes, but even along bundles and these differences can be due to changes in the local brain microenvironment, toxicity, or myelination. Compensatory mechanisms can also play a role. In Figure 6 we note that the subbundle 5 passes largely through gray matter, so we may observe changes due to gliosis in the vicinity of such bundles.
We also found changes in the striatum gigantocellular reticular nuclei, cerebellum and cortical motor related regions. These results support the role of APOE4 (Serrano-Pozo et al., 2011) as a risk factor for Parkinson’s disease (Pankratz et al., 2006), where alpha synuclein may also be preferentially deposited in the CA2–CA3 regions of the hippocampus, insula, amygdala and cingulate cortex (Harding and Halliday, 2001; Bertrand et al., 2004). This points to shared mechanisms and vulnerable networks across neurodegenerative conditions such as AD and PD. Approximately 25% of AD patients develop PD, and 50% of PD patients develop AD after 65 years of age (Hansen et al., 1990). Moreover, 70% of LOAD patients display α-synuclein-positive LB-like inclusions in the amygdala and limbic structures (Trojanowski et al., 1998; Hamilton, 2000). Identifying differences between these vulnerable networks, based on multivariate biomarkers may help stratify patients, as e.g., dementia with Lewy bodies can be distinguished from Parkinson’s disease dementia based on the presence of Aβ deposits in the striatum (Duda et al., 2002) and hippocampus (Masliah et al., 1993).
We have shown that behavioral and imaging markers corroborate to help identify vulnerable networks in novel mouse models of pathological aging, relying on the genetic risk factor conferred by APOE4 alleles. We have also tried to gain insight into the rich information behind one single entry in a connectome. Imaging and DWI based connectomics provided multiple sensitive biomarkers to monitor the integrity of these networks or their failure in aging and disease. We hope that future work will address the mechanism underlying the switch from normal to pathological aging, and will help monitor the effects of interventions.
Data Availability Statement
All datasets generated for this study are included in the article/supplementary material.
Ethics Statement
The animal study was reviewed and approved by Duke IACUC.
Author Contributions
AB, WW, CC, and DD designed the research. AB, WW, MW, RA, YQ, JS, and JW performed the research and analyzed the data. AB, WW, SK, and EG contributed new analytical tools. GJ founding director of CIVM, helped build and maintain the imaging resources at CIVM. AB, CC, WW, JS, and DD wrote the manuscript.
Conflict of Interest
The authors declare that the research was conducted in the absence of any commercial or financial relationships that could be construed as a potential conflict of interest.
Funding
This work was supported by the National Institutes of Health through K01 AG041211, R01 AG045422, R56 AG051765, R56 AG 057895, R01AG057895, R01 MH118927, and R01 AG066184. We are grateful for NSF support through the REU initiative at Duke (Award 1659615). Imaging was performed at the Center for In Vivo Microscopy (CIVM), supported through P41 EB015897.
Acknowledgments
We thank all CIVM-ers for their efforts to build and maintain this imaging resource, and a collaborative learning environment. We also thank Dr. Zhengwu Zhang and Dr. Richard O’Brien for helpful discussions.
Footnotes
References
Anderson, R. J., Cook, J. J., Delpratt, N., Nouls, J. C., Gu, B., McNamara, J. O., et al. (2018a). Small animal multivariate brain analysis (SAMBA) – a high throughput pipeline with a validation framework. Neuroinformatics 17, 451–472.
Anderson, R. J., Wang, N., Cook, J. J., Cofer, G. P., Dibb, R., Johnson, G. A., et al. (2018b). A high performance computing cluster implementation of compressed sensing reconstruction for MR histology. Proc. Intl. Soc. Mag. Reson. Med. 26.
Anderson, R. J., Cook, J. J., Delpratt, N. A., Nouls, J. C., Gu, B., McNamara, J. O., et al. (2017). Small Animal multivariate brain analysis (SAMBA): a high throughput pipeline with a validation framework. arXiv[preprint]
Avants, B. B., Epstein, C. L., Grossman, M., and Gee, J. C. (2008). Symmetric diffeomorphic image registration with cross-correlation: evaluating automated labeling of elderly and neurodegenerative brain. Med. Image Anal. 12, 26–41. doi: 10.1016/j.media.2007.06.004
Avants, B. B., Tustison, N. J., Song, G., Cook, P. A., Klein, A., and Gee, J. C. (2011). A reproducible evaluation of ANTs similarity metric performance in brain image registration. Neuroimage 54, 2033–2044. doi: 10.1016/j.neuroimage.2010.09.025
Badea, A., Delpratt, N. A., Anderson, R. J., Dibb, R., Qi, Y., Wei, H., et al. (2019). Multivariate MR biomarkers better predict cognitive dysfunction in mouse models of Alzheimer’s disease. Magn. Reson. Imaging 60, 52–67. doi: 10.1016/j.mri.2019.03.022
Badea, A., Kane, L., Anderson, R. J., Qi, Y., Foster, M., Cofer, G. P., et al. (2016). The fornix provides multiple biomarkers to characterize circuit disruption in a mouse model of Alzheimer’s disease. Neuroimage 142, 498–511. doi: 10.1016/j.neuroimage.2016.08.014
Baillieux, H., De Smet, H. J., Paquier, P. F., De Deyn, P. P., and Marien, P. (2008). Cerebellar neurocognition: insights into the bottom of the brain. Clin. Neurol. Neurosurg. 110, 763–773. doi: 10.1016/j.clineuro.2008.05.013
Balu, D., Karstens, A. J., Loukenas, E., Maldonado Weng, J., York, J. M., Valencia-Olvera, A. C., et al. (2019). The role of APOE in transgenic mouse models of AD. Neurosci. Lett. 707:134285. doi: 10.1016/j.neulet.2019.134285
Bedlack, R. S., Strittmatter, W. J., and Morgenlander, J. C. (2000). Apolipoprotein E and neuromuscular disease: a critical review of the literature. Arch. Neurol. 57, 1561–1565.
Belloy, M. E., Napolioni, V., and Greicius, M. D. (2019). A quarter century of APOE and Alzheimer’s disease: progress to date and the path forward. Neuron 101, 820–838. doi: 10.1016/j.neuron.2019.01.056
Bertrand, E., Lechowicz, W., Szpak, G. M., Lewandowska, E., Dymecki, J., and Wierzba-Bobrowicz, T. (2004). Limbic neuropathology in idiopathic Parkinson’s disease with concomitant dementia. Folia Neuropathol. 42, 141–150.
Bohne, P., Schwarz, M. K., Herlitze, S., and Mark, M. D. (2019). A new projection from the deep cerebellar nuclei to the hippocampus via the Ventrolateral and Laterodorsal Thalamus in mice. Front. Neural Circ. 13:51. doi: 10.3389/fncir.2019.00051
Calabrese, E., Badea, A., Cofer, G., Qi, Y., and Johnson, G. A. (2015). A diffusion mri tractography connectome of the mouse brain and comparison with neuronal tracer data. Cereb. Cortex 25, 4628–4637. doi: 10.1093/cercor/bhv121
Colton, C. A., Vitek, M. P., Wink, D. A., Xu, Q., Cantillana, V., Previti, M. L., et al. (2006). NO synthase 2 (NOS2) deletion promotes multiple pathologies in a mouse model of Alzheimer’s disease. Proc. Natl. Acad. Sci. U.S.A. 103, 12867–12872. doi: 10.1073/pnas.0601075103
Colton, C. A., Wilson, J. G., Everhart, A., Wilcock, D. M., Puolivali, J., Heikkinen, T., et al. (2014). mNos2 deletion and human NOS2 replacement in Alzheimer disease models. J. Neuropathol. Exp. Neurol. 73, 752–769. doi: 10.1097/NEN.0000000000000094
De Strooper, B., and Karran, E. (2016). The cellular phase of Alzheimer’s disease. Cell 164, 603–615.
Devanand, D. P., Pradhaban, G., Liu, X., Khandji, A., De Santi, S., Segal, S., et al. (2007). Hippocampal and entorhinal atrophy in mild cognitive impairment: prediction of Alzheimer disease. Neurology 68, 828–836. doi: 10.1212/01.wnl.0000256697.20968.d7
Duda, J. E., Giasson, B. I., Mabon, M. E., Lee, V. M., and Trojanowski, J. Q. (2002). Novel antibodies to synuclein show abundant striatal pathology in Lewy body diseases. Ann. Neurol. 52, 205–210. doi: 10.1002/ana.10279
Femminella, G. D., Taylor-Davies, G., Scott, J., and Edison, P. (2018). Do cardiometabolic risk factors influence amyloid, tau, and neuronal function in APOE4 carriers and non-carriers in Alzheimer’s disease trajectory? J. Alzheimer’s Dis. 64, 981–993. doi: 10.3233/JAD-180365
Fischer, F. U., Wolf, D., Scheurich, A., and Fellgiebel, A. (2015). Altered whole-brain white matter networks in preclinical Alzheimer’s disease. Neuroimage Clin. 8, 660–666. doi: 10.1016/j.nicl.2015.06.007
Friston, K. J., Worsley, K. J., Frackowiak, R. S., Mazziotta, J. C., and Evans, A. C. (1994). Assessing the significance of focal activations using their spatial extent. Hum. Brain Mapp. 1, 210–220. doi: 10.1002/hbm.460010306
Garyfallidis, E., Brett, M., Amirbekian, B., Rokem, A., van der Walt, S., Descoteaux, M., et al. (2014). Dipy, a library for the analysis of diffusion MRI data. Front. Neuroinform. 8:8. doi: 10.3389/fninf.2014.00008
Garyfallidis, E., Brett, M., Correia, M. M., Williams, G. B., and Nimmo-Smith, I. (2012). QuickBundles, a method for tractography simplification. Front. Neurosci. 6:175. doi: 10.3389/fnins.2012.00175
Garyfallidis, E., Cote, M. A., Rheault, F., Sidhu, J., Hau, J., Petit, L., et al. (2018). Recognition of white matter bundles using local and global streamline-based registration and clustering. Neuroimage 170, 283–295. doi: 10.1016/j.neuroimage.2017.07.015
Garyfallidis, E., Ocegueda, O., Wassermann, D., and Descoteaux, M. (2015). Robust and efficient linear registration of white-matter fascicles in the space of streamlines. Neuroimage 117, 124–140. doi: 10.1016/j.neuroimage.2015.05.016
Hamilton, R. L. (2000). Lewy bodies in Alzheimer’s disease: a neuropathological review of 145 cases using alpha-synuclein immunohistochemistry. Brain Pathol. 10, 378–384. doi: 10.1111/j.1750-3639.2000.tb00269.x
Hansen, L., Salmon, D., Galasko, D., Masliah, E., Katzman, R., DeTeresa, R., et al. (1990). The Lewy body variant of Alzheimer’s disease: a clinical and pathologic entity. Neurology 40, 1–8.
Harding, A. J., and Halliday, G. M. (2001). Cortical lewy body pathology in the diagnosis of dementia. Acta Neuropathol. 102, 355–363.
Heise, V., Filippini, N., Trachtenberg, A. J., Suri, S., Ebmeier, K. P., and Mackay, C. E. (2014). Apolipoprotein E genotype, gender and age modulate connectivity of the hippocampus in healthy adults. Neuroimage 98, 23–30. doi: 10.1016/j.neuroimage.2014.04.081
Hoos, M. D., Vitek, M. P., Ridnour, L. A., Wilson, J., Jansen, M., Everhart, A., et al. (2014). The impact of human and mouse differences in NOS2 gene expression on the brain’s redox and immune environment. Mol. Neurodegener. 9:50. doi: 10.1186/1750-1326-9-50
Huang, Y. (2010). Aβ-independent roles of apolipoprotein E4 in the pathogenesis of Alzheimer’s disease. Trends Mol. Med. 16, 287–294. doi: 10.1016/j.molmed.2010.04.004
Huynh, T. V., Davis, A. A., Ulrich, J. D., and Holtzman, D. M. (2017). Apolipoprotein E and Alzheimer’s disease: the influence of apolipoprotein E on amyloid-beta and other amyloidogenic proteins. J. Lipid Res. 58, 824–836. doi: 10.1194/jlr.R075481
Jack, CR Jr, Petersen, R. C., Xu, Y. C., O’Brien, P. C., Smith, G. E., Ivnik, R. J., et al. (1999). Prediction of AD with MRI-based hippocampal volume in mild cognitive impairment. Neurology 52, 1397–1403.
Josephs, K. A., Murray, M. E., Tosakulwong, N., Whitwell, J. L., Knopman, D. S., Machulda, M. M., et al. (2017). Tau aggregation influences cognition and hippocampal atrophy in the absence of beta-amyloid: a clinico-imaging-pathological study of primary age-related tauopathy (PART). Acta Neuropathol. 133, 705–715. doi: 10.1007/s00401-017-1681-2
Kan, M. J., Lee, J. E., Wilson, J. G., Everhart, A. L., Brown, C. M., Hoofnagle, A. N., et al. (2015). Arginine deprivation and immune suppression in a mouse model of Alzheimer’s disease. J. Neurosci. 35, 5969–5982. doi: 10.1523/JNEUROSCI.4668-14.2015
Koelewijn, L., Lancaster, T. M., Linden, D., Dima, D. C., Routley, B. C., Magazzini, L., et al. (2019). Oscillatory hyperactivity and hyperconnectivity in young APOE-varepsilon4 carriers and hypoconnectivity in Alzheimer’s disease. eLife 8:e36011. doi: 10.7554/eLife.36011
Korthauer, L. E., Zhan, L., Ajilore, O., Leow, A., and Driscoll, I. (2018). Disrupted topology of the resting state structural connectome in middle-aged APOE ε4 carriers. Neuroimage 178, 295–305. doi: 10.1016/j.neuroimage.2018.05.052
Liang, K. J., and Carlson, E. S. (2019). Resistance, vulnerability and resilience: a review of the cognitive cerebellum in aging and neurodegenerative diseases. Neurobiol. Learn. Mem. doi: 10.1016/j.nlm.2019.01.004 [Epub ahead of print].
Liao, F., Yoon, H., and Kim, J. (2017). Apolipoprotein E metabolism and functions in brain and its role in Alzheimer’s disease. Curr. Opin. Lipidol. 28, 60–67. doi: 10.1097/MOL.0000000000000383
Luo, X., Qiu, T., Jia, Y., Huang, P., Xu, X., Yu, X., et al. (2017). Intrinsic functional connectivity alterations in cognitively intact elderly APOE ε4 carriers measured by eigenvector centrality mapping are related to cognition and CSF biomarkers: a preliminary study. Brain Imaging Behav. 11, 1290–1301. doi: 10.1007/s11682-016-9600-z
Madden, D. J., Bennett, I. J., and Song, A. W. (2009). Cerebral white matter integrity and cognitive aging: contributions from diffusion tensor imaging. Neuropsychol. Rev. 19, 415–435. doi: 10.1007/s11065-009-9113-2
Mandyam, C. D. (2013). The interplay between the hippocampus and amygdala in regulating aberrant hippocampal neurogenesis during protracted abstinence from alcohol dependence. Front. Psychiatry 4:61. doi: 10.3389/fpsyt.2013.00061
Masliah, E., Mallory, M., DeTeresa, R., Alford, M., and Hansen, L. (1993). Differing patterns of aberrant neuronal sprouting in Alzheimer’s disease with and without Lewy bodies. Brain Res. 617, 258–266. doi: 10.1016/0006-8993(93)91093-8
McGaugh, J. L., Cahill, L., and Roozendaal, B. (1996). Involvement of the amygdala in memory storage: interaction with other brain systems. Proc. Natl. Acad. Sci. U.S.A. 93, 13508–13514. doi: 10.1073/pnas.93.24.13508
Pankratz, N., Byder, L., Halter, C., Rudolph, A., Shults, C. W., Conneally, P. M., et al. (2006). Presence of an APOE4 allele results in significantly earlier onset of Parkinson’s disease and a higher risk with dementia. Mov. Disord. 21, 45–49. doi: 10.1002/mds.20663
Piers, R. J. (2018). Structural brain volume differences between cognitively intact ApoE4 carriers and non-carriers across the lifespan. Neural. Regen. Res. 13, 1309–1312. doi: 10.4103/1673-5374.235408
Reiter, K., Alpert, K. I., Cobia, D. J., Kwasny, M. J., Morris, J. C., Csernansky, J. C., et al. (2012). Cognitively normal individuals with AD parents may be at risk for developing aging-related cortical thinning patterns characteristic of AD. Neuroimage 61, 525–532. doi: 10.1016/j.neuroimage.2012.03.083
Sala Frigerio, C., Wolfs, L., Fattorelli, N., Thrupp, N., Voytyuk, I., Schmidt, I., et al. (2019). The major risk factors for Alzheimer’s disease: age, sex, and genes modulate the microglia response to abeta plaques. Cell Rep. 27, 1293.e6–1306.e6. doi: 10.1016/j.celrep.2019.03.099
Schellenberg, G. D. (1995). Genetic dissection of Alzheimer disease, a heterogeneous disorder. Proc. Natl. Acad. Sci. U.S.A. 92, 8552–8559. doi: 10.1073/pnas.92.19.8552
Serrano-Pozo, A., Frosch, M. P., Masliah, E., and Hyman, B. T. (2011). Neuropathological alterations in Alzheimer disease. Cold Spring Harb. Perspect. Med. 1:a006189. doi: 10.1101/cshperspect.a006189
Timmann, D., and Daum, I. (2007). Cerebellar contributions to cognitive functions: a progress report after two decades of research. Cerebellum 6, 159–162. doi: 10.1080/14734220701496448
Timmann, D., Drepper, J., Frings, M., Maschke, M., Richter, S., Gerwig, M., et al. (2010). The human cerebellum contributes to motor, emotional and cognitive associative learning. A Review. Cortex 46, 845–857. doi: 10.1016/j.cortex.2009.06.009
Torok, J., Maia, P. D., Powell, F., Pandya, S., and Raj, A. Alzheimer’s Disease, et al. (2018). A method for inferring regional origins of neurodegeneration. Brain 141, 863–876. doi: 10.1093/brain/awx371
Trojanowski, J. Q., Goedert, M., Iwatsubo, T., and Lee, V. M. (1998). Fatal attractions: abnormal protein aggregation and neuron death in Parkinson’s disease and Lewy body dementia. Cell Death Differ. 5, 832–837. doi: 10.1038/sj.cdd.4400432
Tudorache, I. F., Trusca, V. G., and Gafencu, A. V. (2017). Apolipoprotein E – a multifunctional protein with implications in various pathologies as a result of its structural features. Comput. Struct. Biotechnol. J. 15, 359–365. doi: 10.1016/j.csbj.2017.05.003
Vitek, M. P., Brown, C., Xu, Q., Dawson, H., Mitsuda, N., and Colton, C. A. (2006). Characterization of NO and cytokine production in immune-activated microglia and peritoneal macrophages derived from a mouse model expressing the human NOS2 gene on a mouse NOS2 knockout background. Antioxid. Redox. Signal. 8, 893–901. doi: 10.1089/ars.2006.8.893
Wang, N., Anderson, R. J., Badea, A., Cofer, G., Dibb, R., Qi, Y., et al. (2018). Whole mouse brain structural connectomics using magnetic resonance histology. Brain Struct. Funct. 223, 4323–4335. doi: 10.1007/s00429-018-1750-x
Wang, Z., Dai, Z., Shu, H., Liao, X., Yue, C., Liu, D., et al. (2017). APOE Genotype effects on intrinsic brain network connectivity in patients with amnestic mild cognitive impairment. Sci. Rep. 7:397. doi: 10.1038/s41598-017-00432-0
Wiesmann, M., Zerbi, V., Jansen, D., Haast, R., Lutjohann, D., Broersen, L. M., et al. (2016). A dietary treatment improves cerebral blood flow and brain connectivity in aging apoE4 mice. Neural. Plast. 2016:6846721. doi: 10.1155/2016/6846721
Wilcock, D. M., Lewis, M. R., Van Nostrand, W. E., Davis, J., Previti, M. L., Gharkholonarehe, N., et al. (2008). Progression of amyloid pathology to Alzheimer’s disease pathology in an amyloid precursor protein transgenic mouse model by removal of nitric oxide synthase 2. J. Neurosci. 28, 1537–1545. doi: 10.1523/jneurosci.5066-07.2008
Keywords: mouse model, Alzheimer’s disease, neurodegeneration, magnetic resonance imaging, tractography, tract based analysis, morphometric, diffusion tensor (DT) MRI
Citation: Badea A, Wu W, Shuff J, Wang M, Anderson RJ, Qi Y, Johnson GA, Wilson JG, Koudoro S, Garyfallidis E, Colton CA and Dunson DB (2019) Identifying Vulnerable Brain Networks in Mouse Models of Genetic Risk Factors for Late Onset Alzheimer’s Disease. Front. Neuroinform. 13:72. doi: 10.3389/fninf.2019.00072
Received: 05 July 2019; Accepted: 13 November 2019;
Published: 10 December 2019.
Edited by:
Emmanuel L. Barbier, Institut National de la Santé et de la Recherche Médicale (INSERM), FranceReviewed by:
Marc Dhenain, Centre National de la Recherche Scientifique (CNRS), FranceChung-Chuan Lo, National Tsing Hua University, Taiwan
Copyright © 2019 Badea, Wu, Shuff, Wang, Anderson, Qi, Johnson, Wilson, Koudoro, Garyfallidis, Colton and Dunson. This is an open-access article distributed under the terms of the Creative Commons Attribution License (CC BY). The use, distribution or reproduction in other forums is permitted, provided the original author(s) and the copyright owner(s) are credited and that the original publication in this journal is cited, in accordance with accepted academic practice. No use, distribution or reproduction is permitted which does not comply with these terms.
*Correspondence: Alexandra Badea, YWxleGFuZHJhLmJhZGVhQGR1a2UuZWR1
†These authors have contributed equally to this work
‡These authors share senior authorship