 Eilidh MacNicol1*
 Paul Wright2
 Eugene Kim1
 Irene Brusini3,4
 Oscar Esteban5,6
 Camilla Simmons1
 Federico E. Turkheimer1
 Diana Cash1
- 1Department of Neuroimaging, Institute of Psychiatry, Psychology & Neuroscience, King's College London, London, United Kingdom
- 2School of Biomedical Engineering and Imaging Sciences, Faculty of Life Sciences & Medicine, King's College London, London, United Kingdom
- 3Department of Biomedical Engineering and Health Systems, KTH Royal Institute of Technology, Stockholm, Sweden
- 4Department of Neurobiology, Care Sciences and Society, Karolinska Institute, Stockholm, Sweden
- 5Department of Psychology, Stanford University, Stanford, CA, United States
- 6Department of Radiology, Lausanne University Hospital and University of Lausanne, Lausanne, Switzerland
Age-specific resources in human MRI mitigate processing biases that arise from structural changes across the lifespan. There are fewer age-specific resources for preclinical imaging, and they only represent developmental periods rather than adulthood. Since rats recapitulate many facets of human aging, it was hypothesized that brain volume and each tissue's relative contribution to total brain volume would change with age in the adult rat. Data from a longitudinal study of rats at 3, 5, 11, and 17 months old were used to test this hypothesis. Tissue volume was estimated from high resolution structural images using a priori information from tissue probability maps. However, existing tissue probability maps generated inaccurate gray matter probabilities in subcortical structures, particularly the thalamus. To address this issue, gray matter, white matter, and CSF tissue probability maps were generated by combining anatomical and signal intensity information. The effects of age on volumetric estimations were then assessed with mixed-effects models. Results showed that herein estimation of gray matter volumes better matched histological evidence, as compared to existing resources. All tissue volumes increased with age, and the tissue proportions relative to total brain volume varied across adulthood. Consequently, a set of rat brain templates and tissue probability maps from across the adult lifespan is released to expand the preclinical MRI community's fundamental resources.
1. Introduction
Animal models of aging are valuable for understanding age-related brain changes. The process of physiological and cognitive decline with increasing age is near-universal in mammals (Morrison and Baxter, 2012); for example, during their lifespan, rodents spontaneously demonstrate age-related cellular changes in regions susceptible to aging in humans (Gallagher and Nicolle, 1993). Researchers can also manipulate the rate or quality of aging with dietary restriction (Carlson and Hoelzel, 1946) or environmental enrichment (Kempermann, 2019), while genetic and environmental confounds can be robustly controlled compared to human studies. Crucially, this control over experimental settings affords findings which are expected to generalize across species (e.g., to humans) when using homologous methods.
One such method is MRI: in theory, its non-invasive application is equivalent in humans and other animals. However, human brain MRI is a more mature field than its preclinical equivalent (i.e., MRI of experimental animals); hence the latter has fewer foundational resources and software tools. For example, popular neuroimaging toolboxes such as SPM (Ashburner et al., 2014) or FSL (Jenkinson et al., 2012) assume human MRI data as input and rely heavily on prior information. Prior information can take the form of, e.g., reference images, which are often the average of a representative sample and known as templates; and tissue probability maps (TPMs), which use probabilistic classifications of voxels to extract biologically meaningful classes. Such information is population-specific and does not generalize across species. For instance, compared to human brains, rodent brains are elongated along the coronal axis, have a smaller proportion of white matter (WM), and do not have cortical folding.
Species-specific resources, including templates and TPMs, facilitate translation of optimized human imaging protocols to preclinical imaging, but age-specific adult rat resources are not yet available. Human brain morphology is known to change with age (Raz and Rodrigue, 2006), so template choice is non-trivial. For example, registering a child's MR image to an adult template induces inter-subject variability (Fonov et al., 2009), while population-specific templates reduce such bias in studies of older adults (Huang et al., 2010; Fillmore et al., 2015). Age-specific rat MRI resources are available for developmental studies until postnatal day 80 (Calabrese et al., 2013; Rumple et al., 2013), which is unsurprising given the accelerated change within this period. However, there are no rat MRI resources available to reflect age-specific brain changes that likely occur in adulthood and old age. Moreover, only three of the adult rat templates have associated TPMs. Valdés-Hernández et al. (2011) generated the first set by assigning tissue class from the image intensity distribution, which incorrectly classifies the thalamus as WM. The SIGMA set (Barriere et al., 2019) was derived from the Valdés-Hernández et al. (2011) TPMs and, although the template was improved with respect to field of view and contrast-to-noise ratio, the thalamic error in the TPMs persisted. The most recent set (Goerzen et al., 2020) applied an atlas-based approach that rectifies this error, but it is derived from a less commonly used Fischer344 strain. As the structural similarity between laboratory rat strains is unknown, application to other strains requires validation.
This report addresses two aims: first, can classification of thalamic gray matter (GM) be improved for Sprague-Dawley rats by creating new adult rat MRI resources? New TPMs were generated by combining anatomical prior knowledge and signal intensity information, rather than relying purely based on signal intensity. The resulting TPMs were compared to existing resources by extracting GM volume (GMV) estimates from a thalamic region of interest (ROI) and to histological sections of an adult rat thalamus. The second aim was to test if the hypothesized volumetric changes occur in a rat model of aging. Total intracranial volume (TIV) and its constituent tissue ratios were estimated from a longitudinal study of the adult lifespan. The resources detailed herein have been openly released, equipping researchers with reliable prior knowledge to integrate into their workflows.
2. Methods and Materials
2.1. Animals
Animal experiments were in accordance with the UK Home Office Animals (Scientific Procedures) Act (1986) and were approved by the King's College London ethical review committee. The RESILIENT study followed male Sprague-Dawley rats (N = 72) across a maximum of four scanning sessions at 3, 5, 11, and 17 months old, which approximately correspond to late adolescence, young adulthood, middle age, and the beginning of senescence (Quinn, 2005). Rats (Charles River, UK) were received at 1-month-old ± 4 days and group-housed under standard light (12:12 light:dark), temperature (21 ± 2°C), and humidity (55 ± 15%) conditions with free access to water. At each session, the rats underwent a battery of behavior tests and a comprehensive MRI protocol detailed elsewhere (MacNicol, 2021). Exclusion criteria included presenting with health problems (N = 13; e.g., weight more than 850 g, diabetes, arthritis, or tumor growth) or if rats could not be socially-housed (N = 12) since isolation was expected to be a confound. One rat was excluded after data acquisition due to a latent irregular brain mass.
The RESILIENT study primarily aimed to assess lifestyle modifications in aging, so a group (N = 24) was subjected to life-long environmental enrichment and dietary restriction (EEDR) after the first scan, while the remaining rats served as controls for resource generation (N = 24) and testing (N = 24). The EEDR treatment and its effects are discussed elsewhere (MacNicol, 2021). Briefly, environments were enriched with extra toys and food was removed on three non-consecutive days a week for 24 h, with ad libitum access to standard chow on non-fasting days. Control rats were kept in standard caging, enriched with a cardboard tube and wooden chewsticks, with ad libitum access to standard chow. However, relevant to the current report, the RESILIENT cohort showed more heterogeneous aging outcomes than those observed in standard cohorts of laboratory rats, and hence are relevant to a multitude of rat models. Based on the exclusion criteria and groups described here, the results presented are based on the following sample sizes at each session: NEEDR = 24, 24, 23, 21; Nresource = 24, 24, 16, 9; Ntesting = 24, 22, 17, 9.
2.2. Image Acquisition
Anesthesia was induced with 5% isoflurane in a 30:70 mixture of oxygen in medical air at 1.4 liters per minute and maintained on 2–2.5% isoflurane during scanning (2–3 h). Body temperature was maintained at 37 ± 1oC using an embedded water heating system and thermostatically controlled hot air paired to a rectal thermometer. Physiology monitoring tools (thermometer, pulse oximeter, and respiration balloon) were made by Small Animal Instruments, Inc., NY, USA. The rats were scanned in a 9.4 T Bruker Biospec MR scanner with an 86-mm volume coil for transmission and a four-channel array receiver coil. Protocols were implemented using Paravision 6.0.1 (Bruker Corp., Ettlingen, Germany). High-resolution anatomical images were acquired with a 3D MP2RAGE sequence: repetition time (TR) = 9,000 ms; inversion times (TIs) = 900, 3,500 ms; flip angle = 7o, 9o; echo time (TE) = 2.695 ms; echo TR = 7.025 ms; matrix = 160 × 160 × 128; and 0.19 mm isotropic voxel size. A 3D ultra-short echo (UTE) reference scan was also acquired with the following parameters: TE = 8 μs, TR = 3.75 ms, flip angle = 4o, matrix = 128 × 128 × 128, and 0.45 mm isotropic voxel size.
2.3. Image Preprocessing
The MP2RAGE images were processed using QUantitative Imaging Tools v2.0.2 (Wood, 2018). The complex image from each coil channel was combined using the UTE reference image and the COMPOSER method (Robinson et al., 2017). The combined image was input to qi_mp2rage, which uses the signal at both inversion times to produce a T1 map and a T1-weighted (T1w) image that is inherently corrected for B1 field inhomogeneity, which causes non-uniformity of the signal intensity across an image.
2.4. Resource Generation
Resource generation control and EEDR T1w images within a session were co-registered to create four age-specific, average templates (Figure 1A) using ANTs (Avants et al., 2010). Each template was normalized to the Waxholm reference (Papp et al., 2014), an ex vivo MR image from a Sprague-Dawley rat, using antsRegistration (Avants et al., 2011a), facilitating the projection of the Waxholm atlas to the age-specific template space. Non-brain tissue was removed with a modified implementation of artsBrainExtraction, a rodent-specific atlas-based algorithm (MacNicol et al., 2021) developed for T2-weighted (T2w) images. The Waxholm reference was the target instead of the default Fischer344 template, and redundant steps for MP2RAGE images (denoising and inhomogeneity correction) were omitted. Brain-extracted T1w images were normalized to the appropriate brain-extracted session template. Jacobian determinant maps, which quantify the voxelwise volume changes resulting from the spatial normalization to the template, were calculated for each individual's transformation.
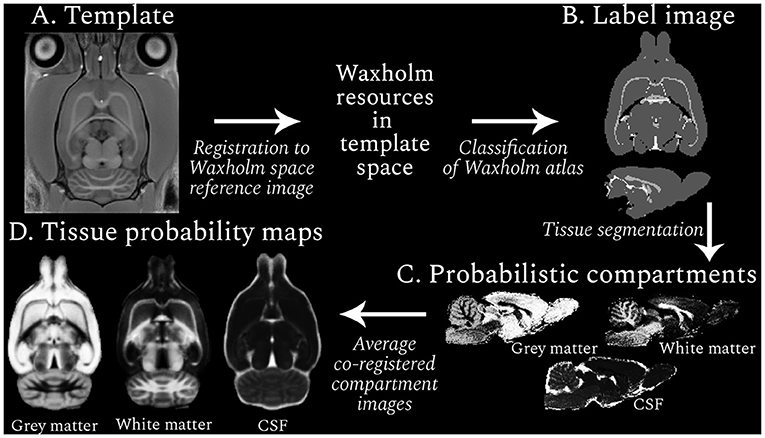
Figure 1. Resource generation workflow (clockwise from top left). An example RESILIENT template is shown (A), which was registered to the Waxholm space reference image to facilitate use of the associated resources. Regions in the Waxholm space atlas were designated as one of three tissue types, and the resulting label image (B) was used to generate probabilistic compartment images for each subject (C). The co-registered compartments were averaged across subjects to produce tissue probability maps (D). The voxel intensity in the probabilistic images represents the likelihood, from 0 (black) to 1 (white), of the presence of a given tissue.
Regions from the Waxholm atlas third edition (Osen et al., 2019) were categorized as GM (1), WM (2), or cerebrospinal fluid (CSF; 3). To reduce the impact of partial volume effects, regions with non-homogeneous tissue compositions were excluded. The resulting mapping between regions and tissue types provided a tissue type atlas (or label image; Figure 1B) that was projected to the subject-space. Voxels within a brain mask were segmented into three compartments with ANTs Atropos (Avants et al., 2011b), leveraging information from the label and T1w images. Thus tissue probability values were propagated to regions not covered by the label image but within the mask, generating probabilistic compartment images per subject for each session (Figure 1C). Notably, the prior weighting was minimized so the label image was used for the initial Gaussian mixture model and the image intensity information was used until the segmentation reached convergence. Compartment images were qualitatively assessed before transformation to the session template and averaging across subjects to create age-specific TPMs (Figure 1D).
2.5. Histology
A control rat was euthanized for histological processing by transcardiac perfusion with heparinized saline, followed by 4% paraformaldehyde. Brain tissue was cryoprotected in 30% sucrose before sectioning at 35 μm on a freezing microtome. Luxol fast blue (LFB) staining was performed on sections mounted onto microscope slides, as previously described (Wood et al., 2016). LFB stained sections were scanned with an Olympus VS120 slide scanner at x40 magnification (Figure 2A). Each section image was transformed to gray-scale for manual delineation of WM and ventricular ROIs by an expert (author DC). The mean () and standard deviation (SD) of pixel intensities were calculated from each ROI (Figure 2B). Pixels that were likely to represent GM, defined as intensities4 between 3 SD and 3 SD, were binarized so pixel intensities within this window were valued 1, while all pixels were valued 0 (Figure 2C).
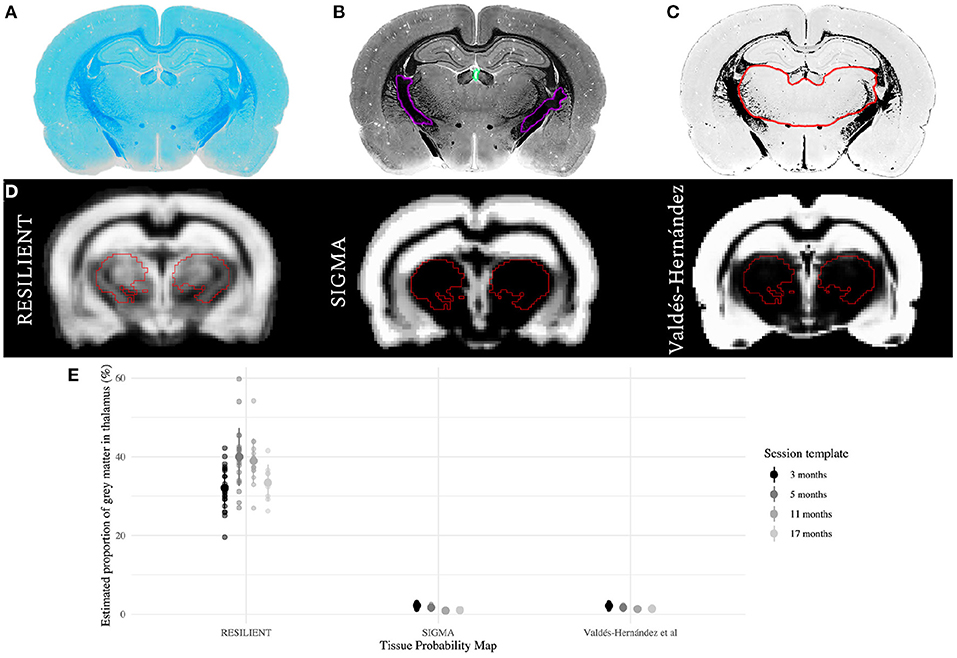
Figure 2. Comparison of thalamic gray matter (GM) estimates. (A–C) Qualitative histological estimation of thalamic GM. A section stained for myelin with Luxol Fast Blue (A) was transformed to gray-scale (B), and the mean () and standard deviation (SD) of pixel intensities were calculated within manually-delineated white matter (WM; purple) and ventricular (turquoise) regions of interest (ROI). The section was binarized (C) so that pixels which likely represent GM were valued 1 (white), while all others were valued 0 (black). The hand-delineated thalamus ROI (red overlay) is predominantly GM. (D) The RESILIENT TPM has higher prior probabilities of GM within the thalamic ROI (red overlay), derived from the SIGMA atlas, compared with existing resources. (E) GM estimates as a proportion of thalamic volume for each TPM set. The mean ± SD of estimates are shown for each set.
2.6. Analysis
2.6.1. Thalamic Gray Matter Volume Estimates
The age-specific templates were normalized to the SIGMA and Valdés-Hernández templates using antsRegistration, and the TPMs were projected to each RESILIENT session space. Brain-extracted images from the testing controls were transformed to the appropriate age-specific template and segmented with each TPM set using Atropos with identical parameters. The resulting compartment images were multiplied with the Jacobian determinant maps to preserve voxelwise tissue volume (e.g., GMV) information. The bilateral thalamus binary mask, created from the SIGMA anatomical atlas and projected to each age-specific template space, is overlaid on the GM TPMs in Figure 2D. Jacobian-modulated GM compartment values within the mask were summed and multiplied by the voxel volume. The Jacobian determinants within a subject's thalamic mask were summed to report the thalamic volume fraction.
2.6.2. Tissue Volume and Proportional Estimates
Tissue volume estimates were retrieved from the EEDR and resource generation groups to test if brain volumes change with age in the adult rat. The first session template was used as a common space since some subjects did not have images from later sessions. Thus, within-subject transformations were generated from non-linear registration of T1w images from consecutive sessions. Each T1w image was projected to the first session template by concatenating the within-subject and subject-to-template transformations before segmentation with the first session TPMs using Atropos. GM, WM, and CSF volumes were estimated by multiplying voxel volume and the sum of voxel values within a brain mask of the corresponding Jacobian-modulated compartment image. The volume estimates were normalized to each subject's TIV, defined as the sum of all three compartments, to test if brain volume proportions vary in adulthood.
2.6.3. Statistics
Linear mixed-effects models were fit with R v3.6.2 using lme4 v1.1-23 (Bates et al., 2015) and lmerTest v3.1-2 (Kuznetsova et al., 2017) packages. Thalamic GMV estimates were predicted by the fixed effects of session and TPM set, while also controlling for the subjects' random effects. GM, WM, CSF, and total intracranial volumes were predicted from age using separate models with session as the fixed effect and controlling for the random effects of subject. Proportions were predicted by the fixed effects of session, tissue type, and the interaction between them, while also controlling for the random effect of subjects. Model estimates are reported as β (or Δβ) ± standard error. Estimated marginal means (EMMs) were calculated using emmeans v1.4.7 (Lenth, 2020) and consecutive sessions' estimates were compared. Reported p-values were adjusted for multiple comparisons using a multivariate t-distribution.
3. Results
3.1. Release of Prior Information for Rat Brains in Their Adulthood
The RESILIENT templates and associated resources are available under a Creative Commons Attribution 4.0 license from the open science framework (osf.io/U4GTW) and TemplateFlow (Ciric et al., 2021), a version-controlled repository that faciliates template integration for processing pipelines.
3.2. RESILIENT-Derived Thalamic Gray Matter Estimates Differ From Existing Resources
Thalamic GM estimates derived from the RESILIENT TPMs had greater means and standard deviations than those from either existing TPM (Figure 2E). The RESILIENT intercept (35.25 ± 0.60%), representing the 3 month estimate, was higher than either existing TPM intercepts (βRESILIENT - βVH = 34.57 ± 0.64%;βRESILIENT - βSIGMA = 34.68 ± 0.64%; both p < 0.0001). The RESILIENT estimates also varied by session: the estimates from the 5 and 11 month TPMs were higher than at 3 months (β5 - β3 = 2.34 ± 0.65%, p = 0.0004; β11 - β3 = 1.60 ± 0.70%, p = 0.0246). There was no significant difference between the first and final session estimates (β17 - β3 = 0.04 ± 0.88%, p = 0.9677).
3.3. Brain Volumes Change Across Adulthood in Rats
TIV (Figure 3A) was estimated as 2540.98 ± 16.36 mm3 at 3 months and the later estimates were greater than the first (β5 - β3 = 152.77 ± 4.11 mm3; β11 - β3 = 333.44 ± 11.38 mm3; β17 - β3 = 425.43 ± 19.59 mm3; all p < 0.0001). The GM estimate (Figure 3B) at 3 months was 1467.95 ± 8.77 mm3, and subsequently increased (β5 - β3 = 49.20 ± 2.59 mm3; β11 - β3 = 126.62 ± 33.62 mm3; β17 - β3 = 151.14 ± 8.72 mm3; all p < 0.0001). WM volume (Figure 3C) was estimated as 606.69 ± 5.85 mm3 at 3 months and thereafter increased (β5 - β3 = 46.18 ± 2.56 mm3; β11 - β3 = 77.32 ± 6.35 mm3; β17 - β3 = 110.46 ± 10.82 mm3; all p < 0.0001). CSF volume (Figure 3D) was estimated as 466.34 ± 6.02 mm3 at 3 months and increased in later sessions (β5 - β3 = 57.39 ± 2.81 mm3; β11 - β3 = 129.85 ± 8.29 mm3; β17 - β3 = 164.63 ± 14.31 mm3; all p < 0.0001). The EMMs (Table 1) consecutively increased in all tissue types.
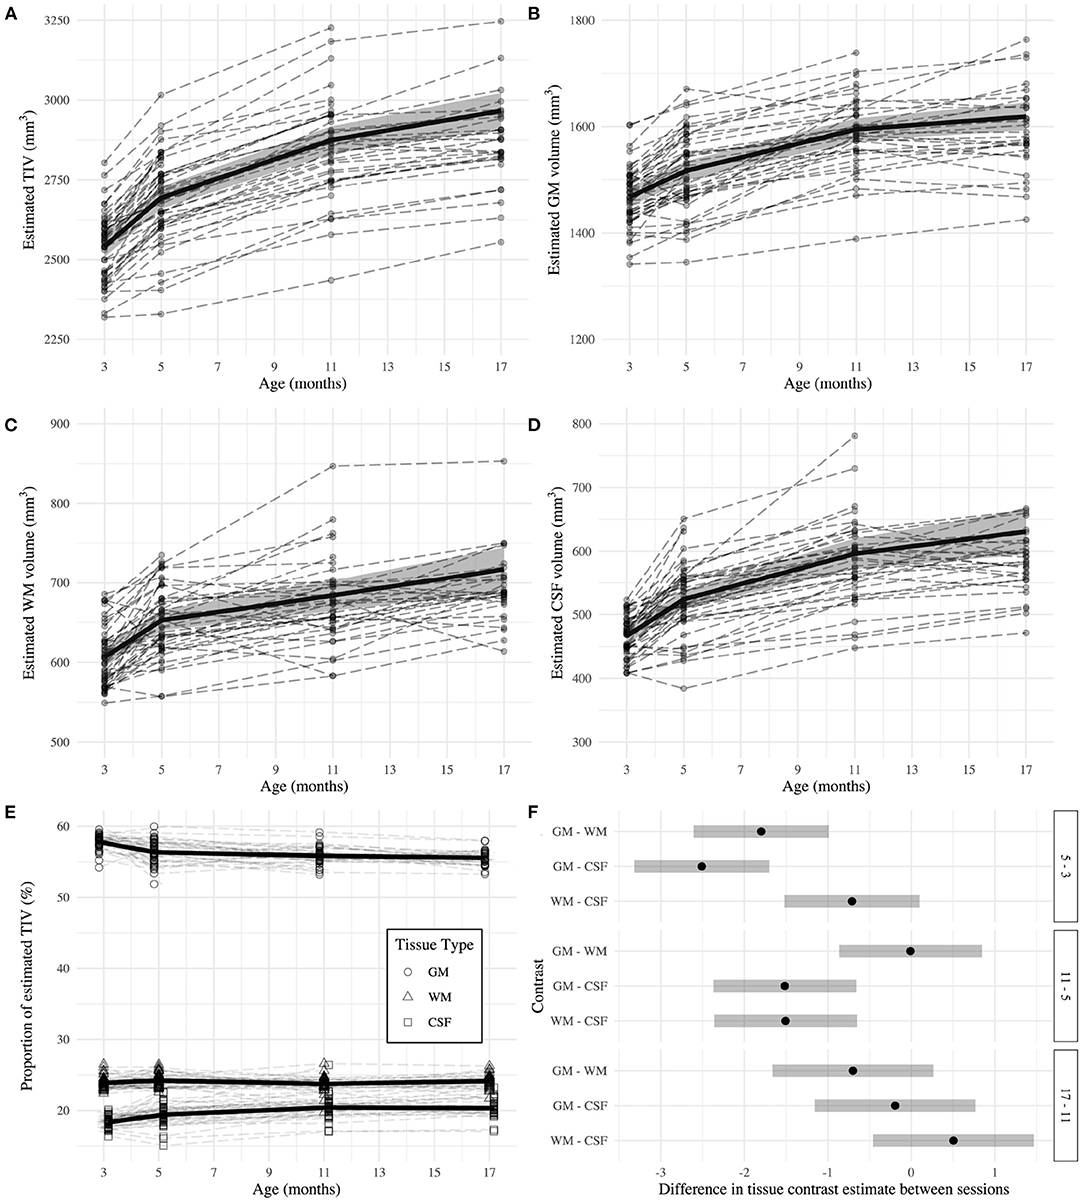
Figure 3. Estimates of total intracranial (A), gray matter (B), white matter (C), and CSF (D) volumes across adulthood in the rat. (E) Relative proportion of tissue volumes with respect to total intracranial volume. The dashed lines represent individual trajectories, while the solid line and background fill connects the mixed-effects model estimated marginal means ± 95% confidence interval of the estimate. (F) Second level contrast plots indicating the size and direction of the difference between contrasts of consecutive sessions for each tissue type. The dots denote the estimate difference and the bars denote the 95% confidence interval of the estimate.
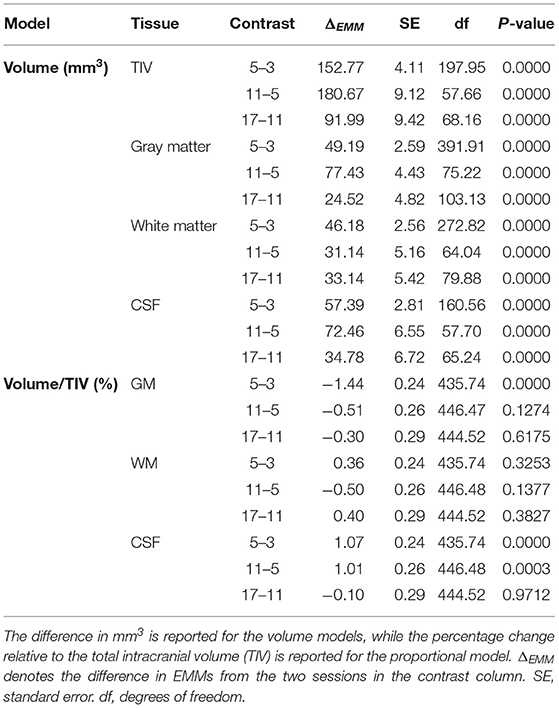
Table 1. Consecutive comparison of the Estimated Marginal Means (EMMs) of the linear mixed-effects models.
3.4. Tissue Proportions Change Across Adulthood in Rats
GM was estimated as 57.79 ± 0.17% of TIV at 3 months, which was higher than the estimate for WM and CSF (βGM - βWM = 33.92 ± 0.24%; βGM - βCSF = 39.44 ± 0.25%; both p < 0.0001). GM proportion decreased compared to baseline at subsequent sessions (β5 - β3 = −1.44 ± 0.24%; β11 - β3 = −1.94 ± 0.26%; β17 - β3 = −2.24 ± 0.28%; all p < 0.0001). However, each tissue had a distinct relationship with age (Figure 3E). The change in WM proportion from baseline was greater than the same difference in GM proportion (βWM:5−3 - βGM:5−3 = 1.80 ± 0.34%; βWM:11−3 - βGM:11−3 = 1.81 ± 0.36%; βWM:17−3 - βGM:17−3 = 2.51 ± 0.39%; all p < 0.0001). The difference from baseline CSF proportion was also greater than the same difference in GM proportion for all comparisons (βCSF:5−3 - βGM:5−3 = 2.51 ± 0.34%; βCSF:11−3 - βGM:11−3 = 4.02 ± 0.36%; βCSF:17−3 - βGM:17−3 = 4.23 ± 0.39%; all p < 0.0001).
From 3 to 5 months, GM proportion decreased while CSF proportion increased (Table 1). CSF proportion further increased between 5 and 11 months. There were no significant differences in WM proportion between any consecutive sessions. Figure 3F demonstrates tissue type differences for consecutive session contrasts. A difference of zero suggests both proportions change at approximately the same rate and direction. Alternatively, positive differences indicate the tissue proportions diverge between sessions, and negative differences indicate convergence. First, GM proportion decreases at the expense of WM and CSF. Between 5 and 11 months, the CSF proportion continues to increase while GM and WM proportions plateau at a similar rate. Between 11 and 17 months, there are no differences in proportional change.
4. Discussion
Age-specific adult rat MRI resources are released for two ends: to improve thalamic GM estimates and to satisfy a shortcoming in the existing resources, since brain volumes were found to change across adulthood.
4.1. RESILIENT Tissue Probability Maps Give Higher Thalamic Gray Matter Estimates
The Valdés-Hernández and SIGMA TPMs estimate thalamic GM proportion between 0.9 and 2.2%, which is very low compared to qualitative histological evidence of myelin staining (Figure 2C), likely caused by minimal GM prior probability in subcortical regions (Figure 2D). In contrast, the RESILIENT TPMs estimate higher thalamic GM proportions, with mean estimates ranging from 30 to 40%. Previous resources relied on histogram thresholding methods to assign tissue classifications, which is fast but problematic for regions with non-homogeneous tissue distribution. Instead, the RESILIENT TPMs provided prior tissue class information by augmenting a popular atlas. However, the RESILIENT estimates still underestimate compared to the qualitative observation. Segmentation with atlas-based TPMs, applied here and by Goerzen et al. (2020), is more accurate than thresholding methods but do not entirely overcome partial volume effects. Voxelwise assignments are inferior to histological validation so future work must test the reliability of atlas-based TPMs based on a ground truth. For instance, could estimating cortical and subcortical GM as separate classes improve segmentation? Nonetheless, by leveraging atlas information and averaging across a large sample, these TPMs provide a favorable approximation of thalamic GM.
4.2. Brain Volumes and Tissue Proportions Change With Age in the Adult Rat
All tissue volumes increased with age but their relative proportion of TIV showed distinct trajectories. For instance, in young adulthood, WM has its largest volume increase but does not change proportion. Conversely, GM and CSF proportions change rapidly from 3 to 5 months, but their largest increase is from 5 to 11 months when proportional changes are slowing down. All brain volumes increase between 11 and 17 months, but the proportions stabilize. While an inverse relationship between GM and CSF proportions is also observed in humans (Narvacan et al., 2017), human GM volume decreases from adolescence and regional WM volume declines begin after middle age (Raz et al., 2005). No volume declines were observed here, but the proportion of GM did decrease from adolescence before plateauing.
Inter-species differences or the study design could explain the observed results. In male young adult humans, GM, WM, and CSF occupy approximately 55, 30, and 15% of TIV, respectively (Taki et al., 2011). In male young adult rats, we estimated marginal mean proportions of 58, 24, and 18%. However, these values are ostensibly still impacted by the thalamic GM underestimation described in the previous section, suggesting the ground truth has even more GM and less WM than our findings. Additionally, GM and WM proportions have been found to decrease ~4 and ~1% respectively in male humans between 20 and 50 years old (Fotenos et al., 2005) but here, GM proportions decreased ~2% between 3 and 17 months and WM decreased ~0.5% between 5 and 11 months. However, the window of structural decline was possibly omitted if the study's conclusion was premature. We estimated that the human equivalent age for the final session, 17 months, would be approximately 60 years old but providing an accurate translation between life stages in humans and rats is challenging; only approximations are provided and the relative duration of life stages differ (Quinn, 2005). Human brain volumes seemingly follow an inverted-U trajectory, reaching peak volume after 50 (Raz et al., 2005). As volume increases slowed from 11 to 17 months, perhaps a longer study window would have captured such a trajectory. For example, 27-month old rats had smaller medial prefrontal cortex, striatal, and hippocampal volumes, and larger ventricles than 14-month old rats (Hamezah et al., 2017). However, these differences were observed in a cross-sectional study which could be confounded by latent cohort effects.
The longitudinal study design used here facilitated the recording of individual brain volume trajectories, but sample size retention is a challenging weakness of longitudinal designs. We addressed these issues using linear mixed-effects models, which are more robust to missing data, but the variability at later sessions could have been reduced with larger cohorts. Another limitation of the present study is that it only included males. Sex differences in age-related declines have been observed in clinically normal human populations (McCarrey et al., 2016), so it is important to study a rodent cohort containing both sexes in the future. Despite its shortcomings, these findings justify further investigation of template choices, particularly for preclinical models of aging. For example, do age-specific templates minimize processing biases in registration quality, or is there an optimal age that is best suited as a registration target?
4.3. Reliable Prior Information for Translational Protocols
This study's anatomical reference used an MP2RAGE sequence, providing both a T1w image and a T1 map from one sequence, maximizing the output for a given scan. Further benefits of MP2RAGE sequences include the redundancy of intensity non-uniformity correction, since MP2RAGE sequences are robust to B1 field inhomogeneity (Marques et al., 2010), and the sensitivity of T1 to tissue myelin content (Lutti et al., 2014), which facilitates differentiation of WM from GM. Thus the quantitative T1 values, and the T1w values that have a monotonic mapping to the quantitative values, obtained from an MP2RAGE sequence may be more closely related to the underlying tissue composition than image intensity values from other T1w or T2w image protocols and using MP2RAGE-derived T1w images for TPM generation and tissue segmentation has generated results that reliably represent the underlying tissue.
We intend to encourage the inclusion of MP2RAGE sequences in preclinical imaging protocols. T1w images are chosen for human MRI segmentation studies because they provide good tissue contrast in a short acquisition time. However, T2w anatomical images are used more frequently in studies involving small animals due to image contrast differences at high field strength and a lesser proportion of WM in rodent brains. Thus, we release complementary MP2RAGE-derived T1 map templates in addition to the T1w templates. Since the spatial distribution of T1 map values is similar to that of T2w images (i.e., CSF has high, WM has low, and GM has intermediate values), we suggest these can be used as pseudo-T2w templates.
4.4. Summary
We deliver MRI resources for the preclinical community, including TPMs that provide improved thalamic GM estimates. Since TPMs are used beyond volume estimates (e.g., in functional MRI denoising), they are necessary for integrating small-animal data into processing workflows designed for human data. We also found age-related changes in brain volume and tissue proportions, relative to TIV, in adult rats. Thus, registration templates for aging studies may require further consideration. Biases from age-related brain compositional changes in human studies are mitigated by using age-specific templates, so we release a set of rat brain MRI templates and TPMs from across adulthood, augmenting preclinical MRI resources.
Data Availability Statement
The datasets presented in this study can be found in online repositories. The names of the repository/repositories and accession number(s) can be found below: the resources generated for this study can be found in a Open Science Framework repository (10.17605/OSF.IO/U4GTW). Image-derived data (i.e., volume estimates) can be found in a separate OSF repository (10.17605/OSF.IO/5QP36).
Ethics Statement
The animal study was reviewed and approved by King's College London Animal Welfare and Ethical Review Body.
Author Contributions
This work was conceptualized by EM and DC as a secondary analysis in a study designed by DC and FT. EM, PW, and OE designed the resource generation. EM, CS, EK, and DC collected the data. EM, EK, and IB contributed to image processing. CS and DC performed the histological quantification. EM and FT designed the statistical analysis. EM performed the statistical analysis and wrote the first draft of the manuscript. All authors contributed to manuscript revision, read, and approved the submitted version.
Funding
The study was funded by the UK Biotechnology and Biological Sciences Research Council [BB/N009088/1]. EM was supported by the UK Medical Research Council [MR/N013700/1] and King's College London as a member of the MRC Doctoral Training Partnership in Biomedical Sciences.
Conflict of Interest
The authors declare that the research was conducted in the absence of any commercial or financial relationships that could be construed as a potential conflict of interest.
Publisher's Note
All claims expressed in this article are solely those of the authors and do not necessarily represent those of their affiliated organizations, or those of the publisher, the editors and the reviewers. Any product that may be evaluated in this article, or claim that may be made by its manufacturer, is not guaranteed or endorsed by the publisher.
Acknowledgments
The authors thank Karen Randall for her expertise and assistance throughout all aspects of the study.
Abbreviations
MRI, magnetic resonance imaging; T1w, T1-weighted; T2w, T2-weighted; TIV, total intracranial volume; GM, gray matter; GMV, gray matter volume; WM, white matter; CSF, cerebrospinal fluid; TPM, Tissue Probability Map; EMM, Estimated Marginal Mean.
References
Ashburner, J., Barnes, G., Chen, C.-C., Daunizeau, J., Flandin, G., Friston, K., et al. (2014). SPM12 Manual. Wellcome Trust Centre for Neuroimaging, London.
Avants, B. B., Tustison, N. J., Song, G., Cook, P. A., Klein, A., and Gee, J. C. (2011a). A reproducible evaluation of ANTs similarity metric performance in brain image registration. Neuroimage 54, 2033–2044. doi: 10.1016/j.neuroimage.2010.09.025
Avants, B. B., Tustison, N. J., Wu, J., Cook, P. A., and Gee, J. C. (2011b). An open source multivariate framework for n-tissue segmentation with evaluation on public data. Neuroinformatics 9, 381–400. doi: 10.1007/s12021-011-9109-y
Avants, B. B., Yushkevich, P., Pluta, J., Minkoff, D., Korczykowski, M., Detre, J., et al. (2010). The optimal template effect in hippocampus studies of diseased populations. Neuroimage 49, 2457–2466. doi: 10.1016/j.neuroimage.2009.09.062
Barriere, D. A., Magalhaes, R., Novais, A., Marques, P., Selingue, E., Geffroy, F., et al. (2019). The SIGMA rat brain templates and atlases for multimodal MRI data analysis and visualization. Nat. Commun. 10:5699. doi: 10.1038/s41467-019-13575-7
Bates, D., Mächler, M., Bolker, B., and Walker, S. (2015). Fitting linear mixed-effects models using lme4. J. Stat. Softw. 67, 1–48. doi: 10.18637/jss.v067.i01
Calabrese, E., Badea, A., Watson, C., and Johnson, G. A. (2013). A quantitative magnetic resonance histology atlas of postnatal rat brain development with regional estimates of growth and variability. Neuroimage 71, 196–206. doi: 10.1016/j.neuroimage.2013.01.017
Carlson, A. J., and Hoelzel, F. (1946). Apparent prolongation of the life span of rats by intermittent fasting. J. Nutr. 31, 363–375. doi: 10.1093/jn/31.3.363
Ciric, R., Thompson, W. H., Lorenz, R., Goncalves, M., MacNicol, E., Markiewicz, C. J., et al. (2021). TemplateFlow: FAIR-sharing of multi-scale, multi-species brain models. bioRxiv. [Preprint]. doi: 10.21203/rs.3.rs-264855/v2
Fillmore, P. T., Phillips-Meek, M. C., and Richards, J. E. (2015). Age-specific MRI brain and head templates for healthy adults from 20 through 89 years of age. Front. Aging Neurosci. 7:44. doi: 10.3389/fnagi.2015.00044
Fonov, V. S., Evans, A. C., McKinstry, R. C., Almli, C., and Collins, D. (2009). Unbiased nonlinear average age-appropriate brain templates from birth to adulthood. Neuroimage 47:S102. doi: 10.1016/S1053-8119(09)70884-5
Fotenos, A. F., Snyder, A., Girton, L., Morris, J., and Buckner, R. (2005). Normative estimates of cross-sectional and longitudinal brain volume decline in aging and AD. Neurology 64, 1032–1039. doi: 10.1212/01.WNL.0000154530.72969.11
Gallagher, M., and Nicolle, M. M. (1993). Animal models of normal aging: relationship between cognitive decline and markers in hippocampal circuitry. Behav. Brain Res. 57, 155–162. doi: 10.1016/0166-4328(93)90131-9
Goerzen, D., Fowler, C., Devenyi, G. A., Germann, J., Madularu, D., Chakravarty, M. M., et al. (2020). An MRI-derived neuroanatomical atlas of the Fischer 344 rat brain. Sci. Rep. 10, 1–13. doi: 10.1038/s41598-020-63965-x
Hamezah, H. S., Durani, L. W., Ibrahim, N. F., Yanagisawa, D., Kato, T., Shiino, A., et al. (2017). Volumetric changes in the aging rat brain and its impact on cognitive and locomotor functions. Exp. Gerontol. 99, 69–79. doi: 10.1016/j.exger.2017.09.008
Huang, C.-M., Lee, S.-H., Hsiao, I.-T., Kuan, W.-C., Wai, Y.-Y., Ko, H.-J., et al. (2010). Study-specific EPI template improves group analysis in functional MRI of young and older adults. J. Neurosci. Methods 189, 257–266. doi: 10.1016/j.jneumeth.2010.03.021
Jenkinson, M., Beckmann, C. F., Behrens, T. E. J., Woolrich, M. W., and Smith, S. M. (2012). FSL. Neuroimage 62, 782–790. doi: 10.1016/j.neuroimage.2011.09.015
Kempermann, G. (2019). Environmental enrichment, new neurons and the neurobiology of individuality. Nat. Rev. Neurosci. 20, 235–245. doi: 10.1038/s41583-019-0120-x
Kuznetsova, A., Brockhoff, P. B., and Christensen, R. H. B. (2017). lmerTest package: tests in linear mixed effects models. J. Stat. Softw. 82, 1–26. doi: 10.18637/jss.v082.i13
Lutti, A., Dick, F., Sereno, M. I., and Weiskopf, N. (2014). Using high-resolution quantitative mapping of R1 as an index of cortical myelination. Neuroimage 93, 176–188. doi: 10.1016/j.neuroimage.2013.06.005
MacNicol, E. (2021). Longitudinal characterisation of healthy ageing in rats using multimodal magnetic resonance imaging (Ph.D. thesis). King's College London, London, United Kingdom. doi: 10.31237/osf.io/3vpyg
MacNicol, E., Ciric, R., Kim, E., Di Censo, D., Cash, D., Poldrack, R., et al. (2021). “Atlas-based brain extraction is robust across rat MRI studies,” in 2021 IEEE 18th International Symposium on Biomedical Imaging (ISBI) (IEEE), 312–315. doi: 10.1109/ISBI48211.2021.9433884
Marques, J. P., Kober, T., Krueger, G., van der Zwaag, W., Van de Moortele, P.-F., and Gruetter, R. (2010). MP2RAGE, a self bias-field corrected sequence for improved segmentation and T1-mapping at high field. Neuroimage 49, 1271–1281. doi: 10.1016/j.neuroimage.2009.10.002
McCarrey, A. C., An, Y., Kitner-Triolo, M. H., Ferrucci, L., and Resnick, S. M. (2016). Sex differences in cognitive trajectories in clinically normal older adults. Psychol. Aging 31:166. doi: 10.1037/pag0000070
Morrison, J. H., and Baxter, M. G. (2012). The ageing cortical synapse: hallmarks and implications for cognitive decline. Nat. Rev. Neurosci. 13, 240–250. doi: 10.1038/nrn3200
Narvacan, K., Treit, S., Camicioli, R., Martin, W., and Beaulieu, C. (2017). Evolution of deep gray matter volume across the human lifespan. Hum. Brain Mapp. 38, 3771–3790. doi: 10.1002/hbm.23604
Osen, K. K., Imad, J., Wennberg, A. E., Papp, E. A., and Leergaard, T. B. (2019). Waxholm Space atlas of the rat brain auditory system: three-dimensional delineations based on structural and diffusion tensor magnetic resonance imaging. Neuroimage 199, 38–56. doi: 10.1016/j.neuroimage.2019.05.016
Papp, E. A., Leergaard, T. B., Calabrese, E., Johnson, G. A., and Bjaalie, J. G. (2014). Waxholm space atlas of the Sprague Dawley rat brain. Neuroimage 97, 374–386. doi: 10.1016/j.neuroimage.2014.04.001
Quinn, R. (2005). Comparing rat's to human's age: how old is my rat in people years? Nutrition 21:775. doi: 10.1016/j.nut.2005.04.002
Raz, N., Lindenberger, U., Rodrigue, K. M., Kennedy, K. M., Head, D., Williamson, A., et al. (2005). Regional brain changes in aging healthy adults: general trends, individual differences and modifiers. Cereb. Cortex 15, 1676–1689. doi: 10.1093/cercor/bhi044
Raz, N., and Rodrigue, K. M. (2006). Differential aging of the brain: patterns, cognitive correlates and modifiers. Neurosci. Biobehav. Rev. 30, 730–748. doi: 10.1016/j.neubiorev.2006.07.001
Robinson, S. D., Dymerska, B., Bogner, W., Barth, M., Zaric, O., Goluch, S., et al. (2017). Combining phase images from array coils using a short echo time reference scan (COMPOSER). Magnet. Reson. Med. 77, 318–327. doi: 10.1002/mrm.26093
Rumple, A., McMurray, M., Johns, J., Lauder, J., Makam, P., Radcliffe, M., et al. (2013). 3-dimensional diffusion tensor imaging (DTI) atlas of the rat brain. PLoS ONE 8:e67334. doi: 10.1371/journal.pone.0067334
Taki, Y., Thyreau, B., Kinomura, S., Sato, K., Goto, R., Kawashima, R., et al. (2011). Correlations among brain gray matter volumes, age, gender, and hemisphere in healthy individuals. PLoS ONE 6:e22734. doi: 10.1371/journal.pone.0022734
Valdes-Hernandez, P. A., Sumiyoshi, A., Nonaka, H., Haga, R., Aubert-Vasquez, E., Ogawa, T., et al. (2011). An in vivo MRI template set for morphometry, tissue segmentation, and fMRI localization in rats. Front. Neuroinform. 5:26. doi: 10.3389/fninf.2011.00026
Wood, T. C. (2018). QUIT: QUantitative Imaging Tools. J. Open Sour. Softw. 3:656. doi: 10.21105/joss.00656
Keywords: template, tissue prior, Sprague-Dawley, preclinical imaging, aging, morphometry, VBM
Citation: MacNicol E, Wright P, Kim E, Brusini I, Esteban O, Simmons C, Turkheimer FE and Cash D (2022) Age-Specific Adult Rat Brain MRI Templates and Tissue Probability Maps. Front. Neuroinform. 15:669049. doi: 10.3389/fninf.2021.669049
Received: 17 February 2021; Accepted: 03 December 2021;
Published: 07 January 2022.
Edited by:
Hien Duy Nguyen, The University of Queensland, AustraliaReviewed by:
Jason Lerch, Toronto Centre for Phenogenomics, CanadaBaris Kanber, University College London, United Kingdom
Copyright © 2022 MacNicol, Wright, Kim, Brusini, Esteban, Simmons, Turkheimer and Cash. This is an open-access article distributed under the terms of the Creative Commons Attribution License (CC BY). The use, distribution or reproduction in other forums is permitted, provided the original author(s) and the copyright owner(s) are credited and that the original publication in this journal is cited, in accordance with accepted academic practice. No use, distribution or reproduction is permitted which does not comply with these terms.
*Correspondence: Eilidh MacNicol, ZWlsaWRoLm1hY25pY29sQGtjbC5hYy51aw==