


- 1 Department of Biomedical Engineering, Duke University, Durham, NC, USA
- 2 Center for Neuroengineering, Duke University, Durham, NC, USA
- 3 Department of Neurobiology, Duke University, Durham, NC, USA
- 4 Department of Psychology and Neurosciences, Duke University, Durham, NC, USA
- 5 Edmond and Lily Safra International Institute of Neuroscience of Natal, Natal, Brazil
Fitts’ law describes the fundamental trade-off between movement accuracy and speed: it states that the duration of reaching movements is a function of target size (TS) and distance. While Fitts’ law has been extensively studied in ergonomics and has guided the design of human–computer interfaces, there have been few studies on its neuronal correlates. To elucidate sensorimotor cortical activity underlying Fitts’ law, we implanted two monkeys with multielectrode arrays in the primary motor (M1) and primary somatosensory (S1) cortices. The monkeys performed reaches with a joystick-controlled cursor toward targets of different size. The reaction time (RT), movement time, and movement velocity changed with TS, and M1 and S1 activity reflected these changes. Moreover, modifications of cortical activity could not be explained by changes of movement parameters alone, but required TS as an additional parameter. Neuronal representation of TS was especially prominent during the early RT period where it influenced the slope of the firing rate rise preceding movement initiation. During the movement period, cortical activity was correlated with movement velocity. Neural decoders were applied to simultaneously decode TS and motor parameters from cortical modulations. We suggest that sensorimotor cortex activity reflects the characteristics of both the movement and the target. Classifiers that extract these parameters from cortical ensembles could improve neuroprosthetic control.
Introduction
The relationship between movement speed and accuracy, first reported by Shannon and Weaver (1949) and Fitts (1954), is commonly referred to as Fitts’ law and is formulated as a dependency of movement time (MT) on target size (TS) and distance to the target. In information theory and communication fields, this law provides a means to quantify the information capacity of a motor system. Fitts’ law has been extensively studied and confirmed to hold for upper limb (Leisman, 1989; Bootsma et al., 1994) and head movements (Jagacinski and Monk, 1985), both in adults and children (Kerr, 1975; Hay, 1981). Fitts’ law disturbance has been described for neural diseases such as developmental coordination disorder (Maruff et al., 1999; Wilson et al., 2001) and for Parkinson’s disease (Mazzoni et al., 2007, cf. Weiss et al., 1996). There are conditions for which additional factors have to be accounted for, including eye movements (Chi and Lin, 1997) and ballistic arm movements (Hoffman, 1991). For the past 30 years, issues of computer interface design have driven much interest in Fitts’ law, helping to improve pointing time through improved screen layout and menu design (Gillan et al., 1992). More recently, it has been shown that Fitts’ law accurately describes the MTs of a one dimensional cursor in an electroencephalographically (EEG) driven brain–machine interface (BMI), both in normal subjects and in patients with amyotrophic lateral sclerosis and spinal muscular atrophy (Felton et al., 2009).
From a neurophysiological perspective, Fitts’ law describes a sensorimotor transformation in which sensory evidence is detected by the visual system, analyzed by brain visuomotor networks, and is eventually converted into movements toward a target (Kalaska et al., 1997). The neuronal mechanisms of sensorimotor transformations and decision making have been extensively studied (reviewed in Romo and Salinas, 2001; Gold and Shadlen, 2007; Hoshi and Tanji, 2007; Lalazar and Vaadia, 2008; Andersen and Cui, 2009; Paz and Vaadia, 2009; Cisek and Kalaska, 2010). These studies have suggested that there is no strict segregation between processing in sensory and motor areas: the cortical areas involved in movement execution, such as motor and premotor cortex, also represent sensory signals and participate in sensorimotor transformations (Alexander and Crutcher, 1990; Crammond and Kalaska, 1994; Zhang et al., 1997; Wise et al., 1998; Kakei et al., 1999; Paz et al., 2003). Furthermore, motor areas appear to sequentially represent a variety of parameters: abstract parameters related to task rules, orientation of spatial attention (Lebedev and Wise, 2002), motor planning and anticipation (Vaadia et al., 1988; Wise et al., 1996), and characteristics of limb kinematics and kinetics (Todorov and Jordan, 2002; Cisek et al., 2003; Sergio et al., 2005; Xiao et al., 2006; Fagg et al., 2009). According to the evidence-accumulation model, distinct motor program parameters, such as reaction time (RT), and movement velocity, emerge as a result of evidence compiled from sensory information (Schall, 2003; Gold and Shadlen, 2007; Kable and Glimcher, 2009). Notwithstanding this previous work on sensorimotor transformations, the specific dependencies described by Fitts’ law and their underlying neuronal mechanisms have not been investigated using neurophysiological approaches.
To explore the neural correlates of Fitts’ law, we conducted experiments in two rhesus macaques implanted with multielectrode arrays in primary motor (M1) and primary sensory (S1) cortex. Monkeys performed a reaching task in which TS was variable. Our results elucidated the representation of TS in sensorimotor cortex, which was conjoint to the representation of movement direction and speed.
Materials and Methods
Implants and Recordings
All studies were conducted with approved protocols from the Duke University Institutional Animal Care and Use Committee and were in accordance with the NIH guidelines for the Care and Use of Laboratory Animals.
Two rhesus monkeys (one male and one female, monkeys M and N, respectively) were chronically implanted with multielectrode arrays in M1 and S1 of both right and left hemispheres using previously described surgical methods (Nicolelis et al., 2003). Within each hemisphere, two 96 channel microelectrode arrays were placed in cortical areas corresponding to cortical representations of arm and leg (Figure 1B). Each array consisted of two 4 × 4 grids of independently movable electrode triplets. Each of the triplets was comprised of electrodes of different lengths, in 300 μm intervals, which allowed us to sample neuronal activity from different depths in the cortical tissue. For the purpose of the study, neural activity was recorded in the arm representation area of right hemisphere M1 (in both monkeys) and S1 (only in monkey M). Recorded signals were amplified, digitized, and filtered by a multichannel recording system (Plexon Inc., Dallas, TX, USA). Neuronal spikes were sorted on-line using waveform template matching and thresholding features built into the spike-sorting software.
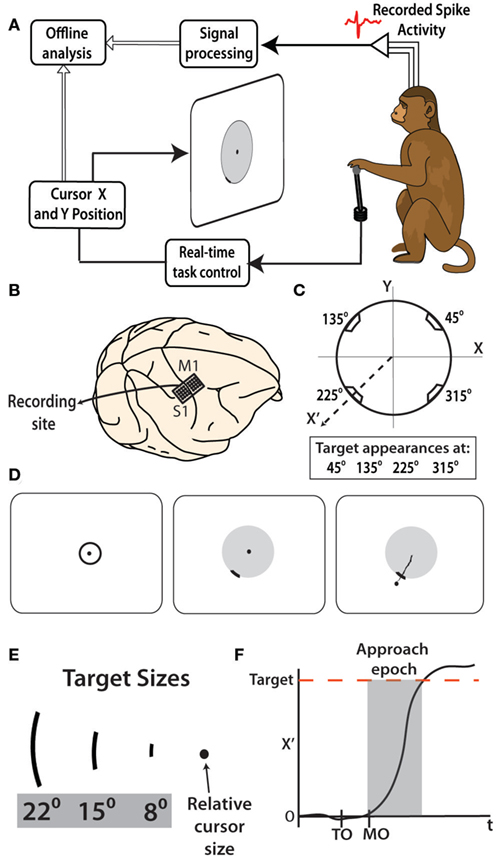
Figure 1. Implantation and experimental protocol. (A) Rhesus monkeys controlled the location of a cursor on a display screen by moving a joystick with their left hand. Joystick kinematics as well as the neural activity were recorded and analyzed offline. (B) 4 × 4 Grids of 16 electrode triplets were implanted bilaterally in M1 and S1 arm and leg regions, however only the right hemisphere arm region of M1 and S1 was recorded from in this study. (C) For each trial, the cursor was to move along the radial origin-to-target axis (X′) toward one of four potential target locations. (D) Left to right-typical trial begins with cursor moved within the target at center of screen. After hold period, penalty ring, and target arc appear. The cursor is then moved radially through the target arc to receive a reward. (E) Three potential target sizes are shown with respect to the cursor, for size reference. (F) An example of a single trial movement trace is shown. Target onset (TO) and movement onset (MO) are denoted on time axis. The approach epoch that was used in later analysis spanned from movement onset to target acquisition.
Behavioral Task
Each monkey was trained to perform a two dimensional reaching task using a hand-held joystick that controlled the position of a computer cursor. The monkeys made center-out movements to peripheral targets. This experimental protocol matched the design implemented in a previous human study of Fitts’ law for pointing movements (Smyrnis et al., 2000). In our experiments, the joystick was at the monkey’s waist level on the side of the working hand. The monkeys used their left hands to hold the joystick. The left hand was chosen because the quality of neuronal recordings was better in the right hemisphere in each monkey. X (left–right) and Y (forward–backward) positions of the joystick was translated to the X (left–right) and Y (up–down) positions of the cursor on the display screen (Figure 1A). The display screen was placed 45 cm from the monkeys’ eyes, and the cursor diameter was 0.5 cm.
To initiate a trial, the monkey positioned its hand on the joystick. The trial was canceled if the monkey broke hand contact with the joystick. Once the monkeys touched the joystick, a computer cursor was shown on the screen and a 3-cm diameter circle appeared at the center of the screen. The monkey moved the cursor inside that circle, and held it there for a random interval between 800 and 1500 ms (Figure 1D). After this hold period, the central circle disappeared and the monkey was required to move the cursor to a peripheral target that appeared on the screen simultaneously with the central circle disappearance. The peripheral target was a thickened arc of either 8, 15, or 22° on a thin boundary circle aligned on the center of the screen (Figure 1E). A juice reward was immediately delivered when the cursor crossed the target from the inside out (Figure 1D, right). Movement of the cursor out of the boundary circle that did not cross the target resulted in termination of the trial without reward and a 500-ms timeout period. The targets appeared at angles 45, 135, 225, and 315° relative to the center of the screen (Figure 1C). The monkey had 5 s to complete each trial. This experiment was repeated over three daily recording sessions in monkey M and four sessions in monkey N.
Analysis of Movements
To calculate movement onset and velocity for different target positions, single trial records of cursor position were analyzed using a coordinate transfer where a new coordinate system (X′, Y′) was obtained by rotating the (X, Y) axes so that the new X′ axis coincided with the radial axis from the screen center to the target, and Y′ axis was orthogonal to X′ (Figure 1C). The time of movement onset was detected by identifying the first co-occurrence of both the X′ velocity and acceleration surpassing an empirically determined threshold of 0.25·Velmax and 0.25·Accelmax, where Velmax and Accelmax are the respective maximum values reached on a given single trial. This algorithm was verified by visual inspection of the accurate identification of movement onset on greater than 95% of tested trials. To detect movement onset in the trials where the co-occurrence of velocity and acceleration increases were not found, the first instance of one of the two events was selected. Outlier trials with unusual movement patterns (i.e., return to the center before reaching the target) were excluded from analysis. We call the period between the movement onset and the passing of the cursor into the target the approach epoch (Figure 1F). The mean velocity was calculated within this epoch for each trial. RT was defined as the time elapsed from target appearance to movement onset.
Trial difficulty was quantified as a function of target width, formalized in terms of the index of difficulty (ID) as described in Eq. 1 (Fitts and Peterson, 1964):

where D is the distance from screen center to target and W is the length of the target arc (8°–0.56, 15°–1.05, 22°–1.54 cm). D was fixed at 4 cm.
Analysis of Neuronal Activity
Neural activity was first analyzed using conventional peri-event time histograms (PETHs; Awiszus, 1997), either aligned on target onset or on movement onset. Recorded action potential events were counted in bins of 25 or 50 ms width. The smaller bin width was used for computation of slopes and ensemble-average mean firing rate (MFR) to improve temporal resolution. PETHs for a single neuron were calculated for each trial and then were averaged across trials for each combination of movement direction (four possible) and TS (three possible). This average modulation profile for each neuron was normalized by subtracting the mean bin count and dividing by the SD of the cell’s bin count – the values calculated for raw spike trains prior to any PETH calculations. With this normalization, PETH expresses the event-related modulations as a fraction of the overall modulations, or statistically, the z-score. The preferred direction for each neuron was determined by finding the direction with maximum MFR in the 750-ms window following target onset.
Trials from each session were subdivided into 12 groups (by movement direction and TS) and subsequent analysis was performed separately for these groups. Trials were further categorized into two categories by the length of RT relative to the median values for that session. Trials with RT below the median were characterized as short RT, and above the median as long RT. Similarly, trials were categorized by approach velocity as slow and fast velocity trials. The corresponding neuronal activity profile was computed for each selected subset of trials as a way to isolate the neural correlates of specific differences in behavior.
The typical response profile for both M1 and S1 movement-related neurons was a rapid increase in firing rate (FR) beginning approximately 50–100 ms after target onset (Figure 4). Maximum FR was typically reached near the time of movement onset. Neural activity between the target onset and movement initiation (the RT period) was examined for modulation with TS. We found that the FR slope differed with TS during the RT period. The FR slope for a given trial was determined within a fixed interval during the RT period, 50–300 ms after target onset, where we performed a linear regression across binned (25 ms bin width) spike activity. Mean slopes were calculated by averaging across all trials in a specified experimental condition (e.g., direction, RT group). Mean slopes for each condition were calculated for individual neurons, followed by an ensemble-level analysis.
In addition to categorical statistical analyses, we treated RT and TS as continuous, rather than categorical values. To study the contribution of RT and TS to slope modulation, we performed a multiple linear regression analysis where the FR slope of each cell was expressed as a linear function of the RT and TS (Eq. 2).

Weights WRT and WTS expressed the contribution of RT and TS, respectively. WRT and WTS were determined for each neuron along with the 95% confidence interval (CI) of their values (Ashe and Georgopoulos, 1994). Each CI was generated using the student’s t statistic with α = 0.05. A neuron was said to enact a significant modulation for RT, TS, or both if the corresponding CI did not contain zero. The subset of neurons significantly correlated to RT or TS were found using this criterion.
For the peri-movement epoch (PME), we found that MFR was sensitive to TS and movement velocity. For analyses of the relative magnitude of neural activity prior to and during movement, PETHs were aligned on movement onset and MFR was calculated in the PME, defined to be the interval from 50 ms before to 50 ms after movement onset. MFR modulation could be broadly seen with comparisons between discrete categories of velocities; however a more nuanced analysis once again required a multiple linear regression of continuous variables. Similar to Eq. 2, MFR during the PME was fit as a linear function of velocity and TS:

Where Vel is movement velocity. Weights WVel and WTS expressed the contribution of velocity and TS on MFR. Statistics of single cells and across the population were computed using the same technique as for Eq. 2.
Neural Representation of Task and Behavioral Parameters as a Function of Time
Neuronal representation of different task and behavioral parameters was quantified using trial-by-trial correlation analyses between the variations of neuronal rates and parameters in question (RT, Velocity, and TS). More specifically, we conducted multiple linear regression analysis in which a 50-ms window was slid along the task interval (Figure 6A). FR was calculated within the window for each trial and fit with a linear function of either RT and TS (Eq. 4) or mean velocity and TS (Eq. 5):
We found that FR was correlated with RT mostly after target appearance and with Vel mostly around movement onset. Therefore neural data was aligned on target onset for regression in Eq. 4 and on movement onset for regression in Eq. 5. The magnitude and sign of each coefficient W provided information regarding the effect that the corresponding parameter had on FR of a single cell at a given time. Coefficients for individual neurons were averaged across neurons at each time step.
Neural Decoders
To evaluate the accuracy with which task and behavioral parameters can be extracted from ensemble activity, we used a neural classifier and linear predictor that decoded kinematic and target parameters. Linear discriminant analysis (LDA; Fisher, 1936) was performed using a 100-ms wide window slid at 25 ms time steps. MFR was measured within this window for each neuron in the population. The vector of individual neurons’ MFRs was the input to the decoder. We used 60% of trials as sample data for the decoder, and 40% of trials as test data. LDA predicted categorized variables from neuronal ensemble activity. For each predicted parameter, we used three categories of either TS (8°, 15°, 22°), RT, or velocity (lower 1/3, middle 1/3, upper 1/3 RT, or velocity). The performance of the classifier was measured as the fraction correct prediction divided by the chance level fraction correct and was found at each time step of the sliding window to provide a temporal profile (Figure 8). Fraction correct for a specified sliding window position was averaged between analyses where the sample data were drawn from the beginning, middle, and end of the session.
The Weiner filter (Wiener, 1949; Haykin, 2002) was used offline to make predictions of cursor kinematics using a short history of neural activity (Wessberg et al., 2000; Lebedev et al., 2005). This analysis tested the influence of TS, RT, and Vel on cursor position extracted from cortical activity (Figure 7). The Wiener filter used in this study had six taps of 100 ms with ridge regression for regularization (Grandvalet, 1998). The filter performance was evaluated using both signal-to-noise ratio (SNR; Fitzsimmons et al., 2009; Li et al., 2009) and coefficient of determination (r2; Wessberg et al., 2000; Lebedev et al., 2005).
Results
Data were collected from four daily recording sessions in monkey N (2126 trials) and from three sessions in monkey M (1305 trials). Neural activity was recorded from 64 to 69 M1 neurons (range for different recording sessions) in monkey N, and from 92 to 111 M1 neurons and 83–91 S1 neurons in monkey M.
Influence of Target Size on Reaction Time and Movement Parameters
Reaction time and MT were affected by TS in a manner consistent with Fitts’ law in both monkeys. Additionally, these changes were dependent on movement direction. RT, determined by subtracting target onset from movement onset, clearly decreased with increases in TS. The distributions of RTs for each of the three TS and each of four movement directions are shown in Figures 2A–C. Because these distributions were non-Gaussian in shape, the Kruskal–Wallis test, a non-parametric analog of ANOVA, was used to compare RTs for different conditions. This analysis showed that the TS significantly influenced the distribution of RTs (p < 0.001 for all movement directions with the exception of one for monkey M with p < 0.02; see Table 1). The TS effect on RT was especially pronounced for upward–rightward movements in monkey N (Figure 2A) and downward–leftward movements in monkey M (Figure 2B).The effect was the smallest for upward–leftward movements in both monkeys. That direction also had the overall shortest RT, which suggests that those particular movements were relatively easy for the monkeys to prepare and perform.
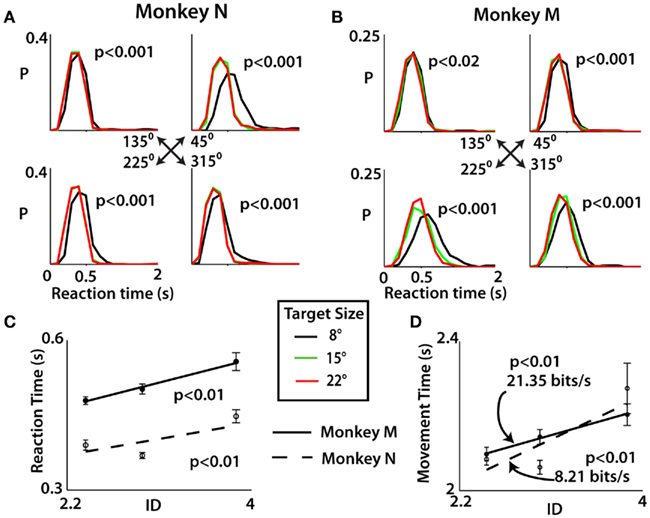
Figure 2. Distribution of reaction times was computed for each movement direction by monkey N (A) and monkey M (B) with probability “P” shown as a function of RT. A Kruskal–Wallis test was performed for each direction to determine significance of target size on distribution of reaction times (see Table 1). (C) Reaction time for trials of the three different indices of difficulty (ID) was fit with linear function and tested for significance using F test. Means for each ID plotted as filled circles (monkey M) and open circles (monkey N). The target size of the trial is denoted by colors specified below (A,B). (D) Movement time for the three ID conditions. A regression line was used to fit all trials and the subsequent inverse of slope yields index of performance (IP) in bits per second. Significance was tested in same way as in (C). All error bars indicate SE.
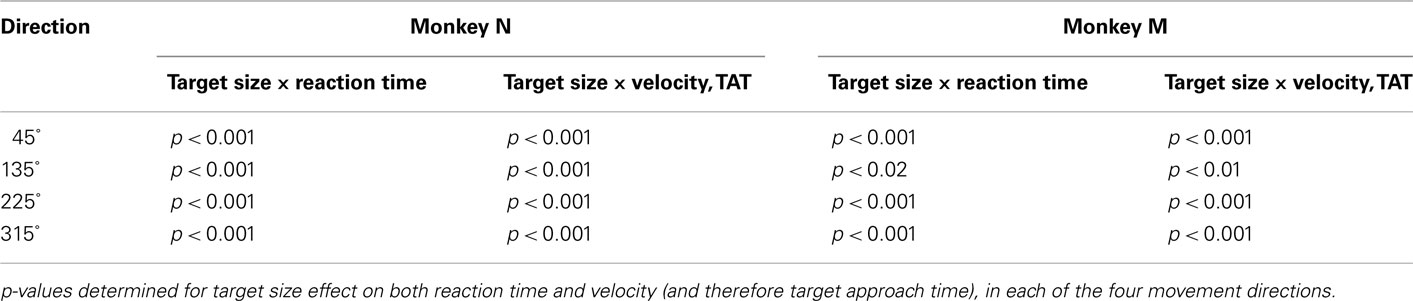
Table 1. Kruskal–Wallis analysis of the effect of target size on reaction time and target approach time.
The target approach time (TAT; i.e., the time from movement onset until the time of target acquisition) also depended on the TS (p < 0.01, Kruskal–Wallis test) for each movement direction in both monkeys (Table 1). TAT was shorter for larger targets and longer for smaller targets. As with RTs, the TS effect was more pronounced for particular directions and less for others. The particularly vigorous (i.e., characterized by higher velocity) upward–leftward movements depended on the TS less than movements in other directions. This can be seen from Figures 3C,D which presents the distributions of average approach velocities, that is, the inverse of TAT. The effect of TS on the RT and movement kinematics is also clear from average movement traces showing time dependent changes in cursor position measured with respect to the radial axis from the center to the target, termed X′ axis (Figures 3A,B). The average cursor traces for the smallest target is clearly shifted to the right for both monkeys, reflecting TS dependent differences in RTs. Differences in movement velocity are manifested as differences in the slopes and are especially clear for the initial portion of movement. The initial velocity was slowest for the smallest targets (black traces) and fastest for the largest (red traces).
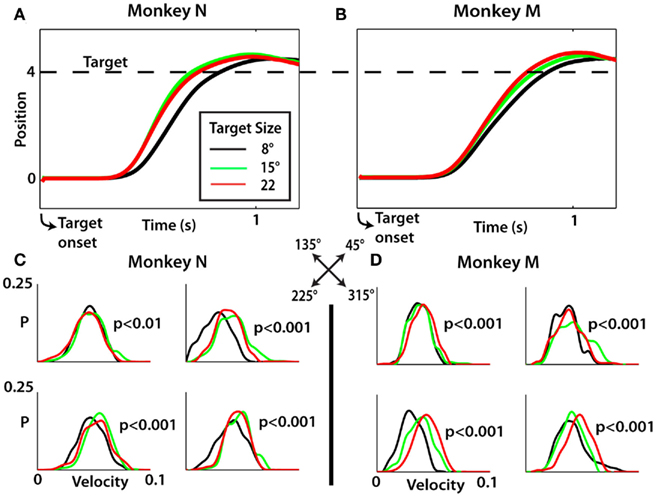
Figure 3. Reach kinematics reflect differences in target size. (A,B) Averaged position traces of monkey N and monkey M along the X′ axis from 0 (the origin) to 4 (the target, denoted by dashed line). The target size of the trial is denoted by colors specified in (A). (C,D) Distribution of mean approach velocity for each of the four movement directions with probability (P) shown as a function of mean approach velocity. For each direction, a Kruskal–Wallis test was performed to evaluate the effect of target size; p-values shown for each direction separately (see Table 1).
Since both RT and TAT elongated with smaller targets, MT, defined as the time from initial appearance of the target to when the target was entered, elongated as well. The dependency of RT on ID is represented in Figure 2C. Average MT tended to be longer for higher ID trials (F test, p < 0.01), following Fitts’ law, with an index of performance (IP) of 21.35 b/s for monkey M and 8.21 b/s for monkey N (Figure 2D). The IP was determined by linear regression following the original method of Fitts (1954).
Taken together, these results indicate that monkeys’ reaching movements obeyed Fitts’ law. Small targets were associated with elongated RT, slower movement velocity, and an overall lengthening of MT in a manner that is consistent with previous Fitts’ law studies (Bohan et al., 2003; Munro et al., 2007; Boyd et al., 2009).
Neuronal Representation of Reaction Time and Target Size
Given that TS affected RTs, TATs, and movement profiles, we expected and observed that these changes in movement kinematics were reflected in cortical modulations. However, modifications in M1 and S1 neuronal activity were not mere reflections of changes in movement patterns. Rather, they were better explained by a combination of factors that included behavioral parameters and TS than by movement alone. In other words, neuronal modulations in sensorimotor cortex did not simply reflect the characteristics of movement, but additionally depended on the properties of reach targets.
Neuronal modulations can be clearly seen in PETHs separated for different RTs and TS (Figure 4). These PETHs are shown as color plots for the M1 and S1 subpopulations of neurons (Figures 4D–I). Population-average PETHs were computed separately for M1 (both monkeys; Figures 4A,B) and S1 (monkey M only; Figure 4C). Both individual-neuron and average PETHs were clearly different for different RTs. Shorter RTs corresponded with PETHs with steeper modulation slopes. To examine the effects of both RT and TS, a two-factor analysis was conducted. Behavioral trials were categorized into (1) short and long RT groups and (2) small (8°), intermediate (15°), and large (22°) TS groups. RTs lower than the median RT were classified as short, and RTs higher than the median as long. Additionally, preferred directions (movement direction with maximum neuronal rate) and least preferred directions (minimum-rate direction) were analyzed separately for each neuron. In Figure 4, panels for short vs. long RTs, different TS and preferred vs. least preferred directions are labeled accordingly. Analyses of these groupings suggested that PETH slopes increased with shorter RTs and additionally increased with larger targets. PETH slopes for individual neurons and populations were calculated using linear regression of PETH values vs. time in the interval from 50 to 300 ms after target onset (see Materials and Methods). Average population PETH separated into most and least preferred direction are shown in Figures 4A–C. They indicate a tendency for the slopes to depend on both RT and TS for both preferred and least preferred directions. For both preferred and least preferred direction, average slopes increased with shorter RTs and larger TSs.
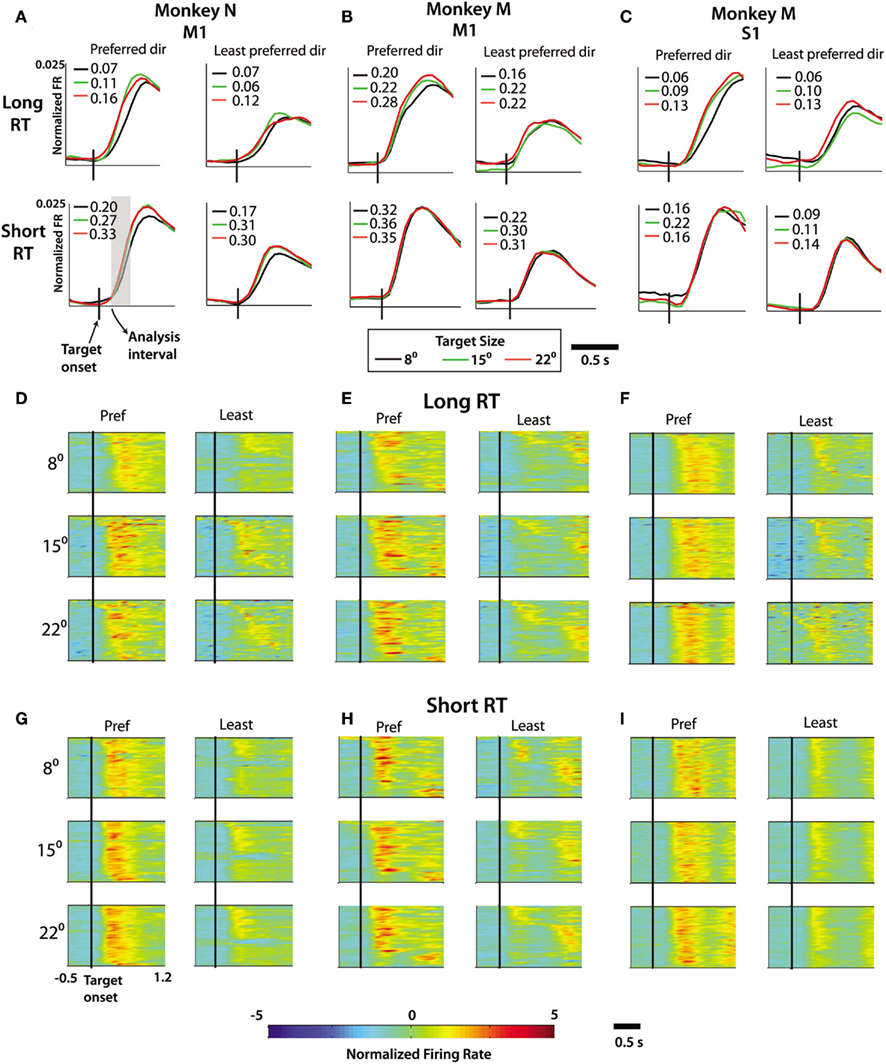
Figure 4. Effect of reaction time on firing rate profiles. (A–C) Averaged and normalized firing rate across all recorded M1 cells in monkey N, M1 cells in monkey M, and S1 cells in monkey M. For each four-axis panel, the left column denotes movements in preferred direction of each neuron and right column shows the least preferred direction. The upper and lower rows represent the averaged and normalized PETH across long and short reaction time trials, respectively. Target size specified by line color [(see legend below (B)]. Slopes in spk/s2 computed from regression of normalized firing rate during analysis interval (gray box, see Materials and Methods). (D–F) Population PETH showing normalized firing rate profiles on long reaction time trials for all cells (ordinate) over time (abscissa) relative to target onset (denoted by vertical black bar) from M1 of monkey N (D), M1 of monkey M (E), and S1 of monkey M (F). For each, the most preferred (left) and least preferred direction (right) are compared. (G–I) Same as (D–F) with PETH showing firing rate profiles during the short reaction time trials. Color of pixel represents normalized firing rate (z-score, see Materials and Methods). Scale of axis in (A–C) narrower than in (D–I) due to averaging across M1 or S1 populations reducing the amplitude of PETH profile compared to single cell activity levels.
An analysis of PETH slopes for single neurons revealed the same tendency as for the slopes of population PETHs (Table 2). For the preferred direction, short RT trials had, on average, steeper slopes than long RT trials for M1 (monkey N and M), as well as S1 (monkey M) cells (p < 0.0001, paired t-test). The same tendency was found for the least preferred direction in monkey N M1 and monkey M M1 neurons (p < 0.0001), however the effect was not significant in the recorded S1 cell population (p > 0.05). Furthermore, PETH slopes in individual neurons, both in the preferred and the least preferred directions showed TS dependence among all trials in monkey N M1, monkey M M1, and monkey M S1 (p < 0.01). To test significance of this effect, we performed both one-way ANOVA (FR slope distribution was nearly normal) and the Kruskal–Wallis test. Reported is the larger of the two p-values for each analysis. Looking within only long RT trials, the effect remained significant in both the preferred and least preferred direction in each neuronal population, in both monkeys (p < 0.001). In short RT trials, the TS effect was significant in monkey N M1 (p < 0.001) and monkey M S1 (p < 0.01) but only marginally significant in monkey M M1 (p = 0.12 ANOVA, p < 0.05 Kruskal–Wallis), possibly because monkeys were less careful to hit the target on those trials and their movements were more ballistic, which have been shown not to follow Fitts’ law (Juras et al., 2009). A greater difference emerged between the small target trials and either of the other two larger target trials, both at the behavioral and neuronal levels. As such, further slope comparisons were made between the small target trials and each of the other two groups in a pairwise manner (Table 2). Neural activity of the population followed this trend as well (Figures 4D–I). The results were consistent in both preferred and least preferred directions, in M1 as well as S1 in monkey M.
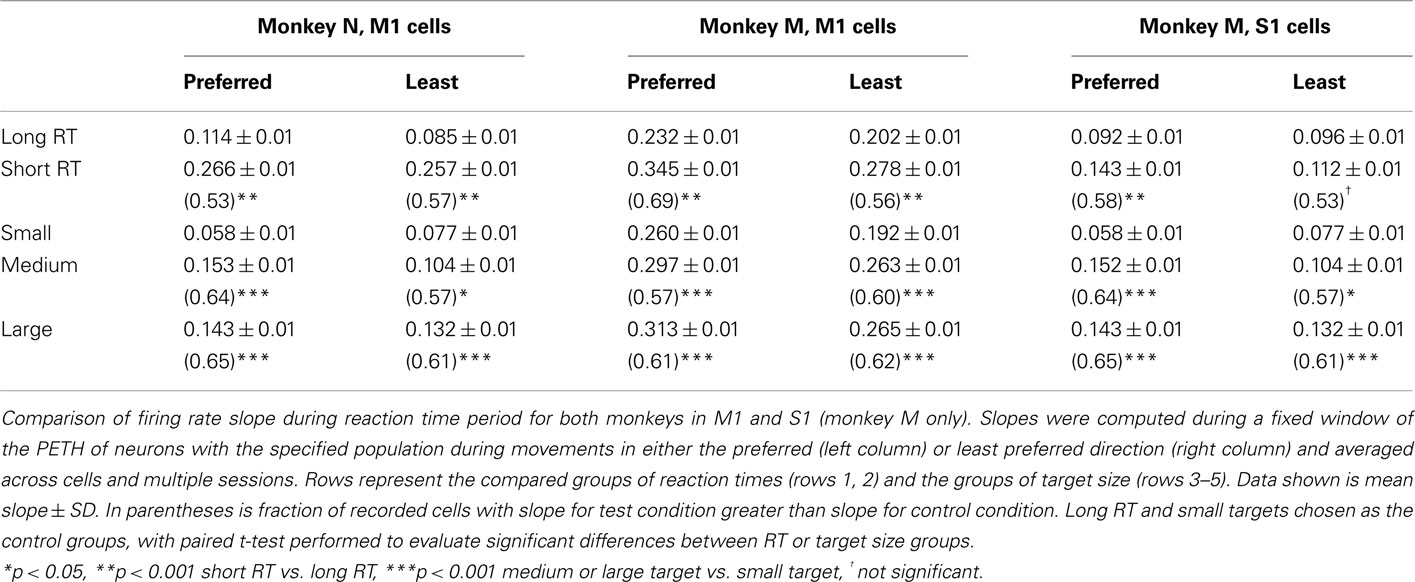
Table 2. Effect of reaction time and target size on firing rate slope preceding movement onset.
While the analysis of Figure 4 suggested that PETH slope could not be explained solely by changes in RT and additionally depended on TS, this demonstration was not sufficient because the composition of short RT and long RT groups of trials could be different for different TSs. In particular, RTs could be shorter for large TS than for small TS even after they were separated into short RT or long RT groups. To address this possibility, we performed a linear regression analysis where the slope was expressed as a linear function of both RT and TS (Eq. 2).
The weights WRT and WTS (Eq. 2) were calculated for different cortical areas illustrated (i.e., the same neuronal populations as in Figures 4A–C). Mean WRT in all three cortical areas was negative (monkey N M1 −0.026 ± 0.002, monkey M M1:−0.046 ± 0.003, and S1: −0.048 ± 0.003; mean ± SE), confirming the inverse relationship between RT and PETH slope. Conversely, mean WTS, in all three cortical areas was positive (monkey N M1: 0.046 ± 0.002, monkey M M1: 0.011 ± 0.002, and S1:0.031 ± 0.003), confirming a slope increase for larger TS. To estimate the significance of these values, single cell coefficient values, as well as their corresponding 95% CI were determined from regression (see Materials and Methods). In both monkeys, M1 cells were identified with significant WRT or WTS, although the dominant parameter differed between the two monkeys (monkey N: TS 40% of cells, RT 18%; monkey M: TS 11% of cells, RT 31%). For S1 neurons the modulation was slightly more related to RT than TS (TS 20% of cells, RT 32%). Thus both TS and RT contributed to modulation of FR slope during the RT period in M1 and S1 neurons. However, the relative effect of size was variable between monkeys.
Neuronal Representation of Velocity
The changes in mean approach velocity for different TSs (Figure 3) were associated with modification in M1 and S1 activity. In addition, we observed a modulatory effect of TS on FR beyond the changes in neuronal activity explained solely by kinematics. Similar to the analysis of the effect of RT and TS on the initial PETH slope, in this analysis we calculated PETHs for groups of trials selected based on the mean velocity during the approach epoch categorized as slow or fast. PETHs for both groups, in both the preferred and least preferred directions were computed (Figure 5). PETHs were centered on movement onset. The main effect seen in the average PETHs (Figures 5A–D) and PETHs for individual neurons in the population (Figures 5E–J) was an increase in neuronal rates for fast velocity trials compared to slow velocity trials. Statistical significance of this effect was confirmed by an analysis of peak FR (p < 0.001, paired t-test; Figure 5D). Furthermore, the neuronal rates were modulated by the TS in such a way that for small targets, FR were reduced for both slow and high velocities and preferred and least preferred directions (Figures 5A–C). PETH amplitude near the time of movement onset was found to be dependent on both the velocity of the trial and the TS (Table 3).
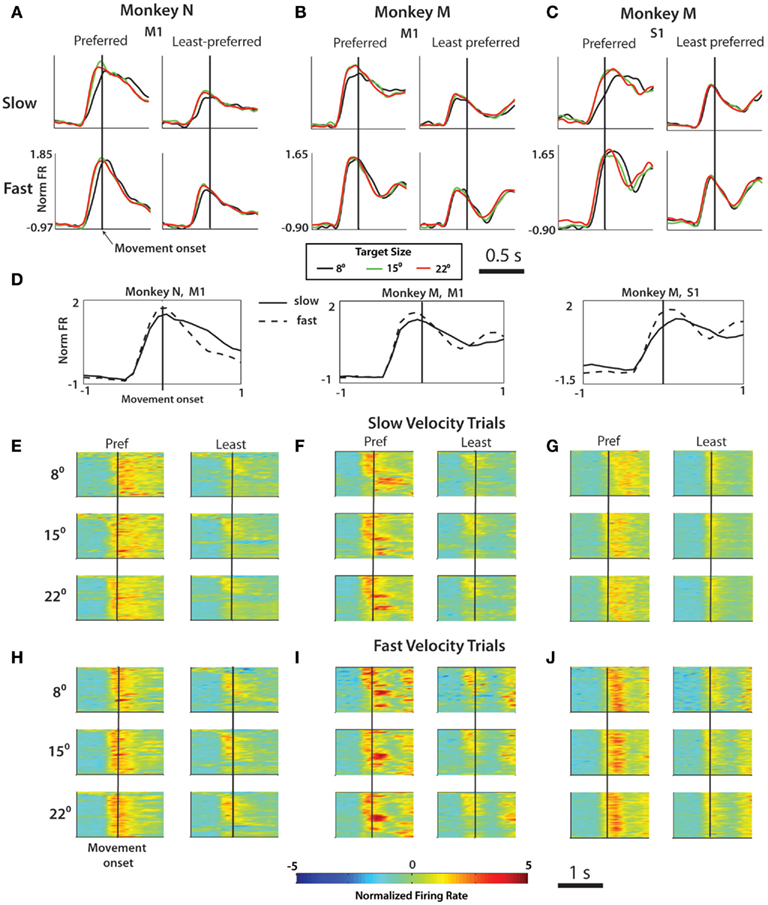
Figure 5. Effect of velocity on firing rate profiles. The normalized firing rate was computed during the 1-s interval surrounding movement onset from three subpopulations of neurons: (A) M1 neurons in monkey N, (B) M1 neurons in Monkey M, (C) S1 neurons in Monkey M. In each panel, the left column represents averaged, normalized FR for movements in each cell’s preferred direction, right column the least preferred direction. The top row is averaged over all trials slower than the median approach epoch velocity and the bottom row shows only fast trials. Target size specified by line color [see legend below (B)]. (D) Same data from (A–C) collapsed into simply a comparison of slow vs. fast trial average PSTH for each of the three cell groups. Population PSTH for slow (E–G) and fast (H–J) trial averages. In each panel: Y axis contains all neurons, X axis represents time aligned on movement onset (black bar). Color of pixel represents normalized firing rate (z-score, see Materials and Methods).
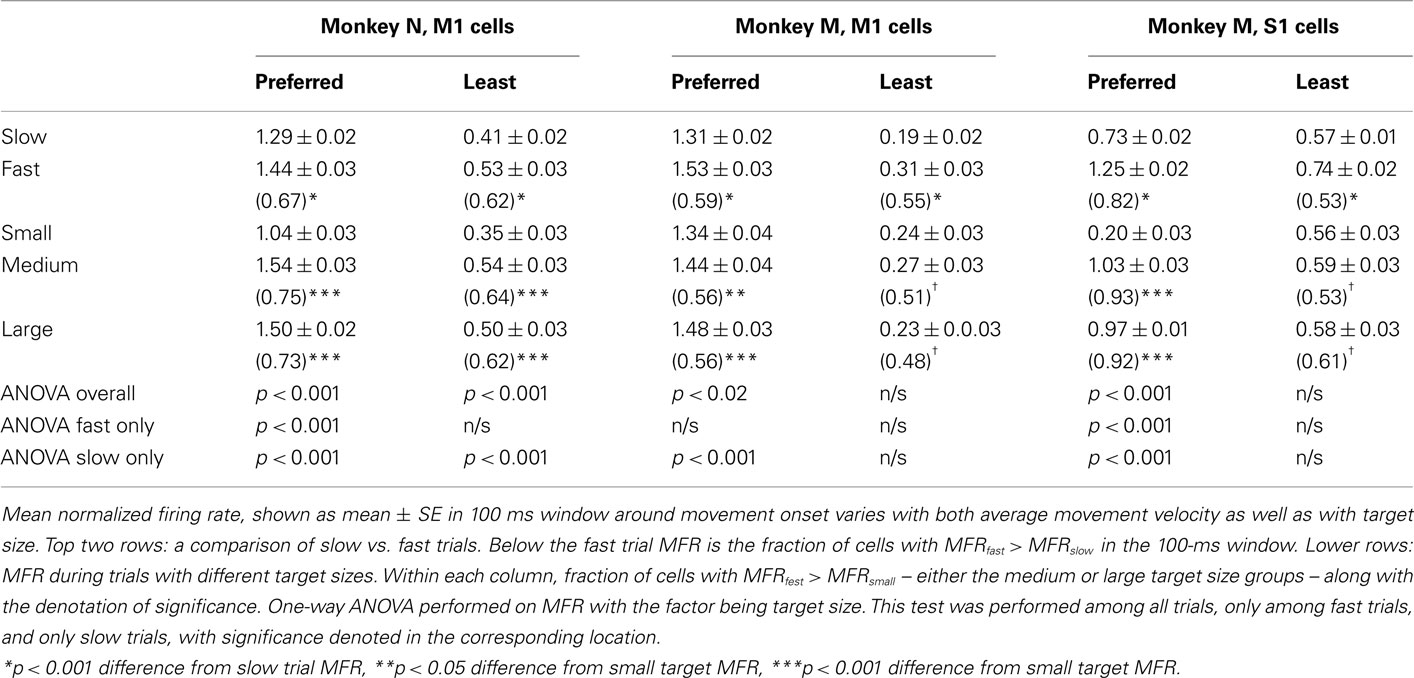
Table 3. Effect of trial velocity and target size on mean firing rate in peri-movement epoch.
A fixed window was set spanning from 50 ms before to 50 ms after movement onset denoted as the (PME; see Materials and Methods). The MFR in the PME was larger for fast velocity trials than for slow trials in all cortical areas and monkeys, both in the preferred and least preferred directions (p < 0.001, one-way ANOVA). In addition to velocity, TS modulated FR throughout the trial (Figures 4A–C). Our data confirmed that the TS modulated MFR during the PME during movement in the preferred direction of M1 and S1 neurons (p < 0.02), and the effect was even stronger during the slow trials (p < 0.001). The effect of TS on MFR was present in fast trials, but was only seen in M1 of monkey N and only in the preferred direction. Least preferred direction modulation was much weaker or was not present in all three cell populations recorded. Thus, the MFR was modulated by both TS and velocity.
As velocity and TS were not independent, we next performed a linear regression analysis to elucidate their relative contributions. The MFR during the PME was fit by a linear function of velocity and TS (Eq. 3). Weights WVel and WTS were determined for each neuron as well as their 95% CI. FR was found to be more strongly influenced by velocity than by TS in each case. In monkey N M1, WVel was larger than WTS [WVel = 0.019 ± 0.003 (mean ± SE) vs. WTS = 0.009 ± 0.001, p < 0.05, calculated for all cells, not just those with significant values], and the fraction of recorded neurons reflecting velocity (44.5%) was much higher than the fraction reflecting TS (10.9%). Significance was determined using the same procedure as for the regression in Eq. 2. In monkey M M1, the effect was similar in that the MFR near movement onset was more a function of velocity than TS (WVel = 0.027 ± 0.004, WTS = −0.009 ± 0.002, p < 0.05), and there were more neurons reflecting velocity (38.3%) than those reflecting TS (18.9%). Monkey M S1 neurons showed an even stronger contribution for velocity (WVel = 0.044 ± 0.002, WTS = −0.012 ± 0.002, p < 0.05), with over 55.1% of neurons reflecting velocity and 14.7% neurons reflecting TS. Taken together, FR magnitude in the window surrounding movement onset was more strongly related to velocity, suggesting that amplitude of firing encoded velocity, while the slope during the RT period (Figure 4) more strongly encoded the TS.
Time Dependent Modulation of Neural Activity with Movement Parameters
To determine task periods during which neuronal activity reflected trial-by-trial variations of RT and velocity, we performed a multiple linear regression analysis (Eqs 4 and 5). MFR during a sliding window was fit to linear functions of RT and TS (Eq. 4) and approach velocity and TS (Eq. 5; see Materials and Methods). We observed an initial negative correlation of RT with spikes within 500 ms of target onset in all three cell populations during the pre-movement, or RT period (Figure 6B). This result reflected earlier, more rapid onset of firing for short RT trials. Interestingly, a positive correlation of FR and TS coincided with, or slightly led the RT representation. This representation of RT and TS was present in both M1 and S1. The same analysis was performed for regression of MFR as a function of mean approach velocity and TS (Eq. 5). Neural activity aligned on movement onset was binned and the coefficients WVel and WTS were determined. A positive correlation between velocity and FR was observed near movement onset in each cell population, although the effect was more subtle in monkey M M1 (Figure 6C). This correlation decreases shortly after movement onset to sub-baseline levels, then rises again 600–800 ms later. Notably, it was the second correlation peak that matched up temporally with the highly significant prediction levels computed in LDA from Figures 8D–F. TS correlation was less clear, however in monkey N M1 since there were significant positive coefficient values corresponding to movement onset in this animal. It is likely that the contribution of TS was somewhat smeared upon realigning the data on movement rather than target onset. In both RT and velocity correlations, there was a specific interval during the task in which each parameter was encoded by modulations in neural activity. TS correlation with neural activity was most clear during the RT period of the movement.
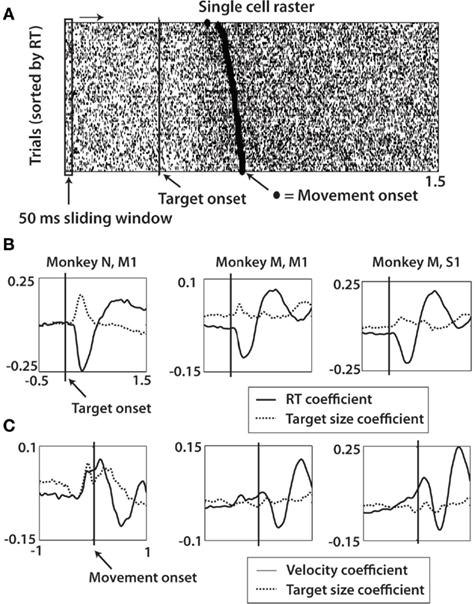
Figure 6. Multiple linear regression analysis of target size, reaction time, and velocity with firing rate over task interval. (A) Firing rates were estimated using a 50-ms sliding window slid with 50 ms time steps in the interval from 0.5 s before target onset until 1.5 s after target onset. The firing rate of a single cell in the window was fit with a linear function of the corresponding trial RT and target size and then averaged across all cells (see Eq. 4, in Materials and Methods). (B) Data showing the coefficient for RT and target size of Eq. 4 as a function of location of sliding window right-most bound in monkey N M1, monkey M M1, and monkey M S1 (left to right). Vertical line represents target onset. (C) Firing rates were fit with linear function of mean approach velocity and target size of each trial (Eq. 5, in Materials and Methods). Methods for (C) same as shown in (A), except data realigned on movement onset (dashed line) and sliding window range from 1 s before to 1 s after movement onset.
Extraction of Kinematics and Target Size from Cortical Activity
The observed differences in cortical activity for slow and fast velocities of movements were reproduced by a predictive model that extracted cursor position from the recorded population activity (Figure 7). M1 and S1 neural activity was combined to generate predictions using a Wiener filter (Wiener, 1949) trained on the first 50% of a session’s trials. Consistent with previous BMI studies (Wessberg et al., 2000; Serruya et al., 2002; Carmena et al., 2003), X and Y position of the cursor were predicted with high accuracy (Figures 7A,B; SNR = 4.422 dB, r2 = 0.80, X-Pos; SNR = 4.798 dB, r2 = 0.82, Y-pos). Next, cursor movements were predicted for 50% of trials for the two velocity groups, averaged, and then compared against the actual averaged trajectory (Figures 7C,D). There was a clear distinction between the fast and slow predicted traces and the Wiener predicted trajectories closely matched the actual traces in both monkeys (monkey N: 13.98 dB (r2 = 0.99) fast, 8.54 dB (r2 = 0.95) slow; monkey M: 13.73 dB (r2 = 0.99) fast, 13.56 dB (r2 = 0.97) slow). Similarly, we wondered whether the cursor position could be decoded between TS groups. The mean trajectory was computed across a single representative session for each monkey for trials of each TS (Figure 7E). Wiener filter predictions on the test data (50% of trials) was computed and averaged to generate the mean predicted trajectory for each TS (Figure 7F). Decoded neural activity reproduced the average trajectory with high accuracy (monkey N: SNR > 18 dB; monkey M: SNR > 10.3 dB) and the predictions even matched subtle behavioral effects such as the elongation of RT.
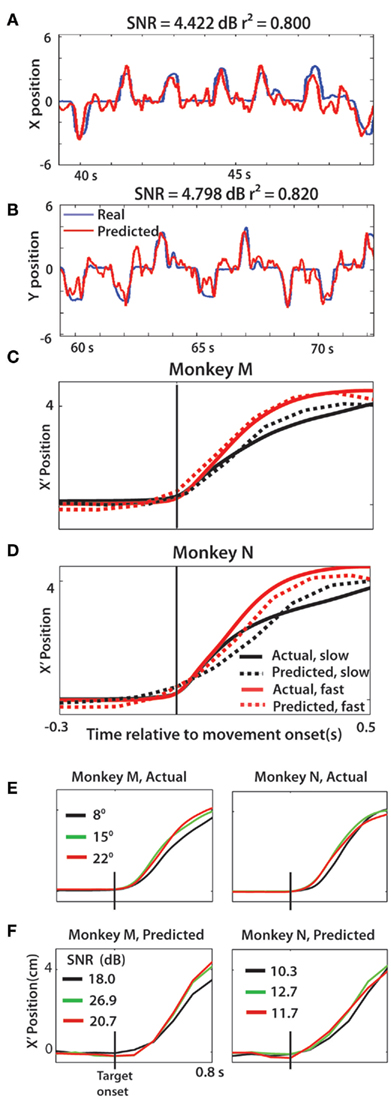
Figure 7. Movement kinematics can be decoded from neural activity. (A,B) Movements along the X axis and Y axis decoded offline and shown with the actual traces. (C,D) Average X′ vs. time profile for the two velocity groups, both actual (solid lines) and predicted (dashed lines). (E,F) Actual X′ position vs. time for each target size, in both monkeys (E) compared with predicted X′ trace for each target size (F). Shown separately for clarity, however SNR computed by comparing actual and predicted for a given target size. In all predicted X′ trajectories, the single trial kinematics were predicted then averaged across the session to generate the traces in panels (C–F).
We next asked if neural predictions of TS, RT, and movement kinematics depended on the time in the task interval. This analysis elucidated instances when cortical activity represented different parameters. Predictions of RT, TS, and movement velocity were obtained using LDA (Figure 8). A 100-ms sliding window was incremented at 25 ms intervals along the time axis relative to either target onset (Figures 8A–C) or movement onset (Figures 8D–F). At each time point, the neural activity in the single 100 ms bin trained the classifier on 60% of trials in the beginning, middle, or end of a session to make predictions of the three parameters in the remaining 40%. Significance was reached if the predicted parameter lay beyond the 95% CI (one proportion z-test) centered on chance level performance. Aligned on target onset, there was significant encoding of both RT and TS with peak occurring for both at 200 ms after target onset for monkey N M1. Monkey M M1 predictions of TS and RT were less clear, but simultaneous significant (p < 0.05) predictions of both parameters began at 200 ms and continued until 1000 ms after target onset. Monkey M S1 predictions showed only very slight representation of TS. A synchronous increase in RT and TS prediction occurred beginning at 325 ms after target onset led to a significant local maximum but the representation of TS was much less prominent than in M1.
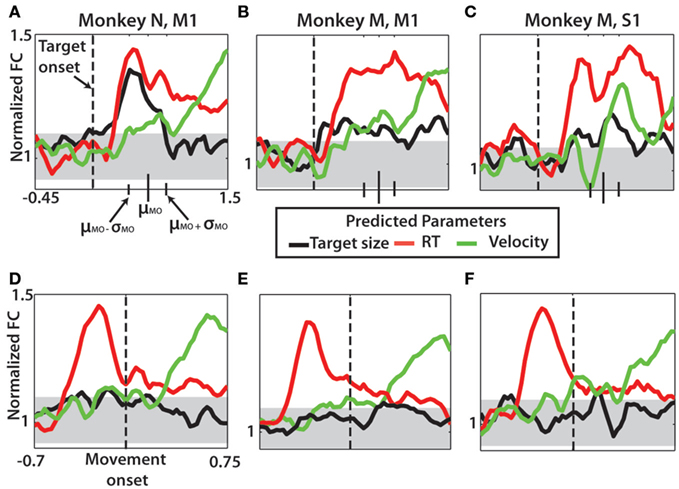
Figure 8. Velocity, target size, and reaction time predicted using linear discriminant analysis. Each parameter was divided into three groups for analysis. Data for each prediction collected from a single bin, 100 ms sliding window of neuronal data incremented at 25 ms through the specified interval. Data denote normalized fraction correct by dividing the fraction correct prediction by the chance level performance (see Materials and Methods). (A–C) Prediction of the three parameters aligned on target onset (dashed vertical line) for monkey N M1 (A), monkey M M1 (B), and monkey M S1 (C). Noted on each is the mean time of movement onset (μMO) with the mean ± SD denoted by smaller black vertical bars on time axis. (D–F) Prediction of the three parameters now aligned on movement onset (dashed vertical line). Each panel shown with 95% confidence interval for expected LDA classification performance (gray horizontal band).
Approach velocity was also found to be transiently represented in sensorimotor cortex of both monkeys. The temporal occurrence of the neural representation was much later, 650 ms after movement onset in monkey N M1 and 700 ms after movement onset in monkey M M1. Monkey M S1 representation was slightly different, with two distinct peaks, one occurring at 125 ms and the other at 725 ms after movement onset. TS was not consistently found to be encoded after movement onset. As the data in Figures 8D–F are aligned on movement rather than target onset, the pre-movement encoding of TS (p < 0.05) is likely a distorted representation of the results in Figures 8A–C. Taken together, there was a clear neural representation in sensorimotor cortex of RT and TS following target onset. Separate to this representation is the velocity tuning of neurons in M1 and S1 occurring well after movement onset.
Discussion
We elucidated the neural correlates underlying the changes in the parameters of arm reaching movements with TS. At the behavioral level, we found a strong TS-dependency (ID-dependency) for three parameters of arm reaches performed by rhesus monkeys: total MT, RT, and mean approach velocity. At the neuronal level, analysis across the recorded neuronal populations in M1 and S1 revealed changes in modulations that depended on TS. These neuronal modulations could not be only explained by changes in movement parameters – the effect that would be expected if M1 and S1 represented only motor aspects of that behavior. Rather, sensorimotor cortical activity represented both characteristics of movement and TS. During the RT period, the slopes of neuronal rates depended on both TS and RT, and during movements neuronal rates depended on TS and movement velocity. Likewise, RT, TS, and cursor trajectories were each effectively decoded from cortical activity using both a Wiener filter and LDA predictions. These results indicate that M1 and S1 ensembles encode TS during motor preparation and execution.
Fitts’ Law in Monkeys
There are clear similarities between the behavioral data obtained in the present study and those obtained from previous work in humans. We found a positive, linear relationship between ID and MT, confirming the canonical Fitts’ law relation (Fitts, 1954; Card et al., 1978). From regression of this data, the IP was computed for the two monkeys to be 8.21 b/s (monkey N) and 21.35 b/s (monkey M). These compare to similar values shown for human motor systems, which Fitts found to be around 10–12 b/s (Fitts, 1954). Monkey behavior also matched previous human work with respect to target-dependent shifts in RT (Munro et al., 2007; Boyd et al., 2009) and velocity (Plamondon and Alimi, 1997; Munro et al., 2007).
When comparing monkey data to previous human findings, several key differences were discovered. We found that monkeys treat different movement directions unequally. For each monkey, one out of four directions was the most difficult and resulted in longer RTs and clearer Fitts’ law dependency compared to other reach directions. For other directions the monkeys moved in a ballistic fashion, showing less clear features of Fitts’ law. We propose that ballistic movements can at least partially explain such loss of Fitts’ law-type behavior, in agreement with previous work on Fitts’ law in humans (Juras et al., 2009).
Neural Correlates of Fitts’ Law
Our data suggest that the neural correlates of Fitts’ law are observed in M1 and S1 during both motor preparation (RT period) and movement execution (movement period). During motor preparation, populations of M1 and S1 exhibited clear modulations of FR that were characterized as FR slopes. The slopes increased with shorter RTs and larger TSs. FR slopes have been shown to be involved prominently in decision making, as demonstrated by evidence-accumulation models (Roitman and Shadlen, 2002; Gold and Shadlen, 2007). These models are based mostly on the data from eye-movement studies that required selecting a saccade direction in response to complex visual clues (Pearson and Platt, 2009; Resulaj et al., 2009). Thus, it has been shown that neural activity recorded in middle temporal (MT) and lateral intraparietal (LIP) areas rises more gradually when the task is perceived to be more difficult, thus lengthening the pre-movement period (Roitman and Shadlen, 2002; Churchland et al., 2008). Such dependency is similar to the behavioral and neurophysiological results of our study: we also observed elongated RTs for smaller TS, and the changes of neuronal rates developed slower. Our present findings also correspond to our previous study of self-timed movements where we observed lower FR slopes in M1 and dorsal premotor (PMd) neurons for longer self-timed intervals (Lebedev et al., 2008). Thus, gradual changes of FR during behavioral epochs preceding movements appear to be a general phenomenon in the cortex during tasks that involve sensorimotor transformation and decision making. Notably, we did not observe a clear segregation between motor (M1) and sensory (S1) areas which both showed modulations during the RT period. This adds to previous reports of premotor activity in S1 (Soso and Fetz, 1980; Lebedev et al., 1994). The exact role of M1 and S1 circuitry in the sensorimotor transformation that involves TS processing is not clear. One possibility is that M1 and S1 modulations reflect the processing performed mostly by associative areas (Thaler and Goodale, 2011) and basal ganglia (Lee and Assad, 2003). Alternatively, M1 and S1 may be involved in the sensorimotor transformation as an essential part of a distributed network where there is no clear-cut segregation of processing modules (Shen and Alexander, 1997; Zhang et al., 1997; Hernandez et al., 2010). While our results cannot distinguish between these two possibilities, the presence of TS information in M1 and S1 indicates that these areas are not involved in merely movement production, but reflect sensory components of the visuo-motor transformation, as well.
The second feature of movements clearly reflected by cortical activity was velocity. Approach velocity was found to shift as a function of TS (Figures 3C,D). Neural activity at the time of movement initiation paralleled this shift via FR amplitude. Higher velocity trials correlated with higher FR during and slightly after movement onset (Figure 5D). This result was expected, as numerous previous studies have strongly linked motor cortical activity with velocity (Moran and Schwartz, 1999; Todorov, 2000; Lebedev et al., 2005; Wang et al., 2007; Li et al., 2009). Additionally, a large percentage of M1 neurons were found to encode both target-centric (reach distance) and motor (direction, position) parameters during movement, often in a serial manner (Fu et al., 1995). Our findings also indicate that S1 neurons exhibit velocity tuning, consistent with previous studies that have described S1 neurons with kinematic modulations (Gardner and Costanzo, 1981; Cohen et al., 1994; Lebedev et al., 1994, 2005; Carmena et al., 2003). In our experiments, S1 representation of velocity was somewhat weaker than in M1, however the maximum modulation epoch was similar (300–700 ms after movement onset).
Target size has not previous been identified to modulate FR profiles in M1 or S1. Using both linear regression and LDA, we found that in both M1 and S1 the neural representation of TS becomes prominent first during the RT period, coinciding with the rise of RT encoding (Figures 8A–C). This, again, expands the role of M1 beyond simply motor execution (Shen and Alexander, 1997; Zhang et al., 1997; Merchant et al., 2004). Our data showed a second, more subtle effect in both monkeys, with TS again represented 100–300 ms following movement onset (Figures 8D–F) near the onset of velocity representation. Thus, our results suggest that M1 is one of the loci of evidence-accumulation, since it seems to integrate TS information with motor parameters during the pre-movement period (affecting RT) and near movement onset (affecting velocity).
Somewhat surprisingly, we did not observe clear-cut differences between M1 and S1 modulations during the execution of center-out reaching movements. During the pre-movement period, we found S1 neurons to modulate very similarly to M1. RT and TS were both encoded in S1 during this period, although the onset of this representation was no sooner than 200 ms after target onset, compared to an earlier 50–100 ms post-stimulus representation in M1 (Figures 8B–C). Pre-movement activity has been previously reported in S1 (Soso and Fetz, 1980; Nelson et al., 1991; Lebedev et al., 1994). Moreover, visual information has been reported to affect pre-movement activity patterns in S1 (Liu et al., 2005). Our finding of TS representation in M1 provides additional evidence of the representation of visual information in M1. In addition to cortical visual streams (Wise et al., 1997), the basal ganglia appear a likely candidate for a structure that mediates transmission and processing of this information (Alexander and Crutcher, 1990; Lee and Assad, 2003; Opris et al., 2011).
Implications for BMIs
Much current BMI research focuses on improving movement predictions by either technical improvement (electrode type/number) or algorithm optimization. The motor goal for cortically controlled neuroprosthetics is to recreate complex naturalistic movements using only the neural activity for the patient. Notwithstanding strong early work toward this goal (Carmena et al., 2003; Lebedev et al., 2005; Moritz et al., 2008; Velliste et al., 2008; Vargas-Irwin et al., 2010), there are still many milestones to accomplish (Lebedev and Nicolelis, 2006; Nicolelis and Lebedev, 2009; Lebedev et al., 2011). A recent human BMI study using EEG (P300) driven BMIs confirmed Fitts’ law in movements controlled by neural signals, thus supporting the idea that Fitts’ law parameters can be incorporated into BMI cursor control (Felton et al., 2009). Because Fitts’ law is widely seen in naturally enacted movements, Felton and others (Gilja et al., 2011; Simeral et al., 2011) suggest that Fitts’ law would be an effective tool for comparing BMI subjects, modalities, and tasks. With the results from the present study, we suggest that TS, in addition to motor parameters could be decoded from neural activity in order to improve neuroprosthetic control and approximate naturalistic movements.
The present understanding of Fitts’ law has drastically influenced the ergonomics field, especially in the streamlining of human–computer interaction. Computer interface designs heavily favor rapid point-and-select layouts, prompting the prevalence of pop-up and pie menus, corner icon locations, and appropriate sizing of buttons and GUI controls (MacKenzie, 1992; MacKenzie et al., 2001). Pointing devices such as a mouse or joystick were demonstrated to follow Fitts’ law in a similar manner as manual pointing (Card et al., 1978). The International Organization of Standards requires compliance with Fitts’ law optimized performance on all non-keyboard computer input devices, quantified by both IP (in bits per second) and error rate (ISO9241-9:2000(E)(E), 2002). As brain–computer interfacing develops in coming years, it will be increasingly important to understand the underlying neural mechanisms behind this behavioral property. With BMIs, the subject’s thoughts replace the mouse or joystick as the input device. Being able to decode the size of the desired target, for example, enables a forward model to enhance performance in terms of accurate on-line kinematic predictions, indices of performance, and decreased error rates – the ISO criteria currently used for input devices. Such a forward model could extract the TS from the neural activity during the RT period, as was demonstrated in the present study, and use this parameter to guide more accurate brain-controlled movements. This result would greatly impact the field of neuroprosthetics and make headway toward realizing the goal of enacting naturalistic movements in humans.
The results from this study demonstrate the existence of Fitts’ law in two rhesus macaque monkeys and provide strong indications of the underlying neural correlates. The changes at the behavioral level were paralleled by the modulations of M1 and S1 neurons during the pre- and PME. TS-dependent modulation existed in addition to kinematic tuning thus suggesting a potential encoding that could be exploited in the design of future BMIs. Improved movement predictors that incorporate reach information such as TS will enhance the ability of cortically driven neuroprosthetics in terms of both accuracy and similarity to naturalistic movements.
Conflict of Interest Statement
The authors declare that the research was conducted in the absence of any commercial or financial relationships that could be construed as a potential conflict of interest.
Acknowledgments
We are grateful for the work of Gary Lehew in the building of the experimental setup and the multielectrode arrays; Dragan Dimitrov and Laura Oliveira for conducting neurosurgeries; Tamara Phillips for experimental support; Joseph O’Doherty for assistance in revising the manuscript; Susan Halkiotis for administrative support. This work was supported by R01DE011451, R01NS073125, and RC1HD063390 to Miguel A. L. Nicolelis and Award Number DP1OD006798 from the Office of the Director, National Institutes of Health to Miguel A. L. Nicolelis. The content is solely the responsibility of the authors and does not necessarily represent the official views of the Office of the Director or NIH.
References
Alexander, G. E., and Crutcher, M. D. (1990). Neural representations of the target (goal) of visually guided arm movements in three motor areas of the monkey. J. Neurophysiol. 64, 164–178.
Andersen, R. A., and Cui, H. (2009). Intention, action planning, and decision making in parietal-frontal circuits. Neuron 63, 568–583.
Ashe, J., and Georgopoulos, A. P. (1994). Movement parameters and neural activity in motor cortex and area 5. Cereb. Cortex 4, 590–600.
Bohan, M., Longstaff, M. G., Van Gemmert, A. W., Rand, M. K., and Stelmach, G. E. (2003). Effects of target height and width on 2D pointing movement duration and kinematics. Motor Control 7, 278–289.
Bootsma, R. J., Marteniuk, R. G., Mackenzie, C. L., and Zaal, F. T. (1994). The speed-accuracy trade-off in manual prehension: effects of movement amplitude, object size and object width on kinematic characteristics. Exp. Brain Res. 98, 535–541.
Boyd, L. A., Vidoni, E. D., Siengsukon, C. F., and Wessel, B. D. (2009). Manipulating time-to-plan alters patterns of brain activation during the Fitts’ task. Exp. Brain Res. 194, 527–539.
Card, S. K., English, W. K., and Burr, B. J. (1978). Evaluation of mouse, rate-controlled isometric joystick, step keys, and text keys for text selection on a CRT. Ergonomics 21, 601–613.
Carmena, J. M., Lebedev, M. A., Crist, R. E., O’Doherty, J. E., Santucci, D. M., Dimitrov, D. F., Patil, P. G., Henriquez, C. S., and Nicolelis, M. A. (2003). Learning to control a brain-machine interface for reaching and grasping by primates. PLoS Biol. 1, E42. doi:10.1371/journal. pbio.0000042
Chi, C. F., and Lin, C. L. (1997). Speed and accuracy of eye-gaze pointing. Percept. Mot. Skills 85, 705–718.
Churchland, A. K., Kiani, R., and Shadlen, M. N. (2008). Decision-making with multiple alternatives. Nat. Neurosci. 11, 693–702.
Cisek, P., Crammond, D. J., and Kalaska, J. F. (2003). Neural activity in primary motor and dorsal premotor cortex in reaching tasks with the contralateral versus ipsilateral arm. J. Neurophysiol. 89, 922–942.
Cisek, P., and Kalaska, J. F. (2010). Neural mechanisms for interacting with a world full of action choices. Annu. Rev. Neurosci. 33, 269–298.
Cohen, D. A., Prud’homme, M. J., and Kalaska, J. F. (1994). Tactile activity in primate primary somatosensory cortex during active arm movements: correlation with receptive field properties. J. Neurophysiol. 71, 161–172.
Crammond, D. J., and Kalaska, J. F. (1994). Modulation of preparatory neuronal activity in dorsal premotor cortex due to stimulus-response compatibility. J. Neurophysiol. 71, 1281–1284.
Fagg, A. H., Ojakangas, G. W., Miller, L. E., and Hatsopoulos, N. G. (2009). Kinetic trajectory decoding using motor cortical ensembles. IEEE Trans. Neural Syst. Rehabil. Eng. 17, 487–496.
Felton, E. A., Radwin, R. G., Wilson, J. A., and Williams, J. C. (2009). Evaluation of a modified Fitts law brain-computer interface target acquisition task in able and motor disabled individuals. J. Neural Eng. 6, 056002.
Fisher, R. A. (1936). The use of multiple measurements in taxonomic problems. Ann. Eugen. 7, 179–188.
Fitts, P. M. (1954). The information capacity of the human motor system in controlling the amplitude of movement. J. Exp. Psychol. 47, 381–391.
Fitts, P. M., and Peterson, J. R. (1964). Information capacity of discrete motor responses. J. Exp. Psychol. 67, 103–112.
Fitzsimmons, N. A., Lebedev, M. A., Peikon, I. D., and Nicolelis, M. A. (2009). Extracting kinematic parameters for monkey bipedal walking from cortical neuronal ensemble activity. Front. Integr. Neurosci. 3:3. doi:10.3389/neuro.07.003.2009
Fu, Q. G., Flament, D., Coltz, J. D., and Ebner, T. J. (1995). Temporal encoding of movement kinematics in the discharge of primate primary motor and premotor neurons. J. Neurophysiol. 73, 836–854.
Gardner, E. P., and Costanzo, R. M. (1981). Properties of kinesthetic neurons in somatosensory cortex of awake monkeys. Brain Res. 214, 301–319.
Gilja, V., Chestek, C. A., Diester, I., Henderson, J. M., Deisseroth, K., and Shenoy, K. V. (2011). Challenges and opportunities for next-generation intracortically based neural prostheses. IEEE Trans. Biomed. Eng. 58, 1891–1899.
Gillan, D. J., Holden, K., Adam, S., Rudisill, M., and Magee, L. (1992). How should Fitts’ law be applied to human-computer interaction? Interact. Comput. 4, 291–313.
Gold, J. I., and Shadlen, M. N. (2007). The neural basis of decision making. Annu. Rev. Neurosci. 30, 535–574.
Grandvalet, Y. (1998). “Least absolute shrinkage is equivalent to quadratic penalization,” in Perspectives in Neural Computing, eds L. Niklasson, M. Boden and T. Ziemske (Berlin: Springer Verlag), 201–206.
Hay, L. (1981). The effect of amplitude and accuracy requirements on movement time in children. J. Mot. Behav. 13, 177–186.
Hernandez, A., Nacher, V., Luna, R., Zainos, A., Lemus, L., Alvarez, M., Vazquez, Y., Camarillo, L., and Romo, R. (2010). Decoding a perceptual decision process across cortex. Neuron 66, 300–314.
Hoshi, E., and Tanji, J. (2007). Distinctions between dorsal and ventral premotor areas: anatomical connectivity and functional properties. Curr. Opin. Neurobiol. 17, 234–242.
ISO9241-9:2000(E). (2002). Ergonomic Requirements for Office Work with Visual Display Terminals (VDTs) – Part 9 – Requirements for Non-Keyboard Input Devices (ISO 9241-9). International Organization for Standardization. Geneva, Switzerland.
Jagacinski, R. J., and Monk, D. L. (1985). Fitts’ law in two dimensions with hand and head movements. J. Mot. Behav. 17, 77–95.
Juras, G., Slomka, K., and Latash, M. (2009). Violations of Fitts’ law in a ballistic task. J. Mot. Behav. 41, 525–528.
Kable, J. W., and Glimcher, P. W. (2009). The neurobiology of decision: consensus and controversy. Neuron 63, 733–745.
Kakei, S., Hoffman, D. S., and Strick, P. L. (1999). Muscle and movement representations in the primary motor cortex. Science 285, 2136–2139.
Kalaska, J. F., Scott, S. H., Cisek, P., and Sergio, L. E. (1997). Cortical control of reaching movements. Curr. Opin. Neurobiol. 7, 849–859.
Kerr, R. (1975). Movement control and maturation in elementary-grade children. Percept. Mot. Skills 41, 151–154.
Lalazar, H., and Vaadia, E. (2008). Neural basis of sensorimotor learning: modifying internal models. Curr. Opin. Neurobiol. 18, 573–581.
Lebedev, M. A., Carmena, J. M., O’Doherty, J. E., Zacksenhouse, M., Henriquez, C. S., Principe, J. C., and Nicolelis, M. A. (2005). Cortical ensemble adaptation to represent velocity of an artificial actuator controlled by a brain-machine interface. J. Neurosci. 25, 4681–4693.
Lebedev, M. A., Denton, J. M., and Nelson, R. J. (1994). Vibration-entrained and premovement activity in monkey primary somatosensory cortex. J. Neurophysiol. 72, 1654–1673.
Lebedev, M. A., and Nicolelis, M. A. (2006). Brain-machine interfaces: past, present and future. Trends Neurosci. 29, 536–546.
Lebedev, M. A., O’Doherty, J. E., and Nicolelis, M. A. (2008). Decoding of temporal intervals from cortical ensemble activity. J. Neurophysiol. 99, 166–186.
Lebedev, M. A., Tate, A. J., Hanson, T. L., Li, Z., O’Doherty, J. E., Winans, J. A., Ifft, P. J., Zhuang, K. Z., Fitzsimmons, N. A., Schwarz, D. A., Fuller, A. M., An, J. H., and Nicolelis, M. A. (2011). Future developments in brain-machine interface research. Clinics (Sao Paulo) 66(Suppl. 1), 25–32.
Lebedev, M. A., and Wise, S. P. (2002). Insights into seeing and grasping: distinguishing the neural correlates of perception and action. Behav. Cogn. Neurosci. Rev. 1, 108–129.
Lee, I. H., and Assad, J. A. (2003). Putaminal activity for simple reactions or self-timed movements. J. Neurophysiol. 89, 2528–2537.
Leisman, G. (1989). Limb segment information transmission capacity. J. Manipulative Physiol. Ther. 12, 3–9.
Li, Z., O’Doherty, J. E., Hanson, T. L., Lebedev, M. A., Henriquez, C. S., and Nicolelis, M. A. (2009). Unscented Kalman filter for brain-machine interfaces. PLoS ONE 4, e6243. doi:10.1371/journal.pone.0006243
Liu, Y., Denton, J. M., and Nelson, R. J. (2005). Neuronal activity in primary motor cortex differs when monkeys perform somatosensory and visually guided wrist movements. Exp. Brain Res. 167, 571–586.
MacKenzie, S. (1992). Fitts’ law as a research and design tool in human-computer interaction. Hum. Comput. Interact. 7, 91–139.
MacKenzie, S., Kauppinen, T., and Silfverberg, M. (2001). “Accuracy measures for evaluating computer pointing devices,” in Proceeding of the ACM Conference on Human Factors in Computing Systems – CHI 2001, New York, 9–16.
Maruff, P., Wilson, P., Trebilcock, M., and Currie, J. (1999). Abnormalities of imaged motor sequences in children with developmental coordination disorder. Neuropsychologia 37, 1317–1324.
Mazzoni, P., Hristova, A., and Krakauer, J. W. (2007). Why don’t we move faster? Parkinson’s disease, movement vigor, and implicit motiviation. J. Neurosci. 27, 7105–7116.
Merchant, H., Battaglia-Mayer, A., and Georgopoulos, A. P. (2004). Neural responses in motor cortex and area 7a to real and apparent motion. Exp. Brain Res. 154, 291–307.
Moran, D. W., and Schwartz, A. B. (1999). Motor cortical representation of speed and direction during reaching. J. Neurophysiol. 82, 2676–2692.
Moritz, C. T., Perlmutter, S. I., and Fetz, E. E. (2008). Direct control of paralysed muscles by cortical neurons. Nature 456, 639–642.
Munro, H., Plumb, M. S., Wilson, A. D., Williams, J. H., and Mon-Williams, M. (2007). The effect of distance on reaction time in aiming movements. Exp. Brain Res. 183, 249–257.
Nelson, R. J., Smith, B. N., and Douglas, V. D. (1991). Relationships between sensory responsiveness and premovement activity of quickly adapting neurons in areas 3b and 1 of monkey primary somatosensory cortex. Exp. Brain Res. 84, 75–90.
Nicolelis, M. A., Dimitrov, D., Carmena, J. M., Crist, R., Lehew, G., Kralik, J. D., and Wise, S. P. (2003). Chronic, multisite, multielectrode recordings in macaque monkeys. Proc. Natl. Acad. Sci. U.S.A. 100, 11041–11046.
Nicolelis, M. A., and Lebedev, M. A. (2009). Principles of neural ensemble physiology underlying the operation of brain-machine interfaces. Nat. Rev. Neurosci. 10, 530–540.
Opris, I., Lebedev, M., and Nelson, R. J. (2011). Motor planning under unpredictable reward: modulations of movement vigor and primate striatum activity. Front. Neurosci. 5:56. doi:10.3389/fnins.2011.00061
Paz, R., Boraud, T., Natan, C., Bergman, H., and Vaadia, E. (2003). Preparatory activity in motor cortex reflects learning of local visuomotor skills. Nat. Neurosci. 6, 882–890.
Paz, R., and Vaadia, E. (2009). Learning from learning: what can visuomotor adaptations tell us about the neuronal representation of movement? Adv. Exp. Med. Biol. 629, 221–242.
Pearson, J., and Platt, M. L. (2009). Confidence and corrections: how we make and un-make up our minds. Neuron 63, 724–726.
Plamondon, R., and Alimi, A. M. (1997). Speed/accuracy trade-offs in target-directed movements. Behav. Brain Sci. 20, 279–303; discussion 303–249.
Resulaj, A., Kiani, R., Wolpert, D. M., and Shadlen, M. N. (2009). Changes of mind in decision-making. Nature 461, 263–266.
Roitman, J. D., and Shadlen, M. N. (2002). Response of neurons in the lateral intraparietal area during a combined visual discrimination reaction time task. J. Neurosci. 22, 9475–9489.
Romo, R., and Salinas, E. (2001). Touch and go: decision-making mechanisms in somatosensation. Annu. Rev. Neurosci. 24, 107–137.
Schall, J. D. (2003). Neural correlates of decision processes: neural and mental chronometry. Curr. Opin. Neurobiol. 13, 182–186.
Sergio, L. E., Hamel-Paquet, C., and Kalaska, J. F. (2005). Motor cortex neural correlates of output kinematics and kinetics during isometric-force and arm-reaching tasks. J. Neurophysiol. 94, 2353–2378.
Serruya, M. D., Hatsopoulos, N. G., Paninski, L., Fellows, M. R., and Donoghue, J. P. (2002). Instant neural control of a movement signal. Nature 416, 141–142.
Shannon, C. E., and Weaver, W. (1949). The Mathematical Theory of Communication. Urbana, IL: University of Illinois Press.
Shen, L., and Alexander, G. E. (1997). Neural correlates of a spatial sensory-to-motor transformation in primary motor cortex. J. Neurophysiol. 77, 1171–1194.
Simeral, J. D., Kim, S. P., Black, M. J., Donoghue, J. P., and Hochberg, L. R. (2011). Neural control of cursor trajectory and click by a human with tetraplegia 1000 days after implant of an intracortical microelectrode array. J. Neural Eng. 8, 025027.
Smyrnis, N., Evdokimidis, I., Constantinidis, T. S., and Kastrinakis, G. (2000). Speed-accuracy trade-off in the performance of pointing movements in different directions in two-dimensional space. Exp. Brain Res. 134, 21–31.
Soso, M. J., and Fetz, E. E. (1980). Responses of identified cells in postcentral cortex of awake monkeys during comparable active and passive joint movements. J. Neurophysiol. 43, 1090–1110.
Thaler, L., and Goodale, M. A. (2011). Neural substrates of visual spatial coding and visual feedback control for hand movements in allocentric and target-directed tasks. Front. Hum. Neurosci. 5:92. doi:10.3389/fnhum.2011.00092
Todorov, E. (2000). Direct cortical control of muscle activation in voluntary arm movements: a model. Nat. Neurosci. 3, 391–398.
Todorov, E., and Jordan, M. I. (2002). Optimal feedback control as a theory of motor coordination. Nat. Neurosci. 5, 1226–1235.
Vaadia, E., Kurata, K., and Wise, S. P. (1988). Neuronal activity preceding directional and nondirectional cues in the premotor cortex of rhesus monkeys. Somatosens. Mot. Res. 6, 207–230.
Vargas-Irwin, C. E., Shakhnarovich, G., Yadollahpour, P., Mislow, J. M., Black, M. J., and Donoghue, J. P. (2010). Decoding complete reach and grasp actions from local primary motor cortex populations. J. Neurosci. 30, 9659–9669.
Velliste, M., Perel, S., Spalding, M. C., Whitford, A. S., and Schwartz, A. B. (2008). Cortical control of a prosthetic arm for self-feeding. Nature 453, 1098–1101.
Wang, W., Chan, S. S., Heldman, D. A., and Moran, D. W. (2007). Motor cortical representation of position and velocity during reaching. J. Neurophysiol. 97, 4258–4270.
Weiss, P., Stelmach, G. E., Adler, C. H., and Waterman, C. (1996). Parkinsonian arm movements as altered by task difficulty. Parkinsonism Relat. Disord. 2, 215–223.
Wessberg, J., Stambaugh, C. R., Kralik, J. D., Beck, P. D., Laubach, M., Chapin, J. K., Kim, J., Biggs, S. J., Srinivasan, M. A., and Nicolelis, M. A. (2000). Real-time prediction of hand trajectory by ensembles of cortical neurons in primates. Nature 408, 361–365.
Wiener, N. (1949). Extrapolation, Interpolation, and Smoothing of Stationary Time Series. New York: Wiley.
Wilson, P. H., Maruff, P., Ives, S., and Currie, J. (2001). Abnormalities of motor and praxis imagery in children with DCD. Hum. Mov. Sci. 20, 135–159.
Wise, S. P., Boussaoud, D., Johnson, P. B., and Caminiti, R. (1997). Premotor and parietal cortex: corticocortical connectivity and combinatorial computations. Annu. Rev. Neurosci. 20, 25–42.
Wise, S. P., Di Pellegrino, G., and Boussaoud, D. (1996). The premotor cortex and nonstandard sensorimotor mapping. Can. J. Physiol. Pharmacol. 74, 469–482.
Wise, S. P., Moody, S. L., Blomstrom, K. J., and Mitz, A. R. (1998). Changes in motor cortical activity during visuomotor adaptation. Exp. Brain Res. 121, 285–299.
Xiao, J., Padoa-Schioppa, C., and Bizzi, E. (2006). Neuronal correlates of movement dynamics in the dorsal and ventral premotor area in the monkey. Exp. Brain Res. 168, 106–119.
Keywords: motor cortex, somatosensory cortex, sensorimotor transformation, neurophysiology, Fitts’ law, decision making, brain–machine interface, neuroprosthetics
Citation: Ifft PJ, Lebedev MA and Nicolelis MAL (2011) Cortical correlates of Fitts’ law. Front. Integr. Neurosci. 5:85. doi: 10.3389/fnint.2011.00085
Received: 02 November 2011; Paper pending published: 25 November 2011;
Accepted: 02 December 2011; Published online: 22 December 2011.
Edited by:
Elizabeth B. Torres, Rutgers University, USAReviewed by:
Adrian Rodriguez-Contreras, City College of New York, USAJohn F. Araujo, Federal University of Rio Grande do Norte, Brazil
Copyright: © 2011 Ifft, Lebedev and Nicolelis. This is an open-access article distributed under the terms of the Creative Commons Attribution Non Commercial License, which permits non-commercial use, distribution, and reproduction in other forums, provided the original authors and source are credited.
*Correspondence: Miguel A. L. Nicolelis, Department of Neurobiology, Duke University Medical Center, Bryan Research Building, Box 3209, Room 327E, 101 Research Drive, Durham, NC 27100, USA. e-mail:bmljb2xlbGlAbmV1cm8uZHVrZS5lZHU=