 Melanie Kempf1,2*
 Susanne Kohl3
 Krunoslav Stingl1,2
 Fadi Nasser4
 Katarina Stingl1,2
 Friederike C. Kortuem1
- 1University Eye Hospital, Center for Ophthalmology, University of Tuebingen, Tuebingen, Germany
- 2Center for Rare Eye Diseases, University of Tuebingen, Tuebingen, Germany
- 3Institute for Ophthalmic Research, Center for Ophthalmology, University of Tuebingen, Tuebingen, Germany
- 4University Eye Hospital, University of Leipzig, Leipzig, Germany
Purpose: To determine the structure of the cone photoreceptor mosaic in the macula in eyes with retinitis pigmentosa related to Usher syndrome using adaptive optics fundus (AO) imaging and to correlate these findings with those of the standard clinical diagnostics.
Methods: Ten patients with a genetically confirmed retinitis pigmentosa in Usher syndrome due to biallelic variants in MYO7A or USH2A were enrolled in the study. All patients underwent a complete ophthalmological examination including best corrected visual acuity (BCVA), spectral-domain optical coherence tomography (SD-OCT) with fundus autofluorescence photography (FAF), full-field (ffERG) and multifocal electroretinography (mfERG) and Adaptive Optics Flood Illuminated Ophthalmoscopy (AO, rtx1™, Imagine Eyes, Orsay, France). The cone density was assessed centrally and at each 0.5 degree horizontally and vertically from 1–4 degree of eccentricity.
Results: In the AO images, photoreceptor cell death was visualized as a disruption of the cone mosaic and low cone density. In the early stage of the disease, cones were still visible in the fovea, whereas outside the fovea a loss of cones was recognizable by blurry, dark patches. The blurry patches corresponded to the parafoveal hypofluorescent ring in the FAF images and the beginning loss of the IS/OS line and external limiting membrane in the SD-OCT images. FfERGs were non-recordable in 7 patients and reduced in 3. The mfERG was reduced in all patients and correlated significantly (p <0.001) with the cone density. The kinetic visual field area, measured with III4e and I4e, did not correlate with the cone density.
Conclusion: The structure of the photoreceptors in Usher syndrome patients were detectable by AO fundus imaging. The approach of using high-resolution technique to assess the photoreceptor structure complements the established clinical examinations and allows a more sensitive monitoring of early stages of retinitis pigmentosa in Usher syndrome.
Introduction
Usher syndrome (USH) is an autosomal recessive disease characterized by hearing loss and retinitis pigmentosa (RP) in some subtypes. In addition, patients can present with vestibular and olfactory deficits (1). The syndrome is the most common genetic cause of deaf-blindness (1, 2) and was first recognized and described by Albrecht von Graefe in 1858 (3) and further investigated by Charles Usher in 1914. Functionally, RP is characterized by impaired night vision, progressive loss of the visual field and a reduced visual acuity due to the progressive degeneration of the photoreceptors. Fundus features include blood vessel attenuation, disc pallor, cystoid macular edema and peripheral bone spicule derived from the retinal pigment epithelium (RPE) changes (4). Usher syndrome is subdivided into four clinical subtypes (USH1, USH2, USH3 and USH4) depending on the severity and time of onset of auditory, vestibular and visual symptoms (5). At least 9 causative genes have been found and identified to be responsible for Usher syndrome: Five for USH1 (MYO7A, USH1C, CDH23, PCDH15, and USH1G), three for USH2 (USH2A, ADGRV1, and WHRN) and one for USH3 (CLRN1). However, other genes and loci have been proposed and discussed to be related to Usher syndrome (6).
Hearing aids or cochlear implants can compensate the hearing loss, but so far there is no approved causal genetic treatment for the RP in Usher syndrome. However, over the last several years research on Usher syndrome has increased, with studies on gene and cell therapies providing hope for an efficient prevention of the sensory loss (7). Nevertheless, more studies on the natural history of the disease are required to aid planning clinical trials. Reliable and sensitive tools need to be tested and developed to evaluate the effect of experimental treatments.
With the availability of adaptive optics (AO) fundus imaging, the non-invasive visualization of the photoreceptor mosaic on a cellular level became possible (8, 9), and abnormalities in individual cone photoreceptor mosaic in patients with various retinal diseases could be studied (10–18). AO technologies have also been combined with optical coherence tomography (AO-OCT), fundus photography and scanning-laser ophthalmoscopy (AO-SLO), that increased the sensitivity and resolution and thus provided new insights into the effects of retinal degenerations (12–14, 18–24).
In this study we used flood illuminated adaptive optics (FI-AO) camera (rtx1™), an advanced high-resolution fundus imaging method to quantify the photoreceptor mosaic in RP associated with Usher syndrome. Additionally, we compared and correlated the results with those of spectral-domain optical coherence tomography (SD-OCT), fundus autofluorescence photography (FAF), semiautomatic kinetic visual field testing, full-field (ffERG) and multifocal electroretinography (mfERG) that are used for clinical ophthalmological diagnostics in our clinical routine for inherited retinal dystrophies. The aim was to explore the use of high-resolution FI-AO for diagnosis and monitoring of disease progression.
Materials and methods
Ten patients with a clinical diagnosis of RP with Usher syndrome and likely biallelic variants in MYO7A (Usher syndrome type 1) or USH2A (Usher syndrome type 2) who presented for follow-ups at the University Eye Hospital, Tübingen were included in the study (Table 1). Exclusion criteria included the inability of a moderate fixation, macular edema, central media opacity such as but not only cataract. In addition, patients with a history of any systemic disease (e.g. hypertension) or other eye complications were excluded. The examinations were approved by the institutional Ethics Committee and adhered to the Declaration of Helsinki. All subjects were informed about the consequences of the procedure and informed consent was received from all subjects. Statistical analysis was performed using SPSS (Version 27.0 SPSS Inc. Chicago, IL) and the graphs were created using JMP16 (SAS institute Inc., Cary, NC, USA).
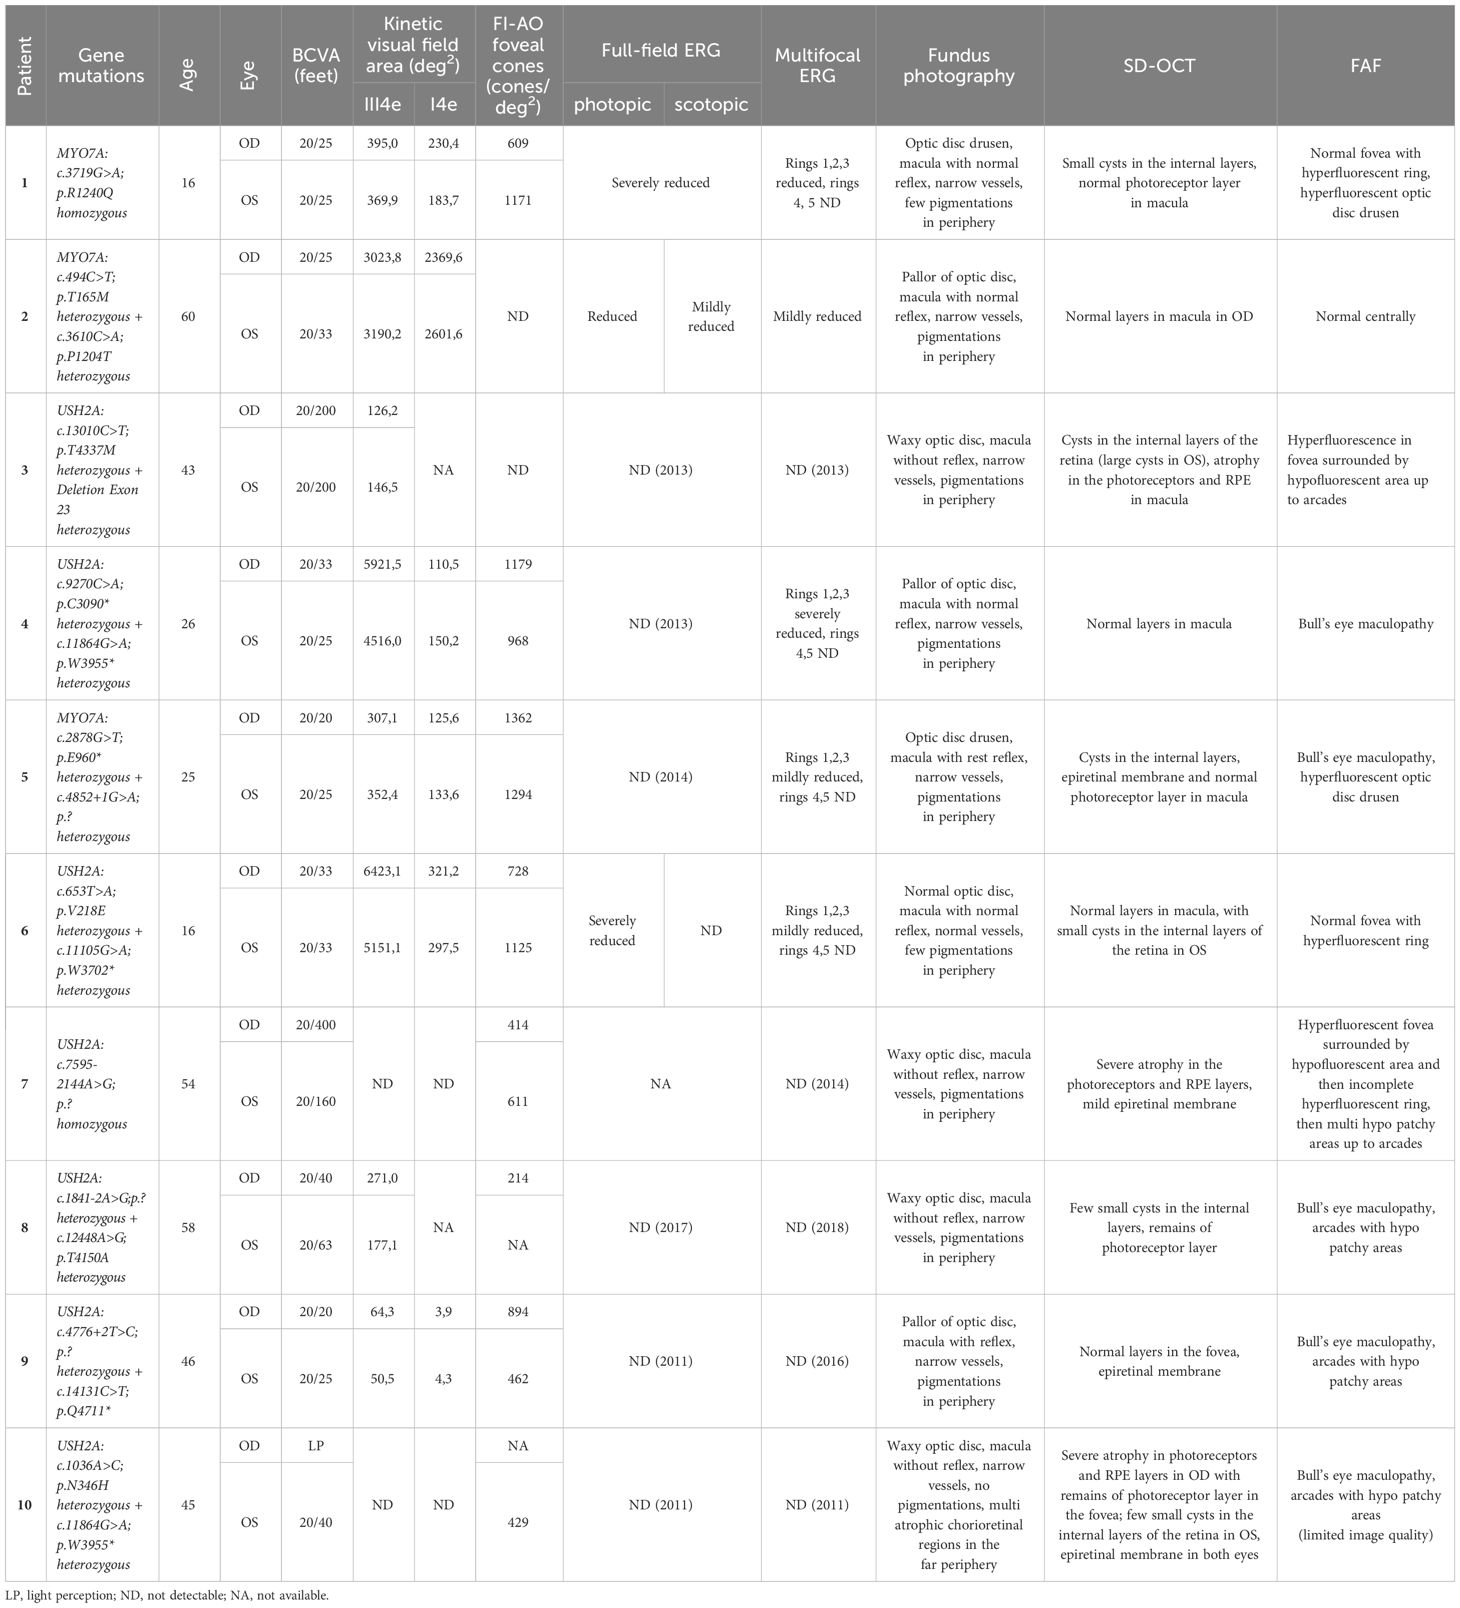
Table 1 Clinical data of all patients including genetic findings, age, visual acuity, kinetic perimetry, mf ERG, and description of fundus, SD-OCT and FAF.
Ophthalmologic examinations
All subjects underwent a comprehensive ophthalmological examination, including best-corrected visual acuity (BCVA), indirect ophthalmoscopy, slit-lamp examination, semiautomated kinetic visual field testing with the Octopus 900 (Haag-Streit, Wedel, Germany) using the III4e (4 mm2, 320 cd/m2, white stimulus) on a white standardized background (10 cd/m2) and I4e target (0.25 mm2, 320 cd/m2, white stimulus) mark. Full-field (ffERG) and multifocal ERG (mfERG) were recorded using the Espion E2 and E3 (Diagnosys LCC, Cambridge, UK) according to the standards of the International Society for Clinical Electrophysiology of Vision (ISCEV) (25, 26).
Retinal imaging was performed with color fundus photography (Zeiss FF450 IR Fundus Camera, Carl Zeiss Meditec, Jena, Germany), Adaptive Optics Flood Illumination Ophthalmoscopy (rtx1™, Imagine Eyes, Orsay, France) spectral domain optical coherence tomography (SD-OCT) with fundus autofluorescence photography (FAF, Spectralis® HRA+OCT system Heidelberg Engineering GmbH, Heidelberg, Germany). A volume scan, a horizontal and vertical line scan through the central fovea was acquired with the SD-OCT.
In AO, a montage covering the central area of approximately 8 x 8 degree was combined from single images. The montage was either automatically created by the inbuilt software (i2k Retina Pro Version 3.1.0) provided by the manufacturer or manually assigned by a single observer. The cone density was analyzed at each 0.5 degree of the horizontal and vertical line from 1–4 degree of eccentricity, as well as at the central foveola. Cones were identified in a region of interest (ROI), an 80x80 pixels sampling area, corresponding to an area of approximately 63 x 63 µm on the retina and were analyzed using a custom semiautomated software provided by the manufacturer (AOdetect, version 3.0, Imagine Eyes, Orsay, France) that located the cones automatically. Non-waveguiding cones could not be counted by the program. The count was then manually assigned by the observer. Especially in the strongly degenerated areas a manually assessment and correction was necessary. The axial length was not measured, therefore the cone density is expressed in number of cones per degree2 (visual units), where the eye length is not taken into account in the calculation. Due to poor image quality the AO-FIO images from 4 of the 18 eyes had to be excluded from analysis.
Genetic testing
All patients had a genetically confirmed Usher syndrome with likely biallelic mutations in the MYO7A or USH2A genes (see Table 1). Three patients suffered from Usher syndrome type I (USH1), seven patients from Usher syndrome type II (USH2).
Results
The clinical characteristics and genetic profiles of the patients are summarized in Table 1, along with a short description of the fundus photography, imaging and ERG results. The patients were between 16 and 60 years old (Table 1). All USH1 patients had cochlea implants and USH2 patients had hearing aids. The best-corrected visual acuity (BCVA) ranged from 20/400 (feet) to 20/20 (feet). One eye had light perception. Here, only limited examinations were possible. The mean BCVA was 0.25 ± 0.43(logMAR) for the right eye and 0.24 ± 0.52 (logMAR) for the left, which is approximately equivalent to 20/40.
Fundus photography
In Figure 1 the fundus photos of the 10 patients are shown. Nine patients had RPE changes with pigmentations (i.e. bone spicules) in the periphery, and one patient (Patient 10) had no pigmentations in the fundus but displayed multiple atrophic chorioretinal lesions in the far periphery. The macula was without reflex in patients 3, 5, 6, 7, 8 and 10 and with good reflex in patients 1, 2, 4 and 9. Most patients had narrow vessels, except patient 6 who had a normal vasculature. The optic disc appearance was normal in patient 6, pale in patients 2, 4 and 9 and waxy in patients 3, 7, 8 and 10. Two patients (Patients 1 and 5) had optic disc drusen.
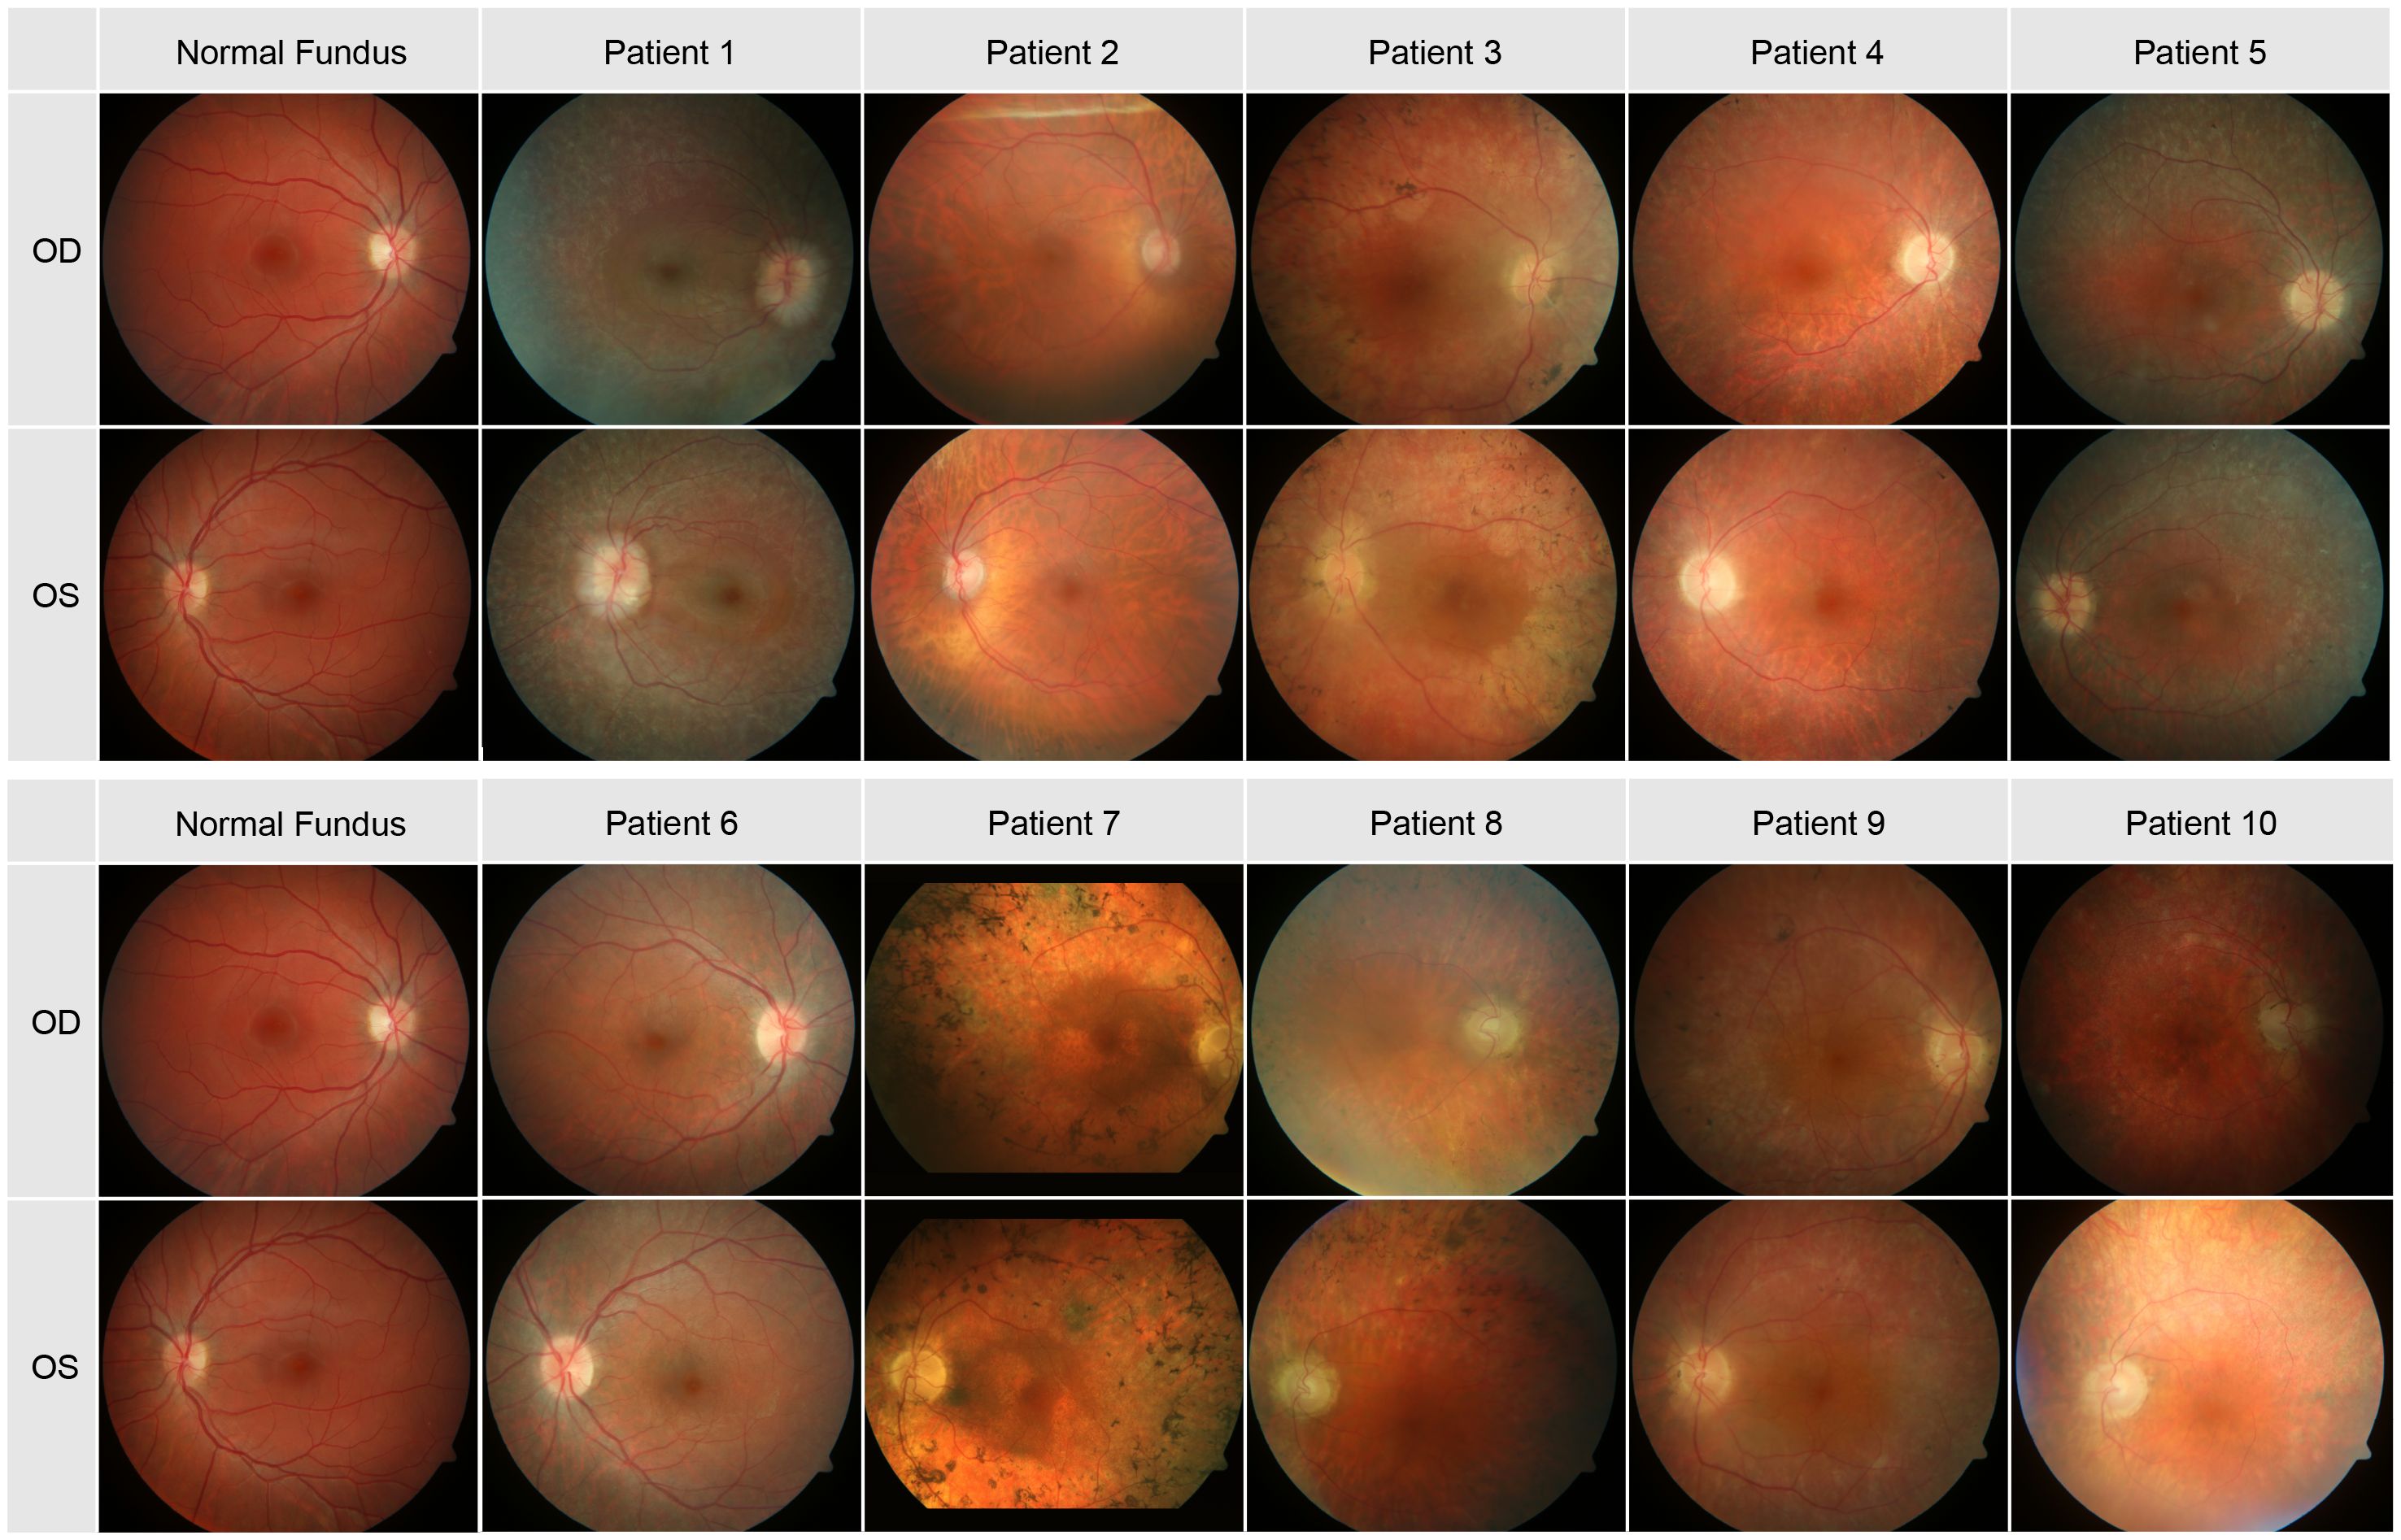
Figure 1 Color photos of the central pole of all 10 patients.
OCT imaging
The transfoveal horizontal line scan of all patients can be seen in Figure 2. Small cysts in the internal layers in both eyes of patients 1, 5 and 8 were found, as well as in the left eye of patients 6 and 10. The cysts were large in both eyes in patient 3 (see asterisks in Figure 2). A discrete epiretinal membrane was apparent in both eyes of patients 5, 7, 9 and 10 (see arrows in Figure 2). These membranes did not have an effect on the foveal contour and depression. A normal photoreceptor layer in the macula of both eyes was seen in patients 1, 2, 4, 5, 6 and 9, and atrophy in the photoreceptors and RPE in both eyes of patients 3 and 7. In patient 8 the SD-OCT images had a residual photoreceptor layer in the fovea but, the foveal contour was altered due to residual macular edema. The SD-OCT of patient 10 showed severe atrophy in photoreceptor and RPE layers in the right eye, but with a residual photoreceptor layer in the area of the fovea in the left eye.
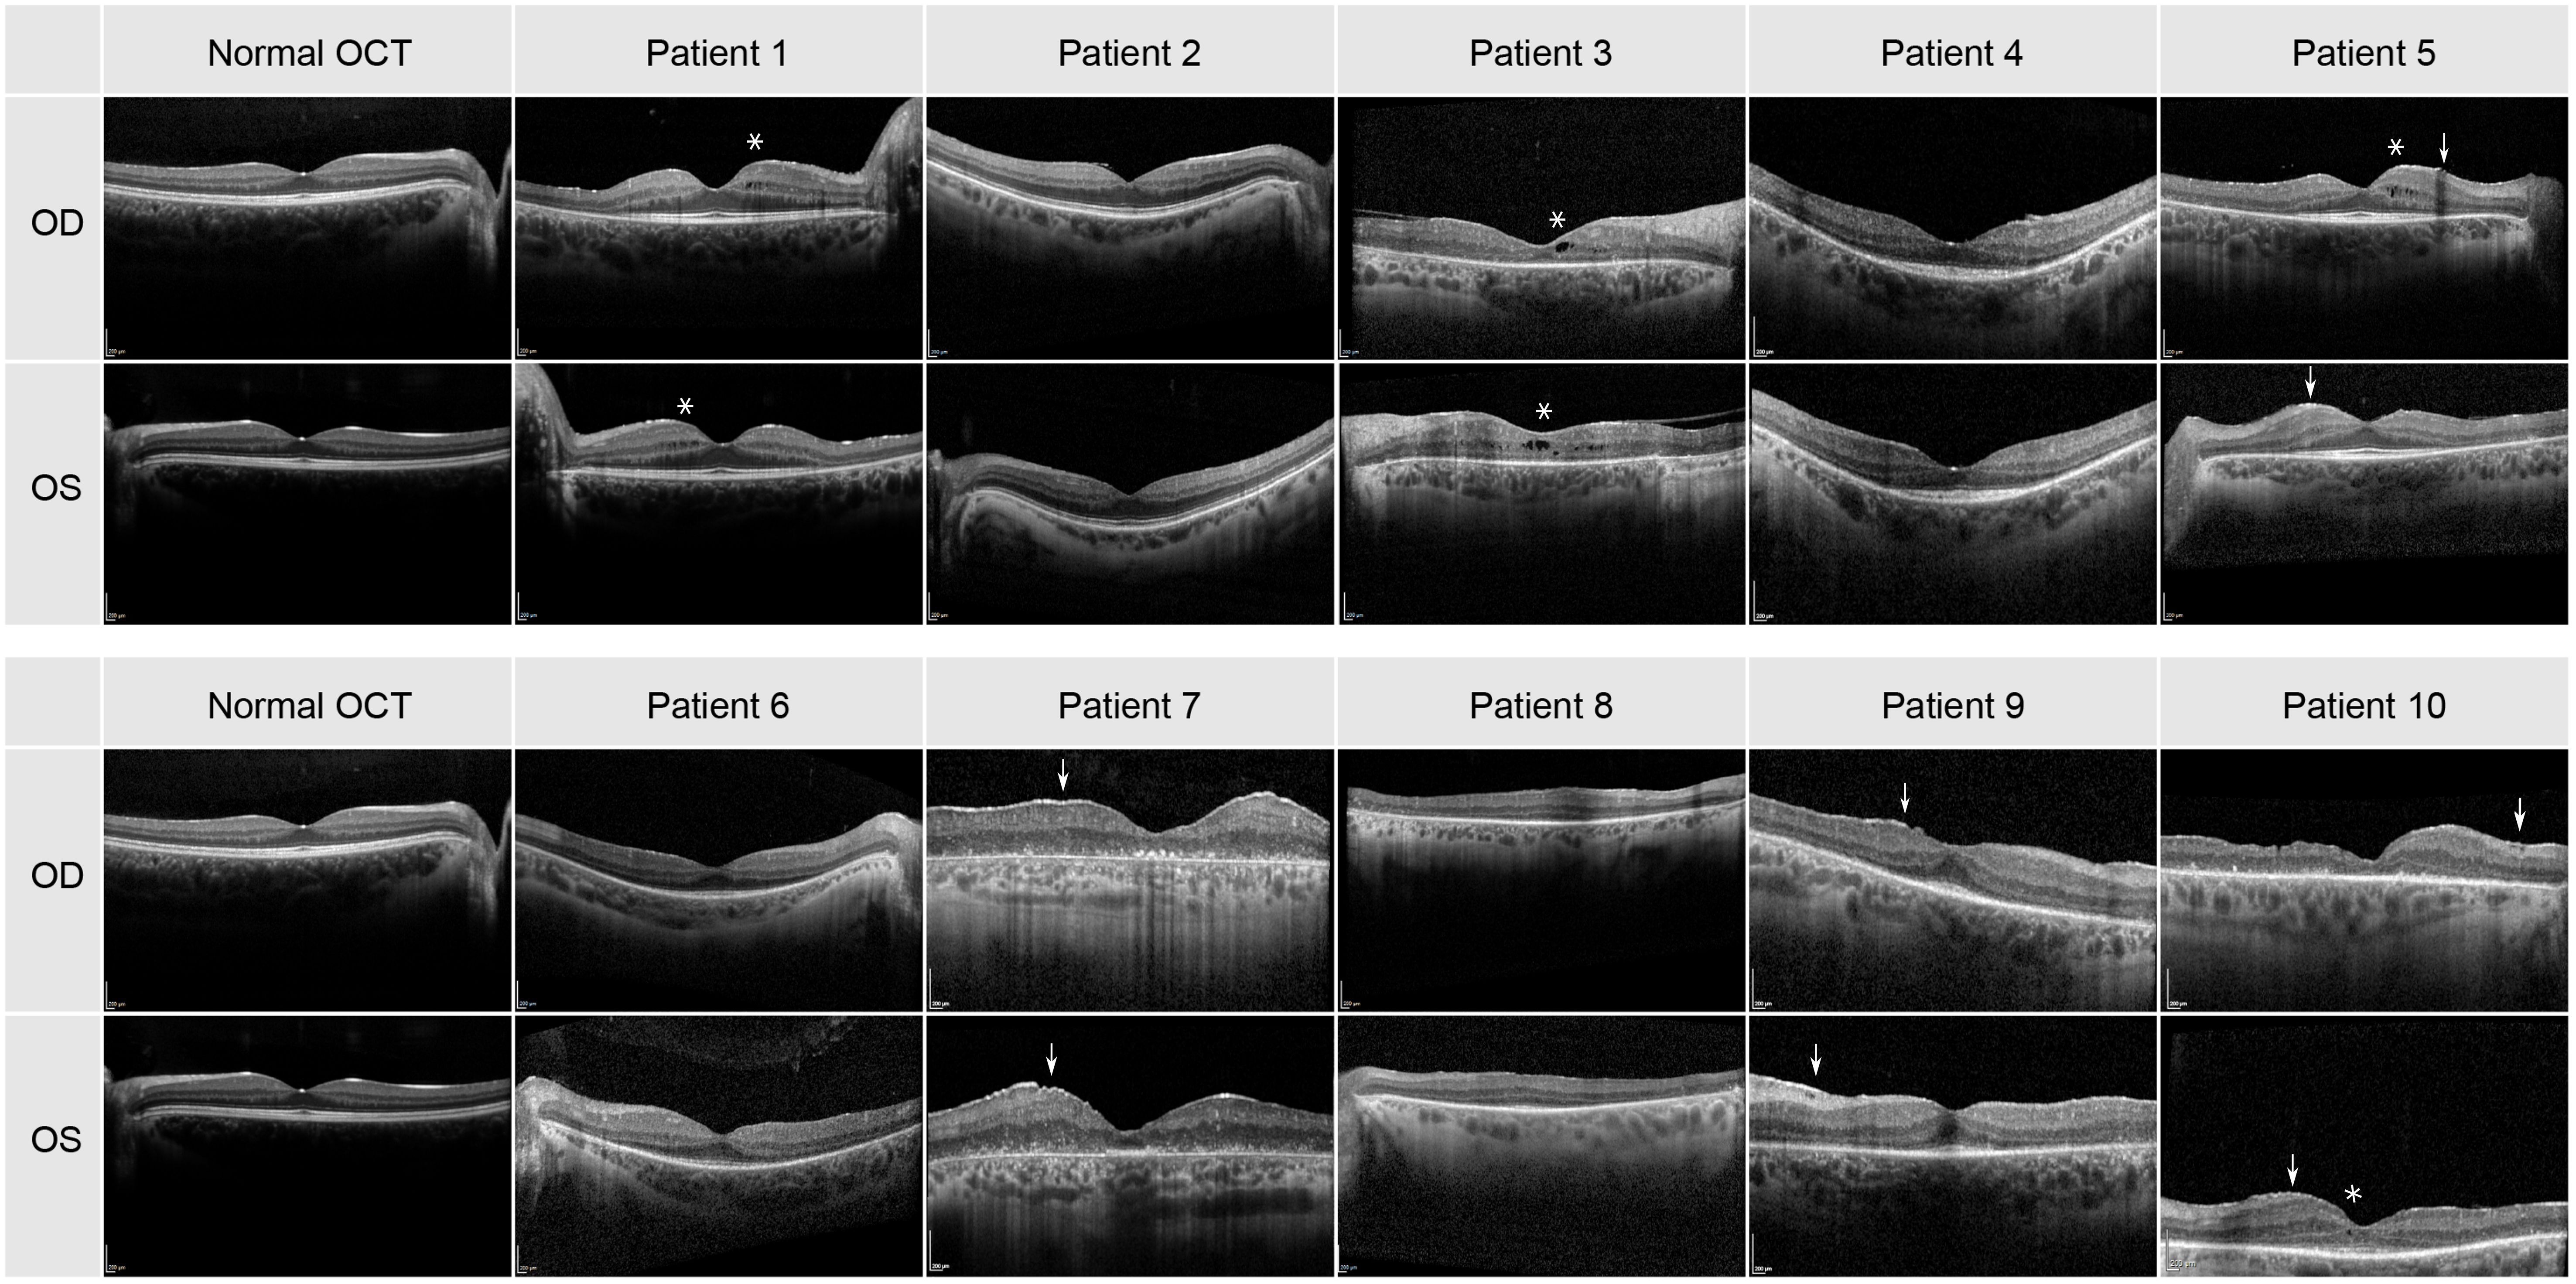
Figure 2 Transfoveal horizontal line scan of the central macula for all 10 patients. Cysts are highlighted by an asterisk and the epiretinal membrane by an arrow.
Fundus autofluorescence
The FAF images are depicted in Figure 3 and described in Table 1. A hypofluorescent center in both eyes of patients 4, 5 8, 9 and 10 with a hyperfluorescent ring (Bull’s eye maculopathy) could be seen and almost normal fovea with a hyperfluorescent ring around it in both eyes of patients 1 and 6. Patient 3 showed FAF hyperfluorescence in the fovea (more in the left eye), which was surrounded by a hypofluorescent area up to the arcades in both eyes. In patients 1 and 5, a hyperfluorescent optic disc was found in both eyes. In patient 7, the FAF showed both hyperfluorescent and hypofluorescent areas from the fovea up to arcades. Patient 1 and 5 had both hyperfluorescent drusen at the optic disc. Only patient 2 showed a normal FAF appearance in the fovea of both eyes.
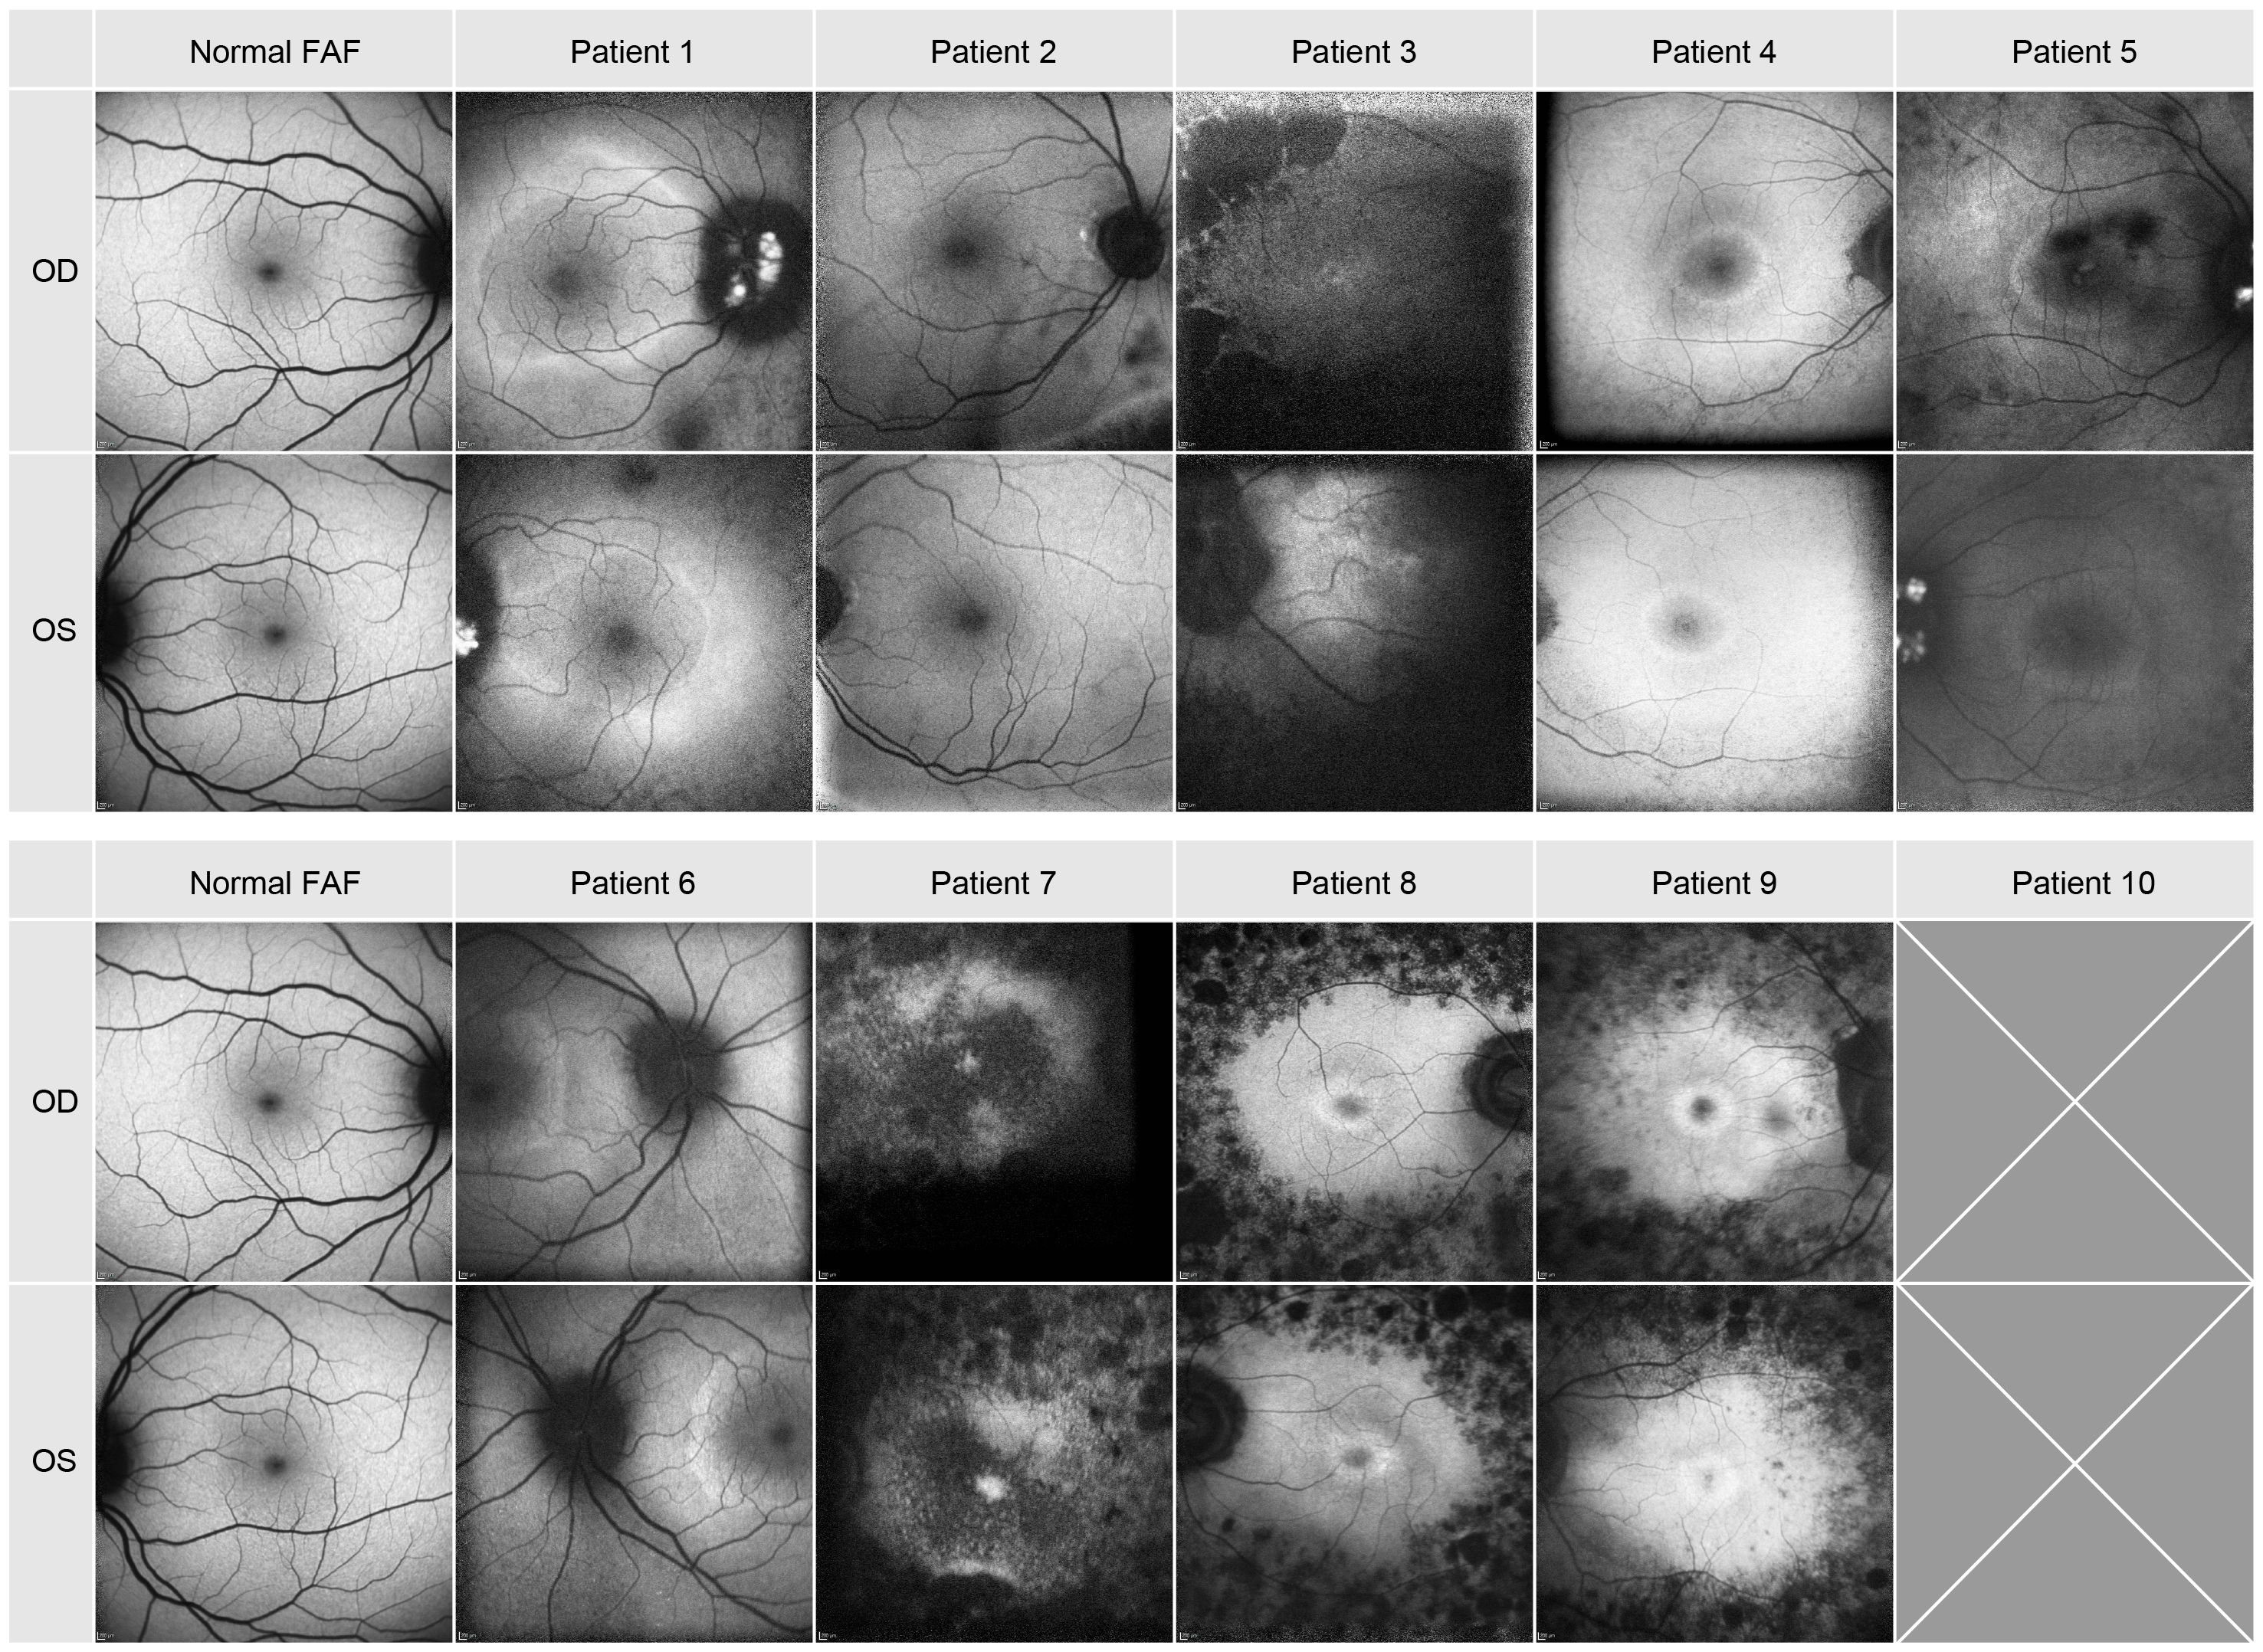
Figure 3 Autofluorescence images of the posterior pole of all patients.
Electroretinograms
The scotopic and photopic full-field ERG were not recordable in both eyes in the majority of the patients (patients 3, 4, 5, 7, 8, 9, 10). Patient 1 showed severely reduced amplitudes in the scotopic and photopic ERG and patient 2 had reduced amplitudes in the photopic ERG and mildly reduced amplitudes in the scotopic ERG. Furthermore, the scotopic ERG was undetectable in both eyes of patient 6 and the photopic ERG showed only small remaining amplitudes.
The multifocal ERG was also not detectable. In 50% of the patients (patient 3, 7, 8, 9, 10). Patients 1, 4, 5, 6 showed reduced amplitudes in the first three inner rings and no remaining amplitudes in the two outer rings. Compared to normal values patient 2 showed only mildly reduced responses.
Visual field
The visual field areas delimited by the Goldmann III4e target were severely reduced in all 10 patients. Patient 7 and 10 could not identify the III4e stimulus (Table 1). In two other patients (patient 3, 8) the visual field was not measured with the I4e target. The kinetic visual field area in degree2 tested by the III4e ranged from 6423 to 0 and from 2602 to 0 tested by the I4e.
Adaptive optics
In all patients FI-AO images were obtained. These are depicted in Figure 4. In patient 1 only five images per eye were taken and in patients 8 and 10 images of only one eye were acquired. Almost all eyes demonstrated a cone mosaic pattern with some dark patchy areas (hypo-reflective blurred cone-like structures). In patient 1 and 6 the cone mosaic appeared most preserved. In both eyes of patient 7 there was no recognizable mosaic: The image is marked by dark patchy and bright white areas, i.e. hyper- and hyporeflective areas. Only some single waveguiding cones were observable in the whole montage.
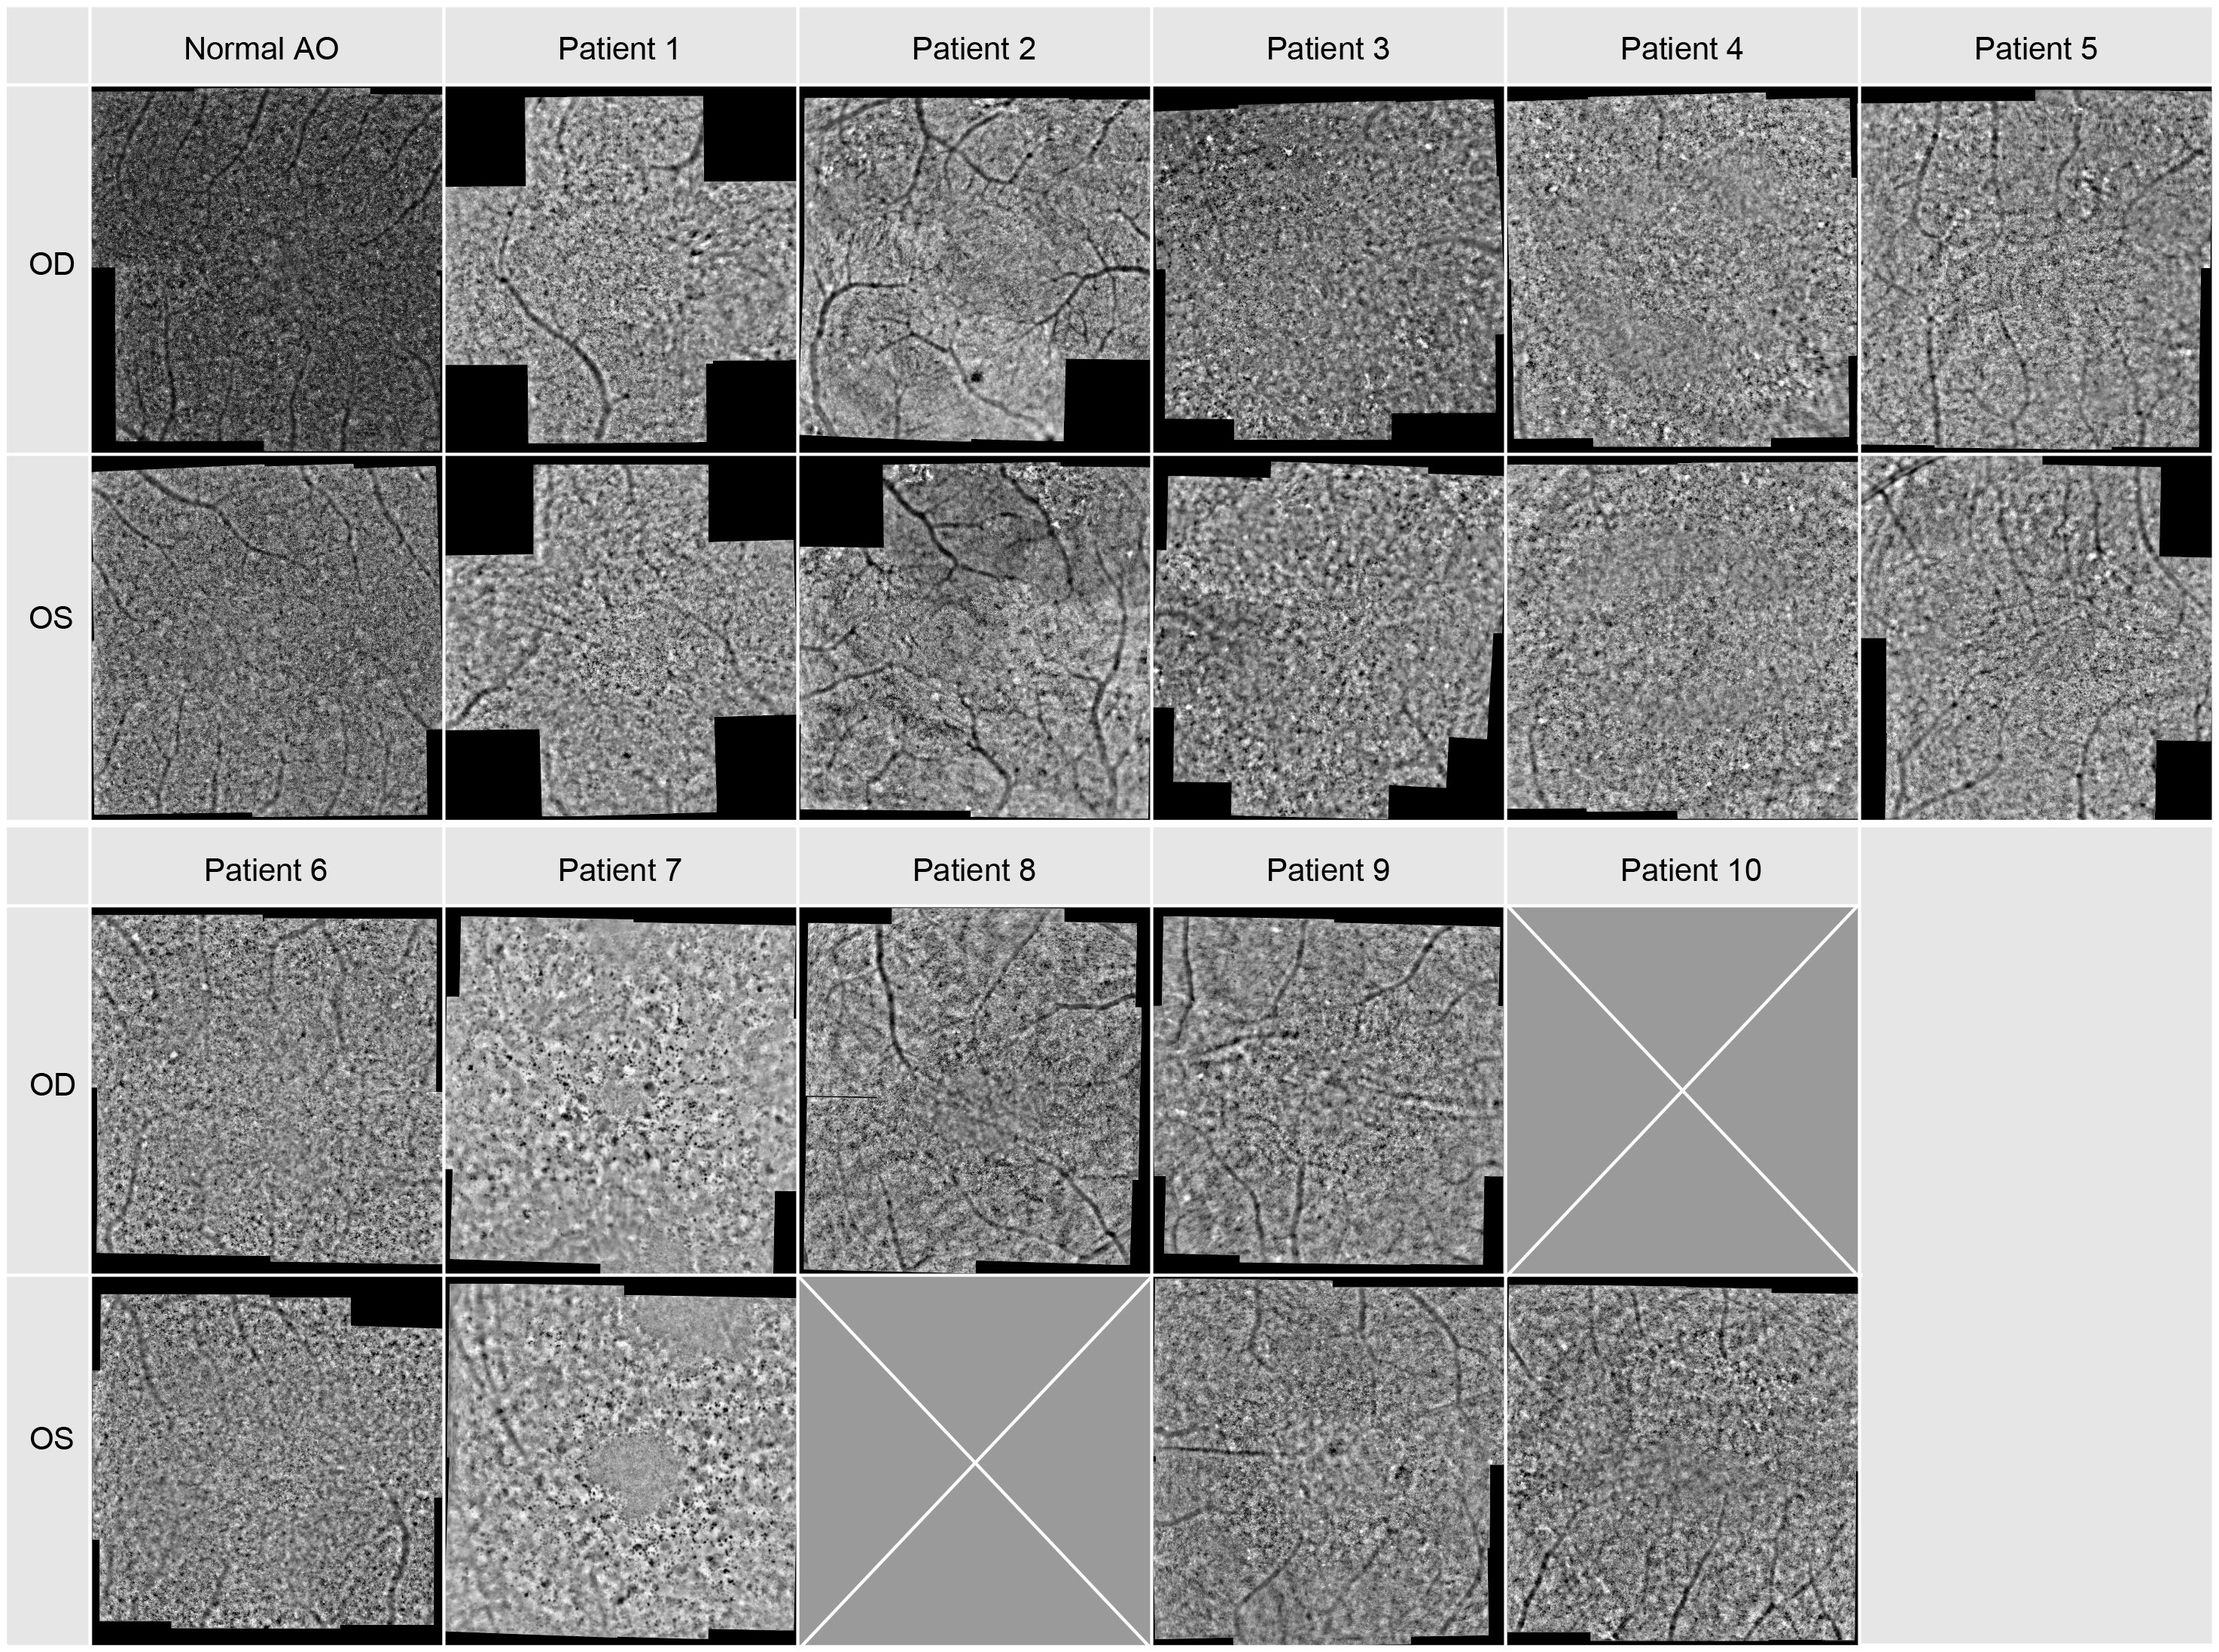
Figure 4 Adaptive optics images of the central macular region. Image montage covers an area of approx. 8x8 degrees for each patient, for Patient 1 it covers only 8 degrees in the horizontal and vertical meridian.
When comparing the pattern of these dark blurry regions with the images of the SD-OCT and FAF imaging displayed in Figures 2, 3, they were corresponding to the areas in which cone degeneration is evident i.e. by the loss of IS/OS border and external limiting membrane in Figure 2 and by the hypofluorescent ring in Figure 3.
In patients 2 and 3, only images with a poorer quality could be obtained.
The density of the cone photoreceptors was analyzed at the fovea and at each 0.5 degree from 1–4 degree of eccentricity in both vertical and horizonal directions. The cone density per degree2 was calculated within these 80x80 pixels regions of interest. In Figure 5, examples are provided to illustrate the locations where cone density was measured in two patients. Seven regions of interest are shown with a higher magnification to provide a better insight into the photoreceptor mosaic along the horizontal and vertical meridian between 0 and 3 degrees. One patient with an advanced stage of retinitis pigmentosa and another patient with a milder progression are depicted. The results are shown in Figure 6, along with normative data from Legras et al., 2018 (27), who also analyzed the cone density and arrangement with AO in a healthy population of 109 subjects. Compared to healthy individuals and the normative data the cone density of the patients was severely reduced. Furthermore, a comparison with the outer nuclear layer (ONL) thickness observed in SD-OCT revealed its relation to the reduction in photoreceptor density in Usher patients. If the outer nuclear layer was thinned, and the inner segment/outer segment (IS/OS) line was interrupted, the cone mosaic was also disturbed, leading to a reduction in cell density.
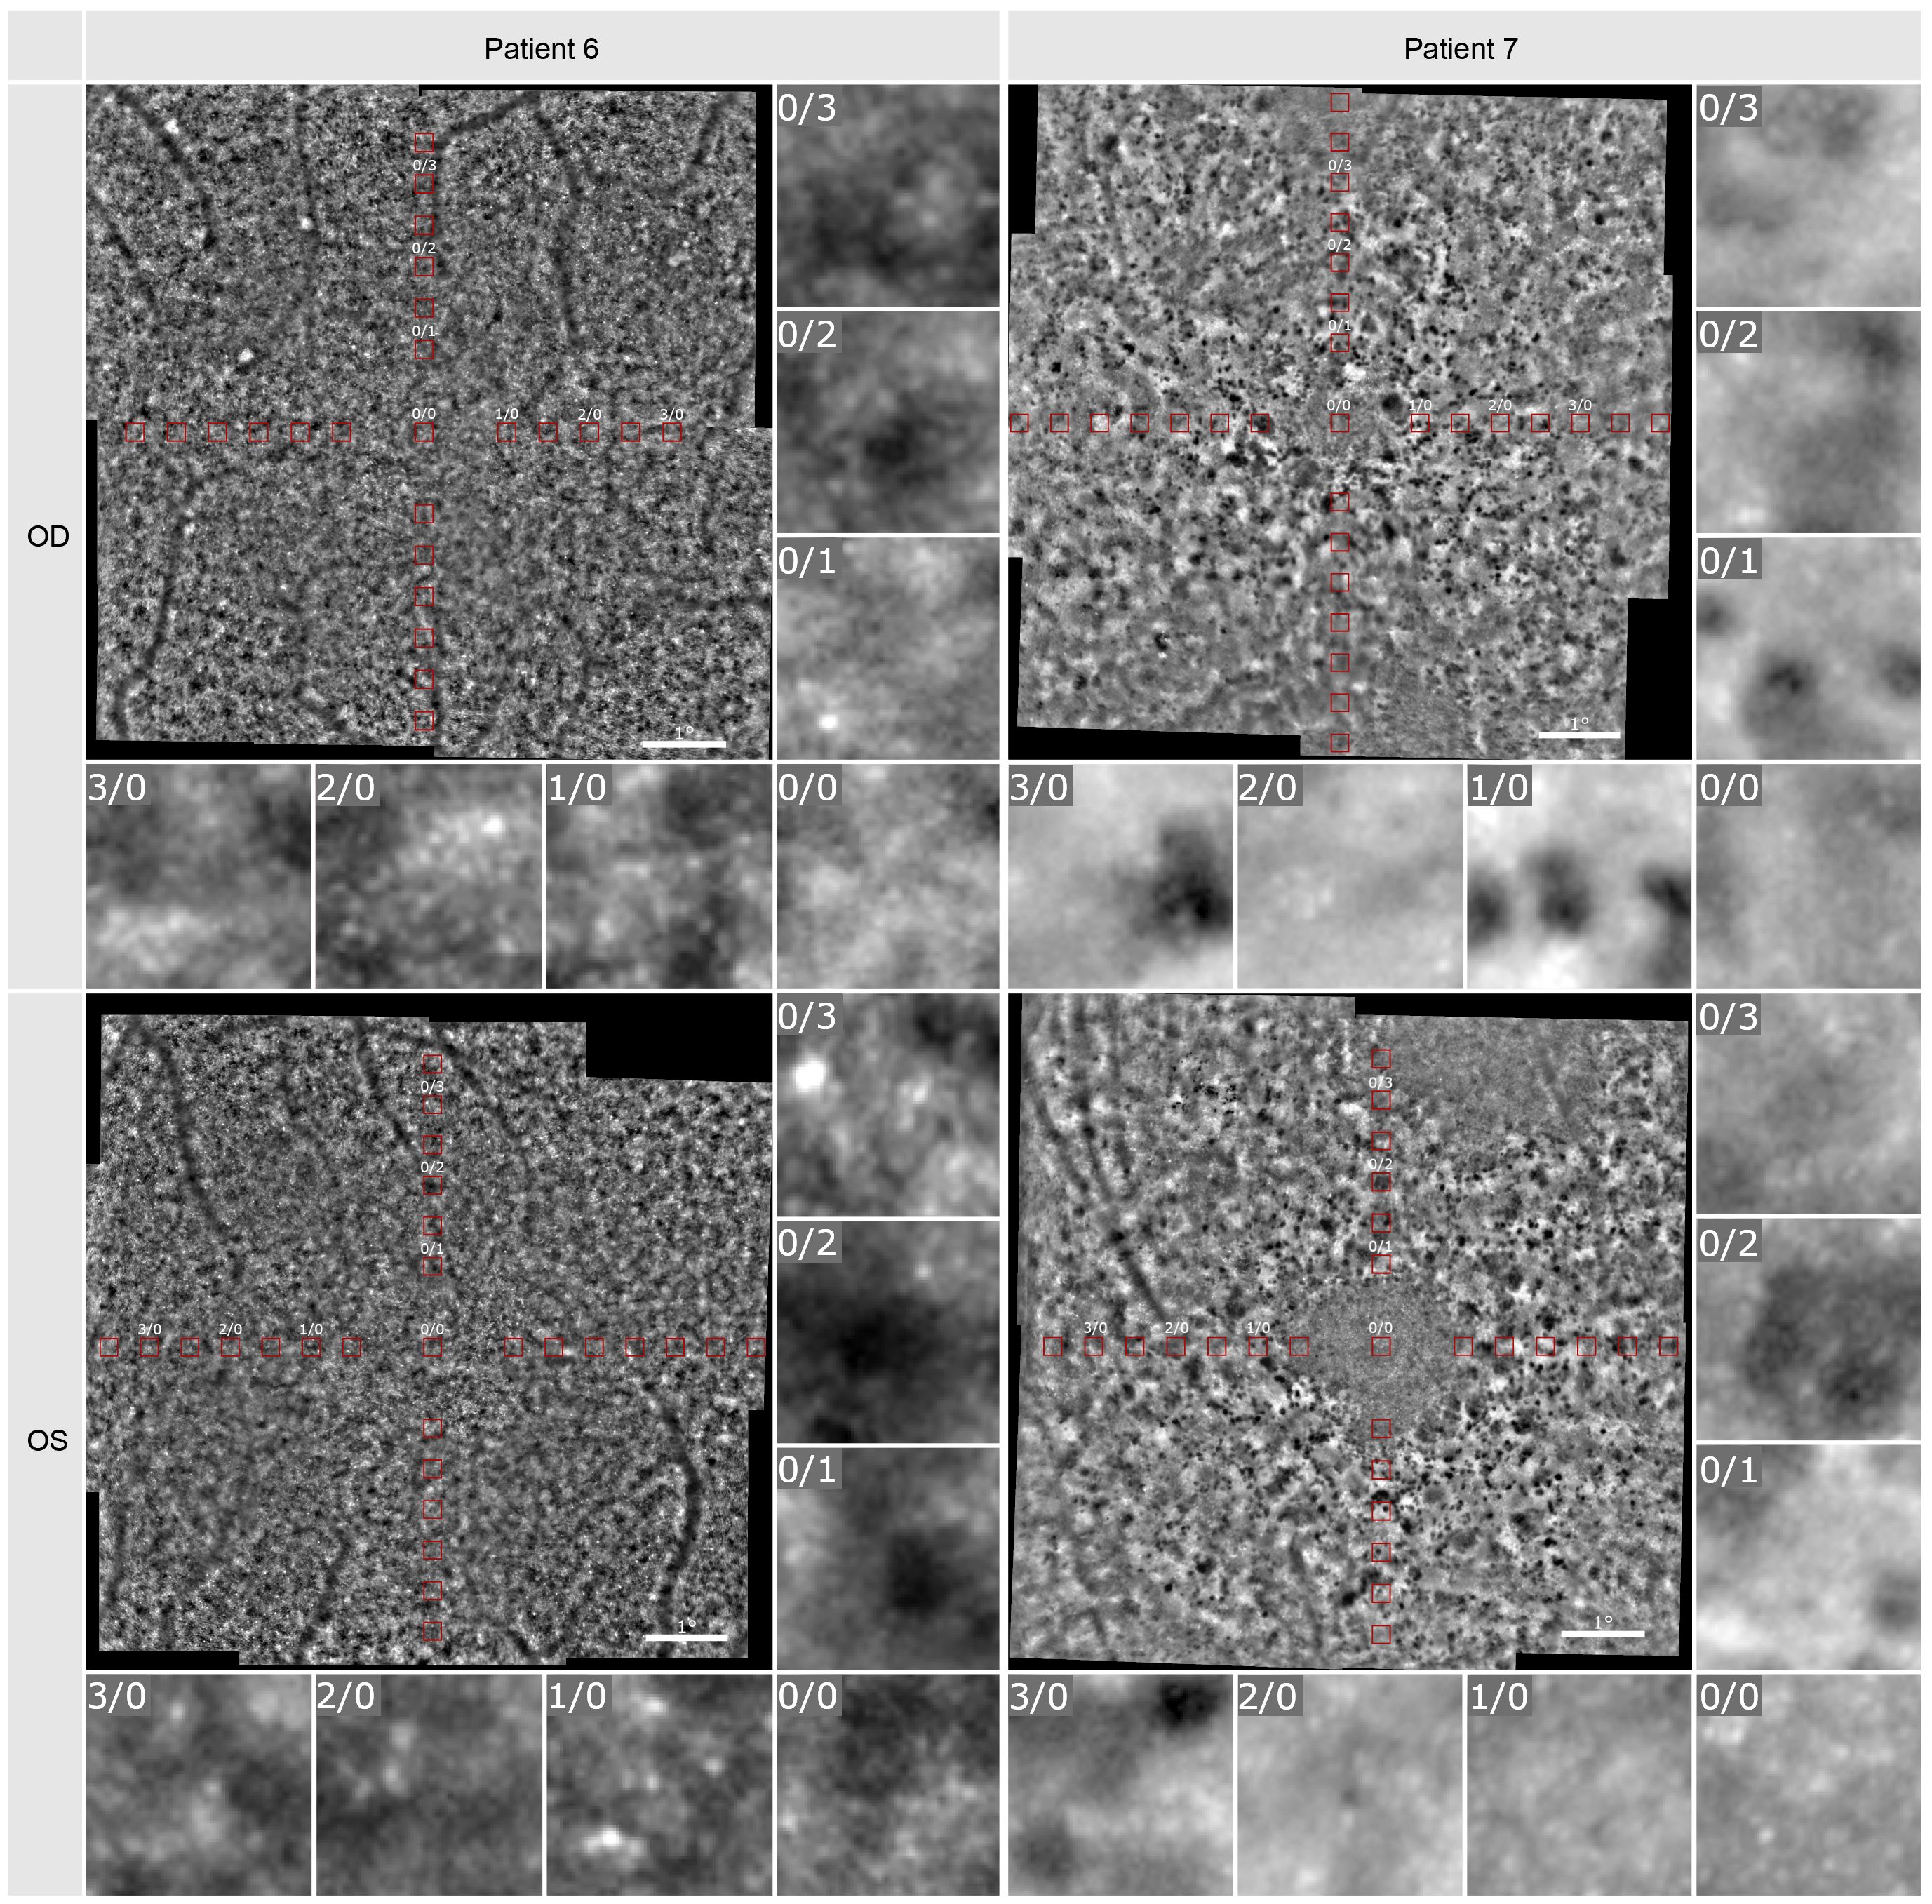
Figure 5 Adaptive optics imaging of patient 6 and 7. The red boxes visualize the positions at which cell density was measured. Seven regions of interest in 80x80 pixels (foveal [0/0] and 1-, 2-, 3-degree nasal and superior) are shown in a larger magnification.
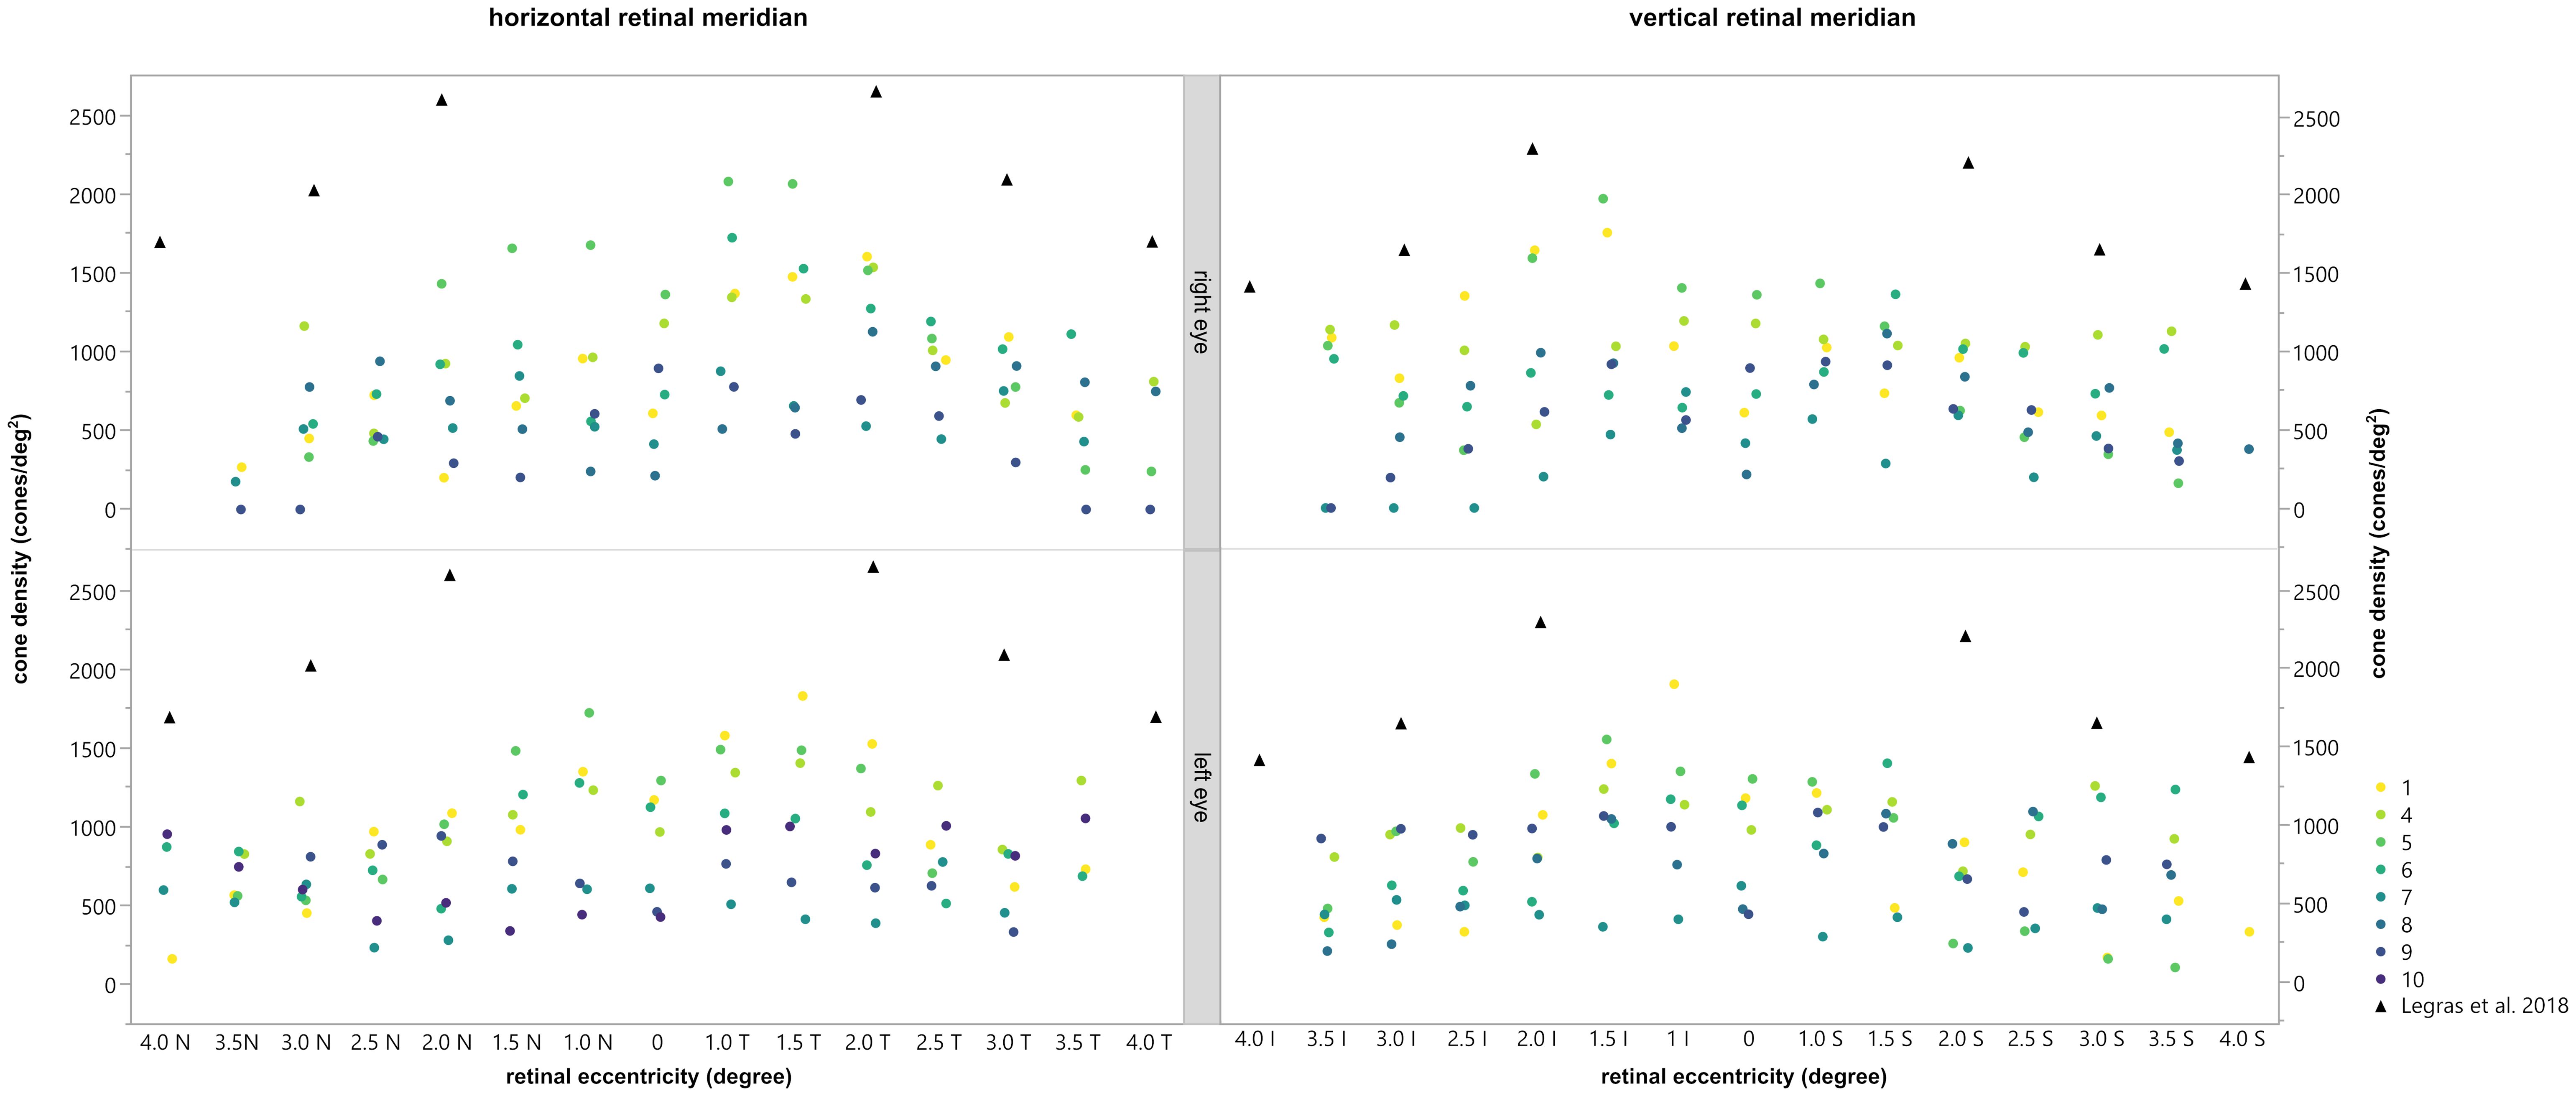
Figure 6 Comparison of the cone density with the normal values obtained by Legras et al., 2018 (27) (black triangles). The horizontal (left) and vertical (right) meridian of the right (top) and left (bottom) eye are shown for each subject, depicted by different colors. Permission of Legras et al. was officially obtained.
In general, the calculated cone density was highest for patients 1, 4, 5, and 6 and lowest for patients 7, 8, 9 and 10. In patient 2 and 3 no cone density could be determined due to lower image quality. As already shown and described patients 1, 4, 5, and 6 had reduced mfERGs whereas patients 3, 7, 8, 9 and 10 had no remaining responses. Thus, there appeared to be a correlation between the cone density and the magnitude of the mfERG amplitude.
To analyze this in more detail we compared the cone density within the central 3 degrees with the central 3 degrees (radius 1.5 degree) response of the multifocal ERG. For the mean cone density the central nine ROI’s inside the eccentricity of 1.5 degree were calculated and averaged. The comparison revealed a statistically significant difference between the mean cone density of eyes with a measurable mfERG response and eyes without a measurable mfERG response [T (11.628)=6.295,p<0.001 (tested by the Welch test; see Figure 7)]. Patients 2 and 3 were excluded from the analysis due to the poor image quality of the AO images, which prevented us from making a prediction about the cone density.
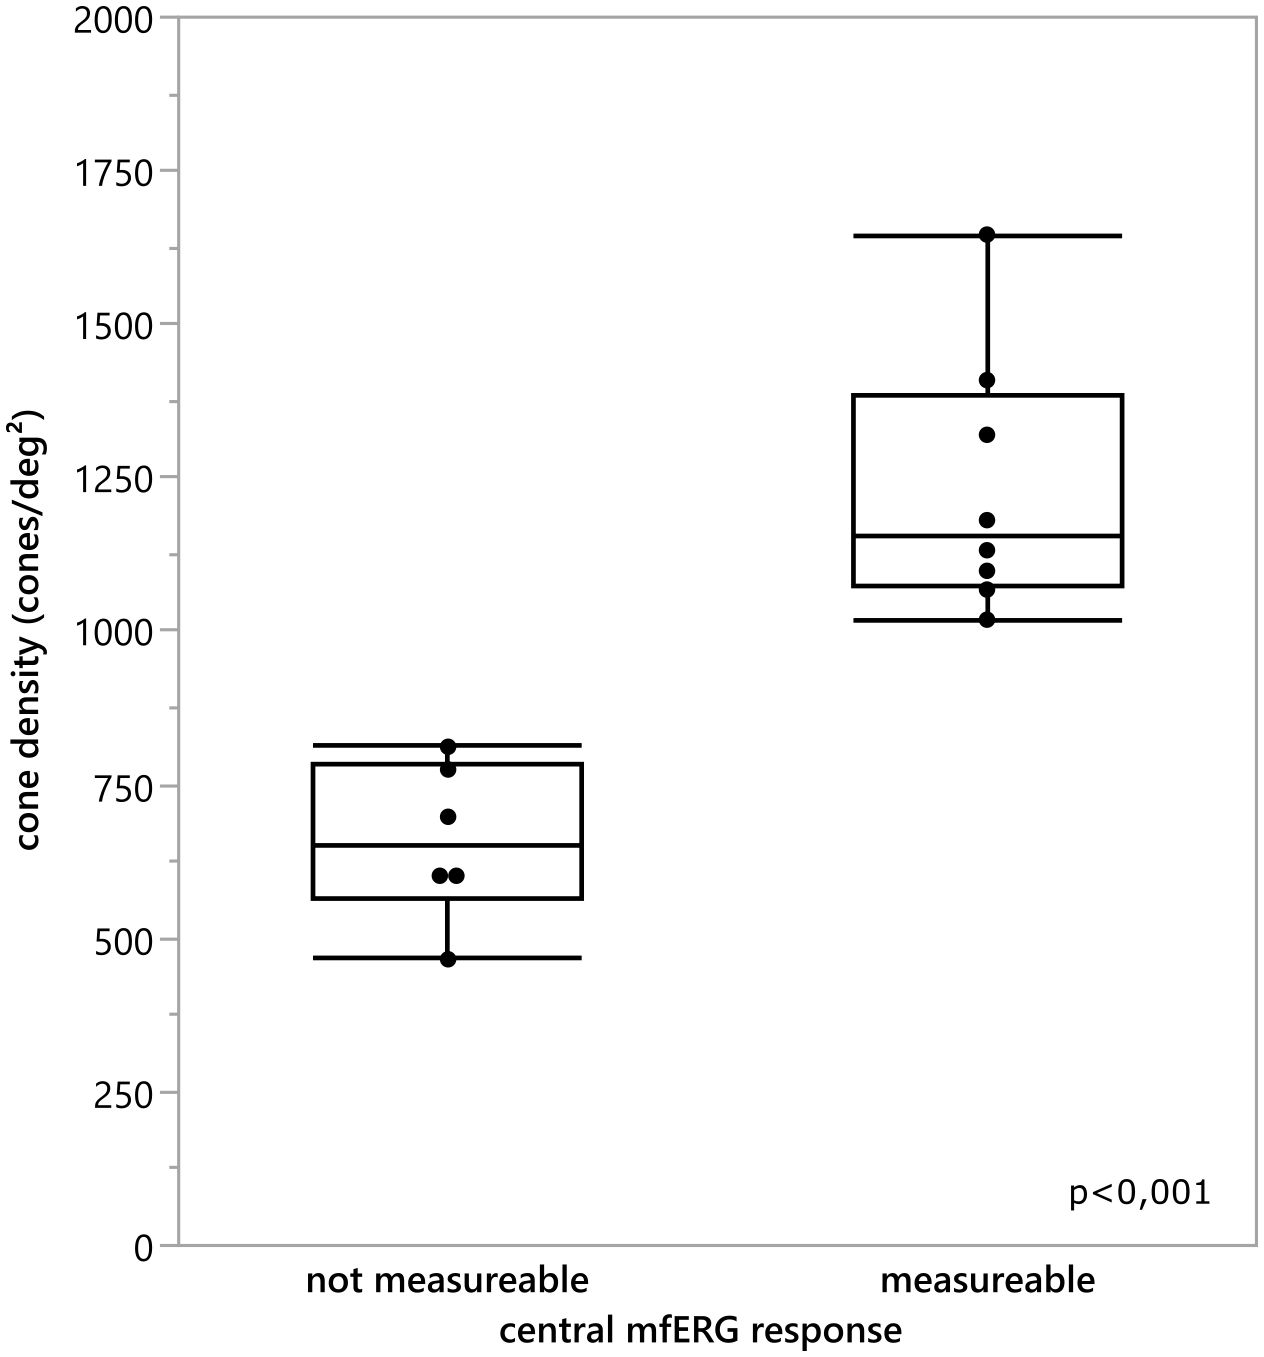
Figure 7 Comparison of the mean cone density inside the central 3°for every eye and the classification if the central 3 degree mfERG response was measurable. There was a statistically significant difference between the cone density of the eyes with an detectable mfERG response and the eyes without a measurable mfERG response t(11.628) = 6.295, p <0.001.
The visual field area was compared with the mean cone density using the Pearson (r) correlation, or Spearman correlation (ρ) when the data was non-normally distributed, tested by Shapiro Wilk test (p<0.05). For the mean cone density, the cone density of all measurable ROIs was averaged. The correlation between the cone density and the visual field size was not statically significant (compare scatter plot in Figure 8), neither for the visual field area tested by the III4e (ρOD=0.75, pOD=0.052; ρOD= 0.685, pOS=0.090) nor for the area tested by the I4e (ρOD=0.543, pOD=0.266; rOS=0.647, pOS=0.116).
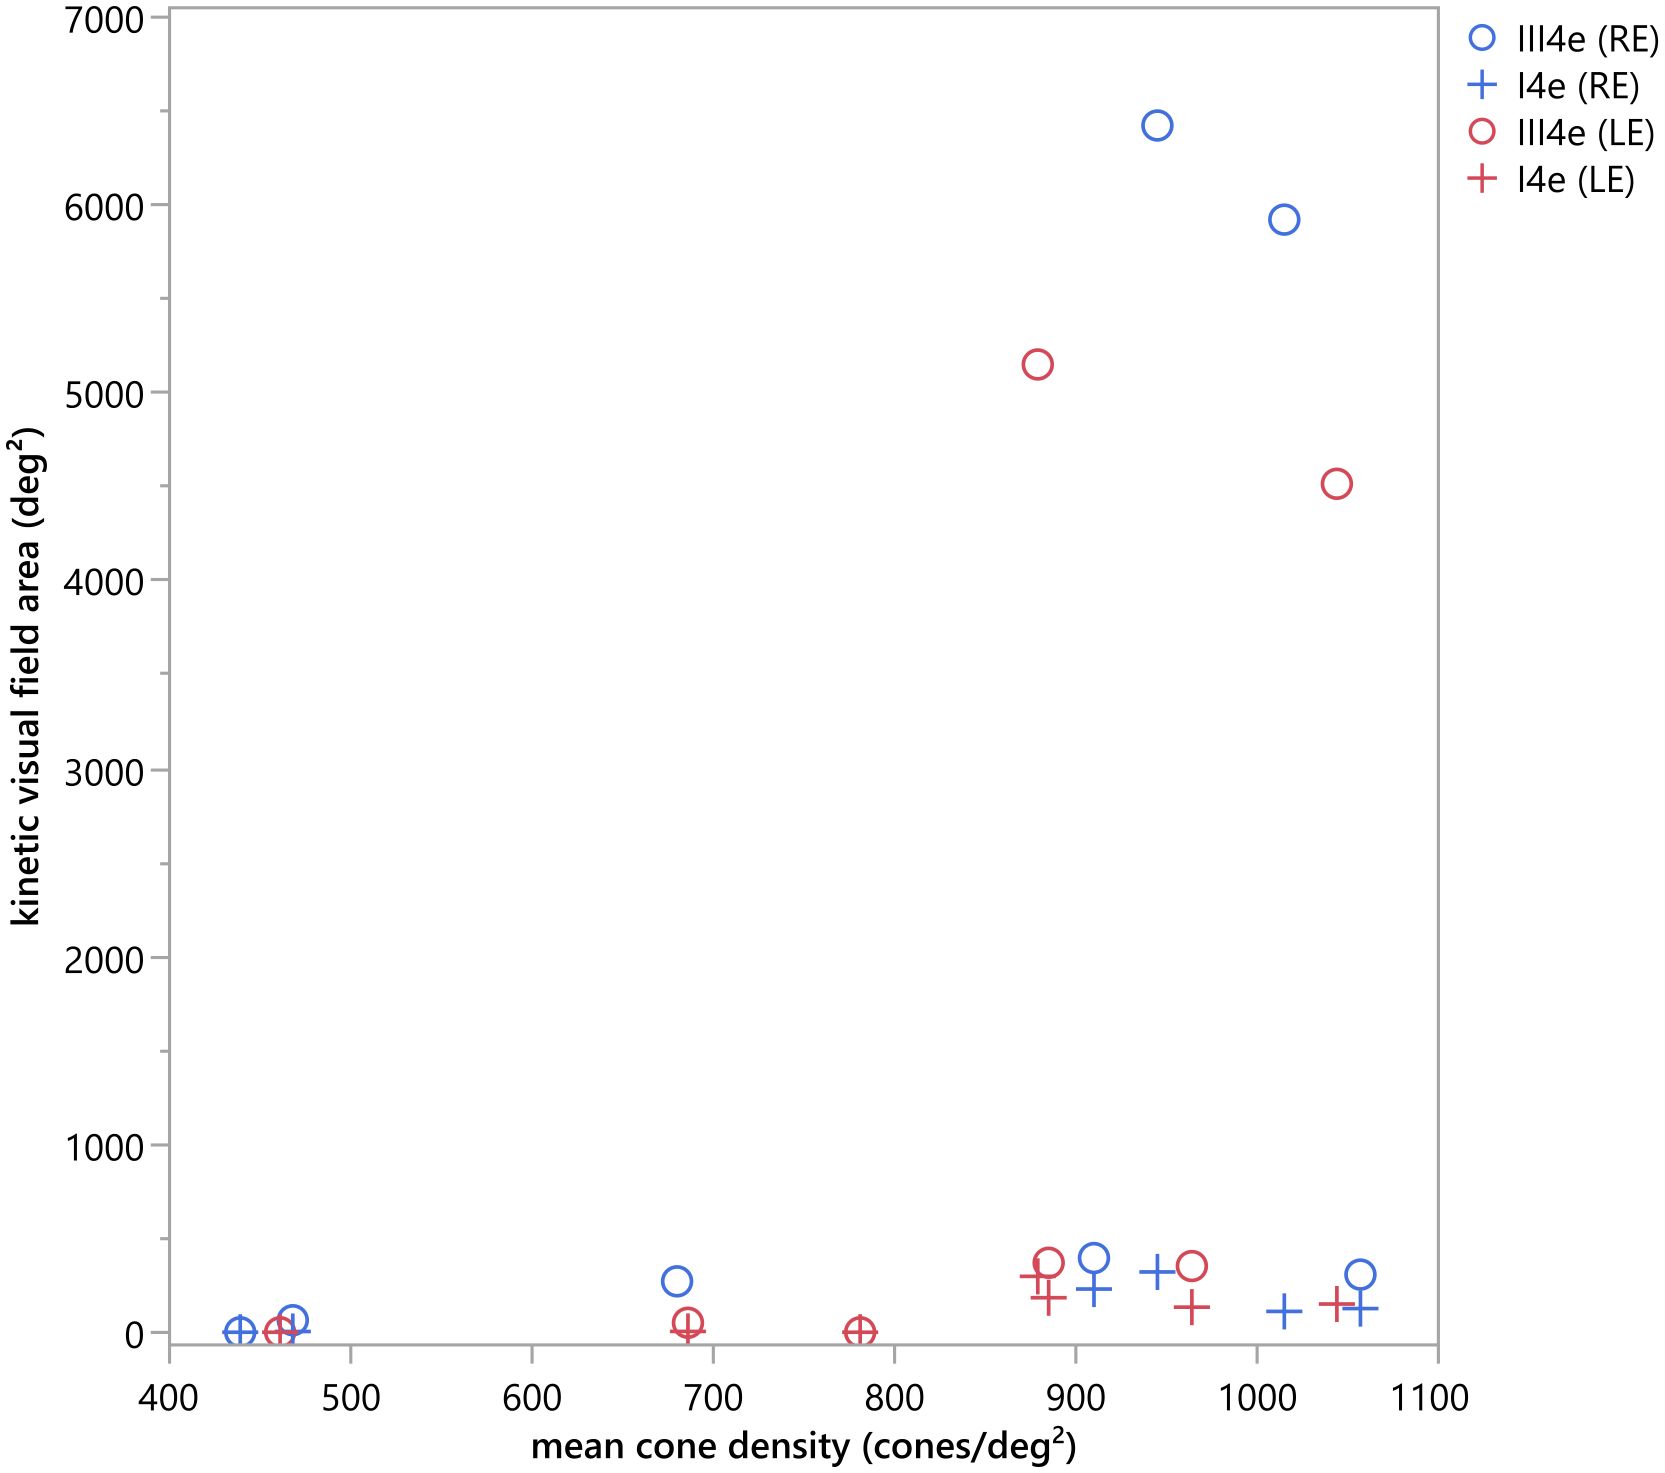
Figure 8 Scatter plot of the kinetic visual field area (deg2) measured with the III4e and I4e in comparison to the mean cone density (cones/deg2). No statistically significant correlation could be detected for the kinetic visual field area tested by the III4e (ρOD=0.75, pOD=0.052; ρOD= 0.685, pOS=0.090) and the I4e (ρOD=0.543, pOD=0.266; rOS=0.647, pOS=0.116).
Discussion
Our results show that the cone density in patients with RP related to Usher Syndrome using the adaptive optics flood illumination retina camera was decreased compared to previously published data on healthy eyes (27). Photoreceptor cell death was seen as a low cone density, along with disorder of the cone mosaic (Figures 4, 5). It is known that the cones within the central 2 degrees area cannot be resolved with AO due to the limit of resolution of the device. However, because a central loss of cones is expected in RP patients with Usher Syndrome, making the remaining cones detectable, the visualization and measurement of cell density could be established in the central fovea and at 1 degree. Therefore, we could observe visible cones in the fovea in the early stages of the disease, as well as a loss of cones outside the fovea, seen as blurry, dark patches. However, due to the anatomical distribution of the cones (28), we were expecting a much higher cone density in the central area, especially in the patients with a still good preserved visual acuity.
There are other reports that have examined the cone mosaic in RP using AO with similar patterns found as here (13, 29, 30). Gale et al. (29) categorized the changes in cone reflectivity into hypo-reflective blurred cone-like structures, higher frequency disorganized hyper-reflective spots and lower frequency hypo-reflective spots, which mirror progressive phases of cone degeneration observed using SD-OCT and FAF, as also shown by Tojo et al. (30) and Ueno et al. (31). This was also obvious in our study: The blurry patches and cone density matched the cone photoreceptor degeneration patterns shown by the SD-OCT and FAF imaging (Figures 2, 3). Gale et al. (32) have also shown that the repeatability of the results in RP patients is the same as that of control subjects.
High-resolution measurements of the cone mosaic performed with the confocal AOSLO (17, 33–36), which measures aberrations from the entire scanned area of the retina including the fovea, confirm these findings. Even if the outer retinal architecture in the SD-OCT is normal, the cone density has been shown to range from normal to severely reduced in RP patients (17, 19, 33, 34). A study investigating RP patients with Usher syndrome has further shown that the foveal cone density determined with an AO-SLO can be decreased before visible changes in the SD-OCT or a decline in visual function (36). This highlights the sensitivity of the high-resolution AO imaging and lends weight to studies demonstrating that visual acuity and sensitivity measurements are relatively poor markers for the severity of retinal degeneration compared to high resolution imaging of foveal cone mosaic (11).
Nevertheless, one of our limitations is that when using the rtx1 compared to an AOSLO, the cone density may be underestimated due to poor image quality or reflectivity of the cones. It is not possible to distinguish between not waveguiding cells and dark spots. Furthermore, due to the lack of information on patients’ eye length, the cell density could only be expressed using cones per degree2 (visual units).
Moreover, in this study, retinal areas within the hyperautofluorescence in FAF image indicated normal outer retinal structures, whereas the AO-FIO images displayed increased spacing in the cone mosaic, as previously found with, AO-SLO imaging (26) and in descriptive analysis (15).
The ERGs were extinguished in 7 patients and reduced in 3 patients confirming the report by Stingl et al. (37) that the ERG is abnormal in Usher patients. Our results revealed a correlation between the mfERG results and the other imaging techniques. The mfERG has been shown to reliably provide even small remaining responses in the macular region of RP patients (38–40) and was also reduced in all our Usher patients. This study could confirm that the cone density of the central retina was in most cases significantly correlated (Table 1) to the mfERG response in the central 3° of the retina. When the cone density measurements from AO retinal images were compared with the mfERG recordings from corresponding areas, the analysis indicated that there was a clear correlation between the strength of mfERG responses and the cone density measurements, i.e., lower amplitudes were associated with lower cone density measurements confirming the results of Choi et al. (13) using AO images. Granse et al. (38) have demonstrated that mfERG and multifocal visual evoked potentials may be more useful for examining remaining visual function in RP patients than visual field measurements. These findings are consistent with the unspecific remaining extent of the visual fields measured in this study.
It has been shown that when corrected for age, the preserved kinetic visual field is significantly larger in USH2 than in USH1 (37) and patients with USH1 have vastly reduced visual fields already at an early age. A direct comparison of these two cohorts of different sizes and different clinical phenotypes is a limitation of this analysis. However, the heterogeneity of the patients inside our cohorts was high. For example, the 60-year-old USH1 patient 2 still had a comparatively large visual field, preserved scotopic ERG and his retinal layering was more widely preserved than the one of patient 6 (USH2). Due to this heterogeneity, we believe that these ten patients could be compared within the context of their phenotypic expression.
In conclusion, we find that FI-AO combined with SD-OCT and FAF imaging are useful and sensitive clinical imaging methods for examining photoreceptor alterations due to RP, although there are clear limitations of AO techniques in the clinical routine. An accurate quantification of structural alterations in the retina is fundamental for monitoring the success of future therapeutical interventions (41).
Data availability statement
The raw data supporting the conclusions of this article will be made available by the authors, without undue reservation.
Ethics statement
The studies involving humans were approved by Ethics Committee of the University of Tuebingen. The studies were conducted in accordance with the local legislation and institutional requirements. The participants provided their written informed consent to participate in this study. Written informed consent was obtained from the individual(s) for the publication of any potentially identifiable images or data included in this article.
Author contributions
MK: Conceptualization, Formal analysis, Investigation, Methodology, Visualization, Writing – original draft, Writing – review & editing. SK: Writing – review & editing. KrS: Conceptualization, Formal analysis, Writing – review & editing. FN: Conceptualization, Investigation, Writing – review & editing. KaS: Funding acquisition, Writing – review & editing. FK: Formal analysis, Investigation, Writing – original draft.
Funding
The author(s) declare financial support was received for the research, authorship, and/or publication of this article. This work was supported by the German Research Council (DFG, grant number STI 727/1-1).
Acknowledgments
We like to express our gratitude for the permission of Professor Legras to include the data of the distribution and density of cones on healthy subjects in AO. We would like to thank Anne Kurtenbach for her critical reading of the manuscript. This work was supported by the German Research Council (DFG, grant number STI 727/1–1).
Conflict of interest
The authors declare that the research was conducted in the absence of any commercial or financial relationships that could be construed as a potential conflict of interest.
Publisher’s note
All claims expressed in this article are solely those of the authors and do not necessarily represent those of their affiliated organizations, or those of the publisher, the editors and the reviewers. Any product that may be evaluated in this article, or claim that may be made by its manufacturer, is not guaranteed or endorsed by the publisher.
References
1. Kimberling WJ, Moller C. Clinical and molecular genetics of Usher syndrome. J Am Acad Audiol. (1995) 6:63–72.
2. Rosenberg T, Haim M, Hauch AM, Parving A. The prevalence of Usher syndrome and other retinal dystrophy-hearing impairment associations. Clin Genet. (1997) 51:314–21. doi: 10.1111/j.1399-0004.1997.tb02480.x
3. Von Graefe A. Exceptionelles Verhalten des Gesichtsfeldes bei Pigmententartungen der Netzhaut. Von Graefe’s Arch Klin Exp Ophthalmol. (1858) 4:250–3.
4. Li X, Ma X, Tao Y. Clinical features of X linked juvenile retinoschisis in Chinese families associated with novel mutations in the RS1 gene. Mol Vis. (2007) 13:804–12.
5. Peter VG, Quinodoz M, Sadio S, Held S, Rodrigues M, Soares M, et al. New clinical and molecular evidence linking mutations in ARSG to Usher syndrome type IV. Hum Mutat. (2021) 42:261–71. doi: 10.1002/humu.24150
6. Castiglione A, Moller C. Usher syndrome. Audiol Res. (2022) 12:42–65. doi: 10.3390/audiolres12010005
7. French LS, Mellough CB, Chen FK, Carvalho LS. A review of gene, drug and cell-based therapies for usher syndrome. Front Cell Neurosci. (2020) 14:183. doi: 10.3389/fncel.2020.00183
8. Liang J, Williams DR, Miller DT. Supernormal vision and high-resolution retinal imaging through adaptive optics. J Opt Soc Am A Opt Image Sci Vis. (1997) 14:2884–92. doi: 10.1364/JOSAA.14.002884
9. Rossi EA, Chung M, Dubra A, Hunter JJ, Merigan WH, Williams DR. Imaging retinal mosaics in the living eye. Eye (Lond). (2011) 25:301–8. doi: 10.1038/eye.2010.221
10. Carroll J, Choi SS, Williams DR. In vivo imaging of the photoreceptor mosaic of a rod monochromat. Vision Res. (2008) 48:2564–8. doi: 10.1016/j.visres.2008.04.006
11. Carroll J, Kay DB, Scoles D, Dubra A, Lombardo M. Adaptive optics retinal imaging–clinical opportunities and challenges. Curr Eye Res. (2013) 38:709–21. doi: 10.3109/02713683.2013.784792
12. Carroll J, Neitz M, Hofer H, Neitz J, Williams DR. Functional photoreceptor loss revealed with adaptive optics: an alternate cause of color blindness. Proc Natl Acad Sci U S A. (2004) 101:8461–6. doi: 10.1073/pnas.0401440101
13. Choi SS, Doble N, Hardy JL, Jones SM, Keltner JL, Olivier SS, et al. In vivo imaging of the photoreceptor mosaic in retinal dystrophies and correlations with visual function. Invest Ophthalmol Vis Sci. (2006) 47:2080–92. doi: 10.1167/iovs.05-0997
14. Duncan JL, Zhang Y, Gandhi J, Nakanishi C, Othman M, Branham KE, et al. High-resolution imaging with adaptive optics in patients with inherited retinal degeneration. Invest Ophthalmol Vis Sci. (2007) 48:3283–91. doi: 10.1167/iovs.06-1422
15. Kortuem FC, Kempf M, Kuehlewein L, Nasser F, Kortuem C, Paques M, et al. Adaptive optics ophthalmoscopy in retinitis pigmentosa (RP): Typical patterns. Acta Ophthalmol. (2022) 100:e1539–e40. doi: 10.1111/aos.15183
16. Nabholz N, Lorenzini MC, Bocquet B, Lacroux A, Faugere V, Roux AF, et al. Clinical evaluation and cone alterations in choroideremia. Ophthalmology. (2016) 123:1830–2. doi: 10.1016/j.ophtha.2016.02.025
17. Ratnam K, Vastinsalo H, Roorda A, Sankila EM, Duncan JL. Cone structure in patients with usher syndrome type III and mutations in the Clarin 1 gene. JAMA Ophthalmol. (2013) 131:67–74. doi: 10.1001/2013.jamaophthalmol.2
18. Wolfing JI, Chung M, Carroll J, Roorda A, Williams DR. High-resolution retinal imaging of cone-rod dystrophy. Ophthalmology. (2006) 113:1019 e1. doi: 10.1016/j.ophtha.2006.01.056
19. Duncan JL, Ratnam K, Birch DG, Sundquist SM, Lucero AS, Zhang Y, et al. Abnormal cone structure in foveal schisis cavities in X-linked retinoschisis from mutations in exon 6 of the RS1 gene. Invest Ophthalmol Vis Sci. (2011) 52:9614–23. doi: 10.1167/iovs.11-8600
20. Genead MA, Fishman GA, Rha J, Dubis AM, Bonci DM, Dubra A, et al. Photoreceptor structure and function in patients with congenital achromatopsia. Invest Ophthalmol Vis Sci. (2011) 52:7298–308. doi: 10.1167/iovs.11-7762
21. Gill JS, Moosajee M, Dubis AM. Cellular imaging of inherited retinal diseases using adaptive optics. Eye (Lond). (2019) 33:1683–98. doi: 10.1038/s41433-019-0474-3
22. Gocho K, Kameya S, Akeo K, Kikuchi S, Usui A, Yamaki K, et al. High-resolution imaging of patients with bietti crystalline dystrophy with CYP4V2 mutation. J Ophthalmol. (2014) 2014:283603. doi: 10.1155/2014/283603
23. Langlo CS, Patterson EJ, Higgins BP, Summerfelt P, Razeen MM, Erker LR, et al. Residual foveal cone structure in CNGB3-associated achromatopsia. Invest Ophthalmol Vis Sci. (2016) 57:3984–95. doi: 10.1167/iovs.16-19313
24. Razeen MM, Cooper RF, Langlo CS, Goldberg MR, Wilk MA, Han DP, et al. Correlating photoreceptor mosaic structure to clinical findings in stargardt disease. Transl Vis Sci Technol. (2016) 5:6. doi: 10.1167/tvst.5.2.6
25. Hood DC, Bach M, Brigell M, Keating D, Kondo M, Lyons JS, et al. ISCEV standard for clinical multifocal electroretinography (mfERG) (2011 edition). Doc Ophthalmol. (2012) 124:1–13. doi: 10.1007/s10633-011-9296-8
26. McCulloch DL, Marmor MF, Brigell MG, Hamilton R, Holder GE, Tzekov R, et al. ISCEV Standard for full-field clinical electroretinography (2015 update). Doc Ophthalmol. (2015) 130:1–12. doi: 10.1007/s10633-014-9473-7
27. Legras R, Gaudric A, Woog K. Distribution of cone density, spacing and arrangement in adult healthy retinas with adaptive optics flood illumination. PloS One. (2018) 13:e0191141. doi: 10.1371/journal.pone.0191141
28. Purves D. Neuroscience. Sunderland (MA: Sinauer Associates (2001). Available at: https://www.ncbi.nlm.nih.gov/books/NBK10848/.
29. Gale MJ, Feng S, Titus HE, Smith TB, Pennesi ME. Interpretation of flood-illuminated adaptive optics images in subjects with retinitis pigmentosa. Adv Exp Med Biol. (2016) 854:291–7. doi: 10.1007/978-3-319-17121-0_39
30. Tojo N, Nakamura T, Fuchizawa C, Oiwake T, Hayashi A. Adaptive optics fundus images of cone photoreceptors in the macula of patients with retinitis pigmentosa. Clin Ophthalmol. (2013) 7:203–10. doi: 10.2147/OPTH
31. Ueno S, Koyanagi Y, Kominami T, Ito Y, Kawano K, Nishiguchi KM, et al. Clinical characteristics and high resolution retinal imaging of retinitis pigmentosa caused by RP1 gene variants. Jpn J Ophthalmol. (2020) 64:485–96. doi: 10.1007/s10384-020-00752-1
32. Gale MJ, Harman GA, Chen J, Pennesi ME. Repeatability of adaptive optics automated cone measurements in subjects with retinitis pigmentosa and novel metrics for assessment of image quality. Transl Vis Sci Technol. (2019) 8:17. doi: 10.1167/tvst.8.3.17
33. Makiyama Y, Ooto S, Hangai M, Takayama K, Uji A, Oishi A, et al. Macular cone abnormalities in retinitis pigmentosa with preserved central vision using adaptive optics scanning laser ophthalmoscopy. PloS One. (2013) 8:e79447. doi: 10.1371/journal.pone.0079447
34. Menghini M, Lujan BJ, Zayit-Soudry S, Syed R, Porco TC, Bayabo K, et al. Correlation of outer nuclear layer thickness with cone density values in patients with retinitis pigmentosa and healthy subjects. Invest Ophthalmol Vis Sci. (2014) 56:372–81. doi: 10.1167/iovs.14-15521
35. Park SP, Lee W, Bae EJ, Greenstein V, Sin BH, Chang S, et al. Early structural anomalies observed by high-resolution imaging in two related cases of autosomal-dominant retinitis pigmentosa. Ophthalmic Surg Lasers Imaging Retina. (2014) 45:469–73. doi: 10.3928/23258160-20140908-01
36. Sun LW, Johnson RD, Langlo CS, Cooper RF, Razeen MM, Russillo MC, et al. Assessing photoreceptor structure in retinitis pigmentosa and usher syndrome. Invest Ophthalmol Vis Sci. (2016) 57:2428–42. doi: 10.1167/iovs.15-18246
37. Stingl K, Kurtenbach A, Hahn G, Kernstock C, Hipp S, Zobor D, et al. Full-field electroretinography, visual acuity and visual fields in Usher syndrome: a multicentre European study. Doc Ophthalmol. (2019) 139:151–60. doi: 10.1007/s10633-019-09704-8
38. Granse L, Ponjavic V, Andreasson S. Full-field ERG, multifocal ERG and multifocal VEP in patients with retinitis pigmentosa and residual central visual fields. Acta Ophthalmol Scand. (2004) 82:701–6. doi: 10.1111/j.1600-0420.2004.00362.x
39. Holopigian K, Seiple W, Greenstein VC, Hood DC, Carr RE. Local cone and rod system function in patients with retinitis pigmentosa. Invest Ophthalmol Vis Sci. (2001) 42:779–88.
40. Vajaranant TS, Seiple W, Szlyk JP, Fishman GA. Detection using the multifocal electroretinogram of mosaic retinal dysfunction in carriers of X-linked retinitis pigmentosa. Ophthalmology. (2002) 109:560–8. doi: 10.1016/S0161-6420(01)00984-8
Keywords: adaptive optics imaging, usher syndrome, degenerative retinal disease, multimodal degenerative retinal disease, multimodal imaging, cone mosaic, electroretinogram
Citation: Kempf M, Kohl S, Stingl K, Nasser F, Stingl K and Kortuem FC (2024) Adaptive optics retinal imaging in patients with usher syndrome. Front. Ophthalmol. 4:1349234. doi: 10.3389/fopht.2024.1349234
Received: 04 December 2023; Accepted: 01 May 2024;
Published: 28 May 2024.
Edited by:
Laura Young, Newcastle University, United KingdomReviewed by:
Angelos Kalitzeos, University College London, United KingdomKiyoko Gocho, Institut National de la Santé et de la Recherche Médicale (INSERM), France
Copyright © 2024 Kempf, Kohl, Stingl, Nasser, Stingl and Kortuem. This is an open-access article distributed under the terms of the Creative Commons Attribution License (CC BY). The use, distribution or reproduction in other forums is permitted, provided the original author(s) and the copyright owner(s) are credited and that the original publication in this journal is cited, in accordance with accepted academic practice. No use, distribution or reproduction is permitted which does not comply with these terms.
*Correspondence: Melanie Kempf, melanie.kempf@med.uni-tuebingen.de