 InChan Hwang1
 Hari Trivedi2
 Beatrice Brown-Mulry1
 Linglin Zhang1
 Vineela Nalla3
 Aimilia Gastounioti4
 Judy Gichoya2Laleh Seyyed-Kalantari5Imon Banerjee6
 MinJae Woo1*
- 1School of Data Science and Analytics, Kennesaw State University, Kennesaw, GA, United States
- 2Department of Radiology, Emory University, Atlanta, GA, United States
- 3Department of Information Technology, Kennesaw State University, Kennesaw, GA, United States
- 4Mallinckrodt Institute of Radiology, Washington University in St. Louis, St. Louis, MO, United States
- 5Department of Electrical Engineering and Computer Science, York University, Toronto, ON, Canada
- 6Department of Radiology, Mayo Clinic Arizona, Phoenix, AZ, United States
Introduction: To date, most mammography-related AI models have been trained using either film or digital mammogram datasets with little overlap. We investigated whether or not combining film and digital mammography during training will help or hinder modern models designed for use on digital mammograms.
Methods: To this end, a total of six binary classifiers were trained for comparison. The first three classifiers were trained using images only from Emory Breast Imaging Dataset (EMBED) using ResNet50, ResNet101, and ResNet152 architectures. The next three classifiers were trained using images from EMBED, Curated Breast Imaging Subset of Digital Database for Screening Mammography (CBIS-DDSM), and Digital Database for Screening Mammography (DDSM) datasets. All six models were tested only on digital mammograms from EMBED.
Results: The results showed that performance degradation to the customized ResNet models was statistically significant overall when EMBED dataset was augmented with CBIS-DDSM/DDSM. While the performance degradation was observed in all racial subgroups, some races are subject to more severe performance drop as compared to other races.
Discussion: The degradation may potentially be due to ( 1) a mismatch in features between film-based and digital mammograms ( 2) a mismatch in pathologic and radiological information. In conclusion, use of both film and digital mammography during training may hinder modern models designed for breast cancer screening. Caution is required when combining film-based and digital mammograms or when utilizing pathologic and radiological information simultaneously.
1. Introduction
Breast cancer is the most common cancer in women, with 1/8 of women developing breast cancer over their lifespans (1, 2). Screening mammography is a cost-effective and non-invasive method of breast cancer detection. Population-wide mammography screening allows for earlier detection and increased patients’ survival rates (3, 4). However, the workload of the radiologist is high, and the performance of screening mammography is dependent upon the experience of the reader and is prone to high false positives and false negatives (5–7). Because of this, artificial intelligence (AI) models have been developed for breast cancer detection over the past several years with the goal of improving breast cancer screening performance (8–11).
To facilitate model development, many publicly available datasets have been created and released annotated breast cancer images. Digital Database for Screening Mammography (DDSM) is one of the earliest datasets used in computer-aided medical diagnosis systems (CADx) in the 1990s (12). The Curated Breast Imaging Subset of Digital Database for Screening Mammography (CBIS-DDSM) is an enhanced version of DDSM in which lesion specific segmentations were added, and images were converted to more modern formats. CBIS-DDSM has been extensively used to develop numerous AI-powered breast cancer segmentation and classification models (13–18). However, CBIS-DDSM and DDSM contain film-scanned mammography images from the late 1990s, whereas modern mammography is digital. This distinction is important, as digital mammograms have been shown to be superior to film mammograms, offering numerous advantages (19, 20). Recently, more digital mammography datasets have been made publicly available, including the Emory Breast Imaging Dataset (EMBED)—a digital breast mammography dataset with 3.4M mammogram images (21).
To date, most mammography-related AI models have been trained using either film or digital mammogram datasets with little overlap. While many AI models require massive amounts of data before they begin to perform reasonably, there are only a few datasets publicly available—most of them contain film-based images. This has left a gap in knowledge as to the effect of combining these two data types for training, namely whether or not combining film and digital mammography during training will help or hinder modern models designed for use on digital mammograms.
In this paper, we explore the performance of a binary abnormality classification model for screening digital mammograms when trained solely on digital mammograms (EMBED) vs. combined digital and film mammograms (EMBED + DDSM/CBIS-DDSM). To this end, we implemented state-of-the-art binary abnormality classification models trained on different compositions of datasets using full-view screening mammograms. We emphasized the experiment’s reproducibility by providing easy-to-access and annotated source code encompassing the full workflow from research.
2. Materials and methods
2.1. Dataset descriptions
In this study, three publicly available datasets—CBIS-DDSM, DDSM “Normal” labelled images and EMBED—were utilized for model training and validation with EMBED dataset for solely testing. CBIS-DDSM contains 3103 full mammogram images with lesions annotated as benign or malignant. Normal labelled DDSM mammograms provide 2,778 film mammography images. The publicly released version of EMBED contains 676,008 2D and Digital Breast Tomosynthesis (DBT) screening and diagnostic mammograms for 23,264 patients with a racially balanced data composition. It also contains lesion level imaging descriptors, pathologic outcomes, regions of interest, and patient demographic information. Information for all three datasets is summarized in Table 1.
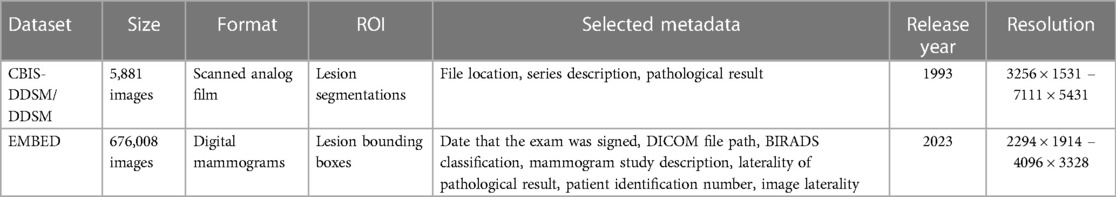
Table 1. Mammogram dataset information.
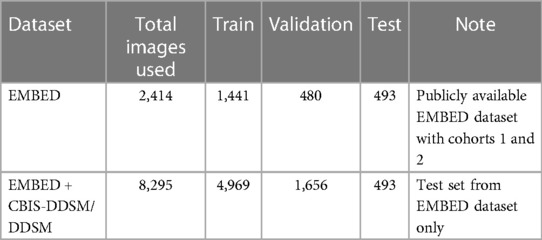
Table 2. Train, validation, and test dataset configuration.
2.1.1. CBIS-DDSM and DDSM
The DDSM dataset contains mammogram examinations on 2,620 patients collected from multiple imaging sites—Massachusetts General Hospital, Wake Forest University School of Medicine, Sacred Heart Hospital, and School of Medicine at Washington University in St. Louis. Images were provided in Lossless Joint Photographic Experts Group image (LJPEG) format with inclusion of both craniocaudal (CC) and mediolateral oblique (MLO) views. However, the LJPEG format has since been deprecated and become difficult for researchers to use (13). CBIS-DDSM was created in 2017 as an augmentation subset of DDSM with images converted to the Digital Imaging and Communications in Medicine (DICOM) format. In addition, specific lesions were segmented and provided in separate files as a mask along with malignant and benign labels. Additional metadata include patient age, tissue density, scanner used to digitize, image resolution, abnormality type (mass or calcification), and performance assessment metrics of CADx methods for mass and classifications. For our study, we obtained negative mammograms from DDSM and abnormal mammographs from CBIS-DDSM. Figure 1 depicts a sample mammogram from the CBIS-DDSM dataset.
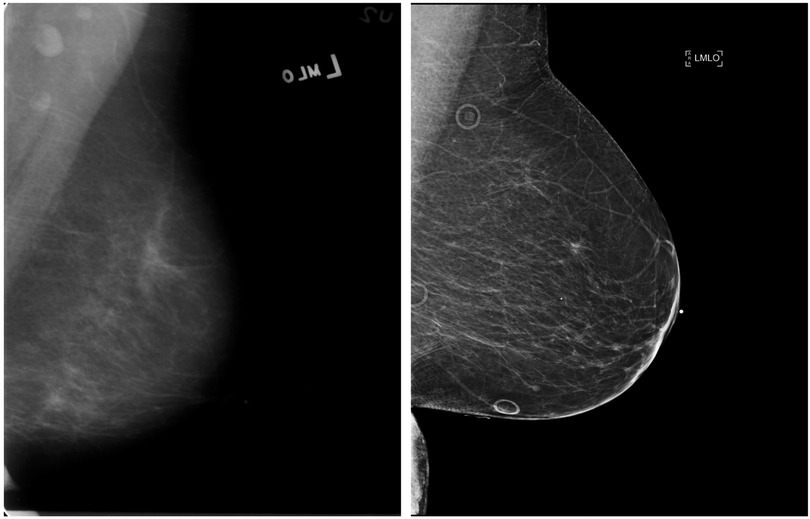
Figure 1. Example of the mediolateral oblique (MLO) view mammograms from the DDSM (left) and EMBED (right) datasets.

Figure 2. EMBED dataset preparation workflow. Image metadata was joined with image findings to exploit clinical information for each mammogram.
2.1.2. EMBED
The publicly released subset of EMBED contains digital mammograms for 23,264 patients who underwent mammography at Emory University between 2013 and 2020 and includes 364,791 full-field digital mammography (FFDM) images. Whereas other datasets contain patients mostly from a single race, EMBED contains approximately equal numbers of Black (42%) and White (39%) patients. EMBED also contains lesion level bounding boxes for ROIs labeled with imaging descriptors, Breast Imaging-Reporting and Data System (BIRADS) scores, and pathologic outcomes. Figure 1 depicts a sample mammogram from the EMBED dataset.
2.2. Data preprocessing and methods
Since the DDSM mammograms are in LJPEG formats, the Stanford PVRG JPEG codec v1.1 was employed to read DDSM images and convert them into 16-bit grayscale PNG images (13). CBIS-DDSM and EMBED images are in DICOM format and were converted into 16-bit grayscale PNG files (22–25). All images were rescaled to 800 × 600 with bicubic interpolation and anti-aliasing to make them fit into 8 GB memory Graphic Processing Units (GPUs) for improved reproducibility. Pixel values were normalized with 16-bit grayscale (26). Images from EMBED were divided into a 60:20:20 ratio for training, validation, and test sets while ensuring that there was no patient leakage between the sets, Table 2 (27–29).
In CBIS-DDSM, ROIs for 3,565 lesions were identified with labels according to their pathology outcomes—benign or malignant. Because all these images contained an abnormality, they were labeled as abnormal (positive class). CBIS-DDSM is a subset of DDSM excluding normal mammograms. Normal mammograms as well as those classified as benign without biopsy (benign-without-callback) were acquired from DDSM and labeled as negatives. From EMBED, screening exams with an original Breast Imaging—Reporting and Data System (BIRADS) score of 0 (i.e., additional evaluation required) were relabeled with the subsequent diagnostic exam BIRADS score. For example, if a patient received a BIRADS 0 on screening mammography followed by a diagnostic exam with BIRADS 4, the final score for the screening study would be BIRADS 4. Conversely, if a patient received a BIRADS 0 on screening mammography followed by a diagnostic mammogram with BIRADS 2, their final score would be BIRADS 2. In this manner, all screening studies with initial or final BIRADS scores of 1 or 2 were labeled as negative, and those with final BIRADS scores of 4, 5, and 6 were labeled as positive. This effectively classified ‘false positive’ BIRADS 0 screening studies without any subsequent abnormality detected in the negative class. BIRADS 3 screening studies were not included in this evaluation as they represent a rare case that is followed more often is subject to a radiologist and institution specific variability. Figure 2 provides an overview of the data preparation procedures employed for the EMBED dataset.
2.3. Experimental design and mammogram classifier architecture
Residual Neural Network (ResNet) architectures were chosen for this task as they contain skip connections in convolution layers which minimize residuals between layers, thereby reducing loss rates for classification and allowing the model to learn features at various scale (30–32). It is well documented that ResNet-based models have demonstrated the state-of-the-art performances in breast cancer classification and other cancer classification models (27, 28, 33, 34).
Three pretrained ResNet variants—ResNet50, ResNet101, and ResNet152 were selected as feature extractors by freezing some of the weights of the model as semi-trainable layers. The additional six fully connected layers of 2048, 1024, 512, 128, 32, and 1 were added as fully trainable layers followed by the pretrained convolution backbone, Figure 3.
• Input Layer: The input layer has three channels of 800 × 600 pixels to examine signal strengths of cancer. ResNet models take regular three channel RGB colors as inputs. All three channel values in image data are identical because mammogram images consist of grayscale images.
• Activation Function: Rectified Linear Function (ReLu) was selected by the knowledge of previous works and placed in hidden layers. The selected activation function is commonly used in medical image classification tasks as well as general image recognition (35–39).
• Network Configuration: ImageNet pretrained ResNet variations are utilized as semi-trainable base models followed by the additional six fully connected layers, consisting of 2048, 1024, 512, 128, 32, and 1 neuron as a fully trainable layer.
• Avg-Pooling: Average pooling reduces feature map sizes built from convolution layers by dropping the number of parameters and reduces computation overhead (40–42).
• Output Layer: A sigmoid function was selected for the binary classification purpose in the endpoint layer. This function is commonly used in general binary classification and medical image analysis (43–45).
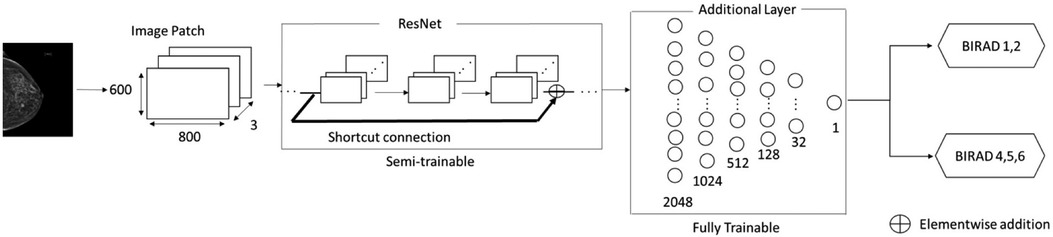
Figure 3. Overview of ResNet-based architecture for abnormality classification. A shortcut connection is shown above as an arrow, Reading input values before layers. Element wise- addition was to minimize residuals produced from each layer to the output values.
In total, six binary classifiers were trained for comparison. The first three classifiers were trained using images only from EMBED using ResNet50, ResNet101, and ResNet152 architectures. The next three classifiers were trained using images from EMBED, CBIS-DDSM, and DDSM datasets. All six models were tested only on mammograms from EMBED.
In each experiment, the best model was selected based on performance during 50 epochs of training. The selected gradient descent process was the first-order gradient-based optimization of stochastic objective functions (ADAM), guided by previous relevant work in deep learning-powered medical image classifications (46–48). Binary crossentropy was employed for the loss function which has frequently been utilized in medical image analysis (48–50). A range of learning rates was explored with the Bayesian optimization scheme to find the optimal hyperparameters (51–55). All codes used in the experiment are available at https://github.com/minjaewoo/EMBED_Screening_Model.
3. Results
The best performing model for EMBED dataset was the customized ResNet50 model, which was trained, validated, and tested using digital mammograms only. The customized ResNet50 model achieved an Area-Under-Curve (AUC) [95% confidence interval] of 0.918 [0.915–0.921], accuracy of 0.918 [0.915–0.921], the precision of 0.907 [0.903–0.911], and recall of 0.929 [0.925–0.933], as summarized in Table 3. To ensure the model performance consistency, bootstrapping over the entire 2,414 images from EMBED was performed by randomly sampling 200 images at a time for 200 times in the testing phase.

Table 3. Performance comparisons on different ResNet models before and after multi-source data augmentation.
The best performing model for EMBED mixed with CBIS-DDSM/DDSM was the customized ResNet152 which was trained and validated with EMBED and CBIS-DDSM/DDSM datasets. This customized ResNet152 model attained an Area-Under-Curve (AUC) [95% confidence interval] of 0.873 [0.870–0.876], the accuracy of 0.874 [0.871–0.877], the precision of 0.899 [0.895–0.903], and recall of 0.841 [0.836–0.845] as depicted in Table 3. Bootstrapping over all 2,414 images from EMEBD was performed by randomly sampling 200 images at a time for 200 times in the testing stage.
The customized ResNet101 did not achieve noteworthy performance in both EMBED and EMBED mixed with CBIS-DDSM/DDSM. In all experiments, performance degradation to the customized ResNet models was statistically significant overall when EMBED dataset was augmented with CBIS-DDSM/DDSM, Table 3. McNemar’s test was deployed for calculating the corresponding statistical significance.
The classification performance was further investigated by stratifying the results by racial subgroups, Figure 4. The performance degradation with EMBED dataset augmented with CBIS-DDSM/DDSM was observed in all settings regardless of the racial subgroup. However, it is noteworthy that some races are subject to more severe performance drops as compared to other races. For example, the performance drop presented in AUC ranged from 0.06 to 0.11 in Asian subgroup while the same metric ranged from 0.02 to 0.08 in the White subgroup. Regardless of the degradation effect, the model tended to perform the best in White subgroup. While the ResNet101 did not achieve noteworthy performance throughout the study, it presented the most consistent performance minimally affected by different racial subgroups with the AUC gap smaller than 0.05.
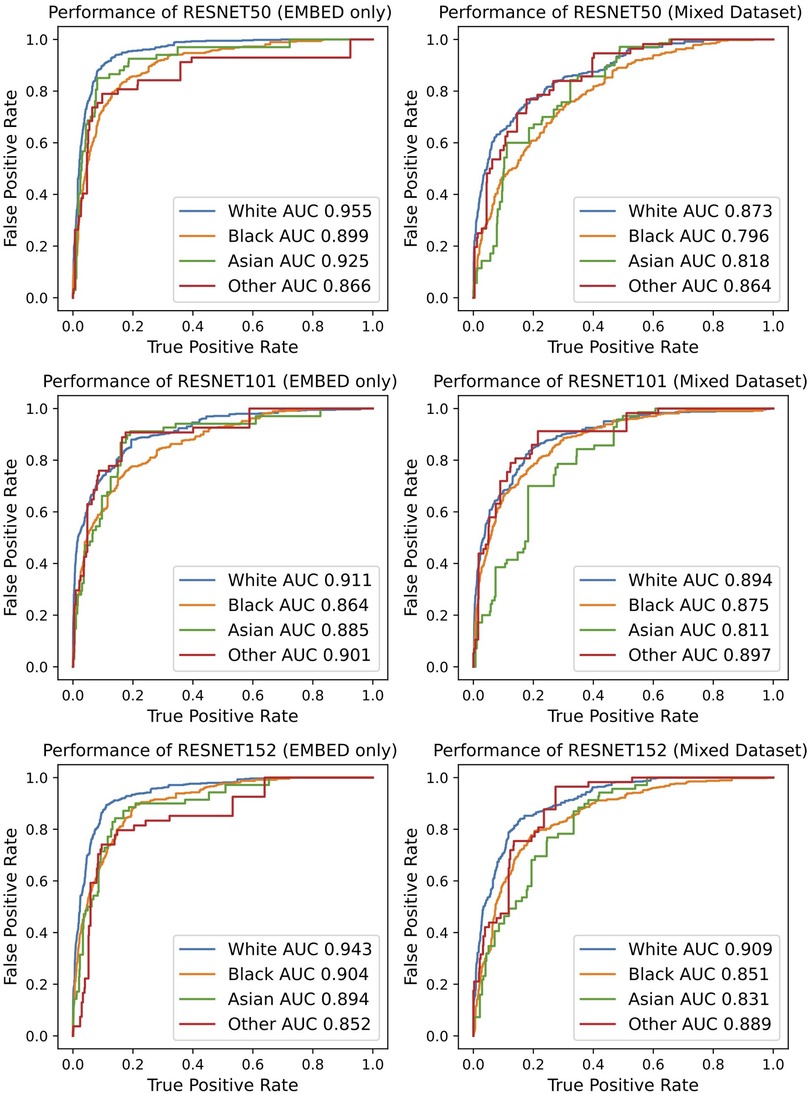
Figure 4. Overview of classification performance stratified by racial subgroups.
4. Discussion
This is the first study, to our knowledge, to evaluate the effect combined film and digital mammography datasets for the development of models to perform abnormality classification in screening mammography. The results indicate that the use of heterogeneous datasets may aggravate the classification performance despite the increase in the size of the training dataset, as compared to the classification model built solely on homogenous datasets.
Specifically, the classification models trained on the heterogeneous dataset with 4,895 film-based and digital mammography images achieved performances ranging from 85% to 87% AUC depending on the choice of the pre-trained weights and structures. Classification models trained on a homogenous dataset with 2,414 digital mammography images achieved performance ranging from 85% to 90% AUC depending on the choice of the pre-trained weights and structures. The degradation of performance was statistically significant when assessed by a non-parametric test for paired nominal data. Furthermore, it was observed that some racial subgroups are subject to more severe performance degradation as compared to other racial subgroups.
Performance degradation when including film-based mammograms can be explained by two factors. First, film-based mammography images may contain different imaging features than digital mammography that, while easily interpretable by a human, appear different from computer vision models. Second, combining mammograms from two datasets can lead to inconsistent labeling which deteriorates the performance of learning algorithms. The commonly used labels for the DDSM are normal, benign, and malignant classes verified by the corresponding pathological information (12, 13). In this study, all biopsied lesions were classified as abnormal regardless of pathology outcome, whereas negative cases were defined as negative screening studies. There was no mechanism in CBIS-DDSM or DDSM to identify cases classified as BIRADS 0 on screening that were subsequently classified as negative. Conversely, the labels for the EMBED were based on radiological information in BIRADS categories; the negatives were defined as BIRADS 1 and 2 on screening or subsequent diagnostic exam, and positives were defined as BIRADS 4, 5, and 6 on the subsequent diagnostic exam within 180 days. It is well documented that there can be a discrepancy between pathologic and radiological findings (56–58). Given that a great number of screening models have been developed using film-based mammograms with pathologic information, our finding poses a serious question on whether those screening models can adequately be adopted in contemporary clinical settings.
The results of this study should be interpreted in consideration of its limitations. First, the composition of the datasets used throughout the study was balanced with respect to the numbers of positive and negative cases. In real-world clinical settings, the number of negative cases far outweighs the number of positive cases in breast cancer screening. The study was designed with an emphasis on its internal validity highlighting the cause-and-effect relationship between multi-source data augmentation and performance degradation. In return, its generalizability to the real-world setting with class imbalanced datasets may be limited. Secondly, the study does not account for the primary source of performance degradation during the multi-source augmentation process. Future studies are warranted to investigate the respective impact of multi-source image features and multi-source label discrepancy on performance degradation. Lastly, some limitations may arise from the specific multi-institutional setting in this study, which involved a film-based mammogram dataset from a single institution and a digital mammogram dataset from a different single institution.
In conclusion, use of both film and digital mammography during training may hinder modern models designed for breast cancer screening. Caution is required when combining film-based and digital mammograms or when utilizing pathologic and radiological information simultaneously.
Data availability statement
Publicly available datasets were analyzed in this study. This data can be found here: https://registry.opendata.aws/emory-breast-imaging-dataset-embed/.
Author contributions
Guarantors of the integrity of the entire study, IH, MW, and HT; study concepts/study design or data acquisition or data analysis/interpretation, all authors; manuscript drafting or manuscript revision for important intellectual content, all authors; approval of the final version of the submitted manuscript, all authors; agrees to ensure any questions related to the work are appropriately resolved, all authors; literature research, IH, and MW; statistical analysis, IH, MW, and HT; and manuscript editing, IH, MW, JG, LS-K, IB, and HT. All authors contributed to the article and approved the submitted version.
Conflict of interest
The authors declare that the research was conducted in the absence of any commercial or financial relationships that could be construed as a potential conflict of interest.
The authors AG declared that they were an editorial board member of Frontiers, at the time of submission. This had no impact on the peer review process and the final decision.
Publisher's note
All claims expressed in this article are solely those of the authors and do not necessarily represent those of their affiliated organizations, or those of the publisher, the editors and the reviewers. Any product that may be evaluated in this article, or claim that may be made by its manufacturer, is not guaranteed or endorsed by the publisher.
References
1. Society AC. Breast cancer facts & figures 2019–2020. CA Cancer J Clin. (2019) 69:1–44. doi: 10.3322/caac.21590
2. Siegel RL, Miller KD, Fuchs HE, Jemal A. Cancer statistics, 2022. CA Cancer J Clin. (2022) 72:7–33. doi: 10.3322/caac.21708
3. Ginsburg O, Yip CH, Brooks A, Cabanes A, Caleffi M, Dunstan Yataco JA, et al. Breast cancer early detection: a phased approach to implementation. Cancer. (2020) 126:2379–93. doi: 10.1002/cncr.32887
4. Moore SG, Shenoy PJ, Fanucchi L, Tumeh JW, Flowers CR. Cost-effectiveness of MRI compared to mammography for breast cancer screening in a high risk population. BMC Health Serv Res. (2009) 9:1–8. doi: 10.1186/1472-6963-9-9
5. Spayne MC, Gard CC, Skelly J, Miglioretti DL, Vacek PM, Geller BM. Reproducibility of BI-RADS breast density measures among community radiologists: a prospective cohort study. Breast J. (2012) 18:326–33. doi: 10.1111/j.1524-4741.2012.01250.x
6. Sprague BL, Conant EF, Onega T, Garcia MP, Beaber EF, Herschorn SD, et al. Variation in mammographic breast density assessments among radiologists in clinical practice: a multicenter observational study. Ann Intern Med. (2016) 165:457–64. doi: 10.7326/M15-2934
7. Kerlikowske K, Grady D, Barclay J, Ernster V, Frankel SD, Ominsky SH, et al. Variability and accuracy in mammographic interpretation using the American college of radiology breast imaging reporting and data system. J Natl Cancer Inst. (1998) 90:1801–9. doi: 10.1093/jnci/90.23.1801
8. Lehman CD, Yala A, Schuster T, Dontchos B, Bahl M, Swanson K, et al. Mammographic breast density assessment using deep learning: clinical implementation. Radiology. (2019) 290:52–8. doi: 10.1148/radiol.2018180694
9. Mohamed AA, Berg WA, Peng H, Luo Y, Jankowitz RC, Wu S. A deep learning method for classifying mammographic breast density categories. Med Phys. (2018) 45:314–21. doi: 10.1002/mp.12683
10. Lee J, Nishikawa RM. Automated mammographic breast density estimation using a fully convolutional network. Med Phys. (2018) 45:1178–90. doi: 10.1002/mp.12763
11. Ciritsis A, Rossi C, Vittoria De Martini I, Eberhard M, Marcon M, Becker AS, et al. Determination of mammographic breast density using a deep convolutional neural network. Br J Radiol. (2019) 92:20180691. doi: 10.1259/bjr.20180691
12. Heath M, Bowyer K, Kopans D, Kegelmeyer P, Moore R, Chang K, et al. Current status of the digital database for screening mammography. Digital Mammography: Nijmegen. (1998 ) 1998:457–60. doi: 10.1007/978-94-011-5318-8_75
13. Lee RS, Gimenez F, Hoogi A, Miyake KK, Gorovoy M, Rubin DL. A curated mammography data set for use in computer-aided detection and diagnosis research. Sci Data. (2017) 4:1–9. doi: 10.1038/sdata.2017.177
14. Shen L, Margolies LR, Rothstein JH, Fluder E, McBride R, Sieh W. Deep learning to improve breast cancer detection on screening mammography. Sci Rep. (2019) 9:1–12. doi: 10.1038/s41598-018-37186-2
15. Salama WM, Aly MH. Deep learning in mammography images segmentation and classification: automated CNN approach. Alexandria Eng J. (2021) 60:4701–9. doi: 10.1016/j.aej.2021.03.048
16. Ragab DA, Sharkas M, Marshall S, Ren J. Breast cancer detection using deep convolutional neural networks and support vector machines. PeerJ. (2019) 7:e6201. doi: 10.7717/peerj.6201
17. Ahmed L, Iqbal MM, Aldabbas H, Khalid S, Saleem Y, Saeed S. Images data practices for semantic segmentation of breast cancer using deep neural network. J Ambient Intell Humaniz Comput. (2020) 11:1–17. doi: 10.1007/s12652-020-01680-1
18. Zahoor S, Shoaib U, Lali IU. Breast cancer mammograms classification using deep neural network and entropy-controlled whale optimization algorithm. Diagnostics. (2022) 12:557. doi: 10.3390/diagnostics12020557
19. Bluekens AM, Holland R, Karssemeijer N, Broeders MJ, den Heeten GJ. Comparison of digital screening mammography and screen-film mammography in the early detection of clinically relevant cancers: a multicenter study. Radiology. (2012) 265:707–14. doi: 10.1148/radiol.12111461
20. Pisano ED, Hendrick RE, Yaffe MJ, Baum JK, Acharyya S, Cormack JB, et al. Diagnostic accuracy of digital versus film mammography: exploratory analysis of selected population subgroups in DMIST. Radiology. (2008) 246:376. doi: 10.1148/radiol.2461070200
21. Jeong JJ, Vey BL, Bhimireddy A, Kim T, Santos T, Correa R, et al. The EMory BrEast imaging dataset (EMBED): a racially diverse, granular dataset of 3.4 million screening and diagnostic mammographic images. Radiology: Artificial Intelligence. (2023) 5:e220047. doi: 10.1148/ryai.220047
22. Kitamura G, Deible C. Retraining an open-source pneumothorax detecting machine learning algorithm for improved performance to medical images. Clin Imaging. (2020) 61:15–9. doi: 10.1016/j.clinimag.2020.01.008
23. Cvija T, Severinski K. Multiple medical images extraction from DICOM and conversion to JPG using python. Ri-STEM-2021. ( 2021):33.
24. Ye EZ, Ye EH, Bouthillier M, Ye RZ: Deepimagetranslator V2: analysis of multimodal medical images using semantic segmentation maps generated through deep learning. bioRxiv 2021:2021.2010. (2012).464160.
25. Medeghri H, Sabeur SA. Anatomic compartments extraction from diffusion medical images using factorial analysis and K-means clustering methods: a combined analysis tool. Multimed Tools Appl. (2021) 80:23949–62. doi: 10.1007/s11042-021-10846-8
26. Gao S, Gruev V. Bilinear and bicubic interpolation methods for division of focal plane polarimeters. Opt Express. (2011) 19:26161–73. doi: 10.1364/OE.19.026161
27. Ayana G, Park J, Jeong J-W, Choe S-W. A novel multistage transfer learning for ultrasound breast cancer image classification. Diagnostics. (2022) 12:135. doi: 10.3390/diagnostics12010135
28. Lotter W, Diab AR, Haslam B, Kim JG, Grisot G, Wu E, et al. Robust breast cancer detection in mammography and digital breast tomosynthesis using an annotation-efficient deep learning approach. Nat Med. (2021) 27:244–9. doi: 10.1038/s41591-020-01174-9
29. Krittanawong C, Johnson KW, Rosenson RS, Wang Z, Aydar M, Baber U, et al. Deep learning for cardiovascular medicine: a practical primer. Eur Heart J. (2019) 40:2058–73. doi: 10.1093/eurheartj/ehz056
30. He K, Zhang X, Ren S, Sun J. Proceedings of the IEEE conference on computer vision and pattern recognition. In: Agapito L, Berg T, Kosecka J, Zelnik-Manor L (Eds.). Deep residual learning for image recognition. Las Vegas, NV, USA: IEEE (2016). p. 770–8
31. Yu F, Wang D, Shelhamer E, Darrell T. Proceedings of the IEEE conference on computer vision and pattern recognition. In: Forsyth D, Laptev I, Oliva A, Ramanan D (Eds.). Deep layer aggregation (2018). Salt Lake City, UT, USA: IEEE. p. 2403–12
32. Rawat W, Wang Z. Deep convolutional neural networks for image classification: a comprehensive review. Neural Comput. (2017) 29:2352–449. doi: 10.1162/neco_a_00990
33. Reddy ASB, Juliet DS. In 2019 International conference on communication and signal processing (ICCSP). In: Jayashree R, Raja J, Thirumaraiselvan P, Malathi M (Eds.). Transfer learning with ResNet-50 for malaria cell-image classification. Chennai, India: IEEE (2019). p. 0945–9
34. Loey M, Manogaran G, Taha MHN, Khalifa NEM. Fighting against COVID-19: a novel deep learning model based on YOLO-v2 with ResNet-50 for medical face mask detection. Sustain Cities Soc. (2021) 65:102600. doi: 10.1016/j.scs.2020.102600
35. Zhang Y-D, Pan C, Chen X, Wang F. Abnormal breast identification by nine-layer convolutional neural network with parametric rectified linear unit and rank-based stochastic pooling. J Comput Sci. (2018) 27:57–68. doi: 10.1016/j.jocs.2018.05.005
36. Jiang X, Zhang Y-D. Chinese Sign language fingerspelling via six-layer convolutional neural network with leaky rectified linear units for therapy and rehabilitation. J Med Imaging Health Inform. (2019) 9:2031–90. doi: 10.1166/jmihi.2019.2804
37. Nayak DR, Das D, Dash R, Majhi S, Majhi B. Deep extreme learning machine with leaky rectified linear unit for multiclass classification of pathological brain images. Multimed Tools Appl. (2020) 79:15381–96. doi: 10.1007/s11042-019-7233-0
38. Mekha P, Teeyasuksaet N. 2019 Joint international conference on digital arts, Media and technology with ECTI northern section conference on electrical, electronics, computer and telecommunications engineering (ECTI DAMT-NCON). In: Karnjanapiboon C, Kaewbanjong K, Srimaharaj W (Eds.). Deep learning algorithms for predicting breast cancer based on tumor cells. Nan, Thailand: IEEE (2019). p. 343–6
39. Trivizakis E, Manikis GC, Nikiforaki K, Drevelegas K, Constantinides M, Drevelegas A, et al. Extending 2-D convolutional neural networks to 3-D for advancing deep learning cancer classification with application to MRI liver tumor differentiation. IEEE J Biomed Health Inform. (2018) 23:923–30. doi: 10.1109/JBHI.2018.2886276
40. Li Q, Cai W, Wang X, Zhou Y, Feng DD, Chen M. In 2014 13th international conference on control automation robotics & vision (ICARCV). In: Chua CS, Wang J (Eds.). Medical image classification with convolutional neural network. Singapore: IEEE (2014). p. 844–8
41. Yadav SS, Jadhav SM. Deep convolutional neural network based medical image classification for disease diagnosis. J Big Data. (2019) 6:1–18. doi: 10.1186/s40537-018-0162-3
42. Khan S, Islam N, Jan Z, Din IU, Rodrigues JJC. A novel deep learning based framework for the detection and classification of breast cancer using transfer learning. Pattern Recognit Lett. (2019) 125:1–6. doi: 10.1016/j.patrec.2019.03.022
43. Mohammadi R, Shokatian I, Salehi M, Arabi H, Shiri I, Zaidi H. Deep learning-based auto-segmentation of organs at risk in high-dose rate brachytherapy of cervical cancer. Radiother Oncol. (2021) 159:231–40. doi: 10.1016/j.radonc.2021.03.030
44. Arya N, Saha S. Multi-modal advanced deep learning architectures for breast cancer survival prediction. Knowl Based Syst. (2021) 221:106965. doi: 10.1016/j.knosys.2021.106965
45. Tiwari M, Bharuka R, Shah P, Lokare R. Breast cancer prediction using deep learning and machine learning techniques. Available at SSRN 3558786. (2020)).
46. Gupta P, Garg S. Breast cancer prediction using varying parameters of machine learning models. Procedia Comput Sci. (2020) 171:593–601. doi: 10.1016/j.procs.2020.04.064
47. Abdar M, Samami M, Mahmoodabad SD, Doan T, Mazoure B, Hashemifesharaki R, et al. Uncertainty quantification in skin cancer classification using three-way decision-based Bayesian deep learning. Comput Biol Med. (2021) 135:104418. doi: 10.1016/j.compbiomed.2021.104418
48. Basavegowda HS, Dagnew G. Deep learning approach for microarray cancer data classification. CAAI Transactions on Intelligence Technology. (2020) 5:22–33. doi: 10.1049/trit.2019.0028
49. Hameed Z, Zahia S, Garcia-Zapirain B, Javier Aguirre J, Maria Vanegas A. Breast cancer histopathology image classification using an ensemble of deep learning models. Sensors. (2020) 20:4373. doi: 10.3390/s20164373
50. Agarap AFM. In Proceedings of the 2nd international conference on machine learning and soft computing. In: Bae D-H, Le-Tien T, Paolo (Eds.). On breast cancer detection: an application of machine learning algorithms on the Wisconsin diagnostic dataset. Phu Quoc Island, Viet Nam: ACM (2018). p. 5–9
51. Nour M, Cömert Z, Polat K. A novel medical diagnosis model for COVID-19 infection detection based on deep features and Bayesian optimization. Appl Soft Comput. (2020) 97:106580. doi: 10.1016/j.asoc.2020.106580
52. Douglas Z, Wang H. In 2022 IEEE 10th international conference on healthcare informatics (ICHI). In: Liu H, Iyer RK (Eds.). Bayesian optimization-derived batch size and learning rate scheduling in deep neural network training for head and neck tumor segmentation. Rochester, MN, USA: IEEE (2022). p. 48–54
53. Nishio M, Nishizawa M, Sugiyama O, Kojima R, Yakami M, Kuroda T, et al. Computer-aided diagnosis of lung nodule using gradient tree boosting and Bayesian optimization. PloS one. (2018) 13:e0195875. doi: 10.1371/journal.pone.0195875
54. Yousefi S, Amrollahi F, Amgad M, Dong C, Lewis JE, Song C, et al. Predicting clinical outcomes from large scale cancer genomic profiles with deep survival models. Sci Rep. (2017) 7:11707. doi: 10.1038/s41598-017-11817-6
55. Babu T, Singh T, Gupta D, Hameed S. Colon cancer prediction on histological images using deep learning features and Bayesian optimized SVM. J Intell Fuzzy Syst. (2021) 41:5275–86. doi: 10.3233/JIFS-189850
56. Stein MA, Karlan MS. Calcifications in breast biopsy specimens: discrepancies in radiologic-pathologic identification. Radiology. (1991) 179:111–4. doi: 10.1148/radiology.179.1.2006260
57. Cornford E, Evans A, James J, Burrell H, Pinder S, Wilson A. The pathological and radiological features of screen-detected breast cancers diagnosed following arbitration of discordant double reading opinions. Clin Radiol. (2005) 60:1182–7. doi: 10.1016/j.crad.2005.06.003
Keywords: mammography, CBIS-DDSM, EMBED, breast cancer, FFDM—full field digital mammography, cancer screening (MeSH), deep learning—artificial intelligence
Citation: Hwang I, Trivedi H, Brown-Mulry B, Zhang L, Nalla V, Gastounioti A, Gichoya J, Seyyed-Kalantari L, Banerjee I and Woo M (2023) Impact of multi-source data augmentation on performance of convolutional neural networks for abnormality classification in mammography. Front. Radiol. 3:1181190. doi: 10.3389/fradi.2023.1181190
Received: 7 March 2023; Accepted: 30 May 2023;
Published: 16 June 2023.
Edited by:
Ian Pan, Harvard Medical School, United States© 2023 Hwang, Trivedi, Brown-Mulry, Zhang, Nalla, Gastounioti, Gichoya, Seyyed-Kalantari, Banerjee and Woo. This is an open-access article distributed under the terms of the Creative Commons Attribution License (CC BY). The use, distribution or reproduction in other forums is permitted, provided the original author(s) and the copyright owner(s) are credited and that the original publication in this journal is cited, in accordance with accepted academic practice. No use, distribution or reproduction is permitted which does not comply with these terms.
*Correspondence: MinJae Woo bXdvbzFAa2VubmVzYXcuZWR1