 Heidelore Fiedler
 Abeer Baabish
 Mohammad Sadia
- School of Science and Technology, MTM Research Centre, Örebro University, Örebro, Sweden
Perfluoroalkane substances (PFAS) comprise a large family of chemicals of environmental concern and are subject to chemical analyses, international regulation, and risk assessments. Environmental samples including air, water, sediment, and soil as abiotic matrices, food samples comprising fish, meat (beef, sheep, chicken), egg, butter, and milk as well as human milk samples were assessed using uni- and multivariate methods. Participating countries were asked to provide baseline samples and not target potential hotspots. Chemometric analysis was possible for only three of the 15 PFAS monitored, namely perfluorooctane sulfonic acid (PFOS), perfluorooctanoic acid (PFOA), and perfluorohexane sulfonic acid (PFHxS). The assessments showed that PFAS contamination in developing countries and in all matrices considered was almost equally attributed to PFOS and PFOA; PFHxS did not play a role. Subsequently, across all samples, PFOS and PFOA were strongly negatively correlated (spearman correlation coefficient r = −0.94). The measured values showed moderate positive correlation between PFOS and PFOA (r = 0.76) indicating common sources or environmental behavior. No clear pattern could be observed for geographic locations nor for transfers between matrices. Whereas the abiotic samples—soil, sediment, air—gave a very heterogenous picture (very small p-values) and had wide ranges and outliers, the measured values of the biota samples were not significantly different between matrices.
1 Introduction
Persistent organic pollutants (POPs) are globally addressed by the Stockholm Convention on Persistent Organic Pollutants (UNEP, 2001), which triggered many activities at global and national levels with respect to regulations but also research. The World Health Organization (WHO) defines “persistent organic pollutants” as “chemicals of global concern due to their potential for long-range transport, persistence in the environment, ability to bio-magnify, and bio-accumulate in ecosystems, as well as their significant negative effects on human health and the environment” (https://www.who.int/news-room/questions-and-answers/item/food-safety-persistent-organic-pollutants-(pops)update-November-2020). Similar definitions are available from the United Nations Environment Programme (UNEP) and the Stockholm Convention (www.pops.int), the US Environmental Protection Agency (https://www.epa.gov/international-cooperation/persistent-organic-pollutants-global-issue-global-response#pops) and others.
Humans are exposed to POPs mainly through the food we eat but also through the air we breathe, the water we drink, dust we inhale, and surfaces and commodities we touch. As a result, POPs once manufactured or formed unintentionally, and released from its source can be found virtually everywhere. Analytical chemists attempt to determine measurable concentrations of POPs in these matrices.
Perfluoroalkane substances (PFAS) area group of relatively new POPs: containing fluorine and with the strong C-F bound in the molecule, they exhibit non-reactivity towards hydrolysis or photolytic degradation. As halogenated compounds, due to their stability and lipophilicity, POPs undergo long range transport, which allows them to travel far from their source, and exhibit bioaccumulation, which reconcentrates these chemical compounds to potentially dangerous levels (Wania and Mackay, 1996). Perfluorinated substances were not among the originally listed POPs (Fiedler et al., 2019) but have been added later into the annexes of the Stockholm Convention (UNEP, 2009; UNEP, 2019a; UNEP, 2019b; UNEP, 2022). In addition to the typical POPs properties, perfluoroalkane acids through their hydrophilic group, such as perfluorooctane sulfonic acid (PFOS), perfluorohexane sulfonic acid (PFHxS), and perfluorooctanoic acid (PFOA) are water-soluble and partition to water to a greater extent than the brominated and chlorinated POPs.
Within an international environmental monitoring project implemented by the United Nations Environment Programme (UNEP) in 42 countries, almost 800 samples have been analyzed in our laboratory for perfluoroalkane acids (PFAA). In this paper, we assess the quantitative results from abiotic and biota samples with multivariate analysis for occurrence and scale of PFAA but also their profiles in environmental, food, and human samples using descriptive statistics, uni- and multivariate methods.
2 Materials and methods
2.1 Origin of samples
From 2016 to 2021, UNEP implemented four regional projects comprising 42 countries from African (n = 15), Asian (n = 7), Latin American and Caribbean (GRULAC, n = 11), and Pacific Islands (PAC, n = 9) regions (UNEP, 2015a; UNEP, 2015b; UNEP, 2015c; UNEP, 2015d). All countries were invited to collect 1) ambient air samples using passive samplers with polyurethane foam disks 4-times per year for 2 years, 2) one pool of human milk from primiparae, and 3) samples of other matrices of their national interest (up to 12 samples) for analysis of POPs at designated chemical laboratories. In addition, 22 countries were chosen to provide surface water samples, 4-times per year for 2 years, for the analysis of PFOS, PFOA, and PFHxS.
The sampling strategy did no target hotspots rather was directed towards baseline concentrations with no known POP source nearby. Standard operational procedures were developed at the onset of the projects to guide the sampling (UNEP, 2017a; UNEP, 2017b; UNEP, 2017c; UNEP, 2017d). The locations for the air and water samples, were maintained throughout the project, with the exception that in Brazil, the sampling site at the mouth of the Amazon River was moved to the Sao Paulo channel in the second year. In most countries, the air sampling site was located at the national meteorological station or the institute responsible for the project. The water samples were surface water samples collected with a bucket one every 3 months. The site should be integrative and located at the mouth of a river or an estuary (Weiss et al., 2015).
The full sampling programme could not be verified by all countries. Here, we assess the samples analyzed for PFAA in the laboratory of Örebro University, Sweden. The characteristics of the samples are described in the project reports by UNEP for the four regional projects (Fiedler and UNEP, 2022a; Fiedler and UNEP, 2022b; Fiedler and UNEP, 2022c; Fiedler and UNEP, 2022d).
2.2 Chemical analysis
Chemical analysis of PFOS, PFOA, PFHxS, and other PFAS followed the procedures as described (Sadia et al., 2020; Baabish et al., 2021; Camoiras González et al., 2021; Fiedler and Sadia, 2021; Fiedler et al., 2022a; Fiedler et al., 2022 submitted). In brief, up to 16 PFAS and five PFOS precursors, perfluoro-1-octanesulfonamide (FOSA), methylperfluoro-1-octanesulfonamide (NMeFOSA) and ethylperfluoro-1-octanesulfonamide (NEtFOSA); two perfluorooctane sulfonamidoethanols, 2-(N-methylperfluoro-1-octanesulfonamido)-ethanol (NMeFOSE), and 2-(N-ethylperfluoro-1-octanesulfonamido)-ethanol (NEtFOSE), were extracted using solid-phase extraction (SPE, SPE-WAX cartridges, 6 ml, 150 mg, 30 μm; Waters Corporation Milford, United States). Sample extracts were analyzed with a liquid chromatograph coupled to a tandem mass spectrometer (LC–MS/MS) with electrospray ionization (ESI) operating in negative ionization mode (XEVO TQS Waters Corporation, Milford, United States). Aliquots of 10 μl were injected on a BEH (ethylene bridged hybrid) C18-column (1.7 μm, 2.1 mm × 100 mm; Waters Corporation Milford, United States). Mobile phases used were either methanol: water 70:30 (v/v) (A) and 100% methanol (B) with 2 mM ammonium acetate in both phases or ammonium acetate (2 mM) in 80:20 (v:v) water: acetonitrile (A), and ammonium acetate (2 mM) in acetonitrile (B).
The MTM Laboratory had successfully participated in the analysis of PFAS in three rounds of the UNEP-coordinated interlaboratory assessments for POPs (UNEP et al., 2014; UNEP et al., 2017; Fiedler et al., 2020; UNEP et al., 2021; Fiedler et al., 2022b; van der Veen et al., 2022 submitted).
2.3 Data handling and assessment
All data were maintained in Microsoft Office 365 Excel®; statistical evaluations were made using R packages versions 4.0.3 and 4.0.5 with R-Studio. Multivariate methods, such as hierarchical cluster analysis (HCA) and principal component analysis (PCA) were applied to assess similarities, differences or correlations between datasets and meta-data. Clustering was made using Euclidean distances and the Ward method (ward.02 in R); a method creating groups where the variance within the groups (clusters) is minimized. The data in a set are grouped into clusters of great(er) similarity to form a dendrogram as shown in the heatmap (see Figure 8). In a PCA, data are extracted and newly projected to display systematic variation in a data matrix. For all quantitative assessments, concentrations below the limit of quantification (LOQ) were set zero. All concentrations refer to picogram (pg) followed by the respective reference unit, either Gram or PUF (for air samples).
Spearman non-parametric correlation was applied to determine relationship between concentrations or percentage contribution of variables; the correlation coefficient r was set less than 0.05. The Kruskal–Wallis H test was used to determine if there are statistically significant differences between the independent variables and dependent variables. Post-hoc analysis was performed using the pairwise Wilcoxon test. Adjustment of the p-value was made using the Benjamini–Hochberg method. The significance values (p) for all tests were set to less than 0.05.
For all quantitative assessments, concentrations below the limit of quantification (LOQ) were set to zero; thus, lower-bound concentrations were used.
Outliers were defined as values above (or below) the interquartile range multiplied by 1.5. The interquartile range is defined as the length of the middle 50% of data points, i.e., the difference between the third or upper quartile (75% of data points) and the first or lower quartile (25% of data points). Visualization is expressed as box whisker plots.
3 Results
3.1 Descriptive statistics of samples
A total of 668 samples, had quantitative results for all of the three PFAA. About 200 samples had either all three PFAA below the LOQ or at least one PFAA could not be determined since the QA/QC criteria were not met and the specific result could not be reported (NR).
The characteristics of the samples as to their geographic location, type or matrix is shown in Table 1; all samples were collected 2017–2018 and a few samples in 2019. As to geography, 34% of the samples were from Africa, followed by GRULAC with 31%; Asia ad PAC had 18% and 16%, respectively. There were much more abiotic samples (73%) than biota (27%) due to the abundance of 267 ambient air samples collected through passive air sampling using PUFs (Camoiras González et al., 2021) and 158 surface water samples (Baabish et al., 2021; Fiedler et al., 2022). Among the biota samples were 75 fish (Fiedler et al., 2022) and 36 human milk samples from primiparae (Fiedler and Sadia, 2021). Despite the large number of samples, for certain combinations of matrix and region, only a few samples were available occasionally, thus limiting interpretation; an example is one butter sample from the Pacific Islands.
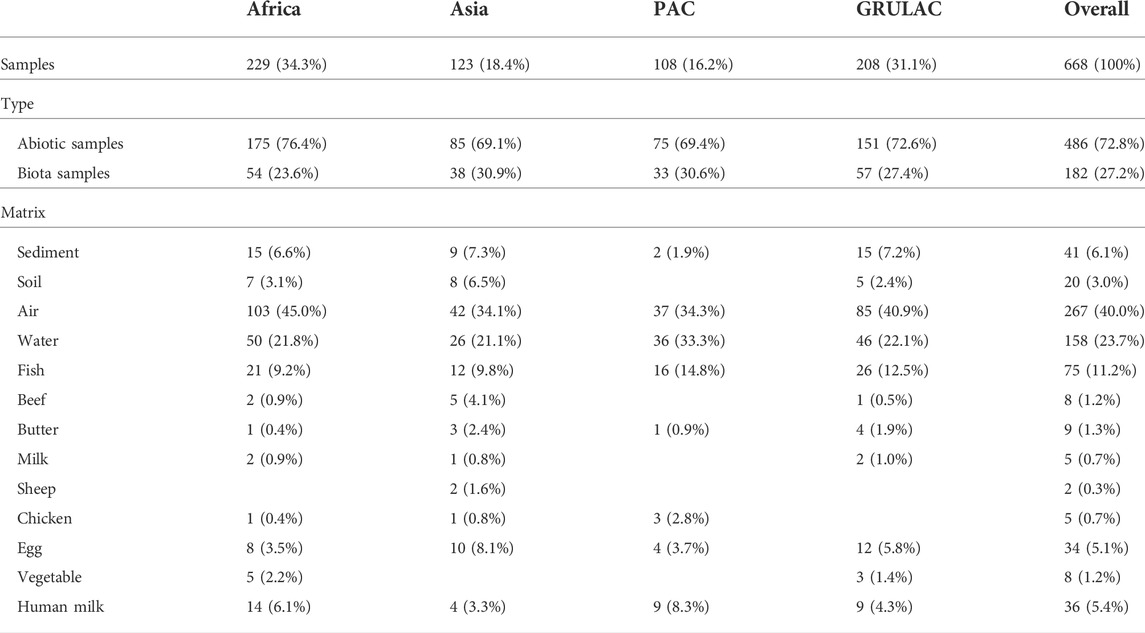
TABLE 1. Overview of origin and classification of the samples analyzed for three PFAA.
The summarized results shown in Table 2 contain values in pg of PFAA per gram sample and pg per PUF (and 3 months of exposure time) for the air samples. Across all the samples, PFOS had the highest mean and median values (135 pg/unit and 38.4 pg/unit) followed by PFOA (95.1 pg/unit and 16.8 pg/unit). PFHxS had a median value of zero and a mean value of 5.99 pg/unit. Large differences can be seen for PFOS between mean values and median values such as for sediment and fish. For air, butter, and egg, the mean values are about twice as high as the median values. For PFOA, such large differences could not be seen. For PFHxS, the values were much lower and there were a lot of values below the LOQ; the highest measured values were found in a sediment sample (307 pg/g) and in a human milk from Kiribati (111 pg/g f.w.). The visualization for each matrix is shown in Figure 1. The occurrence of the data points in the four project regions as box whisker plots for each matrix is contained in the supplementary information as Supplementary Figure S1.
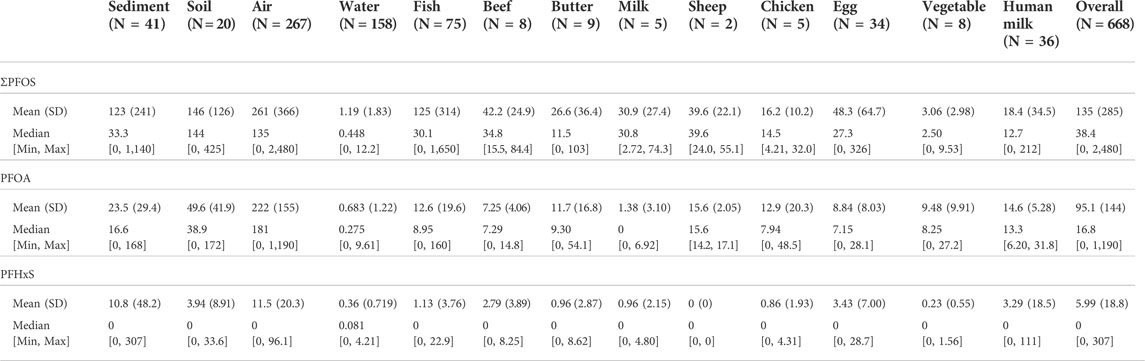
TABLE 2. Descriptive statistics of three PFAA in samples according to matrix. Concentrations in pg per PUF for air samples, pg per g in biota and abiotic samples.
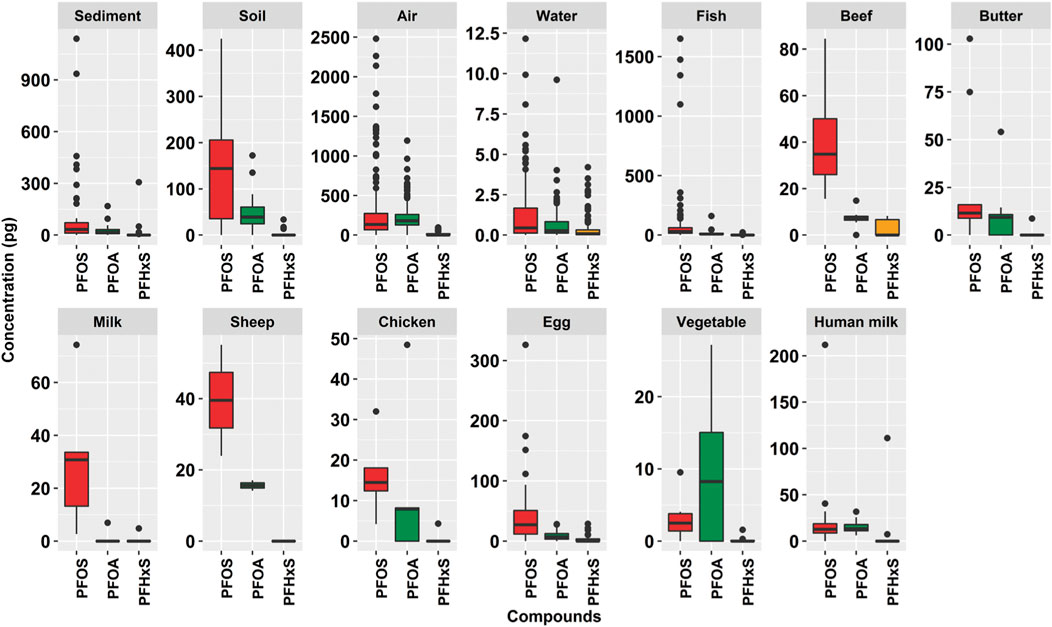
FIGURE 1. Box whisker plots (scaled) for PFOS, PFOA, and PFHxS in 13 matrices (n = 668). The whiskers represent the minimum and maximum concentrations without the outliers. The lower border of the box represents the first quartile (25%), the line inside the box the median and the upper border is the third quartile (75%). The dots outside the whiskers are outliers, which were defined as all concentrations greater or smaller the interquartile range multiplied by 1.5.
Soil and sediment samples were provided at the discretion of the countries and there were no criteria requested in the sampling protocol (UNEP, 2017d). Therefore, the scale and pattern of these samples cannot be easily interpreted Figure 1. The abiotic samples, sediment, air, and water, have many datapoints as outliers with amounts greater than the interquartile range multiplied by 1.5 (according to definition in Section 2.3). Fish is the only biota matrix that showed many outliers. All other biota matrices, and soil, have lower numbers of outliers. The more homogenous data points for the foodstuffs may be due to sample origin since most of them were bought from supermarkets or local markets; thus, are quite representative for the country. Nevertheless, for a few food samples, local contamination inputs cannot be excluded, e.g., butter, milk, chicken or egg. The air samples had outliers in all regions, especially for PFOS; however, not in PAC (Supplementary Figure S1). The fish samples had outliers for PFOS, especially in the GRULAC region. Wide interquartile ranges occurred for PFOS in Asia for beef, in GRULAC for butter and in Africa for cow’s milk. Eggs showed large interquartile ranges for PFOS in all regions, least in Asia. For PFOA, there were hardly any outliers recorded; a quite large interquartile range was found in PAC, although on comparatively low level. For human milk, extreme values were observed in PAC for Kiribati with PFOS and PFHxS whereas PFOA did not have any outlier across all regions. The abundance of PFOA in PAC chicken samples and GRULAC butter samples is noticeable (see Table 2; Supplementary Figure S1).
The difference between mean (with standard deviation, SD) and median values is graphically shown in Figure 2. For air, it can be seen that the ratio PFOS: PFOA is inverted when considering mean: median values: the mean value for PFOS (261 pg/PUF with a large SD) is higher than for PFOA (222 pg/PUF with a smaller SD) whereas the median value for PFOA (181 pg/PUF) is higher than for PFOS (135 pg/PUF). Thus, care should be taken when selecting data for assessments.
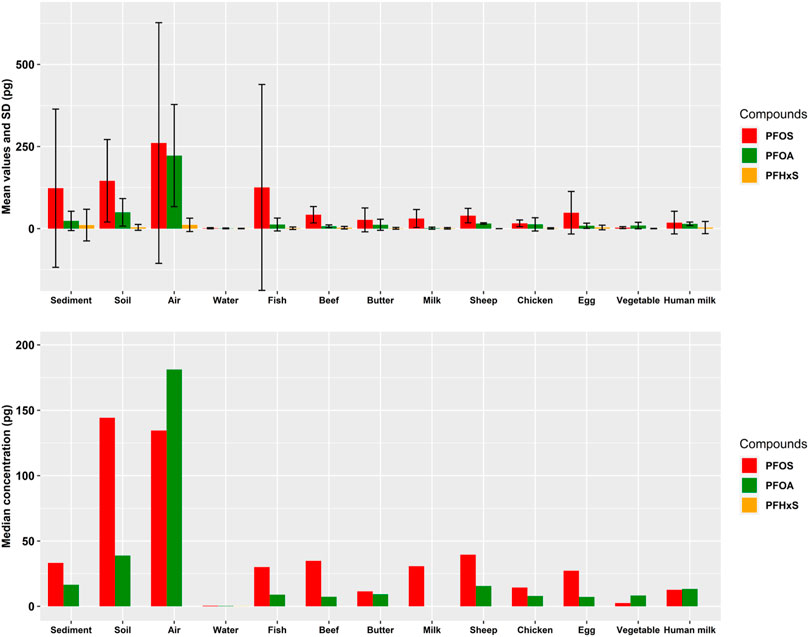
FIGURE 2. Mean values with SD (above) and median values (below) for three PFAA in the matrices analyzed.
The histograms in Figure 3 are a graphical representation combining the number of samples per matrix with the measured values shown in Table 2. Clearly, the frequency distributions do not follow normal distribution. Only PFOA in human milk exhibits a bell shape curve. All others are heavily biased towards the lowest values.
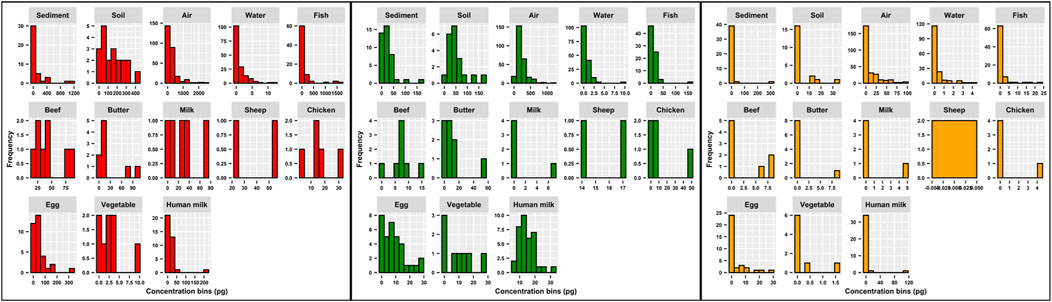
FIGURE 3. Histograms for PFOA (red color), PFOA (green color) and PFHxS (orange color) according to matrices.
The graphics for the PFAA concentrations by matrix but differentiated into the regional projects is shown in Figure 4. Striking are the comparatively high PFOS concentrations in Asian beef, GRULAC butter and African cows’ milk. Non-parametric testing across all matrices showed that there were significant differences between the regions (p = 0.017) due to the pairwise significant difference between Pacific Islands and GRULAC (p = 0.017). The difference of the data points was significant for the type of samples, abiotic vs. biota, which had a Kruskal–Wallis chi-squared value of 62.642 and p = 2.48 × 10⁻¹⁵.
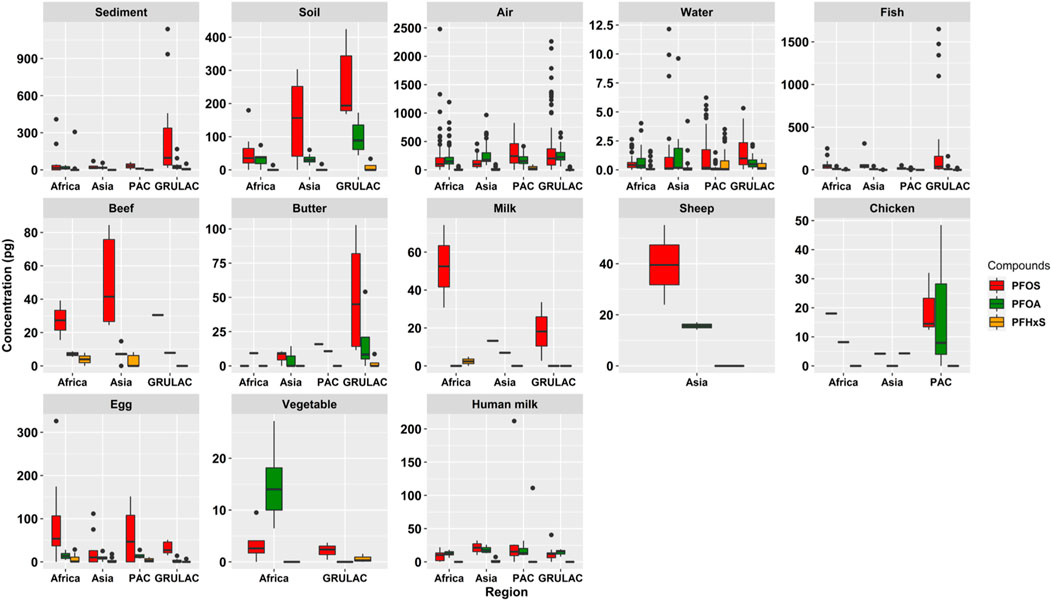
FIGURE 4. Scaled box plots showing the three PFAA in each matrix differentiated by region. The whiskers represent the minimum and maximum concentrations without the outliers. The lower border of the box represents the first quartile (25%), the line inside the box the median and the upper border is the third quartile (75%). The dots outside the whiskers are outliers, which were defined as all concentrations greater or smaller the interquartile range multiplied by 1.5.
3.2 Pattern as contribution of individual perfluoroalkane substances to sum of three perfluoroalkane substances
The descriptive statistics covering the 668 samples and assessing the three PFAS as to their contribution to the sum of the three PFAS (PFAS3) are the pattern of the PFAS and is shown in Table 3, and visualized in Figure 5.

TABLE 3. Descriptive statistics for pattern of three PFAA (%) in samples according to matrix.
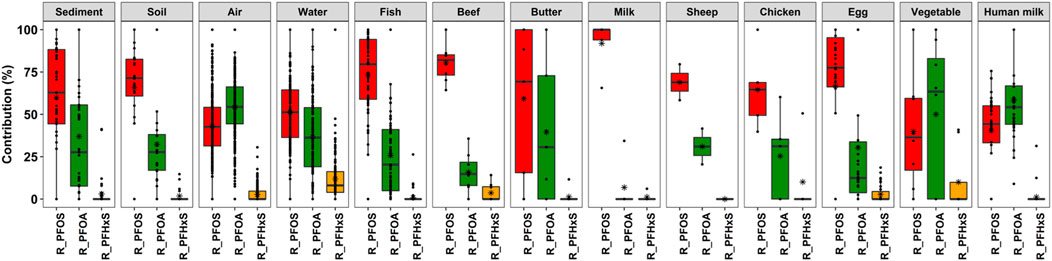
FIGURE 5. Box plots showing the contribution of individual PFAS to PFAS3 in each matrix. The whiskers represent the minimum and maximum concentrations without the outliers. The lower border of the box represents the first quartile (25%), the line inside the box the median and the upper border is the third quartile (75%). The asterisk indicates the mean value. The dots outside the whiskers are outliers, which were defined as all concentrations greater or smaller the interquartile range multiplied by 1.5.
The graphical plot showing the pattern for all matrices as occurring in the regions is summarized as box plots in the supplementary information as Supplementary Figure S2.
The histograms for the pattern of the PFAA in Supplementary Figure S3 show a more homogeneous picture closer to normal distribution than was seen for the measured values in Figure 3.
The detailed information is illustrated in the supplementary information in Supplementary Figure S4, which shows the contribution of PFOS, PFOA and PFHxS to the sum of these three PFAS (PFAS3) in stacked bars scaled to 100% for each sample according to region and matrix. In most cases, also for the pattern within one matrix and one region, the shares of PFOS and PFOA are quite different. In all samples, except one chicken in Vietnam and very few water samples in PAC, the contribution of PFHxS to sum PFAS3 is minor.
Figure 6 shows that PFOS had higher contributions to the sum of PFAS3 in biota (median value = 69.4%) than abiotic samples (median = 46.8%). Whereas in Africa, Asia, and GRULAC, the shares of PFOS in biota were 64.9%, 71.6%, and 88.0%, the Pacific Islands sample set had very similar median values in biota and abiotic samples. PFOA contribution was 28.5% in biota and 49.0% in abiotic samples. Only in the Pacific Islands region, the PFOA share was higher in biota. In general, PFHxS did not contribute much to the sum PFAS3—median percentage contribution is always zero, but mean values were 2.1% in biota and 5.7% higher in abiotic samples. Parametric testing did confirm significant difference in the pattern between the types (p = 0.02; abiotic vs. biota). No significant differences in the pattens were found in either region (p = 0.96) or between matrices (p = 0.72).
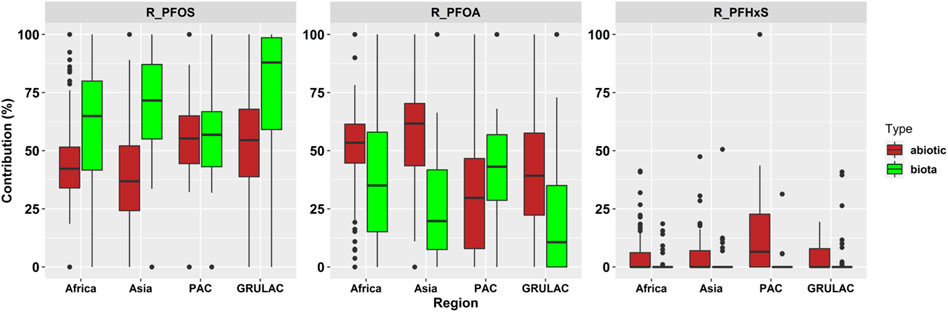
FIGURE 6. Scaled boxplots displaying the pattern for the ratio of PFOS, PFOA and PFHxS to PFAS3 in abiotic (brown color) and biota (green color) samples for each region. The whiskers represent the minimum and maximum concentrations without the outliers. The lower border of the box represents the first quartile (25%), the line inside the box the median and the upper border is the third quartile (75%). The dots outside the whiskers are outliers, which were defined as all concentrations greater or smaller the interquartile range multiplied by 1.5.
3.3 Multivariate analysis
The PCAs in Figure 7 explain 83% of the data points in the samples with 55.6% along the x-axis (Dim1) and 27.7% along the y-axis (Dim2). Samples characterized by PFHxS were located in the first quartile and sample characterized by PFOS and PFOA were located in the fourth quartile, indicating that PFHxS concentrations differed from those of PFOS and PFOA. Ellipses as envelopes for samples of the same characteristic could be created around all regions (Figure 7, left); they overlap largely so that only for the PAC samples (blue color of dots and ellipse) some preference towards high PFHxS values could be seen. With respect to the matrices (Figure 7, right), the human milk samples formed an own very narrow group on the x-axis with the outlier for the Kiribati human milk sample in the first quartile due to high PFHxS but also high PFOS concentrations; this was the only human milk sample on the positive site of Dim1. The food samples were co-located within small ellipses (if any) close to the origin; only some fish samples were found at higher values close to the positive x-axis.
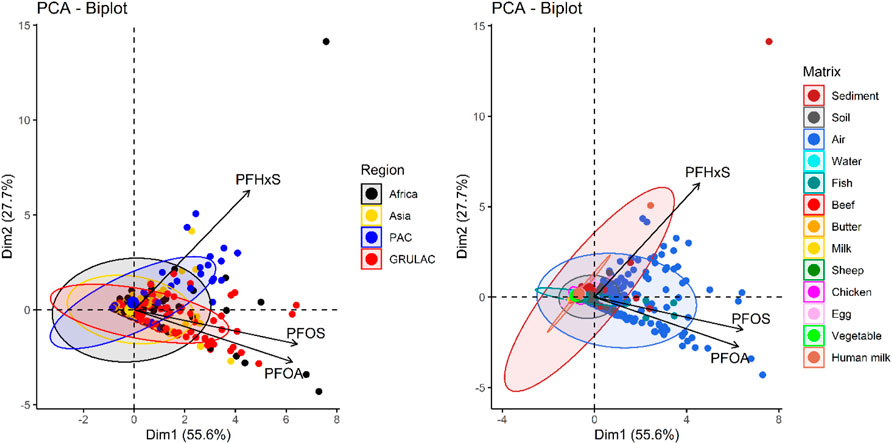
FIGURE 7. PCA biplots for 668 environmental samples with ellipses around region (left) and matrix (right). Loadings for PFOS, PFOA, and PFHxS measurements.
The PCA for the pattern as shown in the biplots in Supplementary Figure S5 of the supplementary information shows the distinct vectors for the three principal components and almost complete overlaps of the ellipses for regions and matrices.
The heatmap depicting the contribution of the three variables to the sum of PFAS3 in Figure 8 shows a complex dendrogram at left. Unfortunately, since the heatmap describes 668 samples, the sample IDs at the right site are indicative only and do not include all samples. The dendrogram has two samples at the bottom of the heatmap, which had only PFHxS quantified (green color) and PFOA and PFOS with 0% contribution to the pattern; both were water samples from PAC (PLW 2018–1 and TUV 2018–3) at low scale (0.033 ng/L and 0.027 ng/L). The remaining 666 samples were grouped into two distinct clusters; each of them contains representation of all matrices as shown by the colors below the dendrogram. The lower cluster is characterized by low PFHxS (red color) and moderate to high PFOA contributions (yellow to green colors) whereas the upper cluster contains all the samples that have higher PFOS (yellow to green colors) than PFOA (red to yellow colors) contributions to the sum of PFAS3.
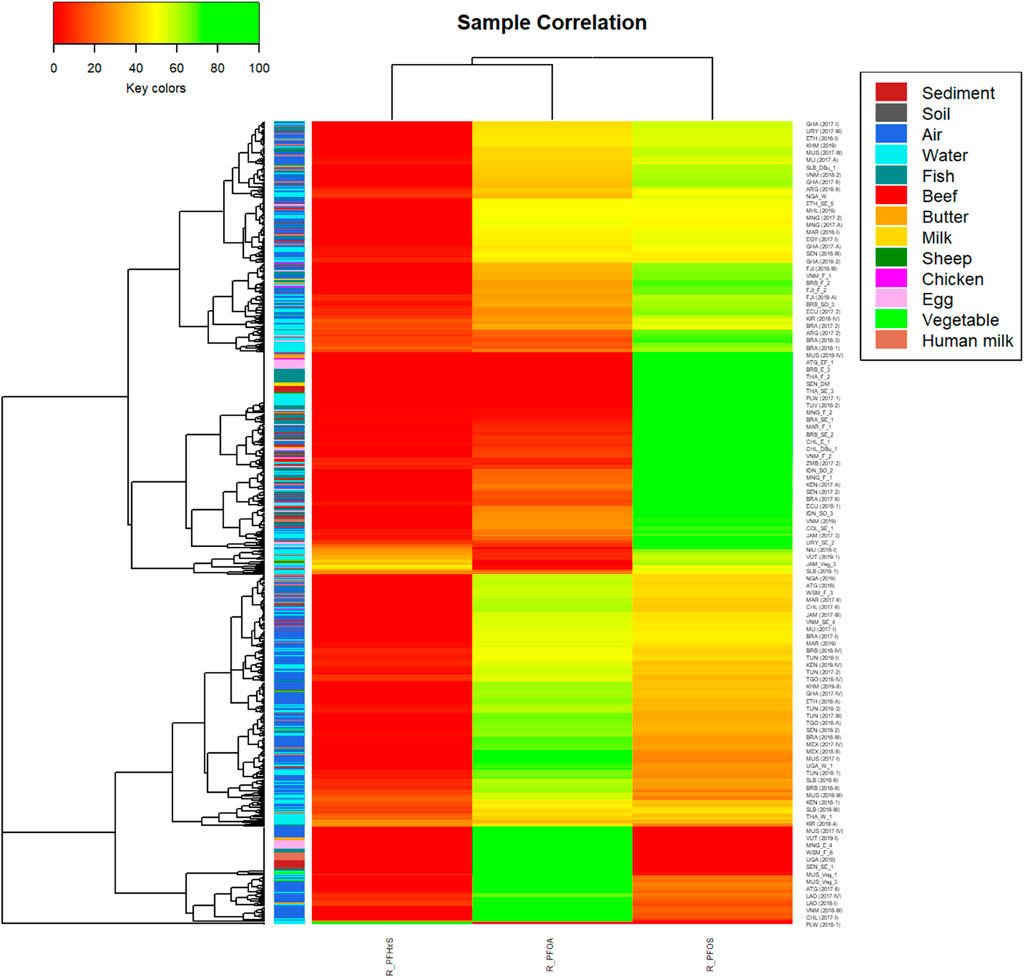
FIGURE 8. Heatmap for the pattern of PFAS3 with dendrogram using ward method and colors for matrices (n = 668)
The above presented results were confirmed by spearman correlation coefficients using ward.02 method and hierarchical clustering as shown in Figure 9. The correlation coefficients for the measured values (Section 3.1) demonstrate that PFOS is positively and moderately-to-high correlated with PFOA (r = 0.76) but not correlated with PFHxS (r = 0.13) as PFOA and PFHxS are not correlated (r = 0.04) (Figure 9, left). Subsequently, the pattern for the contribution of the individual PFAS to the PFAS3 (Section 3.2) showed a very high negative correlation between PFOS and PFOA (r = −0.91) and no correlations with PFHxS (r = −0.06) and for PFOA to PFHxS (r = −0.2) (Figure 9, right).
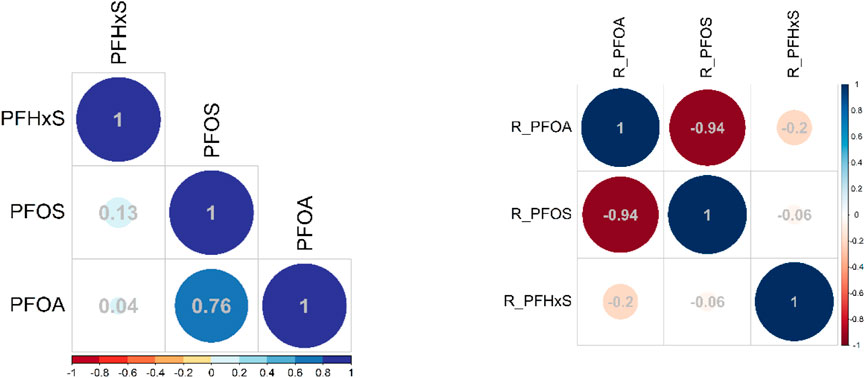
FIGURE 9. Correlation matrix for the three PFAS across all samples (n = 668) and for contribution of individual PFAS to sum of PFAS3 (right); spearman method with ward clustering method.
4 Discussion and conclusion
A large dataset has been analyzed by one laboratory with the same instrumentation and chemical analytical approaches within 3 years. The conditions in the laboratory remained the same and stable during this period so that intralaboratory variation in the laboratory were minimized. Even though up to 15 PFAA had been analyzed, only three PFAA could be quantified with high detection frequencies, so that the datasets compared in this paper comprise 668 samples with quantitative data for PFOS, PFOA, and PFHxS.
This monitoring programme was targeted to identify and quantify the occurrence of the new POPs—PFOS, PFOA and PFHxS—in developing countries for use in policy and risk management. The monitoring data do not replace an inventory of sources of these three PFAA. Neither has any of the sampling strategies targeted potential hotspots. The presence of especially PFOS and PFOA in the developing countries may justify the listing of these two compounds as modern industrial chemicals with worldwide distribution, including their long-range transport potential and accumulation behaviors. The absence of PFHxS in most samples indicates that the compound did not have wide distribution and may be a contaminant from production of PFAS rather than having dedicated application or uses.
Non-parametric tests across all samples showed that for regions, differences were significantly different with a p-value = 0.01667; pairwise difference was significant only for PAC:GRULAC, p = 0.017. With respect to the type, it was shown that abiotic and biota results had a very low p-value of 2.48 × 10⁻¹⁵. With respect to the matrices (excluding the two sheep and the two vegetable samples), they were significantly different (p=<2.2 × 10⁻¹⁶). Pairwise tests showed that the air samples were significantly different from all other matrices with p-values smaller than p = 0.0003 (Table 4), including food samples from the terrestrial foodchain such as beef, cows’ milk or butter. Within the food matrices, significant differences were not found.
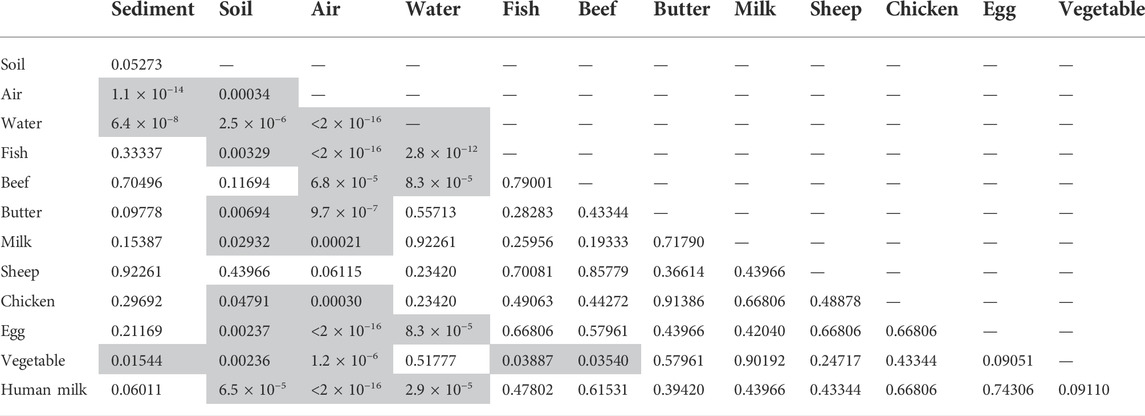
TABLE 4. Wilcoxon test with Benjamini Hochberg procedure for matrix. Cells highlighted in grey color indicate significant differences between parameters.
The non-parametric tests for the contribution of individual PFAS to sum of PFAS3 across all samples (n = 668) for regions gave Kruskal–Wallis chi-squared = 0.27828 and p-value = 0.9641. For the type (abiotic vs. biota), the Kruskal–Wallis chi-squared = 5.4365 had a p-value = 0.02; thus, significantly different pattern. Between matrices, the p-values were high and did not give any significant differences; overall Kruskal–Wallis chi-squared = 8.8129 and p-value = 0.7188; all pairwise comparisons were 1.00, except water: fish and water: egg, which were 0.98.
Our assessment of PFOS, PFOA, and PFHxS in abiotic and biota samples showed that PFOS and PFOA dominated both the scale and the pattern of three PFAA in all matrices. Within the matrices, concentration and shares differed widely. The results indicate very heterogenous pictures and no conclusions can be drawn as to the mobility (transfer of PFAS between matrices) or stability of the chemicals under environmental conditions. We also did not find any geographic preference for these compounds. The high frequency of PFHxS detection in water maybe due to increased detection sensitivity since the concentrations were in the ppt range (ng/L) whereas for the other matrices chemical analytical sensitivity was in the ppb range (ng/g or hundred/thousands pf/PUF).
The chemometric assessment of the environmental and human samples of PFAS was hampered by the small number of chemicals presented in this paper, since among the 15 PFAS analyzed in all samples, 12 PFAS had the majority of the compounds below the limit of quantification and therefore, were not be used in the quantitative assessments.
Data availability statement
The original contributions presented in the study are included in the article/Supplementary Materials, further inquiries can be directed to the corresponding author.
Author contributions
HF: Project administration, Data curation, Visualization, Writing—original draft, review, and editing. MS: Chemical analysis, Programming, Validation, Writing—review, and editing. AB: Chemical analysis, Programming, Validation, Writing—review, and editing.
Acknowledgments
The contribution of the projects to support POPs monitoring in developing country regions financed by the Global Environment Facility (GEF) and implemented by UN Environment Programme (UNEP; Geneva, Switzerland) is greatly acknowledged.
Conflict of interest
The authors declare that the research was conducted in the absence of any commercial or financial relationships that could be construed as a potential conflict of interest.
Publisher’s note
All claims expressed in this article are solely those of the authors and do not necessarily represent those of their affiliated organizations, or those of the publisher, the editors and the reviewers. Any product that may be evaluated in this article, or claim that may be made by its manufacturer, is not guaranteed or endorsed by the publisher.
Supplementary material
The Supplementary Material for this article can be found online at: https://www.frontiersin.org/articles/10.3389/frans.2022.954915/full#supplementary-material
References
Baabish, A., Sobhanei, S., and Fiedler, H. (2021). Priority perfluoroalkyl substances in surface waters - a snapshot survey from 22 developing countries. Chemosphere 273, 129612. doi:10.1016/j.chemosphere.2021.129612
Camoiras González, P., Sadia, M., Baabish, A., Sobhanei, S., and Fiedler, H. (2021). Air monitoring with passive samplers for perfluoroalkane substances in developing countries (2017–2019). Chemosphere 282, 131069. doi:10.1016/j.chemosphere.2021.131069
Fiedler, H., Kallenborn, R., de Boer, J., and Sydnes, L. K. (2019). The Stockholm convention: A tool for the global regulation of persistent organic pollutants. Chem. Int. 41 (2), 4–11. doi:10.1515/ci-2019-0202
Fiedler, H., Sadia, M., Baabish, A., and Sobhanei, S. (2022). Perfluoroalkane substances in national samples from global monitoring plan projects (2017-2019), Chemosphere (SI Analysis Persistent Org. Pollut. Stock. Convention´s Glob. Monit. Plan), 307, 136038, doi:10.1016/j.chemosphere.2022.136038
Fiedler, H., Sadia, M., Krauss, T., Baabish, A., and Yeung, L. W. Y. (2022a). Perfluoroalkane acids in human milk under the global monitoring plan of the Stockholm Convention on Persistent Organic Pollutants (2008-2019). Front. Environ. Sci. Eng. 16(10), 132. doi:10.1007/s11783-022-1541-8
Fiedler, H., van der Veen, I., and de Boer, J. (2022b). Assessment of four rounds of interlaboratory tests within the UNEP-coordinated POPs projects. Chemosphere 288 (Pt 2), 132441. doi:10.1016/j.chemosphere.2021.132441
Fiedler, H., and Sadia, M. (2021). Regional occurrence of perfluoroalkane substances in human milk for the global monitoring plan under the Stockholm Convention on Persistent Organic Pollutants during 2016-2019. Chemosphere 277, 130287. doi:10.1016/j.chemosphere.2021.130287
Fiedler, H., and UNEP (2022a). “UNEP/GEF GMP2 project: Regional report for Africa,” in Chemicals and Health Branch of UNEP (Geneva, Switzerland: United Nations Environment Programme).
Fiedler, H., and UNEP (2022b). “UNEP/GEF GMP2 project: Regional report for Asia,” in Chemicals and Health Branch of UNEP (Geneva, Switzerland: United Nations Environment Programme).
Fiedler, H., and UNEP (2022c). “UNEP/GEF GMP2 project: Regional report for GRULAC,” in Chemicals and Health Branch of UNEP (Geneva, Switzerland: United Nations Environment Programme).
Fiedler, H., and UNEP (2022d). “UNEP/GEF GMP2 project: Regional report for pacific Islands,” in Chemicals and Health Branch of UNEP (Geneva, Switzerland: United Nations Environment Programme).
Fiedler, H., van der Veen, I., and de Boer, J. (2020). Global interlaboratory assessments of perfluoroalkyl substances under the Stockholm Convention on persistent organic pollutants. TrAC Trends Anal. Chem. 124, 115459. doi:10.1016/j.trac.2019.03.023
Sadia, M., Yeung, L. W. Y., and Fiedler, H. (2020). Trace level analyses of selected perfluoroalkyl acids in food: Method development and data generation. Environ. Pollut. 263, 113721. doi:10.1016/j.envpol.2019.113721
UNEP; Fiedler, H., van der Veen, I., and de Boer, J. (2021). Bi-ennial global interlaboratory assessment on persistent organic pollutants – fourth round 2018/2019. (Geneva, Switzerland: United Nations Environment Programme UNEP).
UNEP; Fiedler, H., van der Veen, I., and de Boer, J. (2017). Bi-ennial global interlaboratory assessment on persistent organic pollutants – third round 2016/2017. (Geneva, Switzerland: United Nations Environment Programme UNEP).
UNEP; Nilsson, H., van Bavel, B., van der Veen, I., de Boer, J., and Fiedler, H. (2014). Bi-Ennial global interlaboratory assessment on persistent organic pollutants – second round 2012/2013. (Geneva, Switzerland: United Nations Environment Programme UNEP).
UNEP (2015a). “Continuing regional support for the POPs global monitoring plan under the Stockholm convention in the Africa region,” in United Nations environment programme (UNEP) (Geneva, Switzerland: Global Environment Facility).
UNEP (2015b). “Continuing regional support for the POPs global monitoring plan under the Stockholm convention in the Latin American and caribbean region,” in United Nations environment programme (UNEP) (Geneva, Switzerland: Global Environment Facility).
UNEP (2015c). “Continuing regional support for the POPs global monitoring plan under the Stockholm convention in the pacific region,” in United Nations environment programme (UNEP) (Geneva, Switzerland: Global Environment Facility).
UNEP (2015d). “Regional support for the POPs global monitoring plan under the Stockholm convention in the asian region,” in United Nations environment programme (UNEP), (Geneva, Switzerland: Global Environment Facility).
UNEP (2017a). “Global monitoring plan on persistent organic pollutants protocol for the sampling of water as a core matrix in the UNEP/GEF GMP2 projects for the analysis of PFOS,” in Chemicals and health branch, economy division, (Nairobi, Kenya: United Nations Environment Programme UNEP).
UNEP (2017b). “Global monitoring plan on persistent organic pollutants protocol of air monitoring using passive sampling of ambient air methodology and procedure,” in Chemicals and health branch, economy division, (Nairobi, Kenya: United Nations Environment Programme UNEP).
UNEP (2017c). Global monitoring plan on persistent organic 105 pollutants. Guidelines for organization, sampling and analysis of human milk on persistent organic pollutants, in Chemicals and health branch, economy division. (Nairobi, Kenya: United Nations Environment Programme UNEP).
UNEP (2017d). “Global monitoring plan on persistent organic pollutants. Protocol for the sampling and pre-treatment of national samples within the UNEP/GEF projects to support the global monitoring plan of POPs 2016-2019,” in Chemicals and health branch economy division, (Nairobi, Kenya: United Nations Environment Programme UNEP).
UNEP (2022). Decision SC-10/[--]: Perfluorohexane sulfonic acid (PFHxS), its salts and PFHxS-related compounds,” SC-10/[--] (ed.) in Conference of the parties to the Stockholm convention on persistent organic pollutants) (Geneva, Switzerland: United Nations Environment Programme UNEP).
UNEP (2009). “Decision SC-4/17. Listing of perfluorooctane sulfonic acid, its salts and perfluorooctane sulfonyl fluoride,” in SC-4/17 (Ed.) Conference of the parties to the Stockholm convention on persistent organic pollutants, (Nairobi, Kenya: United Nations Environment Programme UNEP),
UNEP (2019a). Decision SC-9/4: Perfluorooctane sulfonic acid, its salts and perfluorooctane sulfonyl fluoride, SC-9/4. (ed.) in Conference of the parties to the Stockholm convention on persistent organic pollutants, (Geneva, Switzerland: United Nations Environment Programme UNEP).
UNEP (2019b). “Decision SC-9/12: Listing of perfluorooctanoic acid, its salts and PFOA-related compounds,” in SC-9/12 (ed.) in Conference of the parties to the Stockholm convention on perssisent organic pollutants (Geneva, Switzerland: United Nations Environment Programme UNEP).
UNEP (2001). Stockholm Convention on persistent organic pollutants. Nairobi, Kenya: United Nations Environment Programme. Available at: www.pops.int [Accessed].
van der Veen, I., de Boer, J., and Fiedler, H. (2022). Assessment of the per- and polyfluoroalkyl substances analysis under the Stockholm Convention – 2018/2019. Chemosphere (SI Analysis Persistent Org. Pollut. Stock. Convention´s Glob. Monit. Plan).
Wania, F., and Mackay, D. (1996). Peer reviewed: Tracking the distribution of persistent organic pollutants. Environ. Sci. Technol. 30 (9), 390A–396A. doi:10.1021/es962399q
Weiss, J., de Boer, J., Berger, U., Muir, D., Ruan, T., Torre, A., et al. (2015). “PFAS analysis in water for the global monitoring plan of the Stockholm convention set-up and guidelines for monitoring,” in Division of Technology, industry and economics (Geneva: United Nations Environment Programme UNEP).
Keywords: perfluoroalkane substances (PFAS), targeted chemical analysis, developing countries, chemometric approaches, correlation and significance
Citation: Fiedler H, Baabish A and Sadia M (2022) Multivariate analysis of abiotic and biota samples for three perfluoroalkane acids. Front. Anal. Sci. 2:954915. doi: 10.3389/frans.2022.954915
Received: 27 May 2022; Accepted: 16 September 2022;
Published: 13 October 2022.
Edited by:
Antonije Onjia, University of Belgrade, SerbiaReviewed by:
Maja Đolić, University of Belgrade, SerbiaAleksandra Nastasović, Technology and Metallurgy, University of Belgrade, Serbia
Copyright © 2022 Fiedler, Baabish and Sadia. This is an open-access article distributed under the terms of the Creative Commons Attribution License (CC BY). The use, distribution or reproduction in other forums is permitted, provided the original author(s) and the copyright owner(s) are credited and that the original publication in this journal is cited, in accordance with accepted academic practice. No use, distribution or reproduction is permitted which does not comply with these terms.
*Correspondence: Heidelore Fiedler, heidelore.fiedler@oru.se
†Present address: Mohammad Sadia, Freshwater and Marine Ecology, Institute for Biodiversity and Ecosystem Dynamics, University of Amsterdam, Amsterdam, Netherlands