 Abhishek Tiwari
 Tiago H. Falk
- INRS-EMT, University of Quebec, Montreal, QC, Canada
Prediction of mental states, such as stress and anxiety, can be important in situations where reduced job performance due to increased mental strain can lead to critical situations (e.g., front-line healthcare workers and first responders). While recent advances in biomedical wearable sensor technologies have allowed for collection of multiple physiological signals in everyday environments, numerous challenges emerge from such uncontrolled settings, including increased noise levels and artifacts, confounding effects from other psychological states (e.g., mental fatigue), as well as physical variables (e.g., physical activity). These factors can be particularly detrimental for heart rate variability (HRV) measures which, in controlled settings, have been shown to accurately track stress and anxiety states. In this paper, we propose two new ways of computing HRV proxies which we show are more robust to such artifacts and confounding factors. The proposed features measure spectral and complexity properties of different aspects of the autonomic nervous system, as well as their interaction. Across two separate “in-the-wild” datasets, the proposed features showed to not only outperform benchmark HRV metrics, but to also provide complementary information, thus leading to significantly greater accuracy levels when fused together. Feature ranking analysis further showed the proposed features appearing in 45–64% of the top features, thus further emphasizing their importance. In particular, features derived from the high frequency band showed to be most important in the presence of fatigue and physical activity confounding factors, thus corroborating their importance for mental state assessment in highly ecological settings.
1 Introduction
The COVID-19 pandemic has put tremendous pressure on healthcare systems worldwide, leading to increased cases of burnout (Kannampallil et al., 2020; Sultana et al., 2020) in frontline healthcare workers. Moreover, record-high levels of stress and anxiety are being reported by the general population; in the United States alone, a recent survey showed 80% of adults reported significant increases in stress levels due to the pandemic (Dataset] American Psychol, 2020) along with increased instances of depression worldwide (Choi et al., 2020; Dozois, 2020; Hyland et al., 2020). Adolescents have been equally effected by mental health crises brought on by social isolation during the pandemic (Chen et al., 2020). Similarly, seniors have also reported declines in mental health due to lockdowns (Skoog, 2020) and increased stress with the higher death risk (Barcellos et al., 2021). In fact, even before the COVID-19 pandemic, mental health problems were already on the rise worldwide. For example, studies showed that 50% of employees reported suffering from “work stress” (Chandola et al., 2010). Prior to the pandemic, it was already projected that the economic burden due to poor mental health worldwide would grow six-fold in the next 30 years (Doran and Kinchin, 2019). These trends clearly highlight the need for automated mental state monitoring systems (Zhou et al., 2020) that can be used in everyday environments.
Commonly, such interventions rely on user feedback through apps or online interaction with smart devices (Torous et al., 2020). This subjective feedback, however, has some key limitations. First, it does not allow for continuous assessment, thus has poor temporal resolution, which may cause delays in beginning interventions. While increasing the sampling rate for user feedback could lead to improved temporal resolution, this may have a negative impact on compliance, as well as increase user frustration with constant interruptions for feedback. Second, the ratings collected can be biased, particularly if responses can have a direct impact on the user (e.g., unpaid time off from work). Moreover, if user feedback is requested too often, careless responding could lead to additional biases (Eisele et al., 2020). Finally, asking users to report their perception of negative mental states can often increase such negative emotions, as focused is then placed on states of depression and anxiety (Mor and Winquist, 2002).
Alternatively, one may attempt to measure user mental states using automated systems that search for distinct patterns in unobtrusively-collected physiological signals. Given the increasing number and availability of consumer wearable devices (Peake et al., 2018), this has become a topic of increasing interest within the research community [e.g., (Wen et al., 2018; Pluntke et al., 2019; Tiwari et al., 2020)]. Commercially-available devices allow for unobtrusive measurement of multiple physiological signals, not only in controlled environments, but also across various ambulatory and ecological settings. Methods require no user intervention and can provide real-time mental state assessment and feedback. The majority of commercial devices provide the user with heart rate and activity information, whereas more advanced systems (e.g., Apple Watch and Empatica’s E4) can provide additional measures, such as galvanic skin response, skin temperature, oximetry, and electrocardiogram (ECG).
The ECG measures the electrical activity of the heart and has become a popular modality for mental state monitoring applications. Heart rate variability (HRV) is defined as the variability between inter-beat (RR) intervals of the ECG signal and reflects the changes in the autonomic nervous system (ANS). The ANS consists of two branches, namely the sympathetic (SNS) and parasympathetic (PNS) nervous systems. The PNS is responsible for slowing the heart rate and usually dominates at rest, while the SNS is responsible for the “flight-or-fight” response of the human body. The resulting HRV series is a reflection of the interaction between the two systems (Shaffer and Ginsberg, 2017). Within the HRV literature, the low frequency (LF, 0.04–0.15 Hz) and high frequency (HF, 0.15–0.40 Hz) band powers of the so-called HRV tachogram (i.e., interpolated and uniformly sampled RR series) are commonly computed and have been shown to reflect the SNS and PNS systems, respectively.
Traditionally, HRV has been studied using time- and frequency-domain features (Camm, 1996) with applications across numerous domains, including congestive heart failure (İşler and Kuntalp, 2007), chronic obstructive pulmonary disease (Camillo et al., 2008), stress (Castaldo et al., 2015), mental workload (Charles and Nixon, 2019), and anxiety (Wen et al., 2018). Several variations of the above mentioned frequency band power features have also been derived. For example, the ratio of LF-to-HF power has been shown to reflect the balance between the SNS and PNS system activity (Camm, 1996; Shaffer and Ginsberg, 2017) and to correlate with different mental states (Francis et al., 2002; Castaldo et al., 2015; Charles and Nixon, 2019). However, most of these studies have been conducted in controlled laboratory conditions to minimize the impact of confounding factors and to maximize the signal-to-noise ratio of the collected signals. Unfortunately, these conditions are not consistent with what is observed in realistic settings, where factors such as physical activity, fatigue, mental workload, and social interactions are present. Moreover, as the users are mobile, signals recorded in these “in-the-wild” conditions are very noisy and movement artifacts are known to be highly detrimental to the computation of traditional HRV features (Peltola, 2012). As a result, new features are needed that take these artifacts and confounding factors into account.
The RR series exhibits complex non-linear behavior (Goldberger et al., 2002). This behavior has been observed to change based on different physical and psychological conditions and features quantifying this behavior have been recommended in the literature (Sassi et al., 2015). Over the last few years, a handful of new artifact-robust features have been proposed [e.g., (Wen et al., 2018; Delliaux et al., 2019; Tiwari et al., 2019)]. These features often rely on the use of non-linear metrics to provide some robustness (Sassi et al., 2015). Work from (Delliaux et al., 2019), for example, explored various linear and non-linear metrics for mental workload assessment in long duration tasks. Non-linear measures were shown to better distinguish low and high mental workload consistently across the whole duration of the task. Similarly, (Wen et al., 2018) used the Hurst exponent for prediction of social anxiety in real-world conditions and showed improved accuracy over conventional time-domain HRV metrics. Furthermore (Tiwari et al., 2019b; Tiwari et al., 2019) made use of multi-scale entropy features for prediction of mental workload under different ambulatory conditions; improved results were shown over conventional time- and frequency-domain benchmark measures.
While the exact mechanisms behind the changes seen in the complexity of the RR series are still unknown, recent findings (Porta et al., 2007; Porta et al., 2012; Weippert et al., 2014) have suggested an influence of the SNS and PNS systems under various different clinical conditions. For example, the chaotic behavior in the HF component was linked to circadian (sleep/wake cycle) variability that is independent of age related changes to HF band power (Wu et al., 2009). Moreover, the synchronization of the HF band characteristics with respiration and blood pressure was observed when performing tasks related to higher mental workload (Lackner et al., 2011). In fact, the interaction between the SNS and PNS (i.e., LF and HF bands) have been shown to follow a non-linear coupling behavior, where an increase in SNS activity may not necessarily lead to PNS withdraw, or vice versa; in fact, it can often increase or cause no change in the PNS activity (Shaffer and Ginsberg, 2017). Metrics quantifying this non-linear interaction have been proposed to discriminate individuals with congestive heart failure (Luo et al., 2018) and obstructive sleep apnea (Zheng et al., 2017) from healthy controls.
Most of these complexity based features have been calculated over the entire spectrum of the RR series. It is expected that subband based complexity measures may provide some additional insights (Humeau-Heurtier, 2015). For example, changes in HF band peak frequency have been linked to physical activity (Pichon et al., 2004) and entropy of LF and HF bands individually have been shown useful for obstructive sleep apnea detection (Shao et al., 2019). In fact, characterizing the properties of different subbands has shown useful in other biosignals. These signals consist of both periodic and aperiodic components, which can directly impact the signal spectrum (Donoghue et al., 2020). For electroencephalograms, for example, these aperiodic aspects of the spectrum have been related to cognitive states and task demands (Immink et al., 2021). Here, we propose subband complexity measures and new spectral descriptor features in order to better characterize stress and anxiety under ambulatory and “in-the-wild” conditions. Experiments with two public datasets show that the proposed features not only perform as well as or better than benchmark HRV features, but that they exhibit complementary insights that further improve accuracy when fused together.
The remainder of this paper is organized as follows: Section 2 presents the materials and methods where the databases, pre-processing, feature extraction, classification pipelines, and figures-of-merit used are described. Section 3 presents the obtained results and Section 4 discusses the top features and compares the results with previous work. Finally, Section 5 presents the Conclusions.
2 Materials and Methods
2.1 Databases Used
Here, two datasets collected in ambulant and “in-the-wild” settings were used to assess the effectiveness of the proposed features. They are described in further detail in the subsections to follow.
2.1.1 Physical Activity and StresS Database
The Physical Activity and StresS (PASS) database (Parent et al., 2020) includes multimodal physiological signals from 48 participants while they performed stress inducing tasks in ambulatory conditions. Participants consented to participate in the study, which received ethical board approval from the affiliated institutions. The physical activity was modulated at three different levels using a stationary bike. More specifically, in the “no physical activity” state, participants sat on the bike without pedaling, whereas in the “medium” and “high physical activity” states they were told to maintain speeds of 50 and 70 rpm, respectively. Stress levels, in turn, were modulated by two different videogames.
For low stress condition, the subjects played the game Timeframe, a first-person game centred on exploration and collection of artifacts in an abandoned city. It is designed to be a peaceful, relaxing experience with a bright environment and calming music. The players cannot die in the game. Additionally, participants were told that the number of artifacts collected would not matter, further reducing any stress-inducing factors. Play sessions were divided in three segments. There were no differences in these segments, except that participants were instructed to not seek the same artifacts as before to avoid repeating the same gameplay.
For the high stress condition, on the other hand, subjects played the game Outlast, a first-person horror game where players have to survive while navigating an eerie asylum and evade being attacked by its scary inmates. Players in this game can have the options of avoiding, escaping and hiding from the attackers with no option for fighting back. This made individuals’ skills less relevant for the experiment. It is also deterministic and features a linear story, increasing the similitude of experience between participants. To further increase the stressful state, the game was played with dimmed lights. Similar to Timeframe, the play sessions were divided into three predetermined segments selected from the game. Both games were played with a Xbox One controller.
All participants completed six conditions (2 × 3) including the combination of two stress levels (low/high) and three physical activity levels (no, medium, and high) in 10-min counterbalanced sessions with 5 min breaks. All conditions for same game were performed in sequence. This was done to avoid constant swing between calm and stressful psychological states. At the end of each session, subjects rated their stress level [on a 21-point Likert scale (Joshi et al., 2015)].
ECG (250 Hz) was collected using an off-the-shelf Bioharness 3 (BH3, Zephyr, United States) chest strap. Other physiological signals were also collected. These include breathing, EEG, and PPG, to name a few. Signal acquisition was done using the open-source MuSAE Lab EEG Server (MuLES) (Cassani et al., 2015), which was also used to send triggers marking the beginning and end of trials. For this paper, the raw ECG data collected using BH3 was used for our analysis. For more information about the database, the interested reader can refer to (Parent et al., 2020).
2.1.2 Tracking IndividuaL performancE with Sensors Database
The TILES (Tracking IndividuaL performancE with Sensors) dataset was collected from 212 participants (66 male, 146 female; age 38.6 ± 9.8 years) from a pool of employees of the University of Southern California Keck Hospital. Two-thirds of the participants were nurses while one-third were hospital staff. Data was collected for a continuous duration of 10 weeks. Participants consented to participate in the study, which received ethical board approval from the affiliated institutions. Complete details about this publicly available dataset can be found in (Mundnich et al., 2020).
Participants carried out their work day as usual but were asked to fill a brief phone-based daily survey that included information on levels of anxiety and stress on a 5-point scale [visual analog scale (Williams et al., 2010)]. Participants were outfitted with multiple wearable sensors to collect a variety of biometric data, including audio features, heart rate, respiratory rate, and sleep quality. More specifically, a custom audiometric badge, a Fitbit Charge 2, and an OMsignal smartshirt were used. In this paper, only the cardiac information and signal quality (called RRPeakCoverage) measured by the OMsignal smartshirt are used. Since not all participants wore the smartshirt, the analysis herein relies on data from a subset of 199 participants. The OMsignal shirt stores the RR interval information measured by QRS-peak detection of the ECG signal. A total of four RR intervals can be recorded within each second. The RRPeakCoverage provides an estimate of the percentage of correct (as detected by the shirt’s internal algorithm) RR values recorded for each 5 minute interval. According to the manufacturer, RRPeakCoverage values >0.8 represent high quality recordings. The distribution of the quality metric is shown in Figure 1. As can be seen, roughly 75% of the segments were of acceptable quality.
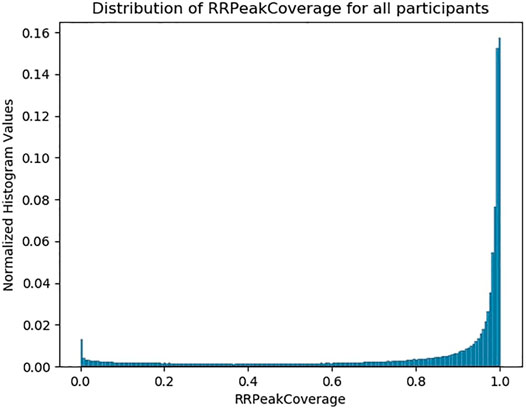
FIGURE 1. Distribution of RRPeakCoverage.
2.2 Pre-processing
For the PASS dataset, the raw ECG signal collected from the BH3 and sampled at 250 Hz was used to assess the HRV. The signal was first cleaned using the 5–25 Hz bandpass filter. This was followed by QRS-complex detection which was done using an energy based QRS detector (Behar et al., 2018) to create the RR time series. The method first differentiates the signal followed by squaring to amplify the QRS peak. Then, it applies adaptive thresholds to detect the peaks of the filtered signal. Once the QRS peaks are detected, the RR series is created from the time difference between consecutive peaks. As artifacts (e.g., muscle artifacts, electrode movement, ectopic beats) can cause errors in the RR series, an additional filter to remove RR outliers was used. This filter was based on the following criteria: i) psychological range based removal of RR segments with only RR values in the range of (<400 ms and <1200 ms) are kept, ii) moving average based filtering, and iii) quotient based filtering, based on relative change in RR value from the next. In turn, for the TILES dataset, the smart-shirt directly provides RR values. A maximum of four RR intervals are detected by the smart-shirt per second. The RR series is reconstructed from the provided RR values and passed through the RR outlier filter described above.
2.3 Feature Extraction
After pre-processing, the following features are extracted:
2.3.1 Benchmark Heart Rate Variability Features
Here, commonly used time- and frequency-domain features are used as benchmark (Camm, 1996) and are listed in Table 1. These features describe the SNS and PNS system response and have been widely used for stress and anxiety prediction in the past (Castaldo et al., 2015; Wen et al., 2018). More details about these features can be found in (Camm, 1996; Shaffer and Ginsberg, 2017).
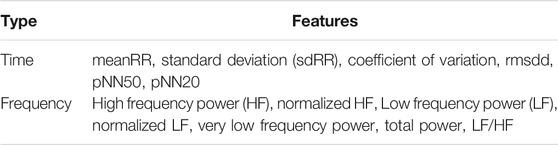
TABLE 1. Benchmark HRV features extracted.
2.3.2 Non-linear (RR Complexity) Features
The RR series exhibits complex non-linear behavior. This behavior has been observed to change based on different physical and psychological conditions (Sassi et al., 2015). Non-linearity in the RR time series has been quantified using different measures, including entropy, fractal, and chaotic/dynamical system measures. The ANS adapts the heart rate based on the current demands of the body and this adaptation process occurs continuously, thus leading to irregularity in the RR series.
This irregularity can be quantified using sample and permutation entropy measures:
i) Sample Entropy (SE) is the negative natural logarithm of an estimate of the conditional probability that if two sets of vectors (Xm(i) and Xm(j)) of length m have a distance < r, then two sets of vectors (Xm+1(i) and Xm+1(j)) of length m + 1 also have a distance < r, based on some distance metric dm(X, Y). The value of m = 2 and r = 0.2 ∗ std, where, std is the standard deviation of the time series, were used for SE calculation. SE has shown to be an important predictor of various mental states such as stress (Castaldo et al., 2015) and anxiety (Dimitriev et al., 2016), as well as mental fatigue (Wang et al., 2018).
ii) Permutation Entropy (PE) quantifies the occurrence of motifs in the series. Motifs are defined as recurring patterns in the time series with a degree η and lag λ. Based on the rank ordering of the motif pattern we assign it a specific symbol j. PE is more robust to outliers in the time series, as it removes the amplitude information from the signal (Zanin et al., 2012). Additionally, PE also holds advantage over the traditionally used Shannon entropy measure (computed over distribution of data) as it takes into account the time ordering of the series (Zanin et al., 2012). PE of RR series has been previously used for prediction of different emotional states (Xia et al., 2018).
Moreover, the RR series complexity can be quantified using fractal measures. The concept of fractals comes from geometry and is used to quantify objects which are too irregular for traditional geometrical descriptions and also exhibit some self-similar behavior i.e., they look similar at different scales. Temporal processes are said to exhibit fractal behavior when the fluctuations in time series at smaller and larger scales are statistically equivalent. Such signals are characterised by various properties, including power law spectral density with the slope (α) for the 1/f behavior representing the scaling factor. These fractal properties can also be studied with phase space reconstruction and quantifying the phase trajectory of the non-linear systems (Nayak et al., 2018).
The following measures have been widely used to quantify fractal behaviors in time series:
i) Detrend fluctuation analysis (DFA) quantifies fractal-like correlation properties of the time series data. The root mean square fluctuations of the integrated and detrended data are measured within the observation windows of various sizes and then plotted against the size of the window on a log—log scale. The scaling exponent represents the slope of this line. It has been used for stress prediction (Castaldo et al., 2015).
ii) Lyapunov exponent (LE): The behavior of dynamical systems can be studied as an evolution of phase space trajectory. The trajectories can either diverge or converge from the initial state of the system representing increasing chaotic behavior or predictability. The Lyapunov exponent is an estimate of the duration for which the dynamical system behaves predictably before it becomes chaotic. The largest Lyapunov exponents usually govern the overall behavior of the system and can be predicted using phase space reconstruction for time series (Rosenstein et al., 1993). It has previously been used to predict anxiety (Dimitriev et al., 2016).
iii) Correlation dimension: An attractor is defined as a region of the phase space describing the steady state of the system where various initial states of the system converge to. A chaotic (also called strange) attractor is fractal in nature and its fractal dimension is an estimate of the complexity of the system. The correlation dimension (CorrDim) (Grassberger and Procaccia, 1983) is used a describe the fractal geometry of a chaotic attractor and signifies the number of independent variables required to describe a dynamical system. It has been used previously for mental workload prediction (Delliaux et al., 2019).
These non-linear approaches have been used in the literature to estimate stress (Castaldo et al., 2015), mental workload (Delliaux et al., 2019) and anxiety (Dimitriev et al., 2016). Here, these non-linear features have been extracted using the NOnLinear measures for Dynamical Systems (NOLDS) toolbox (Schölzel, 2019).
2.3.3 Proposed Features
The proposed feature set can be divided into two sets: subband-complexity based and subband spectral descriptors based. The subband-complexity features require a separation of the LF and HF time series. This was done by creating the tachogram series (sampled at 4 Hz) from the non-uniformly sampled RR series. Next, two band-pass filters in the range 0.04–0.15 and 0.15–0.4 Hz were used to separate the LF and HF components of the tachogram, hence generating two new time series, namely rrlf and the rrhf, respectively. A representative tachogram series (top) along with rrlf (middle) and the rrhf (bottom) series are shown in Figure 2. Finally, non-linear features described in Section 2.3.2 are extracted from both rrlf and rrhf. Additionally, the non-linear interaction between the two series has been quantified using the transfer entropy metric (Ikegwu et al., 2020). Transfer entropy (TE) is a time-asymmetric measure of amount of directed transfer of information between two time series X and Y. TE quantifies the reduction in uncertainty about Xt from knowing Yt−k after considering the reduction in uncertainty about Xt from knowing Xt−k. Where, k is a lag period and t is the current time period. Therefore, it can be expressed as the difference between two conditional mutual information computations:
Here, I(.|.) represents the lagged mutual information between probability distributions. We used the kraskov (Kraskov et al., 2004) estimator which makes use of k-nearest neighbors for TE estimation. This metric has been previously shown to be useful in the prediction of congestive heart failure (Luo et al., 2018) and obstructive sleep apnea (Zheng et al., 2017). As it is an asymmetric measure, information transfer for both LF to HF (TE-LF-HF) and HF to LF (TE-HF-LF) were calculated using the PyIF toolbox (Ikegwu et al., 2020).

FIGURE 2. RR tachogram series (A) and the band-filtered LF (B) and HF (C) series.
Next, to calculate the subband-spectral descriptor features, the FFT of the tachogram is first calculated and the power spectral density of the LF and HF frequency components were extracted. Several spectral descriptors were then calculated for each region. The spectral descriptors include:
i) Centroid—calculated as the frequency-weighted sum of power normalized by the unweighted sum of power, i.e.:
The centroid represents the “center of gravity” of the spectrum and might be different from the maximum spectral peak.
ii) Spread—the standard deviation around the spectral centroid, given by:
The spread represents the instantaneous bandwidth of the spectrum.
iii) Skewness—calculated from the third order moment by:
The skewness is a measure of the symmetry around the centroid of the spectral band.
iv) Kurtosis—computed from the fourth order movement by:
The kurtosis measures the flatness, or non-Gaussianity, of the spectrum around its centroid.
v) Crest—measures the ratio of the maximum of the spectrum to the mean of the spectrum, i.e.:
Crest is a measure of the peakedness of the spectrum.
vi) Spectral entropy—calculated as:
where b1 and b2 represent the range of the relevant frequency bands. fk represents the frequency in Hz for bin k and pk represents the spectral power for that bin. Spectral entropy is the measure of uniformity of the spectrum.
For the PASS database, all features are computed using 240-s windows with a 120 s overlap for each session. Overall, 42 HRV features [13 benchmark, 5 non-linear, 24 proposed (12 band spectral and 12 band complexity)] are available for analysis. In turn, for the TILES database, due to the presence of long duration physiological time series, the features were first extracted over non-overlapping 5-min windows for each day to account for short-term HRV variability, as done in (Tiwari et al., 2019a; Tiwari et al., 2019b). As the data may be noisy in certain windows, features were only extracted for windows where the RRPeakCoverage quality metric is >0.3. The value was chosen empirically to ensure at least 1.5 min (0.3 × 5 min) of RR information is available to allow for ultra-short-term HRV measures to be extracted. Such measures have been shown to be reliable surrogates for short-term HRV measures for stress prediction (Pecchia et al., 2018).
Following this, features were aggregated over an entire day using the following 11 statistics: mean, standard deviation, coefficient of variation, median, min, max, range, 1st and 3rd quartile, skewness and kurtosis. Additionally, the RRPeakCoverage was used to create three new quality-aware statistics, including quality weighted mean, standard deviation, and coefficient of variation. Overall, because 14 statistics were calculated over each feature, we have a total of 588 [182 benchmark, 70 non-linear, 336 proposed (168 band spectral and 168 band complexity)] features available for analysis.
2.4 Classification and Figures-Of-Merit
Binary classification was performed for both stress and anxiety assessment. For the PASS database, the ground truth of the games was used as the stress label. As such, the experimental sessions with the Timeframe game have been labelled as low stress, while sessions with the Outlast game have been labelled as high stress. For the TILES database, in turn, a global threshold was used to binarize the stress and anxiety ratings. As a result, a threshold of 1.8 and 1.5 were used for stress and anxiety ratings, respectively. More specifically, a rating lower than the threshold value is labelled as low stress/anxiety while a value greater than the threshold is labelled as high stress/anxiety. For evaluation, a five-fold cross validation setup was used. To explore the generalization performance, the above mentioned procedure is repeated 10 times with different random seeds. This leads to 50 (5-folds times 10 repetitions with different random seeds) training/test sets; classification results reported are the average and standard deviation over the 50 runs. To assess feature importance, we use feature selection and look at the features which rank in the top set more than 70% of the 50 trial runs.
As both dataset labels are imbalanced (54% high stress labels in the PASS dataset; 58% high stress labels and 43% high stress labels for anxiety in the TILES dataset), a support vector machine (SVM) classifier with a radial basis function (RBF) kernel and a “balanced” class weight was used. SVM is a maximum margin classifier that uses training samples to maximise the width of the gap between the two categories. The “balanced” mode uses the values of the labels to automatically adjust weights inversely proportional to class frequencies in the input training data; such procedure is generally recommended for imbalanced datasets (Pedregosa et al., 2011). As we are only interested in assessing the improvements in performance due to proposed features, no hyper-parameter tuning was performed on the classifier and the default values, as provided by the sci-kit learn toolbox (Pedregosa et al., 2011), were used for the classifier. These lead to a C value of 1 and a γ value of 1/(nf × variance of training dataset), where nf is the number of features.
Additionally, balanced accuracy (BACC), F1-score (F1), and Matthews correlation coefficient (MCC) were used as figures-of-merit. These are metrics known to be robust to class imbalances. More specifically, BACC is defined as the average of class-wise accuracy (recall) of both positive and negative classes and is less sensitive to data imbalance (García et al., 2009). Additionally, MCC takes into account all four values in the confusion matrix and has shown to be more robust to data imbalances when compared to F1 and accuracy (Chicco and Jurman, 2020). The MCC value ranges between −1 and 1, with 1 representing perfect prediction, 0 representing random prediction, and −1 indicating inverse prediction.
To assess feature importance, recursive feature elimination was performed using the Extra Trees Classifier (Geurts et al., 2006). Given an external estimator that assigns weights to features (an Extra Trees Classifier in this case), the least important features are pruned from the current set of features. The procedure is recursively repeated on the pruned set until the desired number of features to be selected is reached. This technique considers the interaction of features with the learning algorithm to give the optimal subset of features. The feature selection is used to select the top 13 features (equal to the number of benchmark HRV features) for the PASS database and the top 100 features for the TILES database for each fold of the cross-validation set. Due to aggregation, the number of features increases by a factor of 14 (number of statistics). In the past, the top 100 features have been used for this dataset, thus the same value is used here to guard against over-fitting (Tiwari et al., 2019b). The implementation of the classifier and feature selection algorithms was done using the sci-kit learn toolbox (Pedregosa et al., 2011).
3 Results
In this section, we describe the results obtained with the benchmark, proposed, and combined features sets for both datasets. For the PASS database, stress was evaluated across all physical activity conditions. Stress classification performance for the PASS and TILES datasets are shown in the top parts of Table 2 and Table 3, respectively. Anxiety classification performance for the TILES dataset, in turn, is available in the top part of Table 4. The first two rows present the results for the benchmark features, whereas the proposed features are given in rows 3 and 4. The next six rows represent the fusion of different features sets. In particular, “Band-All” corresponds to the fusion of band -spectral and complexity features, “Fuse-Complexity” to fusion of benchmark set with band-complexity features, “Fuse spectral” to fusion of benchmark set with band-spectral features, “Fuse RR-Complexity” to fusion of benchmark set with RR complexity features, “Fuse-Band-All” to fusion of benchmark set with “Band-All” features, and “Fuse-All” to the fusion of all extracted features sets. Features highlighted in bold in each Table show the best performing feature set (based on MCC value). Significance testing between all new feature sets were performed against the benchmark set (p < 0.05/9), as well as the RR complexity (p < 0.05/8) test, using a t-test with bonferroni correction. The features that showed significant improvement are highlighted by an “∗” and a “†” in the table, respectively. All of the performances, including the benchmarks, were also compared against a random voting classifier by calculating the significance (p < 0.01) using the t-test. All feature sets across various databases and constructs performed significantly better than the random voting classifier.
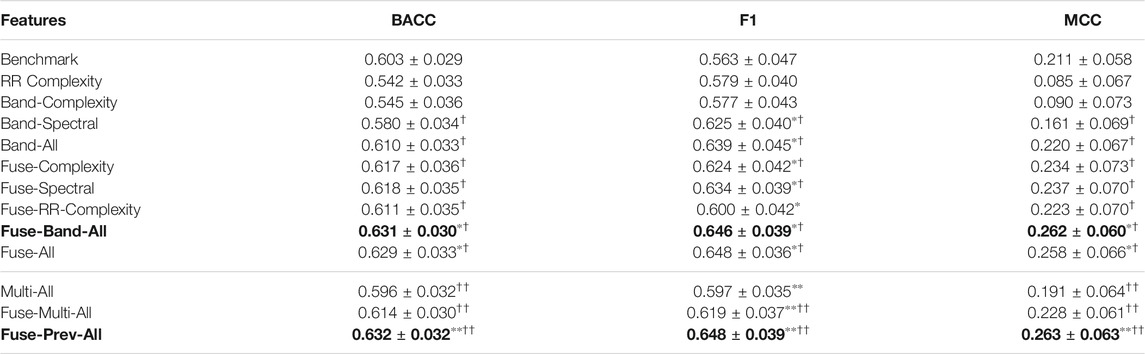
TABLE 2. Top: Performance comparison for stress (PASS) (∗ = significantly better (p < 0.05/9) than Benchmark, † = significantly better (p < 0.05/8) than RR Complexity, with bonferroni corrections), Bottom: Comparison with previously proposed multi-scale features (see Section 4.2) (∗∗ = significantly better (p < 0.05/3) than Benchmark, †† = significantly better (p < 0.05/3) than RR Complexity, with bonferroni corrections). The bold values represent the best performing feature set (according to MCC).

TABLE 3. Top: Performance comparison for stress (TILES) (∗ = significantly better (p < 0.05/9) than Benchmark, † = significantly better (p < 0.05/8) than RR Complexity, with bonferroni corrections), Bottom: Comparison with previously proposed multi-scale features (see Section 4.2) (∗∗ = significantly better (p < 0.05/3) than Benchmark, †† = significantly better (p < 0.05/3) than RR Complexity, with bonferroni corrections). The bold values represent the best performing feature set (according to MCC).
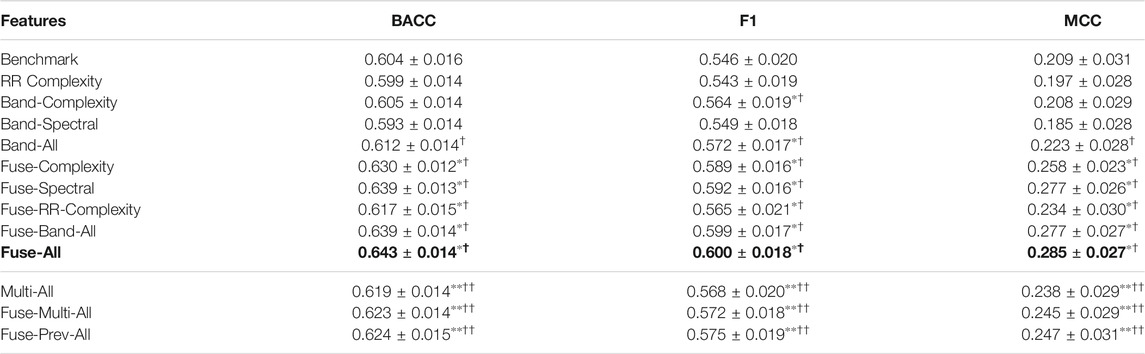
TABLE 4. Top: Performance comparison for anxiety (TILES) (∗ = significantly better (p < 0.05/9) than Benchmark, † = significantly better (p < 0.05/8) than RR Complexity, with bonferroni corrections), Bottom: Comparison with previously proposed multi-scale features (see Section 4.2) (∗∗ = significantly better (p < 0.05/3) than Benchmark, †† = significantly better (p < 0.05/3) than RR Complexity, with bonferroni corrections). The bold values represent the best performing feature set (according to MCC).
As can be seen, for the stress prediction on the PASS dataset, the best performance is achieved by the fusion of the benchmark features with the proposed band-complexity and spectral descriptor features (Fuse-Band-All) with significant improvements (p < 0.05/9) of 4.64% in BACC, 14.7% in F1, and 24.2% in MCC over the benchmark feature set alone. This feature set combination also shows a significant improvement (p < 0.05) of 3.27% in BACC, 7.66% in F1, and 14.88% in MCC over the fusion of benchmark set with commonly used RR complexity features (Fuse-RR-Complexity) when compared using a t-test. Without feature fusion with the benchmark set, the combination of band-complexity and band descriptor features performs similarly to the benchmark set in terms of BACC and MCC with a significant improvement (p < 0.05/9) of 13.5% in F1. We also observe that while these features do not perform as well as the benchmark individually, however fusion of the two (Band-All) feature sets leads to comparable performance with the benchmark feature set, thus showing complementarity between the two proposed feature sets. Finally, compared to the RR complexity features, the combination of the proposed features showed a significant improvement (p < 0.05/8) of 12.5% in BACC, 10.3% in F1 and 158% in MCC.
In turn, for the TILES dataset, for stress prediction, the best performance is achieved with the fusion of all the feature sets (Fuse-All) with a significant improvement (p < 0.05/9) of 6.13% in BACC, 5.5% in F1 and 31.6% in MCC over the benchmark feature set alone. This performance is comparable to the performance of fusion of benchmark with the proposed features, as well as fusion of the benchmark with only band spectral features. Individually, the benchmark, RR complexity, and proposed features perform comparable to one another, thus further suggesting the complementarity between them.
Lastly, for anxiety prediction, the best performance is again achieved by the combination of all feature sets with significant improvements (p < 0.05/9) of 6.45% in BACC, 9.89% in F1, and 36.4% in MCC over the benchmark feature set alone. Additionally, the fusion of benchmark with the proposed features shows a significant improvement (p < 0.05) of 3.56% in BACC, 6.02% in F1 and 17.9% in MCC compared to the combination of benchmark with RR complexity features using a t-test. Individually, the proposed features perform comparably to the benchmark and RR complexity feature sets in terms of BACC and MCC with significant improvements (p < 0.05/9 and p < 0.05/8) of 4.76% and 5.34% in F1 over benchmark and RR complexity features, respectively.
Overall, across both the datasets and mental states, both band-complexity and spectral descriptor features show complementary behaviour not only with each other, but also with existing benchmark features. These findings suggest that future studies could rely on these feature set combinations for improved accuracy and robustness.
4 Discussion
In this section we discuss the top-features found and their physiological correlates. Additionally, we compare the results with previous work.
4.1 Feature Ranking
Feature importance was computed based on the outcomes of feature selection across the five cross validation steps, repeated 10 times. The top-13 and top-100 features were selected for every fold for the PASS and TILES databases, respectively. As such, the frequency of occurrence of a given feature in the top feature set was calculated over the 50 iterations. Features appearing more than 70% were further ranked according to their frequency of occurrence (freq) for the best performing feature set for the PASS datasets. For the TILES dataset, due to the added statistics calculated on top of the daily feature series, the top 70% features were first separated from their corresponding statistics and feature frequencies for same features with different statistics were aggregated and renormalized. Additionally, the frequency of statistics across the top features were also noted. For stress classification on the PASS dataset, an additional post-hoc significance testing was performed on the top feature sets. First, the Shapiro-Wilk test of normality (p < 0.05) was performed on the distribution of the features. For normally distributed data, ANOVA test was used to test significance, while for a non-normal distributions, the Kruskal-Wallis (KW) test was used. The top features for stress, their frequency of occurrence, the type of significance test used as well as the significance level for the PASS dataset are shown in Table 5. Such an analysis cannot be performed for the top features from the TILES dataset, as multiple statistics from the top feature set are in the top selected features, thus greatly increasing the number of possible combinations to be tested. Table 6 shows the top features for stress and anxiety for the TILES dataset along with the most commonly used functional.
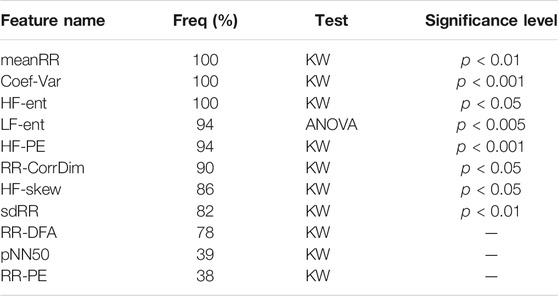
TABLE 5. Top features for stress (PASS) (- represents no significance).
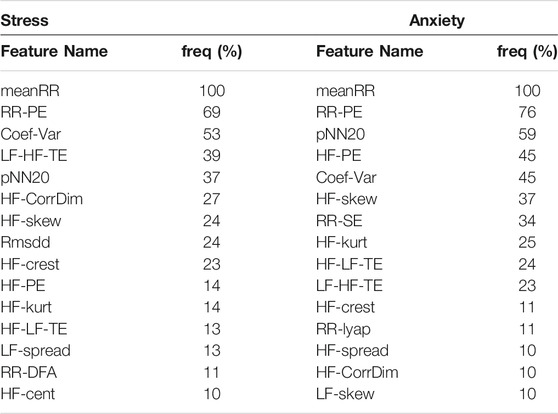
TABLE 6. Top features for stress and anxiety (TILES).
For the PASS database, overall, 4 of the 11 features are from the proposed feature set with three features from the HF band (2 spectral and 1 complexity) while one from the LF band (spectral). From the commonly used complexity features, we observe DFA, PE and CorrDim in the top features. Of the top 5 features, 3 are from the proposed feature set. The HF spectral entropy (HF-ent) appears as a top ranked feature along with meanRR and coefficient of variation.
An in-depth analysis on the effects of physical activity on HF-ent showed an increase with increasing physical activity level. This can be explained by the effects of respiration on the HF band, termed respiratory sinus arrhythmia (RSA) (Shaffer and Ginsberg, 2017). Typically, RSA is one of the major factors influencing HF power, hence an increased respiration rate due to physical activity can move the RSA component to a higher frequency range even outside the HF band range for very high respiration rates (Schipke et al., 1999). This shift in RSA is reflected in the increased spectral entropy value with increasing physical activity levels. Similarly, mental stress can also increase respiration rate (Masaoka and Homma, 1997), thus leading to increase in spectral entropy of the HF band. Indeed, further investigation showed an increase in the spectral entropy of the HF band with increased mental stress.
This shift in RSA to a higher frequency range can further explain the observed increase in the skewness of the HF spectrum (HF-skew), which also appeared as a top feature. In turn, the spectral entropy of the LF band (LF-ent) also showed a similar increase with mental stress, likely due to sympathetic activation caused by stress leading to more overall spectral activity in this region (Castaldo et al., 2015). We also observe a decrease in PE of the rrhf (HF-PE) time series with increased mental stress. This might be caused by the combined effects of the RSA component shifting towards higher frequencies due to physical activity, as well as parasympathetic withdrawal caused by both physical activity and stress reducing complexity series. (Tulppo et al., 2001; Castaldo et al., 2015; Dimitriev et al., 2016).
A decrease in meanRR and pNN50 have been shown to be indicators of increased SNS modulation (Camm, 1996), reduction of PNS activity (Shaffer and Ginsberg, 2017), and have been reported with increased stress levels (Castaldo et al., 2015). Additionally, changes in both DFA and CorrDim have been linked to stress (Castaldo et al., 2015; Brugnera et al., 2018). Moreover, a decline in HF power has generally been linked to negative emotions (Shaffer and Ginsberg, 2017), which explains the occurrence of HF band-complexity and spectral descriptor features in the top feature set.
Compared to the PASS dataset, which looks at stress in the presence of physical activity for a short duration, the TILES dataset measured stress with long duration stimulus confounded by physical activity and social interaction. While physical activity shifts the RSA towards higher frequencies (Tulppo et al., 2001), speaking has been shown to shift it towards lower frequencies by lowering respiration rates (Brugnera et al., 2018). Additionally, onset of long-term mental stress (1 h) causes an initial fluctuation for the HRV parameters followed by gradual return to baseline levels for most metrics (Delliaux et al., 2019). Such fluctuations are captured by the various statistics used to aggregate the feature series over a given day.
For the TILES dataset, for stress, nine of the top 15 features are from the proposed feature set. Of the top proposed features, six of the nine features are from the HF band (2 complexity, 4 spectral), with one from the LF band (spectral) along with both the LF-to-HF the HF-to-LF transfer entropy features. Similar to the PASS dataset, the HF band features are ranked higher than the LF band features. The non-linear interaction of the LF and HF series also appears as a top features. This quantifies the complex non-linear interaction between the SNS and PNS, which are not captured by LF/HF ratio (Zheng et al., 2017; Luo et al., 2018).
Among the benchmark feature set, meanRR, pNN20 and coefficient of variation are among the top features, similar to the top PASS dataset features. Additionally, pNN50 and rmssd features, which are highly correlated to each other (Camm, 1996), appear in PASS and TILES stress features, respectively. The PE of the RR series is also among the top features and has been previously shown to distinguish emotions (Xia et al., 2018). HF-PE and HF-skew appear as a top proposed features for the stress prediction for both the PASS and TILES datasets showing robustness of these features over different datasets and experimental conditions.
The skewness of HF-PE series appears as a top feature. The distribution skews towards the right with increased stress. A higher value of skewness indicates a greater positive fluctuation of the HF-PE daily series. This type of fluctuation has been observed for long-term mental stress (Delliaux et al., 2019) measures using HRV. The minimum value of HF-skew series decreases with increased stress and is among the top features. Further, the HF-skew series distribution skews towards the left. Stressful days for nurses could be characterized by a large amount of talking and team coordination, thus moving the RSA component towards lower frequencies and skewing the spectral power distribution towards this region. Overall, median of HF-PE still shows a decrease with increasing stress consistent with the findings from the PASS dataset. However, the median was not among the top feature set showing higher importance of fluctuations in long term physiological series.
Moreover, statistics representing fluctuation (i.e., standard deviation, weighted standard deviation, and range) appear as top features for the LF-HF-TE and show an increase with stress. This could mean changing levels of LF to HF information transfer occurring on more stressful days, while the transfer of information is constant for low stress days. Stress events cause a parasympathetic withdrawal and such withdrawal could cause a change in information transfer between LF to HF region increasing the variability of the transfer entropy. The range and minimum value of the HF-CorrDim series also show up as top features. While the range of the HF-CorrDim series increases with stress, there is a decrease in the minimum value with stress. Together, these statistics indicate a lowered HF-CorrDim due to stress. A decreased CorrDim for RR series indicates lower complexity and has been observed with an increase in stress (Castaldo et al., 2015; Delliaux et al., 2019). This is in line with the finding of lowered HF-PE values for both the TILES and PASS datasets with increasing stress.
Analyzing the top anxiety features, it can be seen that four features appear uniquely among the top features for stress. These are: rmssd, DFA of the RR series, LF-spread and HF-cent. The skewness of the HF-cent appears as a top feature and shows a shift towards the higher values with stress. The HF centroid value may shift towards higher values due to influence of physical activity on the RSA component. A stressful day could lead to higher levels of physical activity for hospital workers, thus increasing the HF centroid value. The maximum value of LF spread was a top feature and increased with the increase in spread. Sympathetic activation caused due to stress could increase the activity in the LF band leading to a higher spread value.
For anxiety prediction, the top features show a large overlap with the top stress features with 10 of the top 15 features appearing in both feature sets. This could be due to the two mental states being highly correlated, as continuously-high stress can lead to anxiety (Grillon et al., 2007). This fact is further validated by the high correlation (0.69) between stress and anxiety ratings reported by the participants. While top features for anxiety may overlap with the top stress features, different statistics may be relevant.
We observe various statistics indicating fluctuation (i.e., range, standard deviation, and weighted standard deviation) for HF-PE in the top feature set. These statistics show an increase during anxiety conditions indicating greater fluctuation of the HF-PE feature on higher anxiety days. Notably, for anxiety, the mean of the HF-PE series shows an increase in value but is not in the top feature set. Such a change is indicative of increased complexity of the rrhf and is contradictory to decrease in HF-PE with stress as observed previously. In contrast to the PASS dataset, daily mean of HF-skew series shows an overall decrease with anxiety; this could be due to the more dominant effect of speaking compared to physical activity on the RSA for higher anxiety levels.
Similar to HF-PE, standard deviation and weighted standard deviation of HF-skew appear as top features increased with increased anxiety. The minimum value of HF-skew series decreases with increased anxiety showing a greater shift of the distribution towards the left; this behavior was captured by the HF-skew top feature, thus further confirming the dominating effect of speaking on RSA with higher anxiety. The median of HF-kurt is also among the top features and shows a decrease with increased anxiety. A decrease in its value with a corresponding increase in HF-skew could indicate the predominant effect of speaking on the RSA along with a parasympathetic withdrawal caused by anxiety.
Moreover, the maximum value of the HF-CorrDim appears as a top feature showing an increase with anxiety. An increase in CorrDim value is indicative of increasing complexity of the rrhf time series. This increase is also observed as an increase in HF-PE value. Therefore, the overall indicators of increased complexity with anxiety are in contrast to decreasing complexity for stress, as suggested by the features. Similar to stress, both transfer entropy metrics appear in the top feature set for anxiety prediction. Additionally, both weighted and standard deviation show a similar increase in LF-HF-TE metric with anxiety, as observed with stress indication higher variability in transfer entropy on high anxiety days.
SE and LE of the RR series along with HF-spread and LF-skewness uniquely appear as top features in the anxiety prediction. Previously, both SE and LE have been linked to state anxiety during an academic examination setting (Dimitriev et al., 2016). LE has also been linked to high arousal states elicited using images (Valenza et al., 2012). The weighted mean of LF-skewness shows a decrease with increased anxiety indicating a shift towards the center of the distribution. This could be indicative of more slower LF components (around 0.015 Hz) becoming relevant with sympathetic activation caused by anxiety.
No frequency domain features appear in the top feature set for either the PASS or TILES datasets for stress and anxiety. This could be due to the power spectral features being less robust to missing RR intervals (Kim et al., 2009). On the other hand, the proposed features derived from spectral descriptors and complexity were among the top features, showing both the usefulness and robustness of these features to noise and confounding factors. These findings further point to the importance of subband HRV information for stress and anxiety monitoring.
Lastly, among the statistics used for aggregation, quality-weighted mean and standard deviation were among the most commonly used statistics for both stress and anxiety in the top feature set. This shows the importance of signal quality in mental state prediction, thus corroborating the findings of (Tiwari et al., 2019b). We also observe the max and min values among the top statistics. This indicates the highest values of certain HRV metrics for a given shift is a good indicator of perceived stress for the entire shift.
4.2 Comparison With Previous Work
Previously, multi-scale permutation entropy (MPSE) and Inter-scale ordinal distance (Isod) features have been proposed for mental workload on an ambulatory dataset (Tiwari et al., 2019). The results indicated that quantifying complexity at different scales can help improve performance over benchmark features. As a result, we compared the combination of MSPE (48) as well as the Inter-scale ordinal distance (Isod) (66) features (referred to as “Multi-All”) with the proposed features for PASS and TILES dataset. Stress classification performance for the PASS and TILES datasets are shown in bottom parts of Table 2 and Table 3, respectively. Anxiety classification performance for the TILES dataset, in turn, is available in the bottom part of Table 4. Here, “Fuse-Multi-All” refers to the combination of the benchmark features with the “Multi-All” feature set, while “Fuse-Prev-All” refers to the combination of the “Fuse-All” set with the “Multi-All” set leading to the combination of all features with the previously multi-scale proposed features. Significance testing between these feature sets were performed against the benchmark set (p < 0.05/3), as well as the RR complexity (p < 0.05/3) test, using a t-test with bonferroni correction. The features that showed significant improvement are highlighted by an “∗∗” and a “(††)” in the table, respectively.
For the PASS dataset stress classification, we observe the Fuse-Prev-All gives the best performance which is comparable to the performance achieved by the Fuse-Band-All and Fuse-All feature set. The Fuse-Band-All setting significantly (p < 0.05) outperforms the fusion of multi-scale features with benchmark (Fuse-Multi-All) by 2.77% in BACC, 4.36% in F1, and 14.91% in MCC using a t-test. Individually, the Band-All feature set also significantly (p < 0.05) outperforms the Multi-All feature set by 2.34% in BACC, 7.03% in F1, and 15.2% in MCC using a t-test.
For TILES stress classification, in turn, we observe the best performance is still achieved with the fusion of benchmark and proposed feature sets (Fuse-All) with significant (p < 0.05) improvements of 2.34% in BACC, 3.6% in F1, and 10.9% in MCC over the fusion of multi-scale features with the benchmark set (Fuse-Multi-All) as observed by performing a t-test. However, individually the Multi-All feature set shows comparable performance to the Band-All features. This suggests that the proposed features have more complementarity with the benchmark set compared to the multi-scale features.
Finally, for anxiety classification performance on the TILES dataset, the best performance is still with the Fuse-All feature set with significant (p < 0.05) improvements of 2.57% in BACC, 4.72% in F1, and 13.1% in MCC over the Fuse-Multi-All feature set using a t-test. Again, as observed for stress prediction, the Band-All and Multi-All feature sets have comparable performance.
Overall, our proposed features outperform the multi-scale features individually (for the PASS dataset stress classification) and when fused with the benchmark features giving the highest overall performance. While the multi-scale features still outperform the benchmark feature set, they have several hyper-parameters namely, the scaling method, the entropy calculation method, as well as the number of scales explored. These hyper-parameters can not only impact the overall performance but also add to the number of features extracted. In contrast, the number of hyper-parameters for the proposed features are limited and lead to a smaller overall feature set.
4.3 Study Limitations
In this study, focus was placed on only one type of classifier—an SVM, as it has been widely used in emotion recognition studies (Alarcao and Fonseca, 2017) and shown to provide a good trade-off between model complexity while handling non-linear data for small datasets (Bishop, 2006). Larger datasets, however, could enable the use of more complex models, such as burgeoning deep neural networks, to improve performance. Additionally, no optimization of the hyper-parameters was performed here, as the main goal of the study was to assess the importance of the proposed features for the task at hand. Therefore, the results obtained herein represent a lower bound on what could be achieved. Future analyses should focus on hyper-parameter tuning to further improve performance. Moreover, in the analyses performed herein, 5-min windows were used. Such window durations do not account for long-term variability in the RR series caused by circadian rhythm, hormonal change, or overall health (Shaffer and Ginsberg, 2017). Therefore, longer windows could be explored to quantify such factors with the proposed features. Finally, only commonly-used complexity features have been explored in this work. Recently, newer methods have emerged, such as bubble entropy (Manis et al., 2017) and multi-fractal measures (Kokosińska et al., 2021); these could lead to additional insights and should be explored in the future.
5 Conclusion
In this paper, we propose novel HRV features for in-the-wild mental state monitoring applications. The features are based on separately analyzing the complexity and spectral characteristics of the HF and LF bands of the HRV tachogram. We show that these features significantly outperform benchmark HRV and commonly used non-linear inter-beat-interval complexity features for stress and anxiety monitoring. Experiments are performed on two separate datasets collected in ambulatory and in-the-wild conditions. Results show not only the proposed features outperforming conventional ones, but also exhibiting complementary behavior when fused together. Overall, between 45–64% of the top features used by the trained classifiers relied on the proposed features, thus showing their importance for mental state assessment in highly ecological settings.
Data Availability Statement
Publicly available datasets were analyzed in this study. PASS is available here: https://musaelab.ca/resources/ TILES here: https://tiles-data.isi.edu.
Author Contributions
Experimental design (AT and TF), Writing and reviewing (AT and TF), Statistical analysis and programming (AT), Funding and supervision (TF).
Funding
This research is based upon work supported by the Office of the Director of National Intelligence (ODNI), Intelligence Advanced Research Projects Activity (IARPA), via IARPA Contract No. 2017-17042800005. The views and conclusions contained herein are those of the authors and should not be interpreted as necessarily representing the official policies or endorsements, either expressed or implied, of the ODNI, IARPA, or the U.S. Government. The U.S. Government is authorized to reproduce and distribute reprints for Governmental purposes notwithstanding any copyright annotation thereon. The collection and use of the PASS dataset was facilitated by NSERC CRD grant that was used to collect PASS (No. CRDPJ 485455-15).
Conflict of Interest
The authors declare that the research was conducted in the absence of any commercial or financial relationships that could be construed as a potential conflict of interest.
Publisher’s Note
All claims expressed in this article are solely those of the authors and do not necessarily represent those of their affiliated organizations, or those of the publisher, the editors and the reviewers. Any product that may be evaluated in this article, or claim that may be made by its manufacturer, is not guaranteed or endorsed by the publisher.
Acknowledgments
The authors would like to thank NSERC and IARPA for their funding.
References
Alarcao, S. M., and Fonseca, M. J. (2017). Emotions Recognition Using Eeg Signals: A Survey. IEEE Trans. Affective Comput. 10, 374–393. doi:10.1109/TAFFC.2017.2714671
[Dataset] American Psychological Association (2020). Stress in AmericaTM 2020: A National Mental Health Crisis.
Barcellos, S., Jacobson, M., and Stone, A. A. (2021). Varied and Unexpected Changes in the Well-Being of Seniors in the united states amid the Covid-19 Pandemic. Plos one 16, e0252962. doi:10.1371/journal.pone.0252962
Behar, J. A., Rosenberg, A. A., Weiser-Bitoun, I., Shemla, O., Alexandrovich, A., Konyukhov, E., et al. (2018). PhysioZoo: A Novel Open Access Platform for Heart Rate Variability Analysis of Mammalian Electrocardiographic Data. Front. Physiol. 9, 1390. doi:10.3389/fphys.2018.01390
Brugnera, A., Zarbo, C., Tarvainen, M., Marchettini, P., Adorni, R., and Compare, A. (2018). Heart Rate Variability during Acute Psychosocial Stress: A Randomized Cross-Over Trial of Verbal and Non-verbal Laboratory Stressors. Int. J. psychophysiology 127, 17–25. doi:10.1016/j.ijpsycho.2018.02.016
Camillo, C., Pitta, F., Possani, H., Barbosa, M., Marques, D., Cavalheri, V., et al. (2008). Heart Rate Variability and Disease Characteristics in Patients with COPD. Lung 186, 393–401. doi:10.1007/s00408-008-9105-7
Camm, A. (1996). Heart Rate Variability: Standards of Measurement, Physiological Interpretation and Clinical Use. Task Force of the European Society of Cardiology and the north American Society of Pacing and Electrophysiology. Circulation 93, 1043–1065.
Cassani, R., Banville, H., and Falk, T. (2015). “MuLES: An Open Source EEG Acquisition and Streaming Server for Quick and Simple Prototyping and Recording,” in Proceedings of the 20th International Conference on Intelligent User Interfaces Companion, Atlanta, Georgia, March 29–April 1, 2015, 9–12.
Castaldo, R., Melillo, P., Bracale, U., Caserta, M., Triassi, M., and Pecchia, L. (2015). Acute Mental Stress Assessment via Short Term HRV Analysis in Healthy Adults: A Systematic Review with Meta-Analysis. Biomed. Signal Process. Control. 18, 370–377. doi:10.1016/j.bspc.2015.02.012
Chandola, T., Heraclides, A., and Kumari, M. (2010). Psychophysiological Biomarkers of Workplace Stressors. Neurosci. Biobehavioral Rev. 35, 51–57. doi:10.1016/j.neubiorev.2009.11.005
Charles, R., and Nixon, J. (2019). Measuring Mental Workload Using Physiological Measures: A Systematic Review. Appl. Ergon. 74, 221–232. doi:10.1016/j.apergo.2018.08.028
Chen, F., Zheng, D., Liu, J., Gong, Y., Guan, Z., and Lou, D. (2020). “Depression and Anxiety Among Adolescents during COVID-19: A Cross-Sectional Study,” in Brain, Behavior, and Immunity. Guizhou, China: Elsevier. doi:10.1016/j.bbi.2020.05.061
Chicco, D., and Jurman, G. (2020). The Advantages of the matthews Correlation Coefficient (MCC) over F1 Score and Accuracy in Binary Classification Evaluation. BMC genomics 21, 6. doi:10.1186/s12864-019-6413-7
Choi, E., Hui, B., and Wan, E. (2020). Depression and Anxiety in Hong Kong during COVID-19. Int. J. Environ. Res. Public Health 17, 3740. doi:10.3390/ijerph17103740
Delliaux, S., Delaforge, A., Deharo, J., and Chaumet, G. (2019). Mental Workload Alters Heart Rate Variability, Lowering Non-linear Dynamics. Front. Physiol. 10, 565. doi:10.3389/fphys.2019.00565
Dimitriev, D., Saperova, E., and Dimitriev, A. (2016). State Anxiety and Nonlinear Dynamics of Heart Rate Variability in Students. PloS one 11, e0146131. doi:10.1371/journal.pone.0146131
Donoghue, T., Haller, M., Peterson, E., Varma, P., Sebastian, P., Gao, R., et al. (2020). Parameterizing Neural Power Spectra into Periodic and Aperiodic Components. Nat. Neurosci. 23, 1655–1665. doi:10.1038/s41593-020-00744-x
Doran, C. M., and Kinchin, I. (2019). A Review of the Economic Impact of Mental Illness. Aust. Health Rev. 43, 43–48. doi:10.1071/ah16115
Dozois, D. (2020). “Anxiety and Depression in Canada during the COVID-19 Pandemic: A National Survey,” in Canadian Psychology/Psychologie Canadienne. London, Ontario: APA PsycNet.
Eisele, G., Vachon, H., Lafit, G., Kuppens, P., Houben, M., Myin-Germeys, I., et al. (2020). The Effects of Sampling Frequency and Questionnaire Length on Perceived burden, Compliance, and Careless Responding in Experience Sampling Data in a Student Population. Assessment, 1073191120957102. doi:10.1177/1073191120957102
Francis, D., Willson, K., Georgiadou, P., Wensel, R., Davies, L., Coats, A., et al. (2002). Physiological Basis of Fractal Complexity Properties of Heart Rate Variability in Man. J. Physiol. 542, 619–629. doi:10.1113/jphysiol.2001.013389
García, V., Mollineda, R. A., and Sánchez, J. S. (2009). “Index of Balanced Accuracy: A Performance Measure for Skewed Class Distributions,” in Iberian conference on pattern recognition and image analysis, Póvoa de Varzim, Portugal, June 10–12, 2009 (Springer), 441–448. doi:10.1007/978-3-642-02172-5_57
Geurts, P., Ernst, D., and Wehenkel, L. (2006). Extremely Randomized Trees. Machine Learn. 63, 3–42. doi:10.1007/s10994-006-6226-1
Goldberger, A. L., Amaral, L. A., Hausdorff, J. M., Ivanov, P. C., Peng, C.-K., and Stanley, H. E. (2002). Fractal Dynamics in Physiology: Alterations with Disease and Aging. Proc. Natl. Acad. Sci. 99, 2466–2472. doi:10.1073/pnas.012579499
Grassberger, P., and Procaccia, I. (1983). Characterization of Strange Attractors. Phys. Rev. Lett. 50, 346. doi:10.1103/physrevlett.50.346
Grillon, C., Duncko, R., Covington, M., Kopperman, L., and Kling, M. (2007). Acute Stress Potentiates Anxiety in Humans. Biol. Psychiatry 62, 1183–1186. doi:10.1016/j.biopsych.2007.06.007
Humeau-Heurtier, A. (2015). The Multiscale Entropy Algorithm and its Variants: A Review. Entropy 17, 3110–3123. doi:10.3390/e17053110
Hyland, P., Shevlin, M., McBride, O., Murphy, J., Karatzias, T., Bentall, R., et al. (2020). Anxiety and Depression in the Republic of Ireland during the COVID-19 Pandemic. Acta Psychiatrica Scand. 142, 249–256. doi:10.1111/acps.13219
Ikegwu, K., Trauger, J., McMullin, J., and Brunner, R. (2020). “PyIF: A Fast and Light Weight Implementation to Estimate Bivariate Transfer Entropy for Big Data,” in 2020 SoutheastCon (IEEE), 1–6. (Urbana, IL: IEEE). doi:10.1109/southeastcon44009.2020.9249650
Immink, M., Cross, Z., Chatburn, A., Baumeister, J., Schlesewsky, M., and Bornkessel-Schlesewsky, I. (2021). Resting-state Aperiodic Neural Dynamics Predict Individual Differences in Visuomotor Performance and Learning (Adelaide: Elsevier (Human Movement Science)). bioRxiv.
İşler, Y., and Kuntalp, M. (2007). Combining Classical HRV Indices with Wavelet Entropy Measures Improves to Performance in Diagnosing Congestive Heart Failure. Comput. Biol. Med. 37, 1502–1510. doi:10.1016/j.compbiomed.2007.01.012
Joshi, A., Kale, S., Chandel, S., and Pal, D. K. (2015). Likert Scale: Explored and Explained. Br. J. Appl. Sci. Techn. 7, 396. doi:10.9734/bjast/2015/14975
Kannampallil, T., Goss, C., Evanoff, B., Strickland, J., McAlister, R., and Duncan, J. (2020). Exposure to COVID-19 Patients Increases Physician Trainee Stress and Burnout. PloS one 15, e0237301. doi:10.1371/journal.pone.0237301
Kim, K., Kim, J., Lim, Y., and Park, K. (2009). The Effect of Missing RR-Interval Data on Heart Rate Variability Analysis in the Frequency Domain. Physiol. Meas. 30, 1039. doi:10.1088/0967-3334/30/10/005
Kokosińska, D., Żebrowski, J. J., Buchner, T., Baranowski, R., and Orłowska-Baranowska, E. (2021). Asymmetric Multiscale Multifractal Analysis (Amma) of Heart Rate Variability. Physiol. Meas. 42. doi:10.1088/1361-6579/ac184c
Kraskov, A., Stögbauer, H., and Grassberger, P. (2004). Estimating Mutual Information. Phys. Rev. E 69, 066138. doi:10.1103/PhysRevE.69.066138
Lackner, H., Papousek, I., Batzel, J., Roessler, A., Scharfetter, H., and Szalkay, H. (2011). Phase Synchronization of Hemodynamic Variables and Respiration during Mental challenge. Int. J. psychophysiology 79, 401–409. doi:10.1016/j.ijpsycho.2011.01.001
Luo, D., Pan, W., Li, Y., Feng, K., and Liu, G. (2018). The Interaction Analysis between the Sympathetic and Parasympathetic Systems in CHF by Using Transfer Entropy Method. Entropy 20, 795. doi:10.3390/e20100795
Manis, G., Aktaruzzaman, M., and Sassi, R. (2017). Bubble Entropy: An Entropy Almost Free of Parameters. IEEE Trans. Biomed. Eng. 64, 2711–2718. doi:10.1109/tbme.2017.2664105
Masaoka, Y., and Homma, I. (1997). Anxiety and Respiratory Patterns: Their Relationship during Mental Stress and Physical Load. Int. J. Psychophysiology 27, 153–159. doi:10.1016/s0167-8760(97)00052-4
Mor, N., and Winquist, J. (2002). Self-focused Attention and Negative Affect: A Meta-Analysis. Psychol. Bull. 128, 638. doi:10.1037/0033-2909.128.4.638
Mundnich, K., Booth, B., l’Hommedieu, M., Feng, T., Girault, B., L’Hommedieu, J., et al. (2020). TILES-2018: A Longitudinal Physiologic and Behavioral Data Set of Hospital Workers. arXiv preprint arXiv:2003.08474.
Nayak, S., Bit, A., Dey, A., Mohapatra, B., and Pal, K. (2018). A Review on the Nonlinear Dynamical System Analysis of Electrocardiogram Signal. J. Healthc. Eng. 2018, 6920420. doi:10.1155/2018/6920420
Parent, M., Albuquerque, I., Tiwari, A., Cassani, R., Gagnon, J., Lafond, D., et al. (2020). PASS: A Multimodal Database of Physical Activity and Stress for mobile Passive Body/brain-Computer Interface Research. Front. Neurosci. 14, 1274. doi:10.3389/fnins.2020.542934
Peake, J., Kerr, G., and Sullivan, J. (2018). A Critical Review of Consumer Wearables, mobile Applications, and Equipment for Providing Biofeedback, Monitoring Stress, and Sleep in Physically Active Populations. Front. Physiol. 9, 743. doi:10.3389/fphys.2018.00743
Pecchia, L., Castaldo, R., Montesinos, L., and Melillo, P. (2018). Are Ultra-short Heart Rate Variability Features Good Surrogates of Short-Term Ones? State-Of-The-Art Review and Recommendations. Healthc. Technol. Lett. 5, 94–100. doi:10.1049/htl.2017.0090
Pedregosa, F., Varoquaux, G., Gramfort, A., Michel, V., Thirion, B., Grisel, O., et al. (2011). Scikit-learn: Machine Learning in python. J. machine Learn. Res. 12, 2825–2830.
Peltola, M. (2012). Role of Editing of RR Intervals in the Analysis of Heart Rate Variability. Front. Physiol. 3, 148. doi:10.3389/fphys.2012.00148
Pichon, A., Bisschop, C., Roulaud, M., Denjean, A., and Papelier, Y. (2004). Spectral Analysis of Heart Rate Variability during Exercise in Trained Subjects. Med. Sci. Sports Exerc. 36, 1702–1708. doi:10.1249/01.mss.0000142403.93205.35
Pluntke, U., Gerke, S., Sridhar, A., Weiss, J., and Michel, B. (2019). “Evaluation and Classification of Physical and Psychological Stress in Firefighters Using Heart Rate Variability,” in 2019 41st Annual International Conference of the IEEE Engineering in Medicine and Biology Society (EMBC), Berlin, Germany, July 23–27, 2019 (IEEE), 2207–2212. doi:10.1109/EMBC.2019.8856596
Porta, A., Castiglioni, P., Bari, V., Bassani, T., Marchi, A., Cividjian, A., et al. (2012). K-nearest-neighbor Conditional Entropy Approach for the Assessment of the Short-Term Complexity of Cardiovascular Control. Physiol. Meas. 34, 17. doi:10.1088/0967-3334/34/1/17
Porta, A., Gnecchi-Ruscone, T., Tobaldini, E., Guzzetti, S., Furlan, R., and Montano, N. (2007). Progressive Decrease of Heart Period Variability Entropy-Based Complexity during Graded Head-Up Tilt. J. Appl. Physiol. 103, 1143–1149. doi:10.1152/japplphysiol.00293.2007
Rosenstein, M., Collins, J., and Luca, C. (1993). A Practical Method for Calculating Largest Lyapunov Exponents from Small Data Sets. Physica D: Nonlinear Phenomena 65, 117–134. doi:10.1016/0167-2789(93)90009-p
Sassi, R., Cerutti, S., Lombardi, F., Malik, M., Huikuri, H. V., Peng, C.-K., et al. (2015). Advances in Heart Rate Variability Signal Analysis: Joint Position Statement by the E-Cardiology Esc Working Group and the European Heart Rhythm Association Co-endorsed by the Asia pacific Heart Rhythm Society. Ep Europace 17, 1341–1353. doi:10.1093/europace/euv015
Schipke, J., Arnold, G., and Pelzer, M. (1999). Effect of Respiration Rate on Short-Term Heart Rate Variability. J. Clin. Basic Cardiol. 2, 92–95.
Shaffer, F., and Ginsberg, J. (2017). An Overview of Heart Rate Variability Metrics and Norms. Front. Public Health 5, 258. doi:10.3389/fpubh.2017.00258
Shao, S., Wang, T., Song, C., Chen, X., Cui, E., and Zhao, H. (2019). Obstructive Sleep Apnea Recognition Based on Multi-Bands Spectral Entropy Analysis of Short-Time Heart Rate Variability. Entropy 21, 812. doi:10.3390/e21080812
Skoog, I. (2020). Covid-19 and Mental Health Among Older People in sweden. Int. psychogeriatrics 32, 1173–1175. doi:10.1017/s104161022000143x
Sultana, A., Sharma, R., Hossain, M., Bhattacharya, S., and Purohit, N. (2020). Burnout Among Healthcare Providers during COVID-19 Pandemic: Challenges and Evidence-Based Interventions. Khulna, Bangladesh: Indian Journal of Medical Ethics.
Tiwari, A., Albuquerque, I., Parent, M., Gagnon, J., Lafond, D., Tremblay, S., et al. (2019). Multi-scale Heart Beat Entropy Measures for Mental Workload Assessment of Ambulant Users. Entropy 21, 783. doi:10.3390/e21080783
Tiwari, A., Cassani, R., Gagnon, J., Lafond, D., Tremblay, S., and Falk, T. (2020). “Movement Artifact-Robust Mental Workload Assessment during Physical Activity Using Multi-Sensor Fusion,” in 2020 IEEE International Conference on Systems, Man, and Cybernetics (SMC), Toronto, Ontario (held virtually), October 11–14, 2020 (IEEE), 3471–3477. doi:10.1109/smc42975.2020.9283338
Tiwari, A., Narayanan, S., and Falk, T. (2019a). “Breathing Rate Complexity Features for “In-the-wild” Stress and Anxiety Measurement,” in 2019 27th European Signal Processing Conference (EUSIPCO), A Coruña, Spain, September 2–6, 2019 (IEEE), 1–5. doi:10.23919/eusipco.2019.8902700
Tiwari, A., Narayanan, S., and Falk, T. (2019b). “Stress and Anxiety Measurement” In-The-Wild” Using Quality-Aware Multi-Scale HRV Features,” in 2019 41st Annual International Conference of the IEEE Engineering in Medicine and Biology Society (EMBC), Berlin, Germany, July 23–27, 2019 (IEEE), 7056–7059. doi:10.1109/EMBC.2019.8857616
Torous, J., Myrick, K., Rauseo-Ricupero, N., and Firth, J. (2020). Digital Mental Health and COVID-19: Using Technology Today to Accelerate the Curve on Access and Quality Tomorrow. JMIR Ment. Health 7, e18848. doi:10.2196/18848
Tulppo, M., Hughson, R., Makikallio, T., Airaksinen, K., Seppanen, T., and Huikuri, H. (2001). Effects of Exercise and Passive Head-Up Tilt on Fractal and Complexity Properties of Heart Rate Dynamics. Am. J. Physiology-Heart Circulatory Physiol. 280, H1081–H1087. doi:10.1152/ajpheart.2001.280.3.h1081
Valenza, G., Allegrini, P., Lanatà, A., and Scilingo, E. (2012). Dominant Lyapunov Exponent and Approximate Entropy in Heart Rate Variability during Emotional Visual Elicitation. Front. neuroengineering 5, 3. doi:10.3389/fneng.2012.00003
Wang, F., Wang, H., and Fu, R. (2018). Real-time ECG-Based Detection of Fatigue Driving Using Sample Entropy. Entropy 20, 196. doi:10.3390/e20030196
Weippert, M., Behrens, M., Rieger, A., and Behrens, K. (2014). Sample Entropy and Traditional Measures of Heart Rate Dynamics Reveal Different Modes of Cardiovascular Control during Low Intensity Exercise. Entropy 16, 5698–5711. doi:10.3390/e16115698
Wen, W., Liu, G., Mao, Z.-H., Huang, W., Zhang, X., Hu, H., et al. (2018). Toward Constructing a Real-Time Social Anxiety Evaluation System: Exploring Effective Heart Rate Features. IEEE Trans. Affective Comput. 107, 2411–2502. doi:10.1109/taffc.2018.2792000
Williams, V. S., Morlock, R. J., and Feltner, D. (2010). Psychometric Evaluation of a Visual Analog Scale for the Assessment of Anxiety. Health Qual. Life Outcomes 8, 1–8. doi:10.1186/1477-7525-8-57
Wu, G., Arzeno, N., Shen, L., Tang, D., Zheng, D., Zhao, N., et al. (2009). Chaotic Signatures of Heart Rate Variability and its Power Spectrum in Health, Aging and Heart Failure. PloS one 4, e4323. doi:10.1371/journal.pone.0004323
Xia, Y., Yang, L., Zunino, L., Shi, H., Zhuang, Y., and Liu, C. (2018). Application of Permutation Entropy and Permutation Min-Entropy in Multiple Emotional States Analysis of RRI Time Series. Entropy 20, 148. doi:10.3390/e20030148
Zanin, M., Zunino, L., Rosso, O., and Papo, D. (2012). Permutation Entropy and its Main Biomedical and Econophysics Applications: A Review. Entropy 14, 1553–1577. doi:10.3390/e14081553
Zheng, L., Pan, W., Li, Y., Luo, D., Wang, Q., and Liu, G. (2017). Use of Mutual Information and Transfer Entropy to Assess Interaction between Parasympathetic and Sympathetic Activities of Nervous System from HRV. Entropy 19, 489. doi:10.3390/e19090489
Keywords: wearables, stress, anxiety, quality-awareness, autonomic nervous system, heart rate variability
Citation: Tiwari A and Falk TH (2021) New Measures of Heart Rate Variability Based on Subband Tachogram Complexity and Spectral Characteristics for Improved Stress and Anxiety Monitoring in Highly Ecological Settings. Front. Sig. Proc. 1:737881. doi: 10.3389/frsip.2021.737881
Received: 07 July 2021; Accepted: 01 September 2021;
Published: 21 September 2021.
Edited by:
Sri Krishnan, Ryerson University, CanadaReviewed by:
Jagannath M, Vellore Institute of Technology (VIT), IndiaRajesh Kumar Tripathy, Birla Institute of Technology and Science, India
Copyright © 2021 Tiwari and Falk. This is an open-access article distributed under the terms of the Creative Commons Attribution License (CC BY). The use, distribution or reproduction in other forums is permitted, provided the original author(s) and the copyright owner(s) are credited and that the original publication in this journal is cited, in accordance with accepted academic practice. No use, distribution or reproduction is permitted which does not comply with these terms.
*Correspondence: Abhishek Tiwari, YWJoaXNoZWsudGl3YXJpQGlucnMuY2E=; Tiago H. Falk, dGlhZ28uZmFsa0BpbnJzLmNh