 Wenjing Liu
 Xiqing Liu
 Shi Yan
- State Key Laboratory of Networking and Switching Technology, School of Information and Communication Engineering, Beijing University of Posts and Telecommunications, Beijing, China
The evaporation duct is an effective means for realizing non-line-of-sight (NLOS) wireless transmission over the sea. However, the effects of marine weather conditions on electromagnetic propagation have rarely been studied. In this study, the influence of the marine atmospheric environment on electromagnetic propagation was analyzed through numerical simulation. Additionally, the impacts of antenna height, transmission distance, and electromagnetic wave frequency on path loss were studied. Finally, the link capacity of the code division multiplexing (CDM) communication system in the evaporation duct environment was studied via numerical analysis and simulations. Simulation results demonstrated that CDM communication technology can improve the link capacity under an evaporation duct compared with that of the spread-spectrum communication technology.
1 Introduction
The ocean accounts for 70% of the surface of the Earth. However, owing to the curvature of the Earth and the constraint of antenna height, the line-of-sight transmission distances over the sea can only be up to 40 ∼50 km (Jo and Shim, 2019). Terrestrial communication infrastructures have developed over the years; however, it is challenging to deploy them in the sea. Thus, 95% of the marine areas are not covered by wireless networks. Generally, the communication nodes on the sea are extremely sparse; hence, long-distance wireless communication is required on the sea. However, existing wireless communication technologies are predominantly designed for densely populated facilities and do not apply to long-distance communication scenarios. Evaporation ducts over the sea can help realize non-line-of-sight (NLOS) transmission with low transmission loss by utilizing its trapped refraction. The fundamental reason is that the evaporation of seawater vapor causes the surface atmospheric humidity to sharply decrease with altitude, thereby decreasing the refractive index with increasing height. Therefore, electromagnetic waves refract downward if the refractive index is greater than the curvature of the Earth, consequently trapping the electromagnetic waves in the evaporation duct layer. At this point, the energy loss will be considerably reduced, thereby facilitating NLOS wireless transmission on the sea (Serebriakov and Abdullin, 2018). However, the strength and thickness of the evaporation duct vary with the atmospheric refractive index, and the atmospheric refractive index is related to numerous climatic factors, such as temperature, humidity, and atmospheric pressure. Therefore, exploring the impact of these factors on electromagnetic propagation in an evaporation duct environment is crucial.
Maritime communication nodes are characterized by their extreme sparseness; hence, long-distance NLOS wireless transmission is the primary form of maritime communication. The spread spectrum communication technology can be used to allocate the signal power over a wide spectrum bandwidth. In this manner, the signal energy in the chip time is significantly low. With processing gain, the anti-jamming and anti-fading capability can be improved, which is conducive to weak signal detection. Relevant studies show that spread spectrum communication technology can increase the transmission distance at the same power spectral density. Therefore, this work employs spread spectrum technology as a baseband scheme for enhancing long-distance transmission on the sea (Sagir et al., 2019). However, the spreading spectrum decreases the data rate. To address this issue, we introduced a multiplexing technology to increase the data rate under an evaporation duct environment.
Three methods are typically used to improve transmission capacity. One of which is increasing the bandwidth. The available band resources are limited, and the noise power can easily be increased, so in the large bandwidth transmission mode, the benefit of increasing the bandwidth to the link capacity decreases. The other is increasing the transmit power. However, the transmit power is generally limited by numerous conditions, and its implementation in practical applications is challenging. The third is creating multiple parallel data streams via multiplexing technology to improve channel capacity. Space division multiplexing is a commonly used multiplexing technology; however, considering the features of the maritime wireless channel, it is not ideal to use this technology. Sparse scattering is a prominent feature of maritime wireless channels owing to few obstacles existing on the sea. For instance, in the maritime double line model, if the direct and reflected paths have the same angular orientation, the angular difference between the two paths decreases with increasing propagation distance. Using the traditional large-scale multi-input multi-output (MIMO) technology, antenna element height and MIMO channel matrix rank defect problems, complexity, and cost problems occur. Therefore, this work considers code division multiplexing technology, which indicates the parallel transmission of multiple code channels, to improve the link capacity of the system.
In our study, we not only analyze the atmospheric environmental factors affecting evaporation ducts channel characteristics, but also analyze the effects of antenna height and electromagnetic wave frequency of the transmitted signal on evaporation ducts channel. Through the comprehensive analysis of the above factors, we propose to use spread spectrum technology to realize long-distance wireless transmission over the sea. While the spreading spectrum decreases the data rate, thus the CDM technology was introduced for improving the system link capacity under the condition of evaporation duct. Finally, we give the link capacity simulation analysis under this technology.
2 Electromagnetic propagation model under evaporation duct on the sea
Evaporation ducts are considerably affected by the atmospheric environment. The electromagnetic propagation characteristics significantly vary under different climatic conditions. To explore and analyze these characteristics, the classical parabolic equation model and atmospheric refractive factor are introduced. The electromagnetic propagation model under an evaporation duct is shown in Figure 1. Assuming that the horizontal communication distance between the two communication nodes is 50 km, the height of the arc of the Earth is approximately 49 m, and that of the evaporation duct layer is approximately 20 m. After reflection and refraction, the signal jumps forward, thus realizing NLOS transmission.
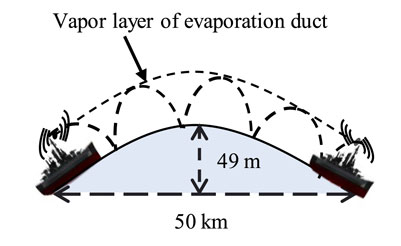
FIGURE 1. Electromagnetic propagation model under evaporation duct.
2.1 Parabolic equation model
The parabolic equation (PE) is one of the most commonly used mathematical tools for solving electromagnetic propagation problems in complex atmospheric refraction and irregular terrain scenarios.
The PE can be described as (Guo et al., 2021; Li et al., 2011):
where x and z represent the horizontal transmission distance of the sea surface and the altitude above the sea surface, respectively. u (x, z) is the electromagnetic attenuation function (it can be expressed as an electric field component in a horizontally polarized electromagnetic field or a magnetic field component in a vertically polarized electromagnetic field). k is the number of waves, and m is the atmospheric correction exponent of the refractive index.
It is impractical to directly solve the parabolic equation; thus, the split-step Fourier transform (SSFT) algorithm (Valtr and Pechac, 2007) was used to solve the discrete solution for reducing computational complexity. Assuming that the field distribution at the current position is known, the SSFT algorithm was used to solve the field distribution at a certain distance, and using recursive relations, we solved the field distributions at all positions.
Defining u (x0, z) as the field distribution at x0, the SSFT was used to obtain (Levadnyi et al., 2011):
where p ≜ k sin θ, and θ is the wave velocity direction angle. F [⋅] and F−1 [⋅] represent the Fourier transform and inverse Fourier transform, respectively. Using the SSFT algorithm, u (x0 + 2Δx, z), u (x0 + 3Δx, z) etcetera can be worked out by iterating step size Δx. Then, the concerned field distribution at a position can be determined by changing the initial value u (x0, z), step size Δx, and times of iteration.
2.2 Atmospheric refraction factor
The performance of ducts is affected by the atmospheric refractive index under an evaporation duct environment over the sea. The formula for atmospheric refraction is as follows (Guo et al., 2014):
where N and P represent atmospheric refractive index and atmospheric pressure, respectively. Moreover, e and T represent water vapor pressure and temperature, respectively.
Considering the influence of the curvature of the Earth, the corrected atmospheric refractive index is expressed as follows (Forster and Riechen, 2006):
where M represents the corrected atmospheric refractive index. The relationship between M and m (the atmospheric correction exponent of the refractive index), can be described as (Smith and Weintraub, 1953):
Numerous prediction models are used for evaporation ducts. In recent years, the Paulus-Jeske (P–J) (Grimes and Hackett, 2014) model and Naval Postgraduate School (NPS) (Zhang et al., 2010) model have been widely used. This study used the NPS model to analyze the height and refractive index of the evaporation duct. In this model, the atmospheric temperature, humidity, wind speed, relative humidity, and other environmental parameters at a certain height were input, and then, the atmospheric refractive index profile of the evaporation duct is was obtained according to Eqs 3–5. The height of the evaporation duct was obtained by using the minimum corrected refractive index (Guo et al., 2014) as shown in Figure 2.
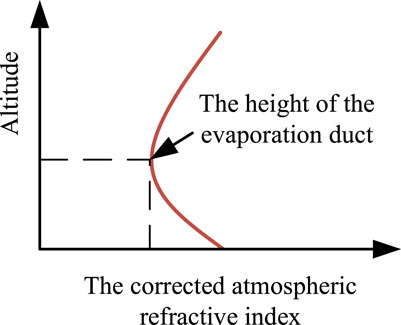
FIGURE 2. Evaporation duct height form.
3 Influence of atmospheric environment on electromagnetic propagation in evaporation duct
The height of the evaporation duct is affected by factors such as the atmospheric temperature, sea-surface temperature, air-sea temperature difference, relative humidity, wind speed, and atmospheric pressure (Guo et al., 2018; Shi et al., 2019). In this study, the NPS model was used to analyze the effect of these environmental factors on radio propagation. First, the corresponding corrected refractive index and height profile of the evaporation duct were obtained by setting the values of meteorological parameters at a certain altitude, and then, the influence of these factors on path loss was analyzed by controlling the variates.
3.1 Influence of relative humidity on electromagnetic propagation
Evaporation ducts can be divided into three states, i.e., stable, neutral, and unstable states. Particularly, when the air-sea temperature difference (ASTD) is
It was assumed that the input parameters of the NPS model are as follows: 1) The electromagnetic frequencies are 5, 10, and 15 GHz. 2) The transceiver antenna was 4 m high. 3) The antenna was in the horizontal polarization mode. 4) The wind speed at 10 m above sea level was 10 m/s 5) ASTD
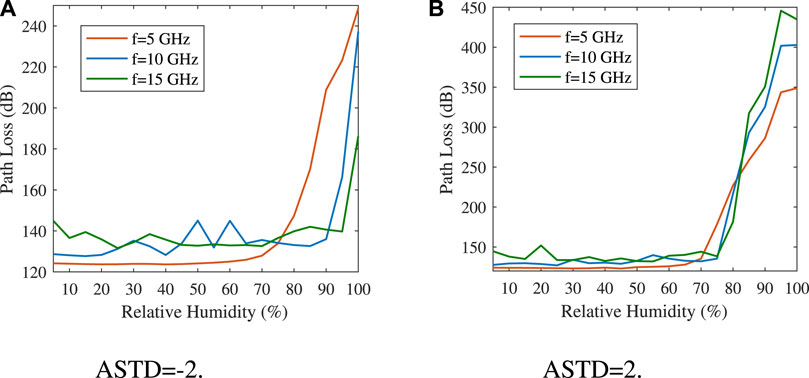
FIGURE 3. Variation in path loss with relative humidity under different ASTD. (A) ASTD = −2. (B) ASTD = 2.
As shown in Figure 3, the path loss versus relative humidity curve is insensitive to the transmission frequency value. When the relative humidity is over 40%, with an increase in the relative humidity, the path loss remains stable at first and then gradually increases. By comparing Figures 3A,B, it can be seen that the maximum relative humidity under an unstable state is higher than that under the stable state, and the higher the frequency of the electromagnetic wave, the greater the tolerable maximum relative humidity. With an increase in relative humidity, the increase in the path loss rate in the stable state is greater than that in the unstable state, and the higher the frequency of the electromagnetic wave, the greater the path loss. Therefore, when the relative humidity is over 70%, higher transmission frequencies can be used to achieve a longer distance transmission, owing to the considerably smaller path loss. When the relative humidity is below 65%, a lower transmission frequency results in a lower loss value. However, under the condition of extremely high relative humidity, the path loss rapidly increases, and the height of the evaporation duct is significantly low, so the evaporation duct cannot be used to achieve reliable communication on the sea.
3.2 Influence of wind speed on electromagnetic propagation
Wind speed does not directly affect the intensity of the evaporation duct, but it can accelerate the air-sea exchange rate and thus indirectly affect the intensity of the evaporation duct, subsequently affecting electromagnetic propagation.
It was assumed that the relative humidity at 10 m above sea level was 40%; ASTD
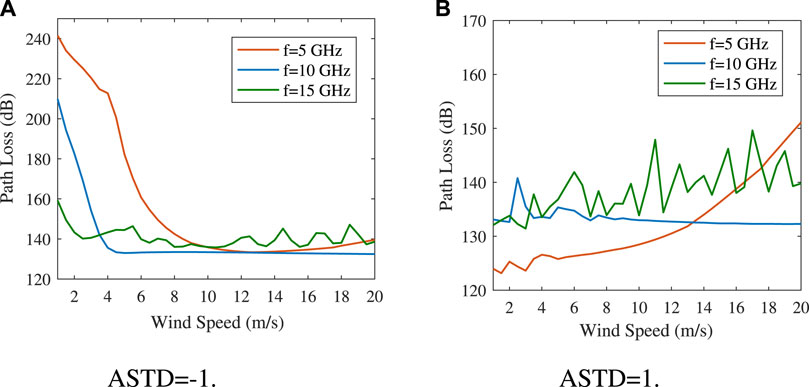
FIGURE 4. Variation in path loss with wind speed at different transmit frequencies. (A) ASTD = −1. (B) ASTD = 1.
As shown in Figure 4, the influence of wind speed on electromagnetic wave path loss is significantly different under stable and unstable states. In the unstable state, when the wind speed is low, the path loss is considerably high. With an increase in wind speed, the path loss decreases rapidly. When the wind speed exceeds a certain value, the path loss remains almost stable. This is because in the unstable state, the height of the evaporation duct increases with increasing wind speed. In particular, when the wind speed is 20 m/s, the height of the duct is nearly 30 m, and the performance of the evaporation duct is satisfactory. Under the stable state, the path loss tends to increase with increasing wind speed because the height of the evaporation duct decreases with increasing wind speed, the strength of the evaporation duct decreases, and then, the path loss increases.
Comparing Figures 4A,B, it can be seen that in the unstable state, when the wind speed is high, the evaporation duct can be used to achieve long-distance communication on the sea; in the stable state, the electromagnetic wave of 10 GHz can be used to achieve wireless communication on the sea, because this frequency is insensitive to wind speed. Under this frequency, the communication is more stable, which is more suitable for long-distance wireless communication.
3.3 Influence of temperature on electromagnetic propagation
In this section, it is assumed that the environmental factors were maintained constant except for the atmospheric temperature and sea-surface temperature. The relative humidity was 40%. The wind speed was 10 m/s. The temperature setting is as shown in Table 1, and other parameter settings are the same as those in Section 3.1.
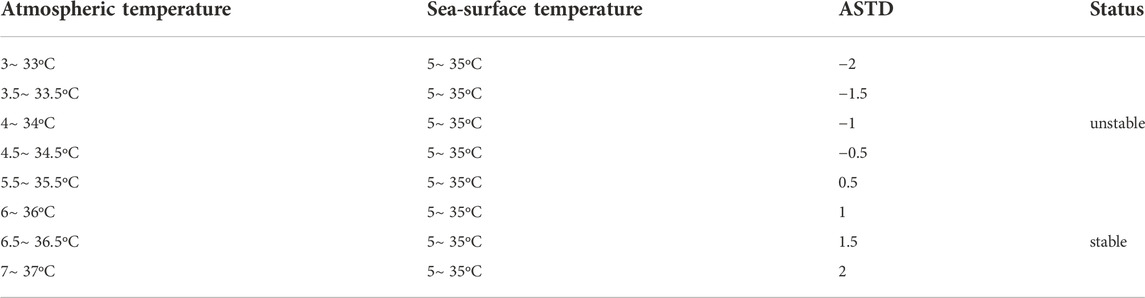
TABLE 1. Setting of sea-surface temperature and atmospheric temperature parameters.
To analyze the influence of temperature on electromagnetic propagation under the unstable and stable states, it is assumed that the sea-surface temperature gradually varies from 5 to 35°C, the atmospheric temperature varies with the sea-surface temperature, and the ASTD remains constant. The influence of sea-surface temperature, atmospheric temperature, and ASTD on the electromagnetic propagation of 15 GHz electromagnetic waves is obtained, and the results are shown in Figure 5.
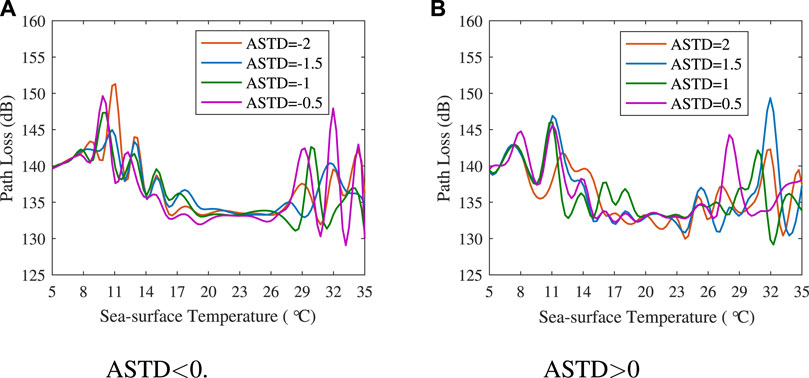
FIGURE 5. Influence of temperature on path loss under different ASTD. (A) ASTD
Comparing Figures 5A,B, it can be seen that under the condition that the ASTD remains unchanged when the sea-surface temperature or atmospheric temperature is higher or lower, the path loss fluctuates. When the sea surface temperature is between 20 and 27°C, the path loss is relatively stable and low.
Considering the influence of ASTD on electromagnetic propagation, the trend of the four curves under the unstable state is closer than that under the stable state. That is, the influence of ASTD on path loss under unstable states is moderately small. When the sea-surface temperature is below 20°C, the smaller the temperature difference, the lower the loss, and the smaller the fluctuation. When the sea-surface temperature is over 27°C, the smaller the temperature difference, the greater the path loss, and the greater the fluctuation. Under stable states, the minimum average loss can be obtained when the ASTD is 2°C. Only considering the influence of temperature on electromagnetic propagation, the evaporation duct can be selected to realize wireless communication over the sea under the sea-surface temperature of 15 ∼ 28°C.
The influence of relative humidity, wind speed, temperature, and ASTD on path loss is analyzed in this section. It can be seen that under the condition of evaporation duct, the environmental factors significantly affect the strength of evaporation ducts. According to the simulation results, the following conclusions can be drawn. Under the unstable state, the higher the wind speed, the lower the relative humidity, and the higher the temperature, the smaller the path loss. That is because this climate condition is more conducive to the evaporation of sea water and the formation of a stronger evaporation duct layer. Under the stable state, it is easier to form a stronger evaporation duct layer if the relative humidity is lower, the wind speed is lower, the temperature is higher, and the ASTD is higher, consequently reducing path loss. Observing the results presented in this section, it can be determined whether the evaporation duct can be used to achieve wireless communication on the sea according to the actual climate conditions.
4 Influence of frequency and antenna height on electromagnetic propagation
In Section 3, the influence of the atmospheric environment on electromagnetic propagation in evaporation duct channels is analyzed in detail. In this section, the influence of antenna height, transmission distance, and electromagnetic wave frequency on electromagnetic propagation is studied. To study the influence of these factors on electromagnetic propagation, it was assumed that the evaporation duct channel is time-invariant during the period. This assumption may give rise to a few errors in the analysis of the results, which were not considered in this study.
According to the analysis results in Section 3, the influence of the aforementioned factors on electromagnetic propagation is studied under the condition of a strong evaporation duct, to avoid the problem of large path loss caused in a poor evaporation duct environment. Under the unstable state, it can be reasonably assumed that the atmospheric and sea-surface temperatures were 20 and 22°C, respectively. Under the stable state, the atmospheric and sea-surface temperatures were 22 and 20°C, respectively. The relative humidity was 40%. The wind speed was 10 m/s at a height of 10 m. Other atmospheric parameters were set as those in Section 3.1. The simulation results are shown in Figures 6, 7.
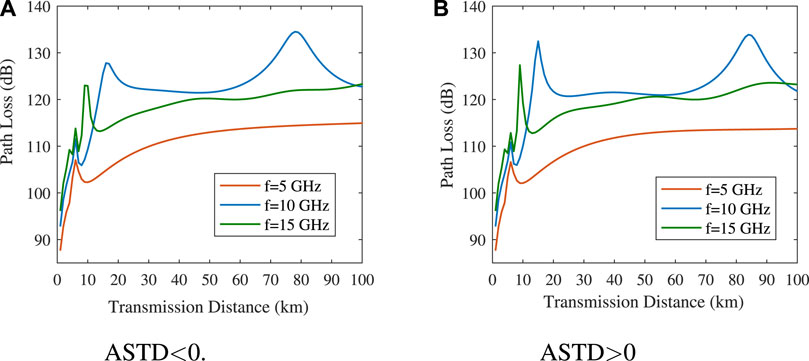
FIGURE 6. Variation in path loss with transmission distance in different states. (A) ASTD
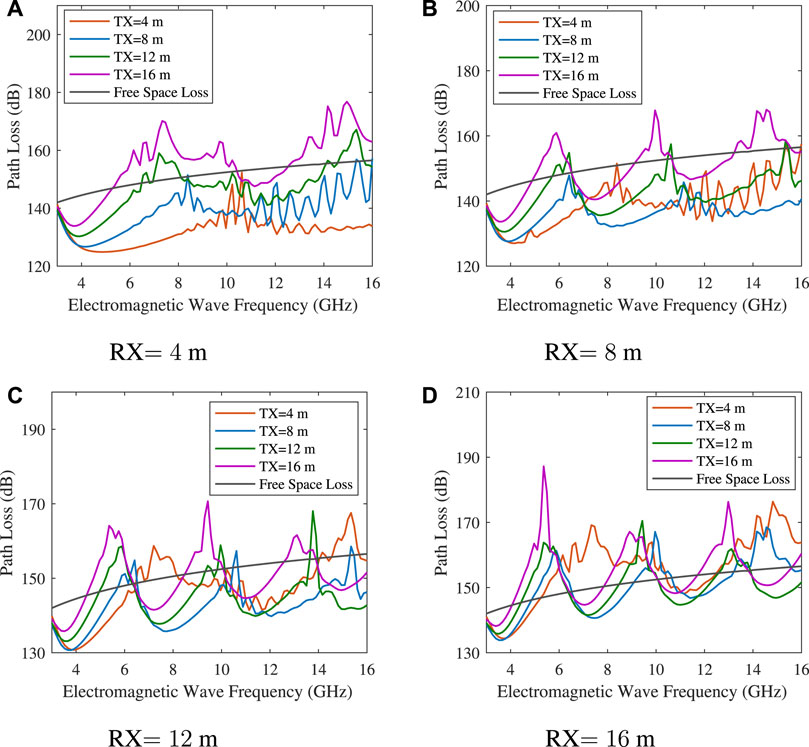
FIGURE 7. Influence of frequency on path loss at different antenna height. (A) RX = 4 m. (B) RX = 8 m. (C) RX = 12 m. (D) RX = 16 m.
Comparing Figures 6A,B, it can be observed that no matter what state is, with an increase in propagation distance, the path loss first rapidly increases, then increases gradually, and finally remains almost stable. The changing trend of electromagnetic wave path loss with distance is almost the same for the frequencies of 5 and 15 GHz, and the path loss difference is approximately 8 dB. The loss of the electromagnetic wave with a frequency of 10 GHz reaches the maximum in the 70 ∼ 100 km range. Therefore, when considering the influence of transmission distance on path loss under different transmission frequencies, we can select the electromagnetic wave with a transmission frequency of 5 or 15 GHz for wireless communication over the sea.
Figure 7 shows the influence of electromagnetic wave frequency on path loss when the antenna height at the receiver is fixed and the antenna height at the transmitter is changed. In the figure, TX represents the transmit antenna and RX represents the receiver antenna.
As shown in Figure 7, the path loss is significantly affected by the frequency of the electromagnetic wave, and the path loss at various frequencies is different. As shown in Figure 7D, the antenna heights of the transceiver are both 16 m, and the difference between the path loss of electromagnetic waves with the frequencies of 3.5 and 5.5 GHz is 50 dB. With an increase in frequency, the path loss shows a wave-like change, and the overall path loss shows an increasing trend. It can be seen that the selection of the electromagnetic wave frequency plays an important role in reliable communication over the sea.
When the electromagnetic wave frequency was below 8 GHz and the receiver antenna height was fixed, the path loss increases with increasing transmit antenna height and frequency, and a higher receiver antenna height, accelerates the path loss increase, and the electromagnetic wave frequency corresponding to the minimum loss point decreases. If the electromagnetic wave with a frequency of 15 GHz is selected for transmission and when the antenna heights at the receiver and transmitter are 4 m, the loss value decreases. As shown in Figure 7, we can select the appropriate antenna height of the transceiver according to the frequency of the electromagnetic wave or select the suitable electromagnetic wave frequency for communication based on the antenna height of the transceiver, to reduce path loss.
The change in the path loss with antenna height at the transceiver, transmission distance, and electromagnetic wave frequency is analyzed when the evaporation duct channel environment is stable. The following conclusions can be drawn: in any case, the longer the transmission distance and the higher the antenna height at the transceiver, the greater the path loss. The path loss shows a trend of wave-shaped growth with increasing frequency. Therefore, to realize NLOS transmission under the condition of the evaporation duct, it is required to ensure that the antenna height is within the evaporation duct layer, and the lowest loss value can be obtained at approximately half of the evaporation duct height.
5 Performance analysis of code division multiplexing in evaporation duct
In Sections 3, 4, the influence factors of path loss under the condition of evaporation duct were studied. Through analysis, it was found that a smaller path loss can be obtained under an appropriate atmospheric environment, antenna height, and electromagnetic wave frequency; therefore, it is easy to realize NLOS transmission. In this section, code division multiplexing technology is introduced for improving the transmission rate of the system under an evaporation duct environment to realize high-speed and NLOS transmission over the sea.
5.1 Operating principle of code division multiplexing
Similar to time division multiplexing (TDM) and frequency division multiplexing (FDM) technologies, code division multiplexing (CDM) technology divides the physical channel into several code channels with little correlation or orthogonal to each other in the code domain, and the users transmit different data symbols on different code channels for achieving the parallel transmission of data symbols and increasing the data rate. The m-sequence codebook is provided in Figure 8. As shown in Figure f8a, cm = (cm1, … , cmn, … , cmN) is the spread spectrum code-sequence on the mth code channel. The value of m ranges from 1 to M. M represents the number of code channels. N represents the spreading code length of each code channel, that is, each spreading code sequence includes N chips. The nth chip on the mth code channel of the m-sequence is represented as cmn (m = 1, … , M, n = 1, … , N).
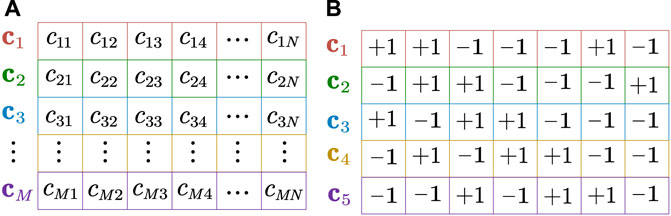
FIGURE 8. m-sequence codebook. (A) m-sequence codebook. (B) N = 7, M = 5.
In this study, m-sequence was used in CDM in the form of a single-code multiple stream, that is, only one m-sequence was required to be generated, and the spreading code sequences of all the code channels can be obtained by the cyclic shift of m-sequence. However, it is required to ensure that the number of multiplexed code channels and the code length satisfy M ≤ N. If M > N, more than two code channels will have the same spreading code sequence, thus violating the principle of code division multiplexing. Provided that the spreading code sequence of the mth code channel is cm = (cm1, … , cmn, … , cmN), the spreading code sequence of the (m + l) th code channel, that is, cm+l = (cm(N−l+1), …, cmN, cm1, … , cm(N−l)), can be obtained via cyclically shifting the mth spreading code, cm, to the right by l bits, where l takes the value from (− m + 1, N − m). The codebook of the m-sequence is described below by considering N = 7 and M = 5 as an example. Assuming that the m-sequence is c1 = (+1, +1, −1, −1, −1, +1, −1) when N = 7, the codebook is described in Figure 8B.
As shown in Figure 8B, c2, c3, c4, and c5 are the spreading code sequences obtained by shifting c1 by 1, 2, 3, and 4 bits, respectively, to the right.
In the communication system, CDM is generally realized using the spread spectrum technology. Figure 9 shows the transceiver block diagram of a BPSK direct-sequence spread-spectrum signal.
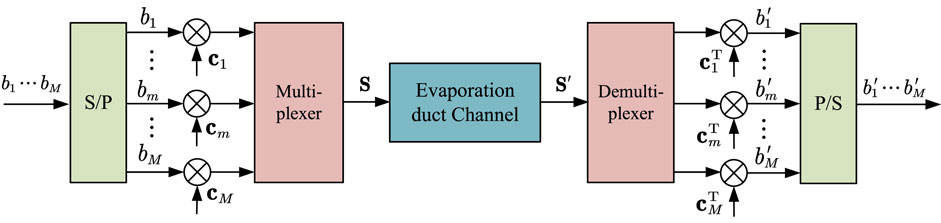
FIGURE 9. Transceiver system block diagram.
As shown in Figure 9, b = (b1, … , bm, … , bM) is a binary data symbol, distributed to different code channels for parallel transmission after serial-to-parallel conversion, that is, b1 ∼ bM are respectively transmitted on the first code channel, and b2 is transmitted on the 1st ∼ Mth code channel. The spreading code sequence of each code channel is c1, c2, … , cM, and the signal at the transmitter after spreading processing is expressed as:
After the channel effect, the received signal is expressed as:
where h represents the channel gain. Assuming that the channel gain is the same for each chip symbol, a scalar can be uesd to represent the channel gain. n represents the noise; n = (n1, … , nn, … , nN), where nn represents the noise on the nth chip. For the convenience of research, it is assumed that the statistical characteristics of the noise superimposed on each chip are the same and are all represented by n.
The signal representation at the receiver is described below by taking the κth path as an example. The received signal can be expressed as:
where the value of κ ranges from 1 to M. The κth receiver signal after the despreading is expressed as:
where
The autocorrelation function of an m-sequence with the period N is:
where τ is the number of bits of the cyclic shift and τ = j − i. From the balance of m-sequences (the number of 1 s is always one more than the number of 0 s in the maximum length sequence), and there is one more −1 than +1 in ci.
The solving process of the received signal-to-interference plus noise ratio (SINR) of the κth channel signal is given below. Assuming that the system uses a favorable power control, and the total power of the transmitter is S, the transmit power allocated to each symbol is identical (Pt = S/M), then, each code channel has the same signal-to-noise ratio (SNR) at the transmitter. Assuming that the SNR at the transmitter of the mth code channel is SNRm, SNRm = Pt/(N0B) (m = 1, … , M). N0 represents the noise power spectral density and B represents the signal bandwidth. Sea obstacles are sparse, as we primarily consider large-scale fading, and the relationship between the received power and the transmitted power is expressed as:
where PL represents the large-scale fading in the evaporation duct channel condition, and the expression is provided below. Finally, the SINR of the κth path signal is obtained according to (9):
Example: Assuming that N = 7 and M = 5, the m-sequence codebook is shown in Figure 8. For simplicity, it is assumed that the data symbols on each code channel are b1 = a, b2 = b, b3 = c, b4 = d, b5 = e, and the value is +1 or −1. The transmit signal is expressed as:
The receiver signal is expressed as:
Taking the first channel as an example, the received signal after despreading is expressed as:
where the first part is the original symbol, the second part is the ISI, and the third part is noise. According to this example, the signal representation form at the receiver can be expressed simply, which is convenient for understanding.
5.2 Transmission rate of code division multiplexing communication system
It was assumed that the atmospheric environment is suitable, the electromagnetic wave frequency was 15 GHz, and other environmental parameters were set as in Section 4. The path loss is written as:
where d is the transmission distance. The formula can approach the be used to obtain curve with R2 = 0.9759 (the closer R2 is to 1, the closer the two curves are). The fitted curve and the approximate curve are shown in Figure 10. The fitted curve is given by Eq. 16, and the approximate curve is drawn by the actual path loss. If the value where the path loss changes sharply is ignored, it can be determined that the error between the fitted curve and the approximate curve is minuscule. Therefore, we can use the fitted curve instead of the approximate curve as the path loss model under the evaporation duct environment.
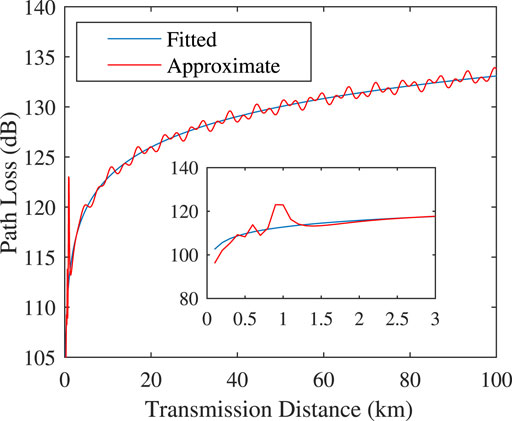
FIGURE 10. Fitted and approximate curves.
The channel gain under the evaporation duct condition can be expressed as Eq. 16. Then, the link capacity of the CDM system under this channel condition is expressed as:
In this study, it is assumed that the number of code channels and the code length are identical, M = N = 2046, and the system bandwidth B = 50 MHz. Then, the influence of the atmospheric environment, transmission distance, antenna height, and electromagnetic wave frequency on the system link capacity was studied, and the influence of code length on the link capacity was analyzed. The simulation curve is shown in Figure 11.
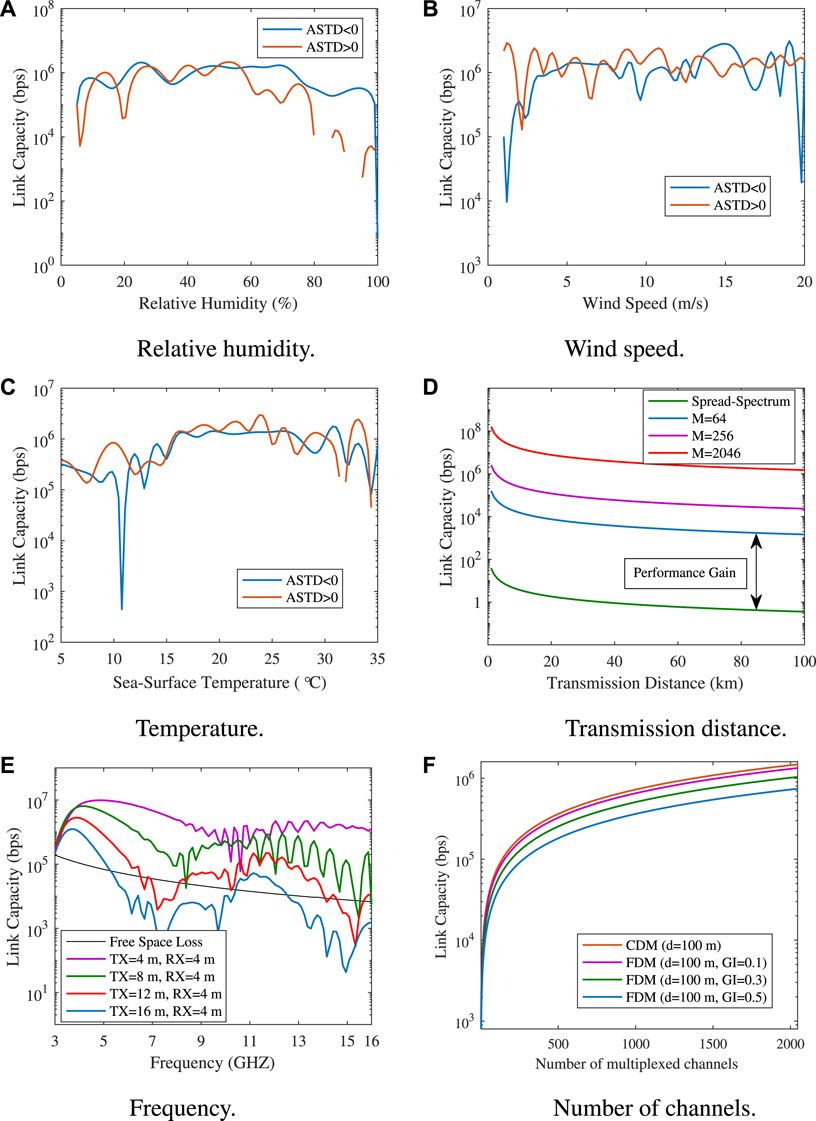
FIGURE 11. Influence of various factors on system link capacity. (A) Relative humidity. (B) Wind speed. (C) Temperature. (D) Transmission distance. (E) Frequency. (F) Number of channels.
Figure 11A shows that the link capacity is approximately identical in both states when the relative humidity is between 30% and 55%, and the link capacity in the unstable state is greater than that in the stable state when the relative humidity is lower than 30% or higher than 55%. As shown in Figure 11B, the link capacity is significantly affected by the wind speed in the unstable state. In particular when the wind speed is high or low, the link capacity does not dramatically decrease. As shown in Figure 11C, in both states, the impact of sea surface temperature on the link capacity is approximately the same, except that the temperature is 11°C. Moreover, there is a stable and high link capacity at a temperature of 15 ∼ 27°C. Figure 11D shows the influence of transmission distance on the link capacity when the SNR at the transmitter is 30 dB. Without the CDM technology, the link capacity of the system is considerably low, as the transmission rate of a single code channel is 1/N times the transmission rate of the N parallel code channels. Particularly, the transmission rate at 100 km is only a few bps; thus, it is impossible to achieve maritime communication. When the code division multiplexing is adopted, the link capacity of the system is improved. In addition, the greater the number ofcode channels, the lower the impact of distance on link capacity. Therefore, increasing the number of code channels can help overcome the limitation of low link capacity caused by long transmission distances. As shown in Figure 11E, higher link capacity can be obtained using the evaporation duct channel model rather than the free space model, and with an increase in frequency, the link capacity shows a wave-like decline over the observation zone. Let the height of the receiver antenna be 4 m, and the heights of the transmit antenna be 4, 8, 12, and 16 m. A high link capacity can be obtained only when the antennas at the transceiver are highly matched. As shown in Figure 11F, in this part, we give a comparative simulation analysis of the performance of CDM and FDM. We consider that the filters has the ideal bandpass characteristics and no interference between sub-band channels. Then we analyze the link capacity performance of both with the same number of multiplexed band channels and code channels. Since FDM technology must have a guard interval (GI) between adjacent sub-band channels to ensure that there is no interference between sub-band channels, when GI = 0.1, the guard interval is 5 MHz, the link capacity of FDM is similar to CDM, but with the increase of GI, CDM has superior performance.
6 Conclusion
Using evaporation ducts is a way to realize wireless transmission on the sea. In this study, the impact of the atmospheric environment on the channel characteristics of the evaporation duct was analyzed via numerical simulation research method. Thus, low-path loss transmission could be obtained by selecting the appropriate antenna height and electromagnetic wave frequency under suitable climatic conditions. Moreover, the CDM technology was introduced for improving the system link capacity under the condition of evaporation duct, and thus, NLOS and high data rate wireless transmission over the sea can be realized.
Data availability statement
The original contributions presented in the study are included in the article/Supplementary Material, further inquiries can be directed to the corresponding author.
Author contributions
WL and XL contributed to the conception and design of the study. WL contributed to the theoretical analysis and performance simulation of the study. WL and LZ wrote the first draft of the manuscript. XL and MP was in charge of overall direction and planning. SY and MP contributed in drafting and critical revision of the article. All authors contributed to manuscript revision, read, and approved the submitted version.
Funding
This work was supported by the National Natural Science Foundation of China under Nos. U21A20444 and 61921003, and Young Elite Scientist Sponsorship Program by China Institute of Communications.
Conflict of interest
The authors declare that the research was conducted in the absence of any commercial or financial relationships that could be construed as a potential conflict of interest.
Publisher’s note
All claims expressed in this article are solely those of the authors and do not necessarily represent those of their affiliated organizations, or those of the publisher, the editors and the reviewers. Any product that may be evaluated in this article, or claim that may be made by its manufacturer, is not guaranteed or endorsed by the publisher.
References
Forster, J., and Riechen, J. (2006). “Measurements of refractive variability in the marine boundary layer in comparison with mesoscale meteorological model predictions,” in Optics in atmospheric propagation and adaptive systems IX. doi:10.1117/12.690138
Grimes, N., and Hackett, E. (2014). “Examining constants in the paulus-jeske evaporation duct model,” in 2014 United States National Committee of URSI National Radio Science Meeting (USNC-URSI NRSM) (Boulder, CO, USA: IEEE), 1. doi:10.1109/WICOM.2010.5600958
Guo, X., Kang, S., and Zhang, Y. (2014). “A simple method to estimate clear air refractivity profile in the stably stratified marine atmospheric boundary layer,” in 2014 URSI General Assembly and Scientific Symposium (URSI GASS) (Beijing, China: IEEE), 1–4. doi:10.1109/URSIGASS.2014.6929672
Guo, X., Zhang, Y., Li, Q., and Kang, S. (2021). “Parabolic-equation based study of atmospheric turbulent effects on evaporation duct radio wave propagation,” in 2021 13th International Symposium on Antennas, Propagation and EM Theory (ISAPE) (Zhuhai, China: IEEE), 1–3. doi:10.1109/ISAPE54070.2021.9752884
Guo, X., Zhao, D., Zhang, L., Lin, L., and Kang, S. (2018). “Effect of atmospheric stability on radio wave propagation in evaporation duct,” in 2018 12th International Symposium on Antennas, Propagation and EM Theory (ISAPE) (Hangzhou, China: IEEE), 1–3. doi:10.1109/ISAPE.2018.8634321
Jo, S. W., and Shim, W. S. (2019). Lte-maritime: High-speed maritime wireless communication based on lte technology. IEEE Access 7, 53172–53181. doi:10.1109/ACCESS.2019.2912392
Levadnyi, I., Ivanov, V., and Shalyapin, V. (2011). “Assessment of evaporation duct propagation simulation,” in 2011 URSI General Assembly and Scientific Symposium (Istanbul, Turkey: IEEE), 1–4. doi:10.1109/URSIGASS.2011.6050871
Li, D. X., Niu, Q. G., Liu, Y. B., and Mu, C. X. (2011). “Propagation modelling over variable terrain using the two-way pe method,” in Proceedings of 2011 IEEE CIE International Conference on Radar (Chengdu, China: IEEE), 812–815. doi:10.1109/CIE-Radar.2011.6159666
Sagir, S., Kaya, i., sisman, C., Baltacl, Y., and Unal, S. (2019). “Evaluation of low-power long distance radio communication in urban areas: Lora and impact of spreading factor,” in 2019 Seventh International Conference on Digital Information Processing and Communications (ICDIPC) (Trabzon, Turkey: IEEE), 68–71. doi:10.1109/ICDIPC.2019.8723666
Serebriakov, D., and Abdullin, R. (2018). “Model of evaporation duct,” in 2018 Ural Symposium on Biomedical Engineering, Radioelectronics and Information Technology (USBEREIT), 338–341.
Shi, Y., Zhang, Q., Wang, S., Yang, K., Yang, Y., and Ma, Y. (2019). Impact of typhoon on evaporation duct in the northwest Pacific ocean. IEEE Access 7, 109111–109119. doi:10.1109/ACCESS.2019.2932969
Smith, E. K., and Weintraub, S. (1953). The constants in the equation for atmospheric refractive index at radio frequencies. Proc. IRE 41, 1035–1037. doi:10.1109/JRPROC.1953.274297
Valtr, P., and Pechac, P. (2007). Domain decomposition algorithm for complex boundary modeling using the Fourier split-step parabolic equation. IEEE Antennas Wirel. Propag. Lett. 6, 152–155. doi:10.1109/lawp.2007.893108
Wang, S., Han, J., Shi, Y., Yang, K., Huang, C., and Yang, F. (2020). “The influence of antenna height on microwave propagation in evaporation duct,” in Global Oceans 2020: Singapore - U.S. Gulf Coast (Biloxi, MS, USA: IEEE), 1–5. doi:10.1109/IEEECONF38699.2020.9389404
Keywords: evaporation duct, atmospheric environment, path loss, code division multiplexing, link capacity
Citation: Liu W, Liu X, Yan S, Zhao L and Peng M (2022) Performance analysis of code division multiplexing communication under evaporation duct environment. Front. Sig. Proc. 2:1067055. doi: 10.3389/frsip.2022.1067055
Received: 11 October 2022; Accepted: 07 November 2022;
Published: 22 November 2022.
Edited by:
Yong Zhou, ShanghaiTech University, ChinaReviewed by:
Qiang Ye, Memorial University of Newfoundland, CanadaYiliang Liu, Xi’an Jiaotong University, China
Copyright © 2022 Liu, Liu, Yan, Zhao and Peng. This is an open-access article distributed under the terms of the Creative Commons Attribution License (CC BY). The use, distribution or reproduction in other forums is permitted, provided the original author(s) and the copyright owner(s) are credited and that the original publication in this journal is cited, in accordance with accepted academic practice. No use, distribution or reproduction is permitted which does not comply with these terms.
*Correspondence: Xiqing Liu, bGl1eGlxaW5nQGJ1cHQuZWR1LmNu