 Shobha Sundar Ram
 Shubhi Singhal
 Gourab Ghatak
- Indraprastha Institute of Information Technology Delhi, New Delhi, India
Recently joint radar communication (JRC) systems have gained considerable interest for several applications such as vehicular communications, indoor localization and activity recognition, covert military communications, and satellite based remote sensing. In these frameworks, bistatic/passive radar deployments with directional beams explore the angular search space and identify mobile users/radar targets. Subsequently, directional communication links are established with these mobile users. Consequently, JRC parameters such as the time trade-off between the radar exploration and communication service tasks have direct implications on the network throughput. Using tools from stochastic geometry (SG), we derive several system design and planning insights for deploying such networks and demonstrate how efficient radar detection can augment the communication throughput in a JRC system. Specifically, we provide a generalized analytical framework to maximize the network throughput by optimizing JRC parameters such as the exploration/exploitation duty cycle, the radar bandwidth, the transmit power and the pulse repetition interval. The analysis is further extended to monostatic radar conditions, which is a special case in our framework. The theoretical results are experimentally validated through Monte Carlo simulations. Our analysis highlights that for a larger bistatic range, a lower operating bandwidth and a higher duty cycle must be employed to maximize the network throughput. Furthermore, we demonstrate how a reduced success in radar detection due to higher clutter density deteriorates the overall network throughput. Finally, we show a peak reliability of 70% of the JRC link metrics for a single bistatic transceiver configuration.
1 Introduction
Over the last decade, joint radar communication (JRC) frameworks are being researched and developed for numerous applications at microwave and millimeter wave (mmWave) frequencies Liu et al. (2020). Through the integration of sensing and communication functionalities on a common platform, JRC based connected systems offer the advantages of increased spectral efficiency through shared spectrum and reduced hardware costs. The most common applications are WiFi/WLAN based indoor detection of humans Falcone et al. (2012); Storrer et al. (2021); Tan et al. (2016); Li et al. (2020); Alloulah and Huang (2019); Yildirim et al. (2021), radar enhanced vehicular communications Ali et al. (2020); Kumari et al. (2017); Dokhanchi et al. (2019); Duggal et al. (2020), covert communications supported by radar based localization Kellett et al. (2019); Hu et al. (2019) and radar remote sensing based on global navigation satellite systems (GNSS) Zavorotny et al. (2014). All of these systems consist of a dual functional (radar-communication) transmitter and either a standalone or integrated radar/communications receiver. When the radar receiver is not co-located with the transmitter, the system constitutes a passive/bistatic radar framework. This is the most common scenario in sub-6 GHz indoor localization systems where the WiFi access point serves as both a radar and communication transmitter and humans activities are sensed for intrusion detection, surveillance, or assisted living. The bistatic scenario is also encountered in GNSS based remote sensing where the ground reflected satellite signals are analyzed, at a passive radar receiver, to estimate land and water surface properties Zavorotny et al. (2014). JRC based systems are also being researched for next generation intelligent transportation services where one of the main objectives is to share environment information for collision avoidance, and pedestrian detection eventually leading to autonomous driving. MmWave communication protocols such as IEEE 802.11 ad/ay characterized by high wide bandwidths and low latency have been identified for vehicular-to-everything (V2X) communications Nitsche et al. (2014); Zhou et al. (2018). However, due to the severe propagation loss at mmWave carrier frequencies, they are meant to operate in short range line-of-sight (LOS) conditions with highly directional beams realized through digital beamforming. In high mobility environments, beam training will result in considerable overhead and significant deterioration of latency. Hence, the integration of the radar functionality within the existing millimeter wave communication frameworks is being explored for rapid beam alignment Kumari et al. (2017); Dokhanchi et al. (2019); Duggal et al. (2019); Grossi et al. (2021). The wide bandwidth supported by the mmWave signals along with the channel estimation capabilities within the packet preamble are uniquely suited for radar remote sensing operations. To summarize, we divide the integrated sensing and communication systems into two broad categories. In the first category, the communication transmitter serves as an opportunistic illuminator whose parameters cannot be modified for maximizing a passive radar receiver’s detection performance. The second category is where a dual functional system is implemented with optimized design parameters - such as antennas, transmit waveform and signal processing algorithms—for enhanced radar detection performance without deterioration in the communication metrics Hassanien et al. (2016); Mishra et al. (2019); Ma et al. (2021). In this work, we consider the second category and focus on the time resource management between the radar and communication functionalities for maximizing communication network throughput. A preliminary work on the detection metrics of a bistatic radar was presented in Ram and Ghatak (2022). Here, we consider a generalized passive/bistatic radar framework that can be used to model the JRC application scenarios described above and analyze the communication network throughput performance as a function of radar detection metrics. The monostatic radar scenario is considered as a limiting case of the bistatic radar and the corresponding results are obtained as a corollary.
Prior works have tackled the time resource management for multi-functional radars Miranda et al. (2007). In Grossi et al. (2017), the radar dwell time was optimized for maximum target detection for a constant false alarm rate. In Ghatak et al. (2021), the time resource management between the localization and communication functionalities was determined as a function of the density of base station deployment. During the radar/localization phase, the transmitter must scan the angular search space and determine the number and location of the mobile users. Then these users must be served during the remaining duration through directional/pencil beams. The exploration and service process must be repeated periodically due to the motion of the mobile user. Now, if the angular beamwidth of the search beams are very narrow, then they will take longer to cover the search space (for a fixed dwell time) and this will result in reduced communication service time. However, the radar link quality will be higher due to the improved gain and result in a larger number of targets being detected. Hence, the overall network throughput is a function of the explore/exploit time management. In this paper, we use stochastic geometry (SG) based formulations to optimize the network throughput as a function of the explore/exploit duty cycle.
SG tools were originally applied to communication problems in cellular networks, mmWave systems, and vehicular networks Chiu et al. (2013); Andrews et al. (2011); Bai and Heath (2014); Thornburg et al. (2016); Ghatak et al. (2018). In all of these scenarios, there is considerable variation in the strength and spatial distribution of the base stations. More recently, they have been used in diverse radar scenarios to study the radar detection performance under interference and clutter conditions Al-Hourani et al. (2017); Munari et al. (2018); Ren et al. (2018); Park and Heath (2018); Fang et al. (2020). These works have considered the significant diversity in the spatial distributions and density of radars. SG offers a mathematical framework to analyze performance metrics of spatial stochastic processes that approximate to Poisson point process distributions without the requirement of computationally expensive system simulation studies or laborious field measurements. Based on the mathematical analysis, insights are obtained of the impact of design parameters on system level performances. In our problem related to JRC, there can be considerable variation in the position of the dual functional base station transmitter, the radar receiver and the communication end users who are the primary radar targets. Additionally, the JRC will encounter reflections from undesired targets/clutter in the environment. We model the discrete clutter scatterers in the bistatic radar environment as a homogeneous Poisson point process (PPP) similar to Chen et al. (2012); Ram et al. (2020, 2021). This generalized framework allows us to regard each specific JRC deployment, not as an individual case, but as a specific instance of an overall spatial stochastic process. Further, the target parameters such as the position and radar cross-section are also modelled as random variables. Using SG we quantify the mean number of mobile users that can be detected by the radar provided the statistics of the target and clutter conditions are known and subsequently determine the network throughput. Then we use the theorem to optimize system parameters such as the explore/exploit duty cycle, transmitted power, radar bandwidth and pulse repetition interval for maximum network throughput. Our results are validated through Monte Carlo simulations carried out in the short range bistatic radar framework.
Our paper is organized as follows. In the following section, we present the system model of the JRC with the bistatic radar framework and describe the explore/exploit time management scheme. In section 4, we provide the theorem for deriving the network throughput as a function of the bistatic radar parameters. In section 5, we offer the key system parameter insights that are drawn from the theorem as well as the Monte Carlo simulation based experimental validation. Finally, we conclude the paper with a discussion on the strengths and limitations of the proposed analytical framework along with directions for future work.
Notation: In this paper, all the random variables are indicated with bold font and constants and realizations of a random variable are indicated with regular font.
2 System Model
We consider a joint radar-communication (JRC) framework with a single base station (BS), multiple mobile users (MU) and a single passive radar receiver (RX) as shown in Figure 1A. The BS serves as a dual functional transmitter that supports both radar and communication functionalities in a time division manner as shown in Figure 1B.During the Tsearch interval, the BS serves as the radar transmitter or opportunistic illuminator and along with the RX, forms a bistatic radar whose objective is to localize the multiple MU in the presence of clutter/undesirable targets. During this interval, the BS transmits a uniform pulse stream of τ pulse width and TPRI pulse repetition interval, through a directional and reconfigurable antenna system with gain Gtx and beamwidth Δθtx. The radar must scan the entire angular search space within Tsearch to find the maximum number of MU. If the duration of an antenna beam is fixed at Tbeam (based on hardware parameters such as circuit switching speed for electronic scanning or Doppler frequency resolution requirements), then the number of beams that can be searched within Tsearch is given by
where Ω is the angular search space. In our problem formulation, we set Ω = 2π to correspond to the entire azimuth angle extent. During the remaining duration of Tserve, directional communication links are assumed to be established between the BS and the detected MUs. Thus the beam alignment for communication during Tserve is based on radar enabled localization during Tsearch. Since the position of the MU does not remain fixed with time, the process of beam alignment is repeated for every T = Tsearch + Tserve as shown in the figure. An important tuning parameter in the above JRC framework is the duty cycle
where (1—ϵ) is the duty cycle of the communication service time
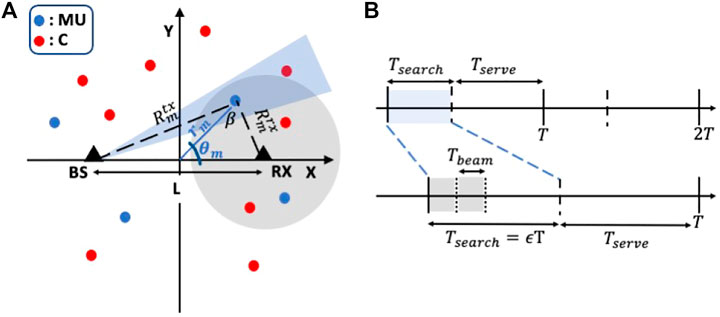
FIGURE 1. (A) Illustration of the joint radar-communication (JRC) scenario. The base station (BS) at
Next, we discuss the planar bistatic radar geometry that we have considered based on the north-referenced system described in Jackson (1986). We assume that the BS is located in the Cartesian coordinates
Classically, radar detection metrics and the radar operating curve are obtained from binary hypothesis testing derived from the Neyman-Pearson (NP) theorem Kay (1998). The probability of detection,
where
where λ is the wavelength of the radar. In the above expression, the gain of RX is assumed to be 1 since it is an omnidirectional antenna. We assume that the gain of the BS is uniform within the main lobe and is inversely proportional to the beam width:
In (3) and (5), we have assumed that only a single MU is within a radar resolution cell, Ac. In the real world, a single radar resolution cell may consist of one or more targets. However, there is no way for the radar operator to distinguish or count the targets that are within a single cell. Hence, it will always be counted/considered as a single target. The amplitude of the target signal will however fluctuate due to interference from the multiple points within the cell and this fluctuation is captured with the Swerling models. Further, in the above discussion, we assume a single tone pulse radar of bandwidth BW. However, the system insights can be equally applied to other wide bandwidth signals as well. The clutter returns, C, at the radar receiver is given by
In the above expression, we specifically only consider those clutter scatterers that fall within the same resolution cell, Ac, as the MU. We use the generalized Weibull model Sekine et al. (1990) to describe the distribution of the RCS (σc) of the clutter points. For a given noise of the radar receiver, Ns = KBTsBW where KB, Ts and BW are the Boltzmann constant, system noise temperature and bandwidth respectively, the signal to clutter and noise ratio is given by
3 Estimation of Network Throughput of Joint Radar-Communication
In this section we present the analytical framework to estimate the network throughput of the communication framework as a function of the explore/exploit duty cycle (ϵ). We use the
Theorem 1. The network throughput (ϒ) for an explore/exploit duty cycle (ϵ) for a passive/bistatic radar based JRC system is given by
where
Proof.For an MU at bistatic range κm, the SCNR is a function of several random variables such as the MU cross-section, the position of MU, the number and spatial distribution of the discrete clutter scatterers and their RCS as shown below
We define the bistatic radar detection coverage probability
The bistatic RCS, σm, has been shown to demonstrate similar statistics as monostatic RCS Skolnik (1961). In this work, we consider the MU to have Swerling-1 characteristics, which corresponds to mobile users such as vehicles and humans Raynal et al. (2011a,b), as shown below
where,
In the above expression,
where
where ρc is the mean spatial density of the clutter scatterers. The integral specifically considers the clutter scatterers that fall within the same resolution cell as the MU. Bistatic radar literature identifies three types of resolution cells—the range resolution cell, the beamwidth resolution cell and the Doppler resolution cell. In our study, the main objective of the radar is to perform range-azimuth based localization. Hence, we consider the range resolution cell, which based on Willis (2005); Moyer et al. (1989), corresponds to
for a pulse width of τ. In the above expression, note that the size of Ac varies as a function of constant κm and the random variable θm. Prior studies show that sin β takes on the value of sin βmax with a very high probability when
If we assume that the clutter statistics are uniform within Ac, then the integral in (14) can be further reduced to
If we define
In our work, we specifically consider the contributions from discrete/point clutter responses that arise from direct and multipath reflections from the surrounding environment. We model the radar cross-section of these scatterers using the generalized Weibull model shown in
where
Substituting (20) in (12), we obtain
The above expression shows the probability that a MU at κm is detected by the bistatic radar based on its SCNR. If we assume a uniform spatial distribution, ρm, of the MU in Cartesian space, then the mean number of MU that can be detected within the total radar field-of-view at κm bistatic range from the radar will be given by
where
Hence, the circumference
When κm > L, the estimation of (24) can be approximated to the expression shown above. Note that for very large values of κm ≫ L, the scenario approaches monostatic conditions. Here, the oval approximates to a circle of circumference 2πκm. Also, as mentioned before β can be approximated to βmax. Hence
and the resulting network throughput for the communication links that are set up with detected MUs is
4 Optimization of Joint Radar-Communication System Parameters for Maximization of Network Throughput
In this section, we discuss the corollaries from the theorem presented in the previous section. Based on these inferences, we present how JRC parameters such as ϵ, τ, Δθtx and TPRI can be optimized for maximum throughput. The results presented in this section are experimentally validated using Monte Carlo simulations. For the simulations, we assume that the bistatic radar transmitter (BS) and receiver (RX) are located at

FIGURE 2. Two realizations of Monte Carlo simulations with bistatic radar transmitter (BS) and receiver (RX) indicated by triangles. The BS is characterized by narrow beam indicated by dashed blue lines with slopes m1 and m2 while RX is omnidirectional. Target is indicated by black dot while clutter scatterers inside and outside the radar resolution cell are indicated by blue and red dots respectively.

FIGURE 3. (A) Detection coverage
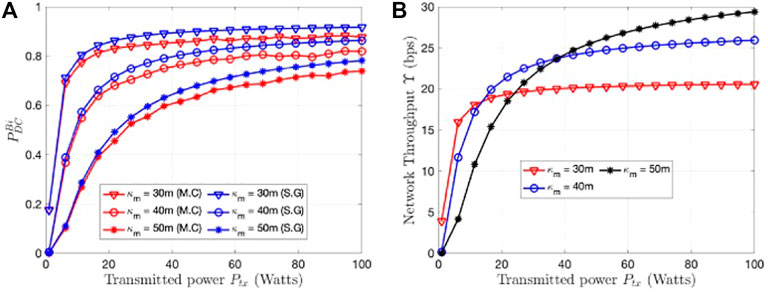
FIGURE 4. (A) Detection coverage
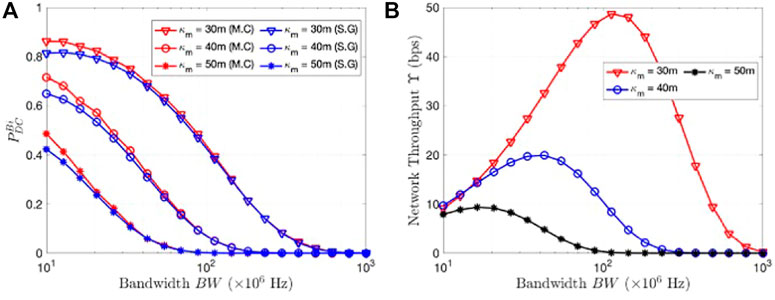
FIGURE 5. (A) Detection coverage
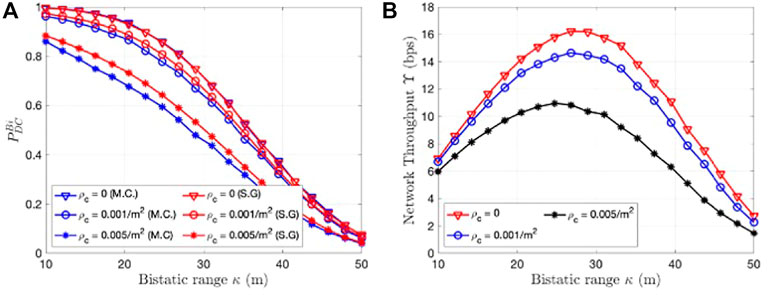
FIGURE 6. (A) Detection coverage
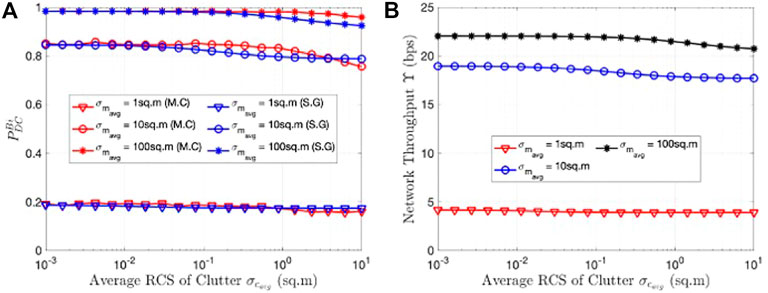
FIGURE 7. (A) Detection coverage
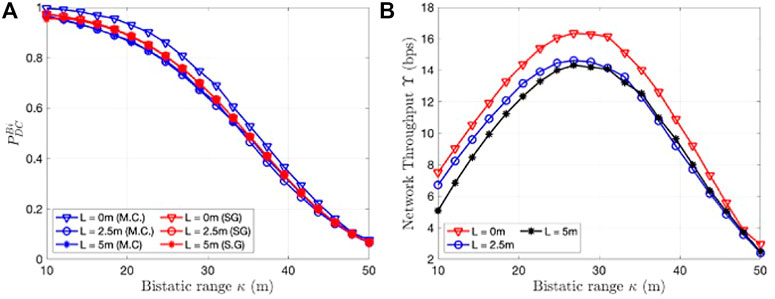
FIGURE 8. (A) Detection coverage
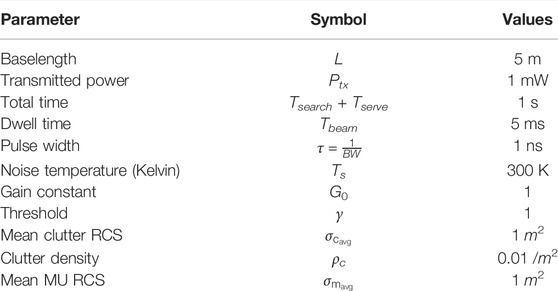
TABLE 1. Radar, target and clutter parameters used in the stochastic geometry formulations and Monte Carlo simulations.
4.1 Explore/Exploit Duty Cycle (ϵ)
In the JRC framework, a key parameter is
where
and
We find the optimized
Corollary 1.1. The optimum explore/exploit duty cycle
The above case shows that the duty cycle is a function of the SCNR of the JRC system (shown in a in (28)). Figure 3 shows the variation of
4.2 Signal-to-Noise Ratio Vs Signal-to-Clutter Ratio
Next, we discuss the effects of noise and clutter on the performance of the JRC. As pointed out earlier, there are two terms within the
Corollary 1.2. The optimum bandwidth
The Monte Carlo results in Figure 5A show good agreement with SG results especially for higher values of wider BW. At low narrow BW, the errors due to the path loss approximation between the point clutter and the MU become more evident. However, in real world scenarios, microwave/millimeter JRC systems are developed specifically for high wide bandwidth waveforms for obtaining fine range resolution of the MU. Next we study the impact of clutter density and clutter RCS in Figure 6 and Figure 7. When the clutter density is low (ρc approaches zero), we observe that
4.3 Monostatic Conditions
A monostatic radar is a specific case of bistatic radar where the baseline length, L, and bistatic angle, β, are zero. Here, the one-way propagation distance from the transmitter and receiver to the target are equal. Hence, a monostatic radar can be assumed to be at the origin with the bistatic range κm equal to the polar distance rm. We can, then directly, derive the radar detection coverage metric and throughput for this scenario from the bistatic case by making the corresponding substitutions to (7) and (8) and derive the following corollary.
Corollary 1.3. The radar detection coverage metric
where
The corollary again shows that the detection performance in the case of the monostatic radar can be studied through the SNR (the first term within the exponent of (33)) and the SCR (the second term within the exponent). The SNR deteriorates as a function of the fourth power of the target distance while the SCR deteriorates linearly as a function of target radial distance. Hence, at greater distances we are limited by the clutter rather than the noise. We compare the monostatic and bistatic radar performances using the baseline length L as a parameter in Figure 8. Note that for all values of L and κm in the above study, the MU remains within the cosite region of the radar. The result show that the
4.4 Pulse Repetition Interval
The maximum two-way unambiguous range of a radar,
Note that in the above expression, the bistatic range changes for the parameter β. The maximum value that cos β can take is 1. Hence, for a given radar’s TPRI
If we assume that at this range κmax ≫ L, then
and the throughput is given by
In the above throughput expression, it is evident that if the TPRI is larger, the radar detection performance deteriorates. However, a larger number of MU are included in the region-of-interest due to which there are some gains in the throughput. We assume that if the Rmax is high enough to ignore the effects of L, the radar operates under clutter limited conditions, and the throughput is a function of TPRI, as given in
Corollary 1.4. Accordingly, the optimum pulse repetition interval,
The above expression shows that higher ϵ (resulting in narrow beams) and shorter pulse duration (smaller τ) will allow for a longer pulse repetition interval and unambiguous range due to improvement in the link metrics.
4.5 Meta Distribution of Signal-to-Clutter-and-Noise Ratio in a Bistatic Radar
Although the
For a point clutter located at a distance,
where,
We note here that with the path loss approximation, only the number of clutter points (and not their locations) inside the range resolution cell n impacts the moment. Then, the complementary CDF of the conditional
where,
In Figure 9 we see the impact of the path loss approximation of the clutter points on the meta-distribution of the SCNR.In particular, we see that since with the path loss approximation, the meta-distribution depends only on the number of clutter points within the range resolution cell, the corresponding plot has a stepped behaviour, where each step corresponds to a certain number of clutter points. On the contrary, the plot without the path loss approximation takes into account the relative randomness in the locations of the clutter points within the range resolution cell. For a given κm, the path loss approximation may result in either an overestimation or an underestimation of the actual meta-distribution. However, such an analysis is out of scope of the current work and will be investigated in a future work.In Figure 10 we plot the meta-distribution of the SCNR for different SCNR thresholds. This represents, qualitatively, a fine-grained analysis of the radar detection. For a given γ the meta-distribution evaluated at a given z represents the fraction of radar links that experience a successful radar detection at least z% of the time. For example, when the radar detection threshold is set at γ = 0 dB, we observe that about half
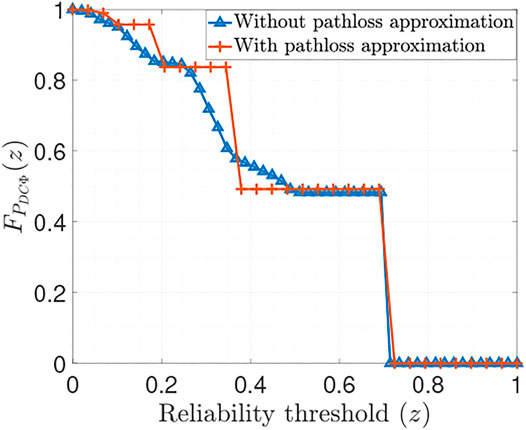
FIGURE 9. Comparison of the meta-distribution of the SCNR with and without the path loss approximation of the clutter points. Here ϵ =0.5.
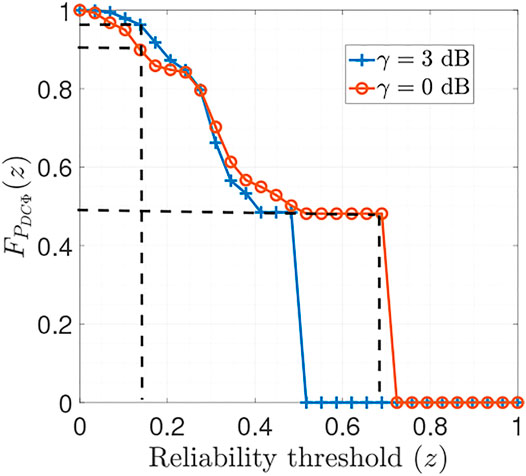
FIGURE 10. Meta distribution of the SCNR for different SCNR thresholds.
5 Conclusion
We have provided an SG based analytical framework to provide system level planning insights into how radar based localization can enhance communication throughput of a JRC system. The key advantage of this framework is that it accounts for the significant variations in the radar, target and clutter conditions that may be encountered in actual deployments without requiring laborious system level simulations or measurement data collection. Specifically, we provide a theorem to optimize JRC system parameters such as the explore/exploit duty cycle, the transmitted power, bandwidth and pulse repetition interval for maximizing the network throughput. The results are presented for generalized bistatic radar scenarios from which the monostatic results are derived through limiting conditions. We also provide a study on the meta-distribution of the radar detection metric which provides the key insight that none of the mobile users can be reliably detected beyond 70% of the time with a single JRC configuration. Our results are validated with Monte Carlo simulations.
The analysis in this work is based on some assumptions: First, we have assumed a planar bistatic radar geometry where all the mobile users/radar targets fall in the cosite region (baseline length is below twice the bistatic range). These assumptions are satisfied in several JRC applications such as indoor localization using WiFi/WLAN devices and in radar enhanced vehicular communications. However, the assumption does not hold for GNSS based bistatic radar remote sensing where the transmitter is the satellite while the receiver is mounted close to the earth and a three-dimensional geometry would have to be considered. Hence, our future work will focus on the modification to the SG based analysis to analyze radar performance metrics under 3D, non-cosite conditions of the bistatic radar.
Second, we have considered short range line-of-sight links in our study which are applicable to mmWave JRC implementations. However, real world deployments encounter blockages that must be accounted for from a JRC system design perspective. Similarly, the radar will receive returns from sidelobes along with the main lobes which has not been considered in our work. Finally, in our throughput analysis, we have assumed that all the mobile users have uniform data rates that can be supported. In real world conditions, the requirements from individual users will differ and there may be system constraints on the maximum resource utilization. Therefore, the study of the performance bounds due to more realistic channel, radar and mobile user models will lead to more accurate estimation of the detection performance and network throughput and would form the basis of future studies.
Third, in this work, we have confined our discussion to a single bistatic radar framework. In the foreseeable future, we may encounter radar networks with a single transmitter and multiple receivers, or even multiple transmitters and receivers. In these conditions, there can be significant diversity in the radar and target geometry which can be effectively analysed through SG. Research into multistatic radar frameworks would form a natural extension to this work.
Data Availability Statement
All the codes used to generate the figures in the document can be accessed at https://essrg.iiitd.edu.in/?page_id=4355.
Author Contributions
The theoretical formulations and derivations and writing of the paper were carried out by SR in collaboration with GG. The Monte Carlo simulations for experimental validation were carried out by SS.
Funding
Project is funded through a grant from Ministry of Electronics and Information Technology, Government of India, No.13 (30/2020-CC&BT).
Conflict of Interest
The authors declare that the research was conducted in the absence of any commercial or financial relationships that could be construed as a potential conflict of interest.
Publisher’s Note
All claims expressed in this article are solely those of the authors and do not necessarily represent those of their affiliated organizations, or those of the publisher, the editors and the reviewers. Any product that may be evaluated in this article, or claim that may be made by its manufacturer, is not guaranteed or endorsed by the publisher.
References
Al-Hourani, A., Evans, R. J., Kandeepan, S., Moran, B., and Eltom, H. (2017). Stochastic Geometry Methods for Modeling Automotive Radar Interference. IEEE Trans. Intell. Transportation Syst. 19, 333–344. doi:10.1109/tits.2016.2632309
Ali, A., González-Prelcic, N., and Ghosh, A. (2020). Passive Radar at the Roadside Unit to Configure Millimeter Wave Vehicle-To-Infrastructure Links. IEEE Trans. Veh. Technol. 69, 14903–14917. doi:10.1109/tvt.2020.3027636
Alloulah, M., and Huang, H. (2019). Future Millimeter-Wave Indoor Systems: A Blueprint for Joint Communication and Sensing. Computer 52, 16–24. doi:10.1109/mc.2019.2914018
Andrews, J. G., Baccelli, F., and Ganti, R. K. (2011). A Tractable Approach to Coverage and Rate in Cellular Networks. IEEE Trans. Commun. 59, 3122–3134. doi:10.1109/tcomm.2011.100411.100541
Bai, T., and Heath, R. W. (2014). Coverage and Rate Analysis for Millimeter-Wave Cellular Networks. IEEE Trans. Wireless Commun. 14, 1100–1114. doi:10.1109/TWC.2014.2364267
Billingsley, J. B. (2002). Low-angle Radar Land Clutter: Measurements and Empirical Models. Norwich, NY: IET.
Chen, X., Tharmarasa, R., Pelletier, M., and Kirubarajan, T. (2012). Integrated Clutter Estimation and Target Tracking Using Poisson point Processes. IEEE Trans. Aerosp. Electron. Syst. 48, 1210–1235. doi:10.1109/taes.2012.6178058
Chiu, S. N., Stoyan, D., Kendall, W. S., and Mecke, J. (2013). Stochastic Geometry and its Applications. West Sussex, United Kingdom: John Wiley & Sons.
Dokhanchi, S. H., Mysore, B. S., Mishra, K. V., and Ottersten, B. (2019). A Mmwave Automotive Joint Radar-Communications System. IEEE Trans. Aerosp. Electron. Syst. 55, 1241–1260. doi:10.1109/taes.2019.2899797
Duggal, G., Mishra, K. V., and Ram, S. S. (2019). “Micro-doppler and Micro-range Detection via Doppler-Resilient 802.11ad-Based Vehicle-To-Pedestrian Radar,” in 2019 IEEE Radar Conference (Bostin, MA: IEEE), 1–6. doi:10.1109/radar.2019.8835525
Duggal, G., Vishwakarma, S., Mishra, K. V., and Ram, S. S. (2020). Doppler-Resilient 802.11ad-Based Ultrashort Range Automotive Joint Radar-Communications System. IEEE Trans. Aerosp. Electron. Syst. 56, 4035–4048. doi:10.1109/taes.2020.2990393
Falcone, P., Colone, F., and Lombardo, P. (2012). Potentialities and Challenges of Wifi-Based Passive Radar. IEEE Aerosp. Electron. Syst. Mag. 27, 15–26. doi:10.1109/maes.2012.6380822
Fang, Z., Wei, Z., Chen, X., Wu, H., and Feng, Z. (2020). Stochastic Geometry for Automotive Radar Interference with Rcs Characteristics. IEEE Wireless Commun. Lett. 9, 1817–1820. doi:10.1109/lwc.2020.3003064
Ghatak, G., De Domenico, A., and Coupechoux, M. (2018). Coverage Analysis and Load Balancing in Hetnets with Millimeter Wave Multi-Rat Small Cells. IEEE Trans. Wireless Commun. 17, 3154–3169. doi:10.1109/twc.2018.2807426
Ghatak, G., Koirala, R., De Domenico, A., Denis, B., Dardari, D., Uguen, B., et al. (2021). Beamwidth Optimization and Resource Partitioning Scheme for Localization Assisted Mm-Wave Communication. IEEE Trans. Commun. 69, 1358–1374. doi:10.1109/TCOMM.2020.3036864
Grossi, E., Lops, M., Tulino, A. M., and Venturino, L. (2021). Opportunistic Sensing Using Mmwave Communication Signals: A Subspace Approach. IEEE Trans. Wireless Commun. 20, 4420–4434. doi:10.1109/TWC.2021.3058775
Grossi, E., Lops, M., and Venturino, L. (2017). Two-step Sequential Detection in Agile-Beam Radars: Performance and Tradeoffs. IEEE Trans. Aerosp. Electron. Syst. 53, 2199–2213. doi:10.1109/taes.2017.2688878
Haenggi, M. (2012). Stochastic Geometry for Wireless Networks. Cambridge, United Kingdom: Cambridge University Press.
Hassanien, A., Amin, M. G., Zhang, Y. D., and Ahmad, F. (2016). Signaling Strategies for Dual-Function Radar Communications: An Overview. IEEE Aerosp. Electron. Syst. Mag. 31, 36–45. doi:10.1109/maes.2016.150225
Hu, J., Wu, Y., Chen, R., Shu, F., and Wang, J. (2019). Optimal Detection of Uav’s Transmission with Beam Sweeping in covert Wireless Networks. IEEE Trans. Vehicular Techn. 69, 1080–1085.
Jackson, M. C. (1986). The Geometry of Bistatic Radar Systems. IEE Proc. F Commun. Radar Signal. Process. UK 133, 604–612. doi:10.1049/ip-f-1.1986.0097
Kay, S. M. (1998). Fundamentals of Statistical Signal Processing Detection Theory. Upper Saddle River, NJ: Prentice-Hall 146, 222.
Kellett, D., Garmatyuk, D., Mudaliar, S., Condict, N., and Qualls, I. (2019). Random Sequence Encoded Waveforms for covert Asynchronous Communications and Radar. IET Radar, Sonar & Navigation 13, 1713–1720. doi:10.1049/iet-rsn.2018.5659
Kumari, P., Choi, J., González-Prelcic, N., and Heath, R. W. (2017). Ieee 802.11 Ad-Based Radar: An Approach to Joint Vehicular Communication-Radar System. IEEE Trans. Vehicular Techn. 67, 3012–3027. doi:10.1109/TVT.2017.2774762
Li, W., Piechocki, R. J., Woodbridge, K., Tang, C., and Chetty, K. (2020). Passive Wifi Radar for Human Sensing Using a Stand-Alone Access point. IEEE Trans. Geosci. Remote Sensing 59, 1986–1998. doi:10.1109/TGRS.2020.3006387
Liu, F., Masouros, C., Petropulu, A. P., Griffiths, H., and Hanzo, L. (2020). Joint Radar and Communication Design: Applications, State-Of-The-Art, and the Road Ahead. IEEE Trans. Commun. 68, 3834–3862. doi:10.1109/tcomm.2020.2973976
Ma, D., Shlezinger, N., Huang, T., Shavit, Y., Namer, M., Liu, Y., et al. (2021). Spatial Modulation for Joint Radar-Communications Systems: Design, Analysis, and Hardware Prototype. IEEE Trans. Veh. Technol. 70, 2283–2298. doi:10.1109/tvt.2021.3056408
Miranda, S. L. C., Baker, C. J., Woodbridge, K., and Griffiths, H. D. (2007). Comparison of Scheduling Algorithms for Multifunction Radar. IET Radar Sonar Navig. 1, 414–424. doi:10.1049/iet-rsn:20070003
Mishra, K. V., Bhavani Shankar, M. R., Koivunen, V., Ottersten, B., and Vorobyov, S. A. (2019). Toward Millimeter-Wave Joint Radar Communications: A Signal Processing Perspective. IEEE Signal. Process. Mag. 36, 100–114. doi:10.1109/msp.2019.2913173
Moyer, L. R., Morgan, C. J., and Rugger, D. A. (1989). An Exact Expression for Resolution Cell Area in Special Case of Bistatic Radar Systems. IEEE Trans. Aerosp. Electron. Syst. 25, 584–587. doi:10.1109/7.32092
Munari, A., Simic, L., and Petrova, M. (2018). Stochastic Geometry Interference Analysis of Radar Network Performance. IEEE Commun. Lett. 22, 2362–2365. doi:10.1109/lcomm.2018.2869742
Nitsche, T., Cordeiro, C., Flores, A., Knightly, E., Perahia, E., and Widmer, J. (2014). IEEE 802.11ad: Directional 60 GHz Communication for Multi-Gigabit-Per-Second Wi-Fi [Invited Paper]. IEEE Commun. Mag. 52, 132–141. doi:10.1109/mcom.2014.6979964
Park, J., and Heath, R. W. (2018). Analysis of Blockage Sensing by Radars in Random Cellular Networks. IEEE Signal. Process. Lett. 25, 1620–1624. doi:10.1109/lsp.2018.2869279
Ram, S. S., and Ghatak, G. (2022). Estimation of Bistatic Radar Detection Performance under Discrete Clutter Conditions Using Stochastic Geometry. arXiv e-prints , arXiv: 2201.03221.
Ram, S. S., Singh, G., and Ghatak, G. (2020). “Estimating Radar Detection Coverage Probability of Targets in a Cluttered Environment Using Stochastic Geometry,” in 2020 IEEE International Radar Conference (RADAR) (Washington D.C.: IEEE), 665–670. doi:10.1109/radar42522.2020.9114637
Ram, S. S., Singh, G., and Ghatak, G. (2021). Optimization of Radar Parameters for Maximum Detection Probability under Generalized Discrete Clutter Conditions Using Stochastic Geometry. IEEE Open J. Signal. Process. 2, 571–585. doi:10.1109/ojsp.2021.3121199
Raynal, A. M., Bickel, D. L., Denton, M. M., Bow, W. J., and Doerry, A. W. (2011a). in Radar Cross Section Statistics of Ground Vehicles at Ku-Band (SPIE Proceedings). United States: SPIE 8021.
Raynal, A. M., Burns, B. L., Verge, T., Bickel, D. L., Dunkel, R., and Doerry, A. W. (2011b). Radar Cross Section Statistics of Dismounts at Ku-Band. Radar Sensor Techn. XV, 8021. doi:10.1117/12.882873
Ren, P., Munari, A., and Petrova, M. (2018). Performance Tradeoffs of Joint Radar-Communication Networks. IEEE Wireless Commun. Lett. 8, 165–168. doi:10.1109/LWC.2018.2865360
Ruoskanen, J., Eskelinen, P., and Heikkila, H. (2003). Millimeter Wave Radar with Clutter Measurements. IEEE Aerosp. Electron. Syst. Mag. 18, 19–23. doi:10.1109/maes.2003.1244771
Sekine, M., Mao, Y., and Mao, Y. (1990). Weibull Radar Clutter. London, United Kingdom: IEE Radar, Sonar, Navigation and Avionics Series 3, by Peter Peregrinus Ltd., 3.
Skolnik, M. I. (1961). An Analysis of Bistatic Radar. IRE Trans. Aeronaut. Navig. Electron. ANE-8, 19–27. doi:10.1109/tane3.1961.4201772
Storrer, L., Yildirim, H. C., Crauwels, M., Copa, E. I. P., Pollin, S., Louveaux, J., et al. (2021). Indoor Tracking of Multiple Individuals with an 802.11ax Wi-Fi-Based Multi-Antenna Passive Radar. IEEE Sensors J. 21, 20462–20474. doi:10.1109/jsen.2021.3095675
Tan, B., Woodbridge, K., and Chetty, K. (2016). Awireless Passive Radar System for Real-Time through-wall Movement Detection. IEEE Trans. Aerosp. Electron. Syst. 52, 2596–2603. doi:10.1109/taes.2016.140207
Thornburg, A., Bai, T., and Heath, R. W. (2016). Performance Analysis of Outdoor Mmwave Ad Hoc Networks. IEEE Trans. Signal. Process. 64, 4065–4079. doi:10.1109/tsp.2016.2551690
Yildirim, H. C., Determe, J. F., Storrer, L., Rottenberg, F., De Doncker, P., Louveaux, J., et al. (2021). Super Resolution Passive Radars Based on 802.11ax Wi‐Fi Signals for Human Movement Detection. IET Radar, Sonar & Navigation 15, 323–339. doi:10.1049/rsn2.12038
Zavorotny, V. U., Gleason, S., Cardellach, E., and Camps, A. (2014). Tutorial on Remote Sensing Using Gnss Bistatic Radar of Opportunity. IEEE Geosci. Remote Sens. Mag. 2, 8–45. doi:10.1109/mgrs.2014.2374220
Keywords: joint radar communication, stochastic geometry, throughput, bistatic radar, explore/exploit
Citation: Ram SS, Singhal S and Ghatak G (2022) Optimization of Network Throughput of Joint Radar Communication System Using Stochastic Geometry. Front. Sig. Proc. 2:835743. doi: 10.3389/frsip.2022.835743
Received: 14 December 2021; Accepted: 22 March 2022;
Published: 28 April 2022.
Edited by:
Monica Bugallo, Stony Brook University, United StatesReviewed by:
Fabrizio Santi, Sapienza University of Rome, ItalyMilica Pejanovic-Djurisic, University of Montenegro, Montenegro
Copyright © 2022 Ram, Singhal and Ghatak. This is an open-access article distributed under the terms of the Creative Commons Attribution License (CC BY). The use, distribution or reproduction in other forums is permitted, provided the original author(s) and the copyright owner(s) are credited and that the original publication in this journal is cited, in accordance with accepted academic practice. No use, distribution or reproduction is permitted which does not comply with these terms.
*Correspondence: Shobha Sundar Ram, c2hvYmhhQGlpaXRkLmFjLmlu